Article

Investigation on Dynamic Stresses of Pump-Turbine Runner during Start Up in Turbine Mode

State Key Laboratory of Hydroscience and Engineering & Department of Energy and Power Engineering, Tsinghua University, Beijing 100084, China
*
Author to whom correspondence should be addressed.
Processes 2021, 9(3), 499; https://doi.org/10.3390/pr9030499
Submission received: 14 January 2021 / Revised: 6 March 2021 / Accepted: 8 March 2021 / Published: 10 March 2021

Abstract

:
The startup process occurs frequently for pumped storage units. During this process, the rotating rate that changes rapidly and unsteady flow in runner cause the complex dynamic response of runner, sometimes even resonance. The sharp rise of stress and the large-amplitude dynamic stresses of runner will greatly shorten the fatigue life. Thus, the study of start-up process in turbine mode is critical to the safety operation. This paper introduced a method of coupling one dimensional (1D) pipeline calculation and three-dimensional computational dynamics (3D CFD) simulation to analyze transient unsteady flow in units and to obtain more accurate and reliable dynamic stresses results during start up process. According to the results, stress of the ring near fixed support increased quickly as rotating rate rose and became larger than at fillets of leading edge and band in the later stages of start-up. In addition, it was found that dynamic response can be caused by rotor stator interaction (RSI), but also could even be generated by the severe pressure fluctuation in clearance, which can also be a leading factor of dynamic stresses. This study will facilitate further estimation of dynamic stresses in complex flow and changing rotating rate cases, as well as fatigue analysis of runner during transient operation.

1. Introduction

Pumped storage units have great significance to the power grid. Recent years have witnessed the development of new renewable energy sources such as wind and solar. However, both wind and solar are not stable and continuous, causing large oscillation for the load of electrical power grid. Therefore, pumped storage units are required to absorb extra electric energy generated by wind or sun, maintaining the safety and stability of power grid. In addition, pumped storage units can also help solving the problem of frequency modulation, phase modulation as well as peak regulation for their effective storage and flexible switch between turbine mode and pump mode [1]. As the critical component of pumped storage unit, the pump turbine runner may suffer from dynamic stresses, and sometimes cracks at the location of stress concentration. Damages have been reported by many researchers [2,3,4] and may cause a great loss to power station.
The complex and unstable internal flow is one of the main causes of dynamic stresses. Rotor-stator interaction (RSI) is one of the most common phenomena in hydraulic units and has been studied for many years [1,5,6]. For a runner with low specific speed, it is the main reason of dynamic stresses at full load conditions [7]. When working at part load, the vortex rope in draft tube also affects the dynamic stresses of runner. The rate of damage caused by dynamic stresses becomes larger as the load decreases, and at part load it can be 100 times higher than at best efficiency point (BEP) [8]. At some working conditions, the Von-Karman vortex shedding induces the vibration of blades [9]. The S-shaped region of pump turbine has been studied widely and deep understanding is still needed because the flow structure is very complicated. When runner is working in the S-shaped region, the greater static stress and dynamic stress amplitudes can result in earlier occurrence of cracks and fatigue failures. Moreover, the stochastic hydraulic loads tend appear in the S-shaped region, especially at no-load condition [10]. C Mende et al. [11] and JF Morissette et al. [12] suggested that Large Eddy Simulation (LES) turbulence model is a better choice to predict the stochastic pressure fluctuations, and low-frequency events can be captured by one-way fluid structure interaction (FSI) simulation method.
Dynamic stresses in transient processes can lead to more damage to runner than normal working conditions because the hydraulic loads and performance characteristics change rapidly. Many researches focused on the operating mechanism of pump turbine and studied the unstable behavior during transient processes. Rotating stall has been studied both in turbine mode [13,14] and in pump mode [15]. Rotating stall was observed in a reduced scale model at runaway and became more obvious when discharge decreased [16]. The flow separations in several neighboring runner channels caused a stall cell, and backflow and vortices were induced. Several studies [17,18,19,20,21] indicated the vortex appearing in runner and vaneless space is the main reason of dynamic instability in transient process. The vortex varies with time, enhances the pressure fluctuations, and causes some low-frequency components in pressure fluctuations. In addition, Li et al. [22] observed a ring-shaped flow enlaced the vaneless space and blocked the flow during start up in turbine mode. Zuo et al. [23] summarized the stability criteria of the overall system which can evaluate the unstable characteristics of pump-turbine. These unstable behaviors affect the dynamic stresses of runner. The measurements on runner [24] suggested that the static stress and the amplitude of dynamic stress during start-stop are both greater than at normal operating conditions and can cause severe damage to runner.
As described above, the research on dynamic stresses and its influencing factors mainly focused on the normal working conditions. Various studies have discussed the hydraulic excitation and its unsteady and complex characteristics in transient process. However, only a few papers have dealt with its influence on dynamic stresses of runner, especially in the transient process. Furthermore, other factors such as rotating rate and flow in clearance were rarely mentioned.
In this paper, the dynamic stresses of a pump-turbine runner during start up are analyzed using FSI method. The hydraulic loads during start up are obtained from computational fluid dynamics (CFD) simulation, with one dimensional (1D) pipeline calculation providing the boundary conditions. The paper initially discusses the effects of rotating rate, torque of runner, and the axial force. Then, the dynamic stresses are analyzed not only from viewpoint of the RSI but also under angle of the severe pressure fluctuation in clearance. This study can provide a better understanding to the dynamic response of runner under complex external excitation.

2. Numerical Method

2.1. Sturctural Governing Equations

The dynamic response of structure can be solved using finite element method (FEM). The matrix formulation of the governing equations can be expressed as
[ M ] { u ¨ } + [ C ] { u ˙ } + [ K ] { u } = { F s }
where [ M ] , [ C ] , and [ K ] represent for structure mass matrix, damping matrix and stiffness matrix, respectively, { F s } is the load vector and { u } is the displacement vector.
Normally, the Von-Mises equivalent stress σ e q u is used to evaluate the stress characteristics of runner. It can be expressed as
σ e q u =   1 2 [ ( σ 1 σ 2 ) 2 + ( σ 2 σ 3 ) 2 + ( σ 3 σ 1 ) 2 ]
where σ 1 ,   σ 2 ,   and   σ 3 represent for first, second and third principal stress, respectively.

2.2. 1D Pipeline Governing Equations

The flow in pipeline can be simplified into one dimensional flow and solved by method of characteristics (MOC). The continuity equation and momentum equation are
V H x + H t V sin α + a 2 g V x = 0
g H x + V V x + V t + f V | V | 2 D = 0
where V is the average velocity at cross section, H is piezometric head, α is the angle between center line of pipe and horizontal line. a is wave speed, g is gravity acceleration, f is Darcy–Weisbach friction factor, D is the pipe diameter.
Other components in hydraulic system such as surge tank and pipe with branches can also be simplified and solved.

2.3. CFD Governing Equations and Turbulence Model

The flow in the unit is assumed as three-dimensional incompressible unsteady flow. According to the Reynolds averaged theory, the governing equations are described as follows:
u i ¯ x i = 0
u i ¯ t + u j ¯ u i ¯ x j = F i 1 ρ p ¯ x i + ν 2 u i ¯ x i x j x j ( u i u j ¯ )
where u is velocity, p is pressure, F is body force, ρ is density, and ν is kinematic viscosity. Turbulence model is needed to close the equations above. In this paper, the Shear-Stress Transport (SST) k-ω model is used to calculate the turbulence in pump-turbine.

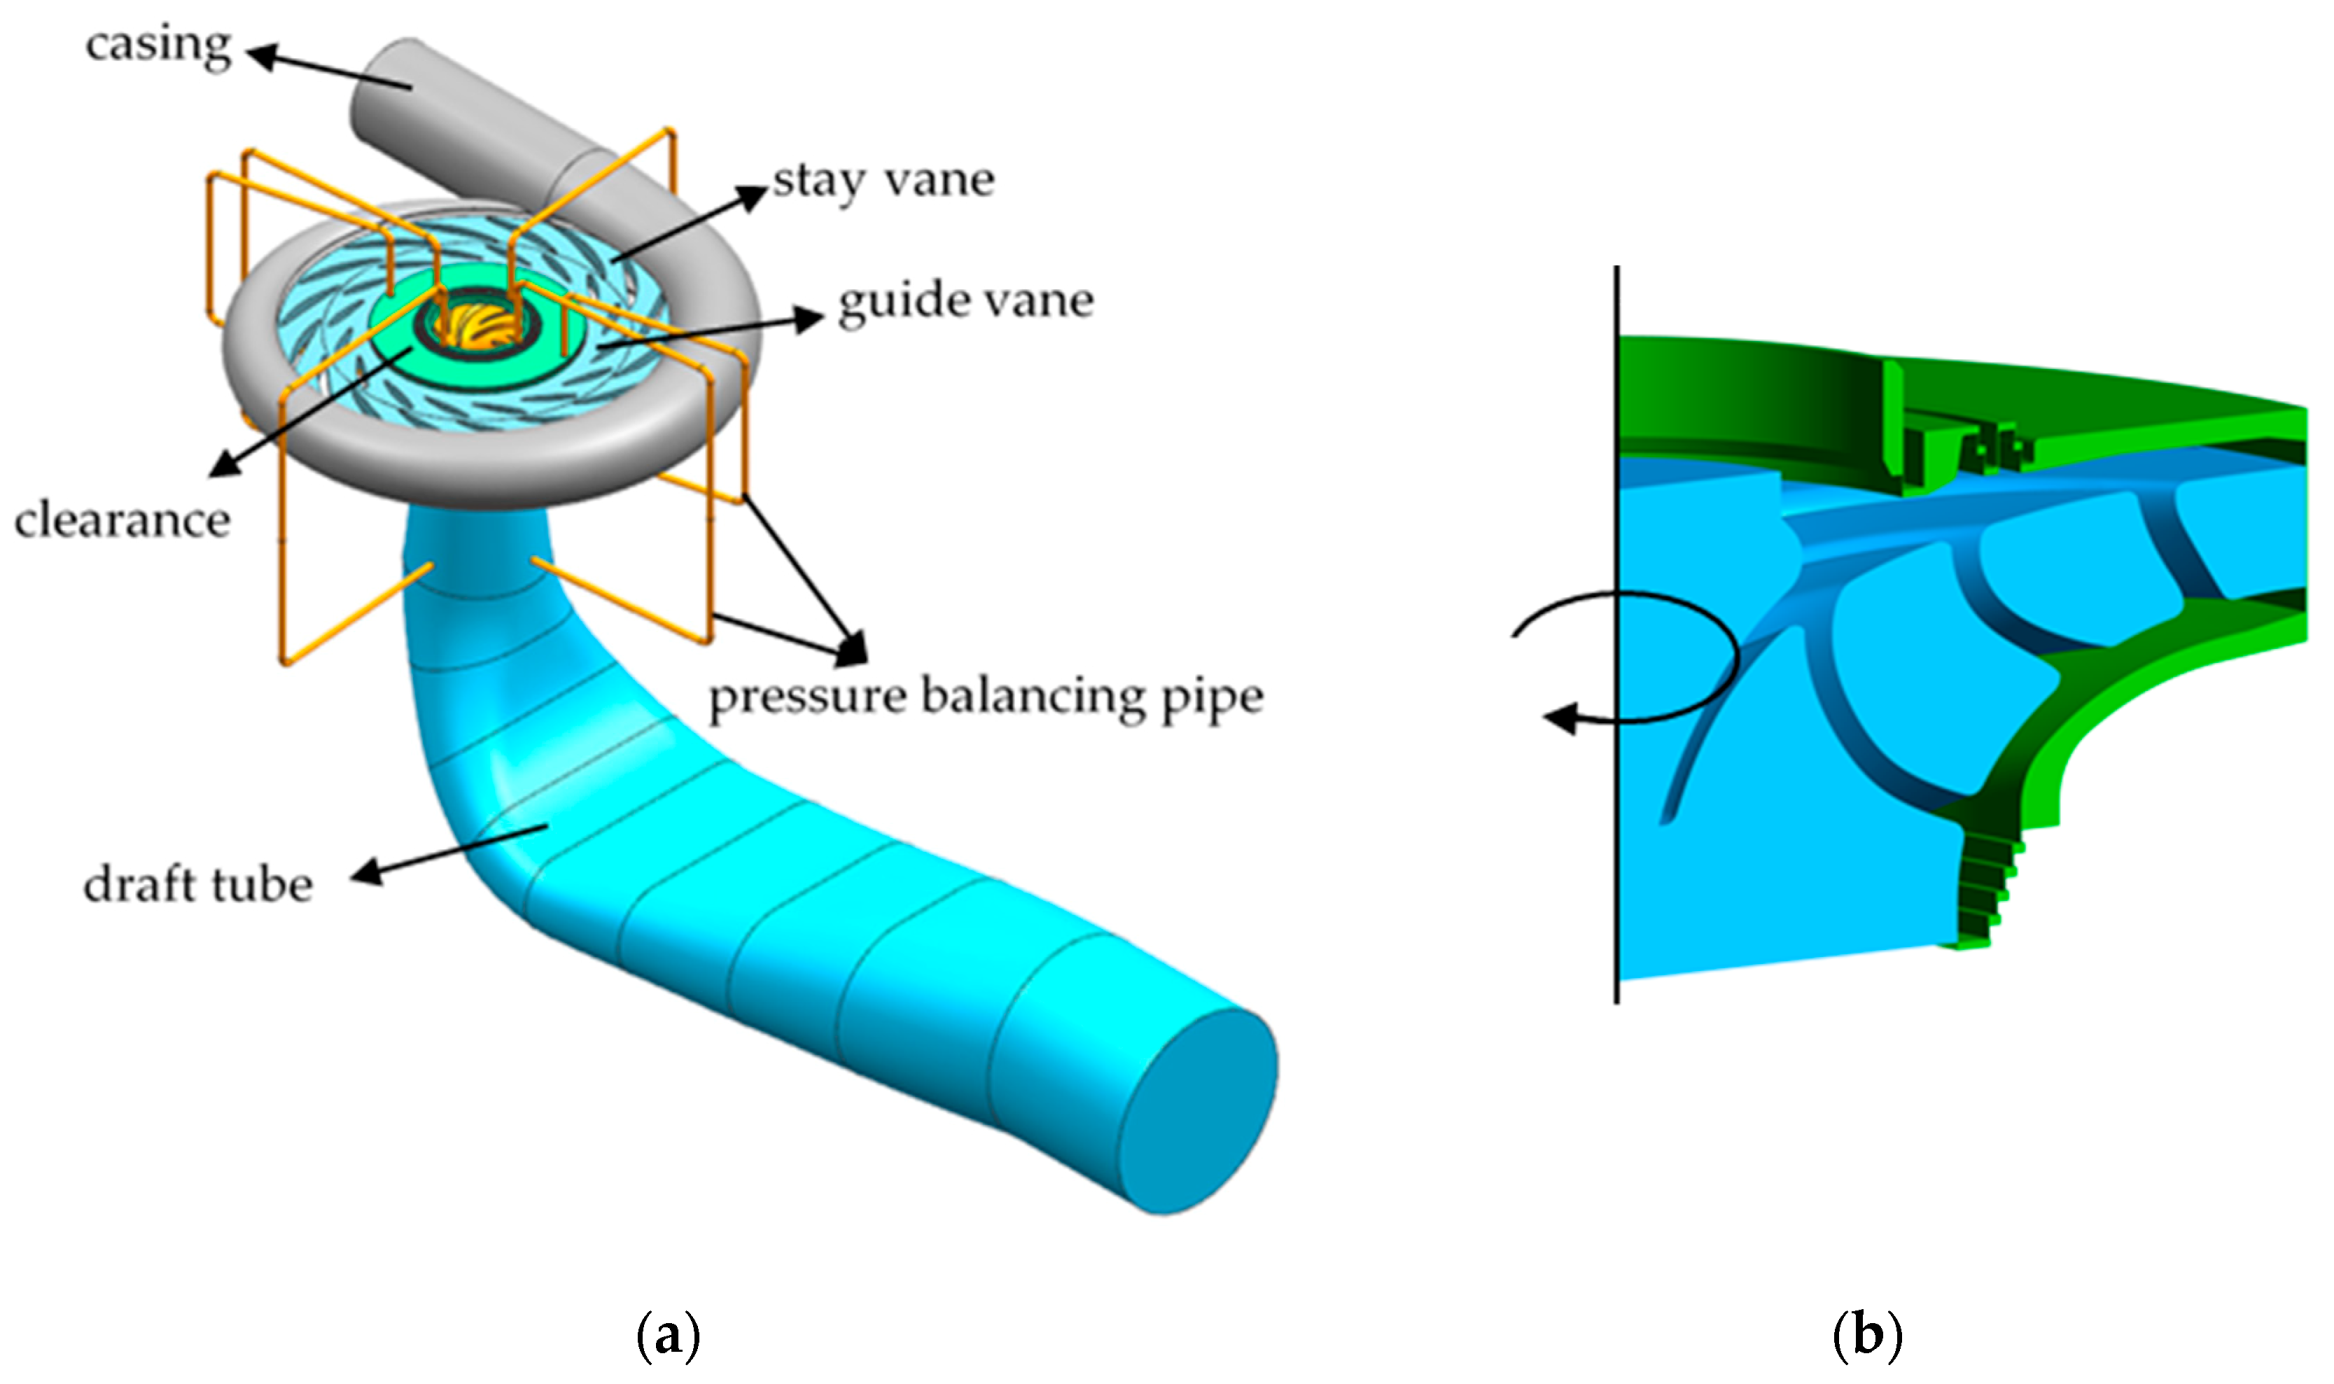
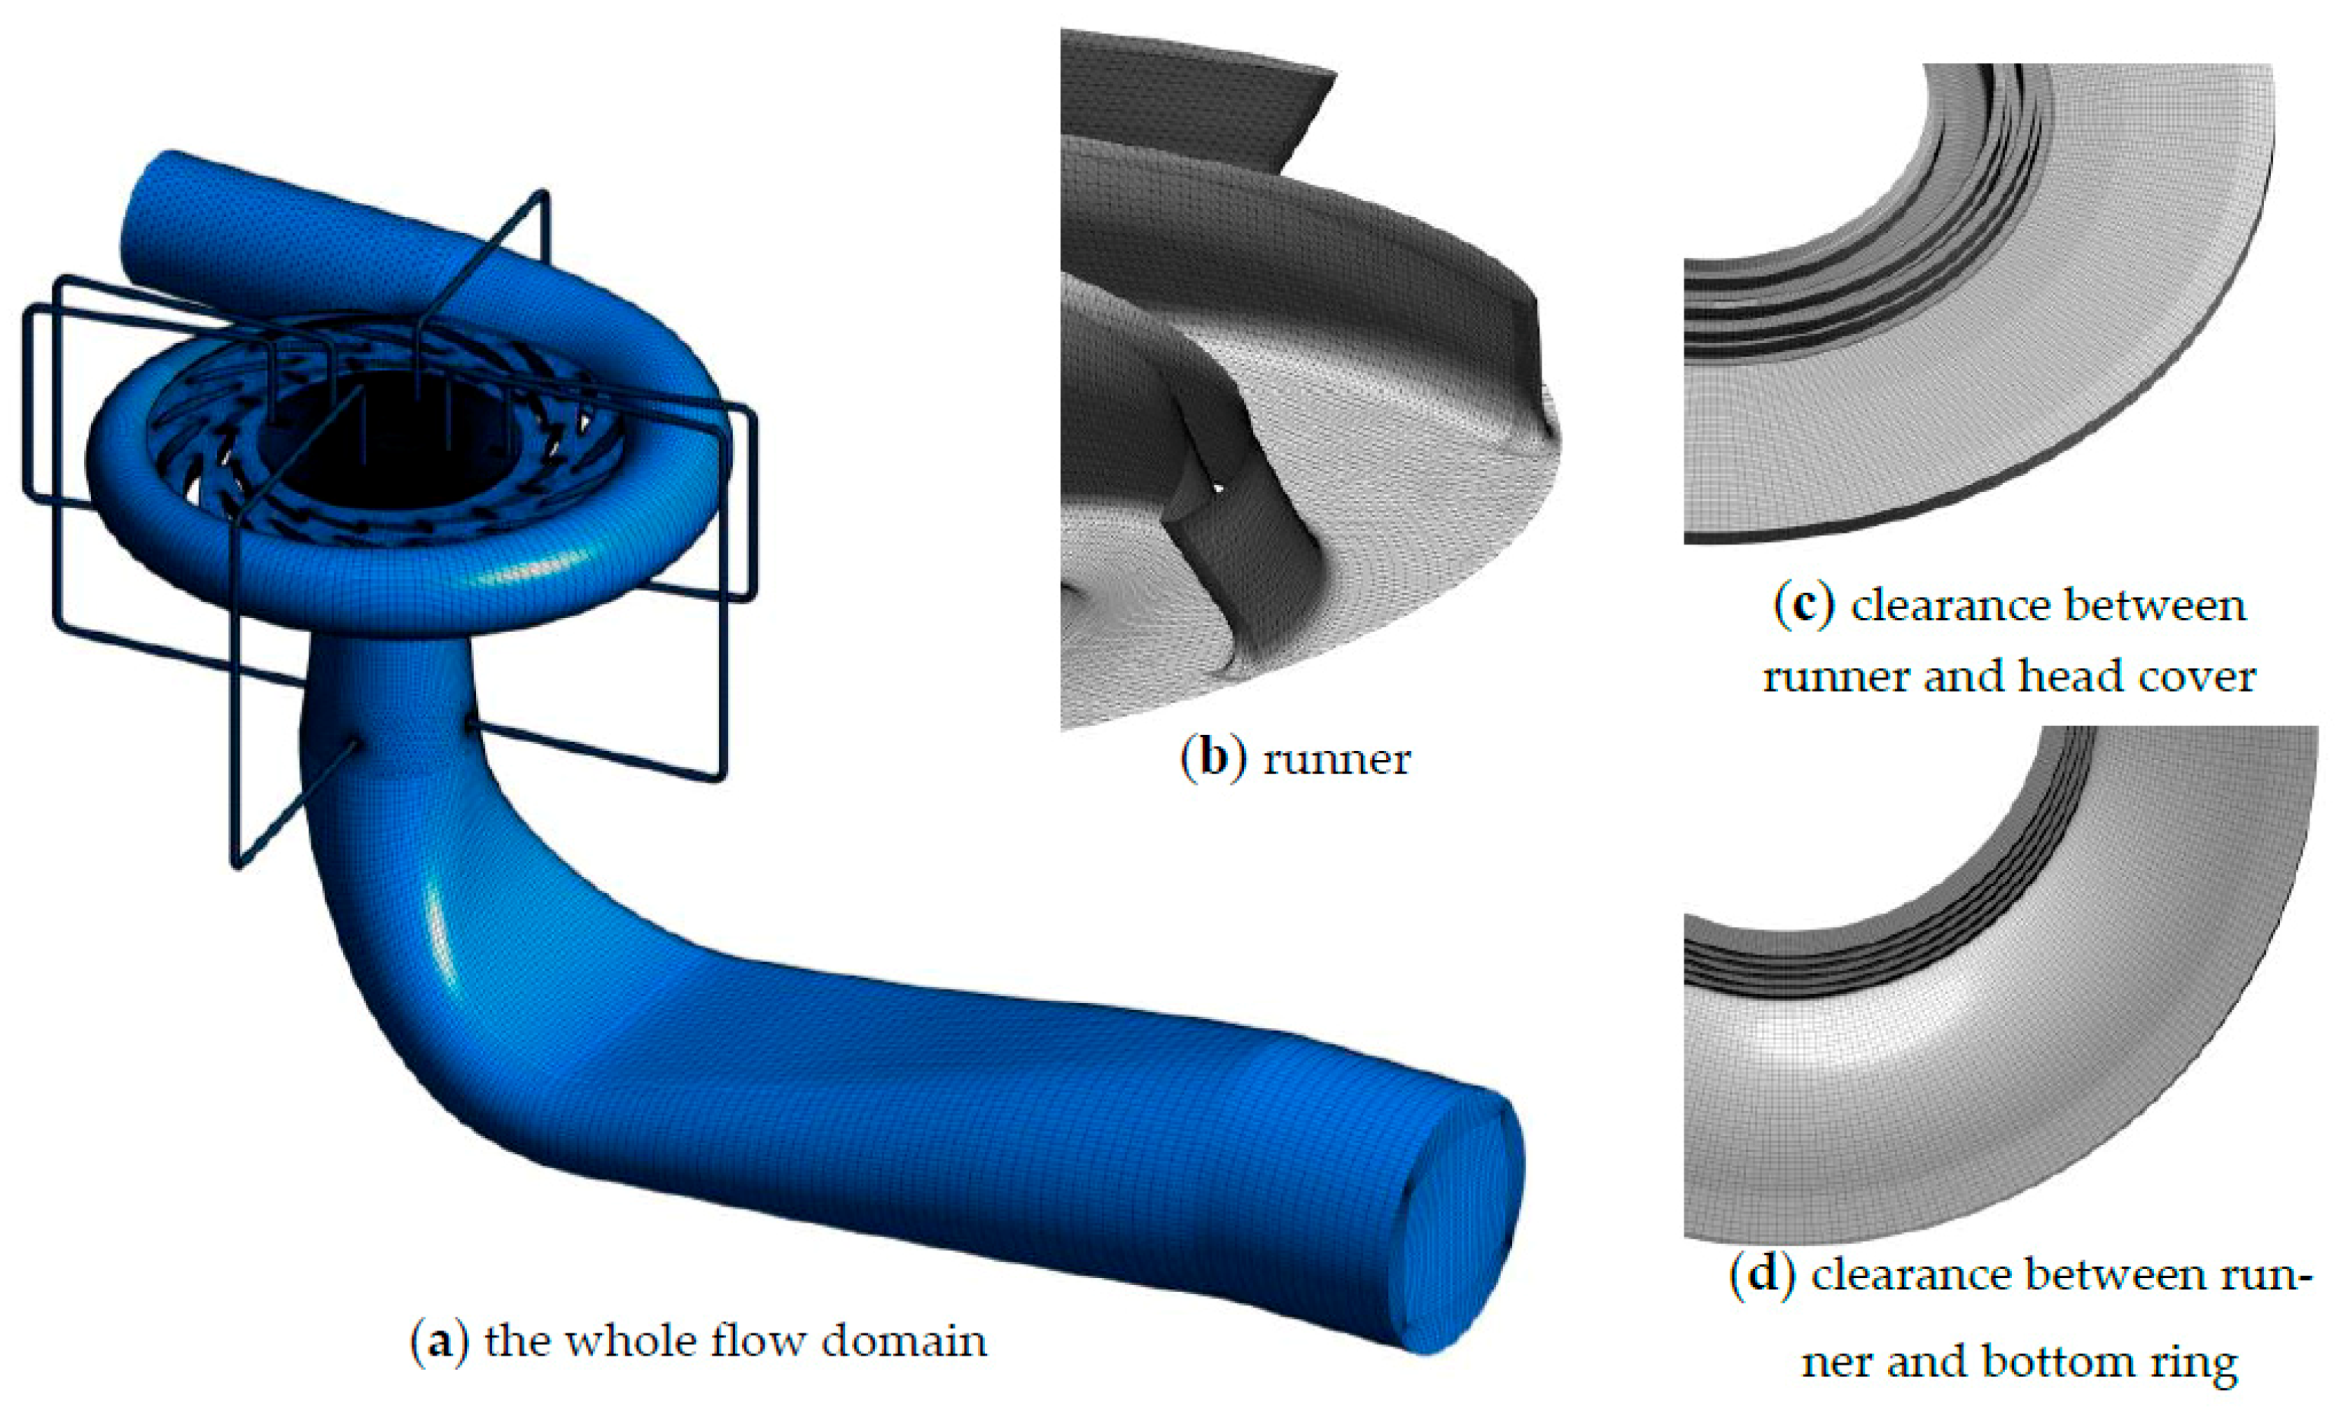
3. Calculation Model and Boundary Conditions

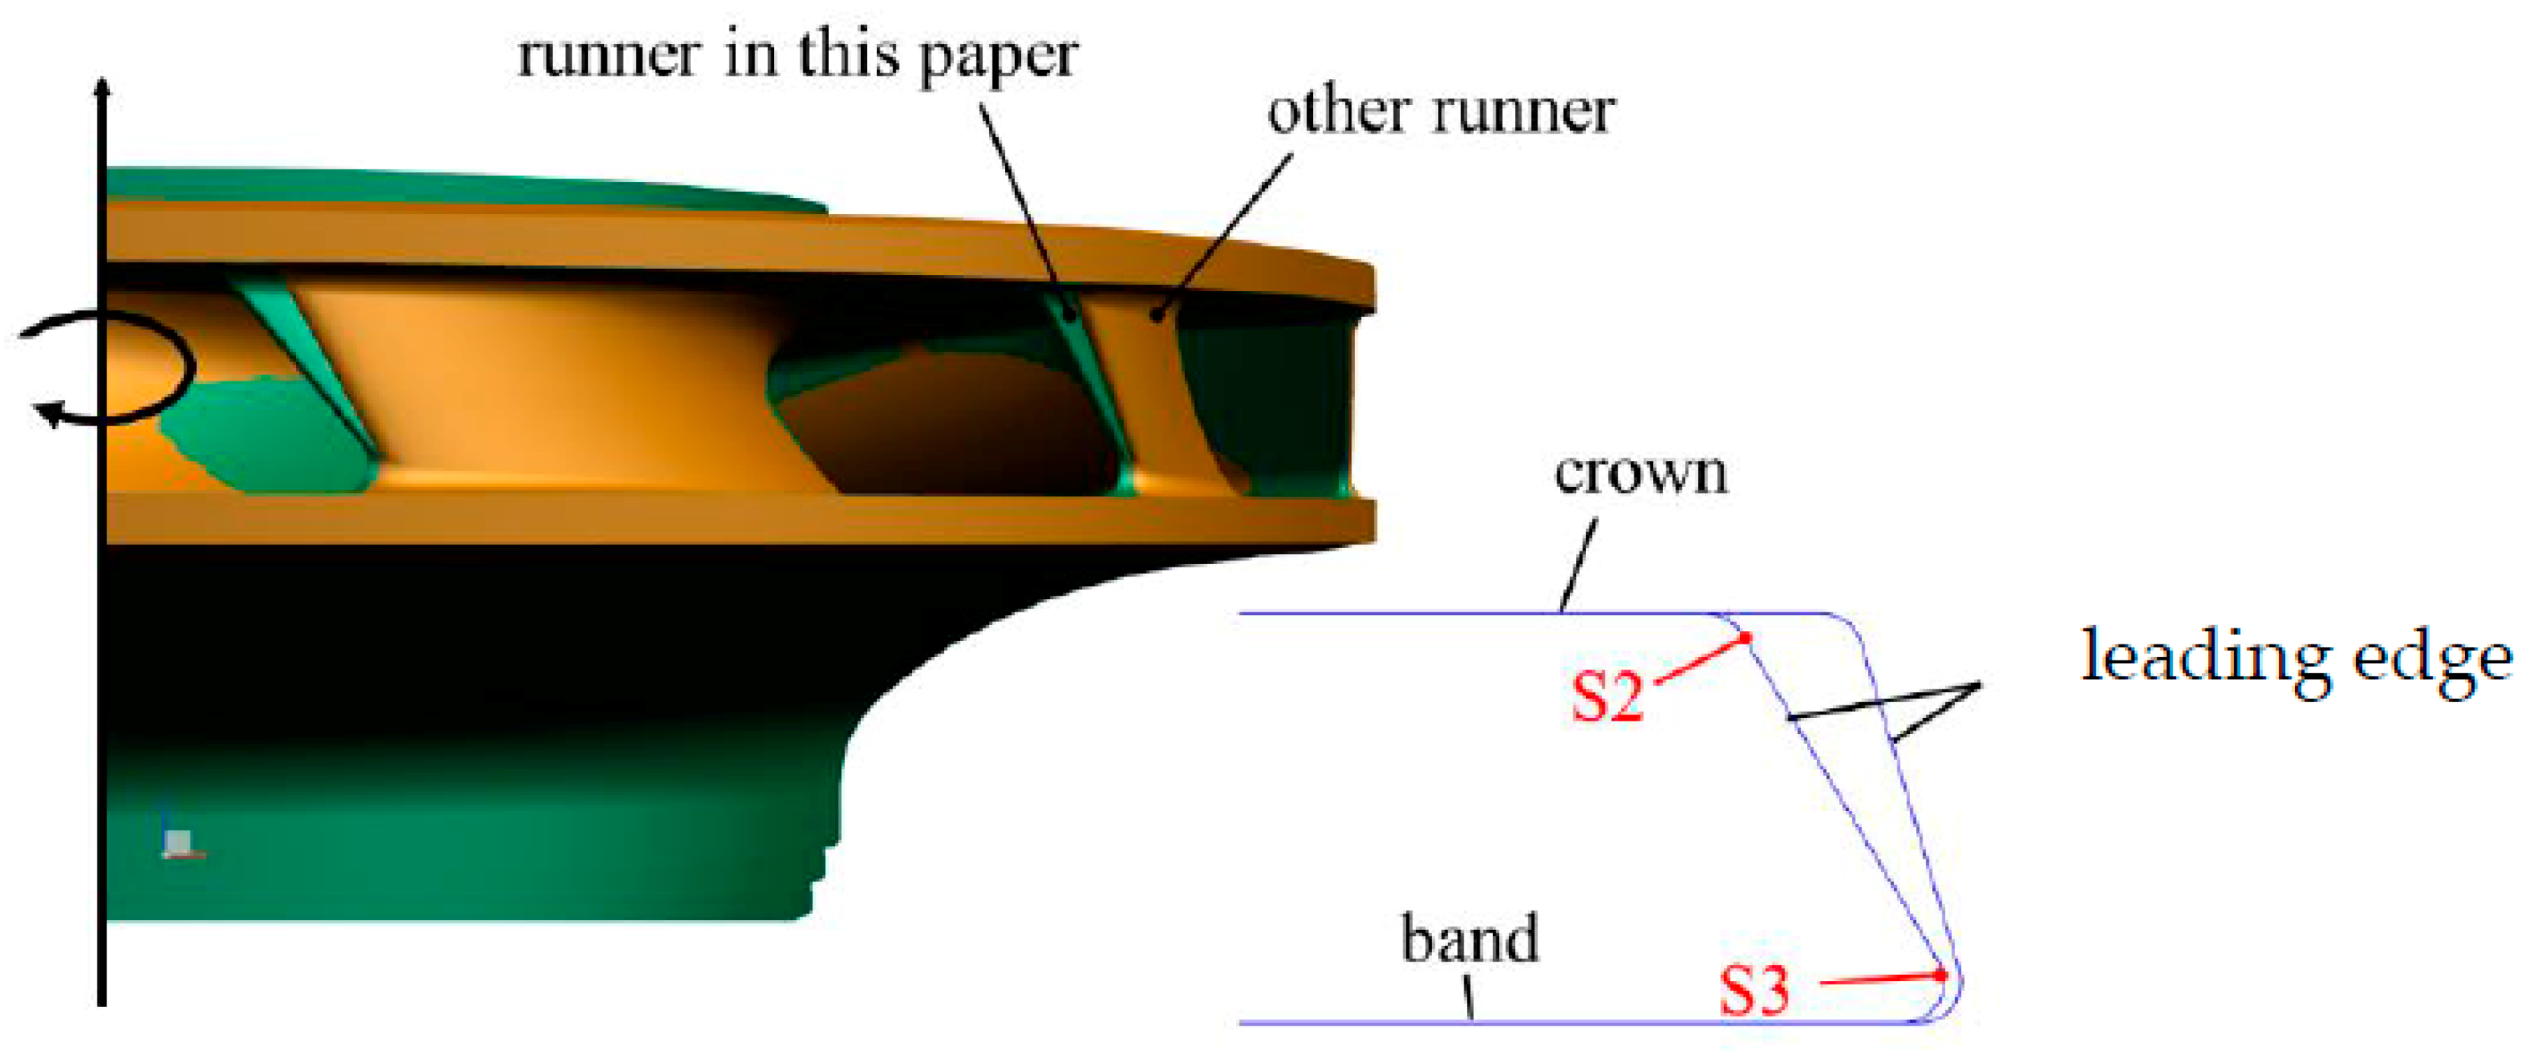
3.1. The Pump-Turbine Runner

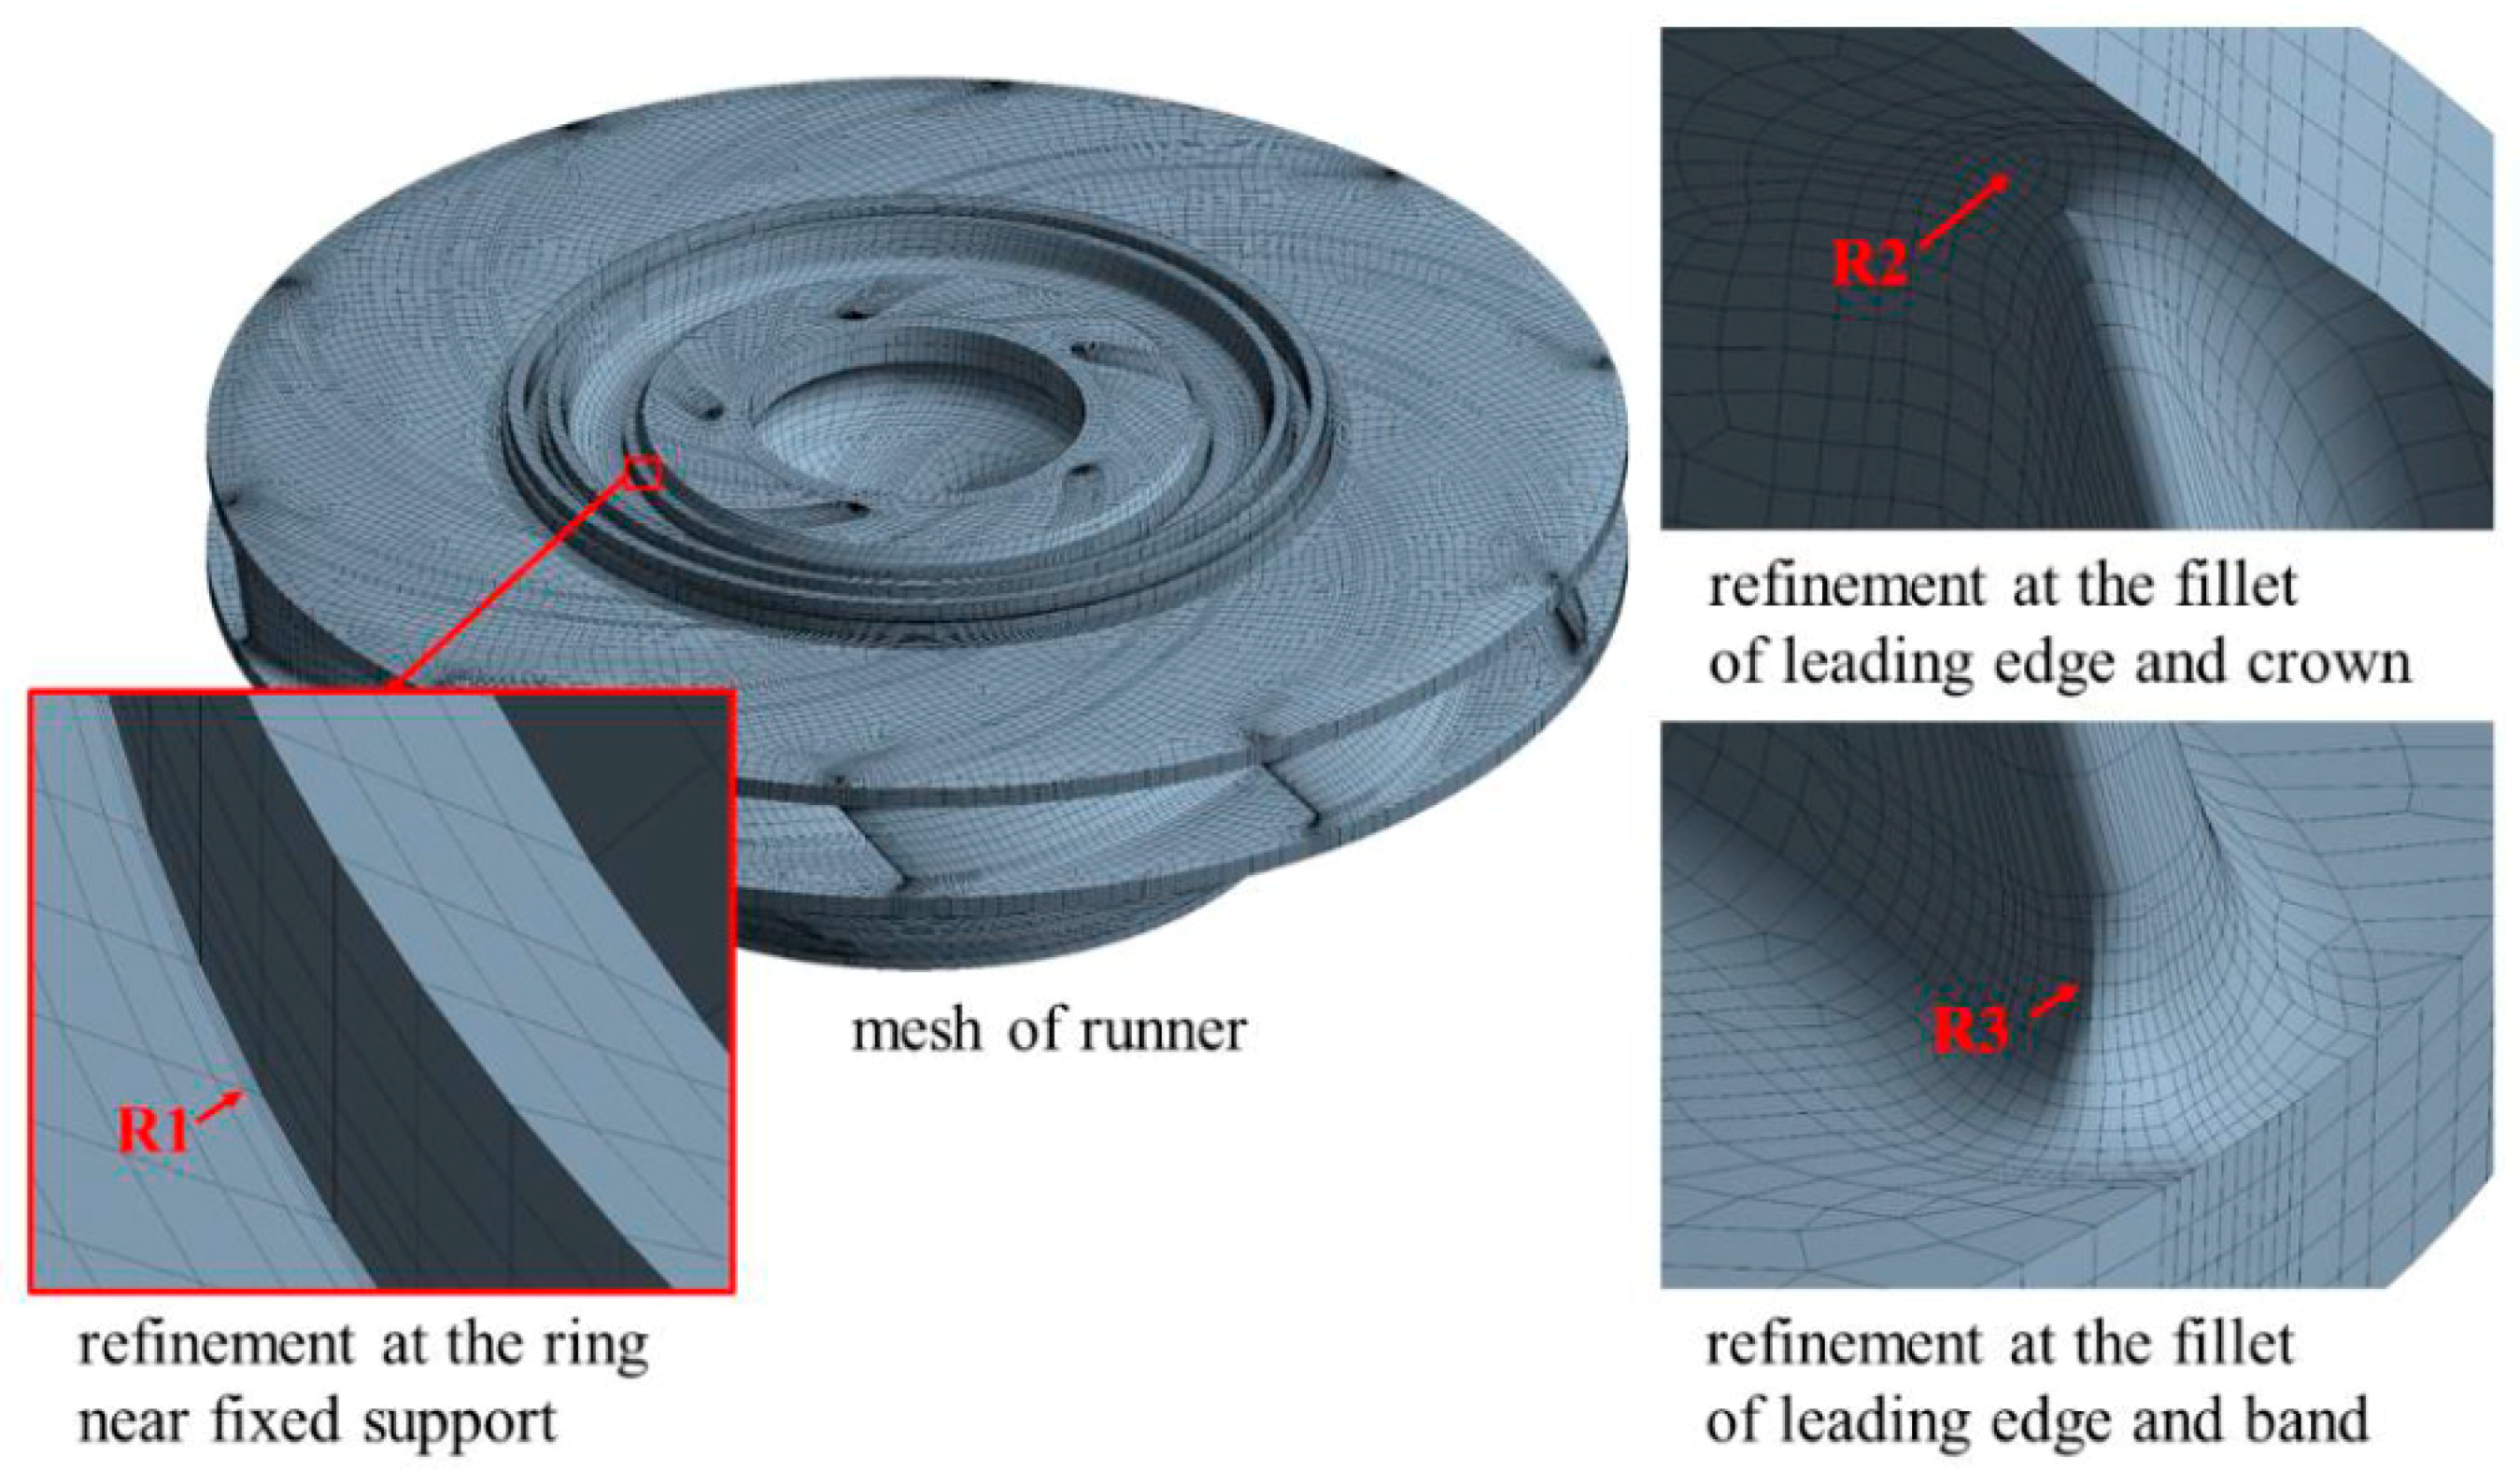
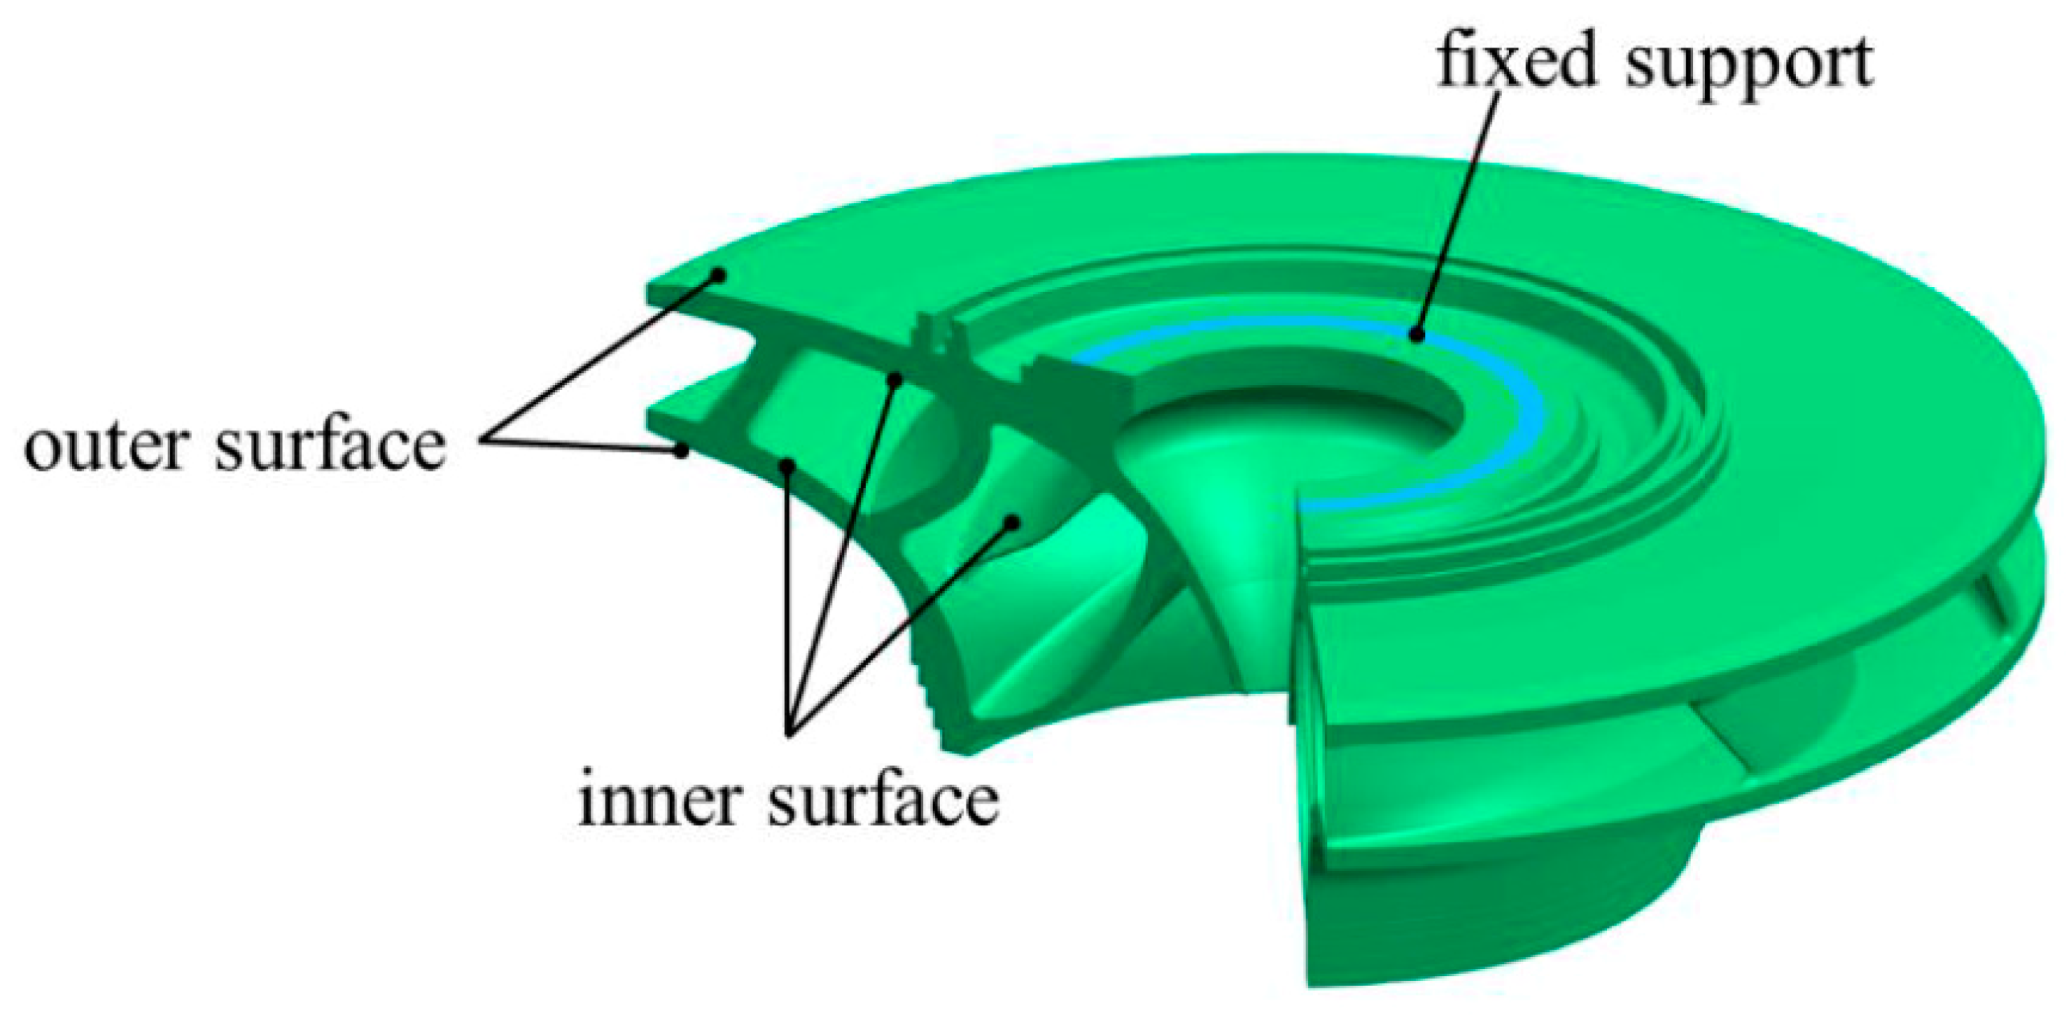
3.1.1. The Finite Element Model

The runner has 5 main blades and 5 splitter blades with the inlet diameter of 4.3 m and outlet diameter of 2.125 m. The runner is made of stainless steel. The Young’s modulus is 2.1 × 10¹¹ Pa, Poisson’s ratio is 0.3 and density is 7850 kg/m3.
The finite element model of runner is shown in Figure 1. Most of the meshes are hexahedral and in regions of low stress gradients, some wedges are used. Refinements are made at the stress contribution regions, as shown in Figure 1.

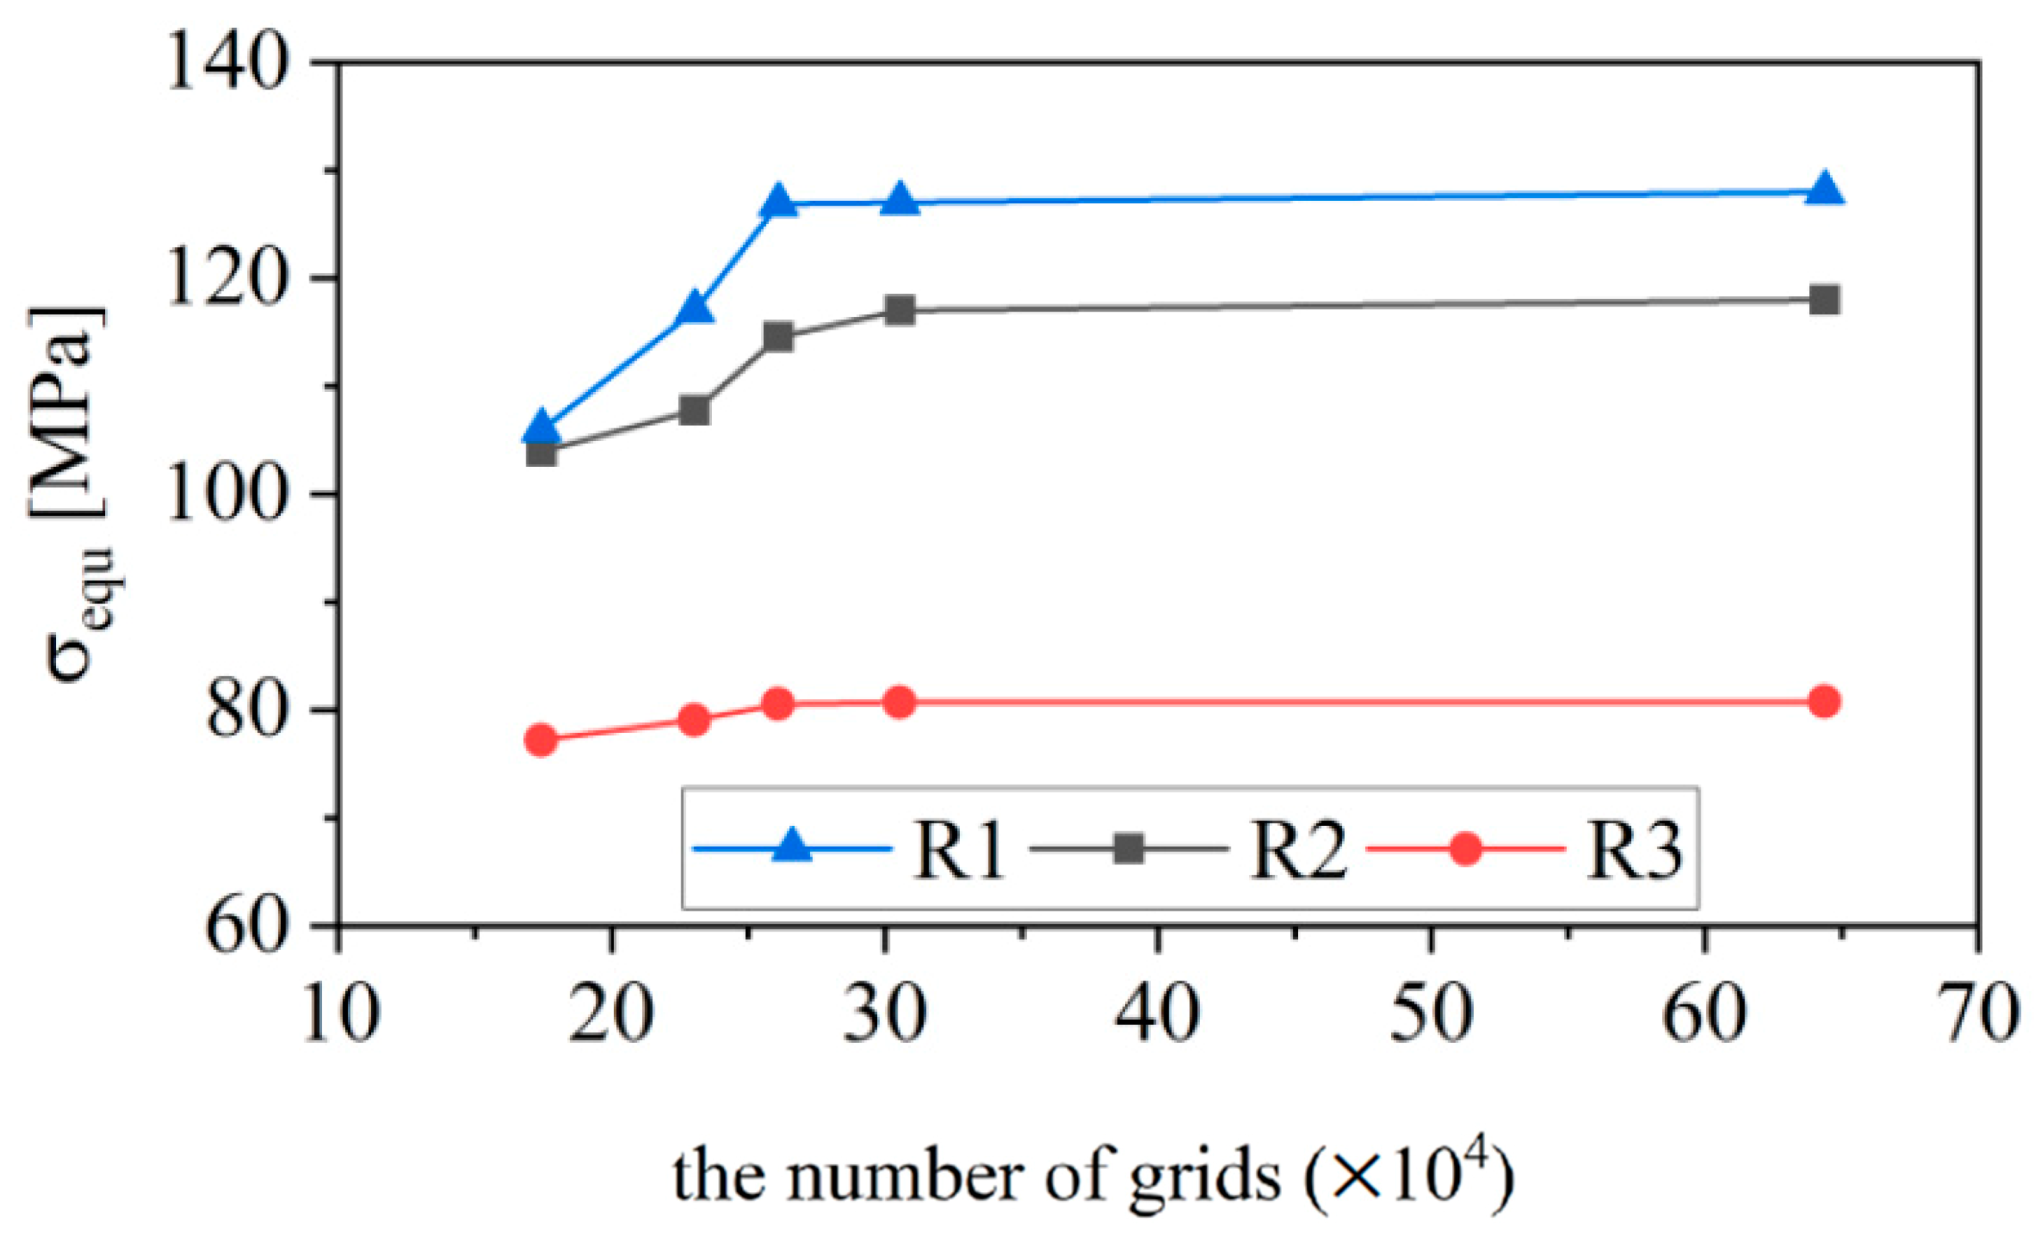
3.1.2. Mesh Independency Check

The calculation grids were checked with gravity and centrifugal force acting on the runner. The results shown in Figure 2 indicate that the grid with 305,505 nodes is enough for this calculation. This mesh was used in the following analysis.
It is worth noting that besides the fillets of leading edge, a ring near fixed support is also the stress concentration area and suffers from higher stress than other parts. On one hand, the centrifugal force of whole runner results in a bending moment acting on the ring. On the other hand, the geometry changes suddenly at the corner of ring without any fillets for transition and, thus, concentrates the stress sharply. Stress singularity appears at the nodes closest to the corner. Fillets with 5–20 mm radius can help reduce the stress singularity but cannot eliminate it. Thus, the results of nodes closest to the corner were ignored. Node with the convergence stress (node R1 in Figure 1) was chosen in mesh independency check and in the following analysis.

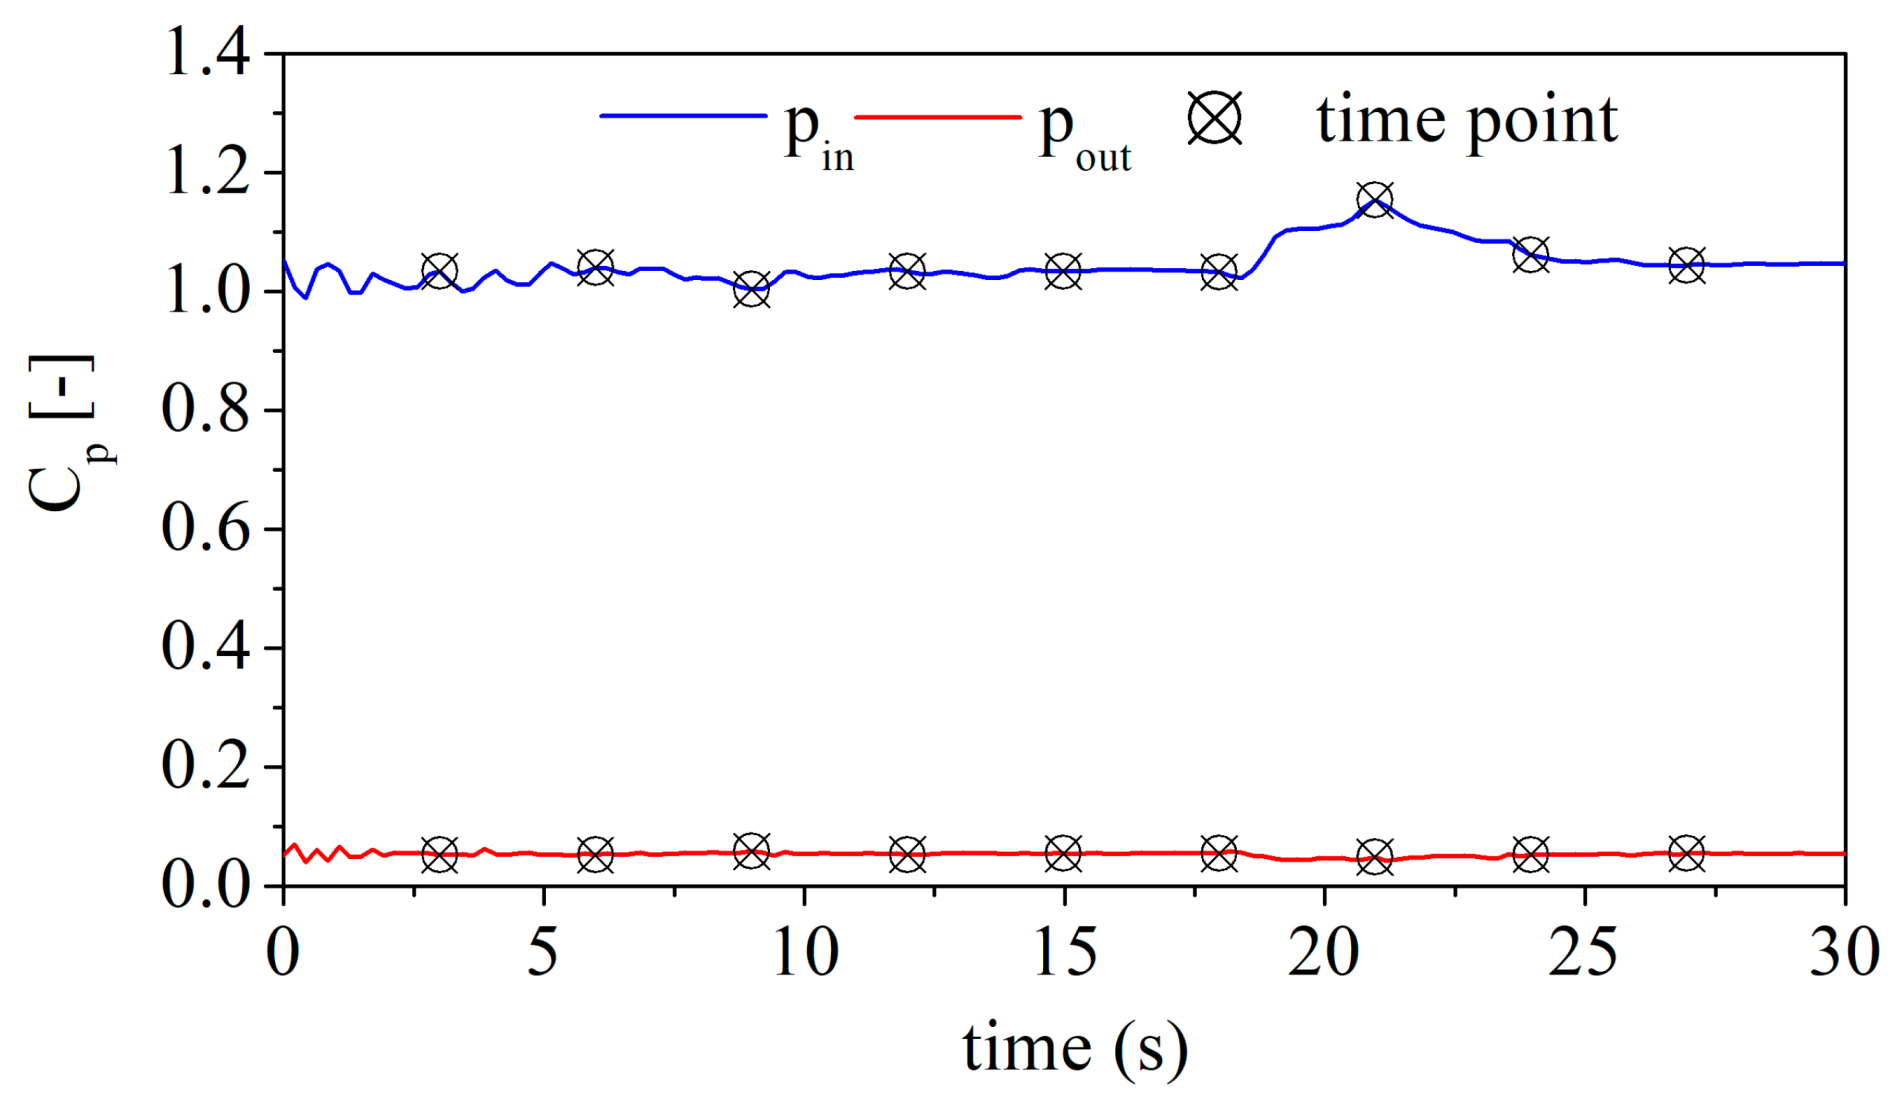
3.1.3. Boundary Conditions

Fixed support is defined at area where bolts connect the shaft and runner. The loads of runner include gravity acceleration, centrifugal force and hydraulic loads. The rotating rate is changed over time during start-up process. Therefore, the centrifugal force is different at different time. The hydraulic loads on both inner surface and outer surface can be obtained from CFD simulation, as shown in Figure 3. In traditional FSI simulation, only loads on inner surface are considered. However, the loads on outer surface also have a great influence on the stress-state of runner [25] and were considered in this paper.

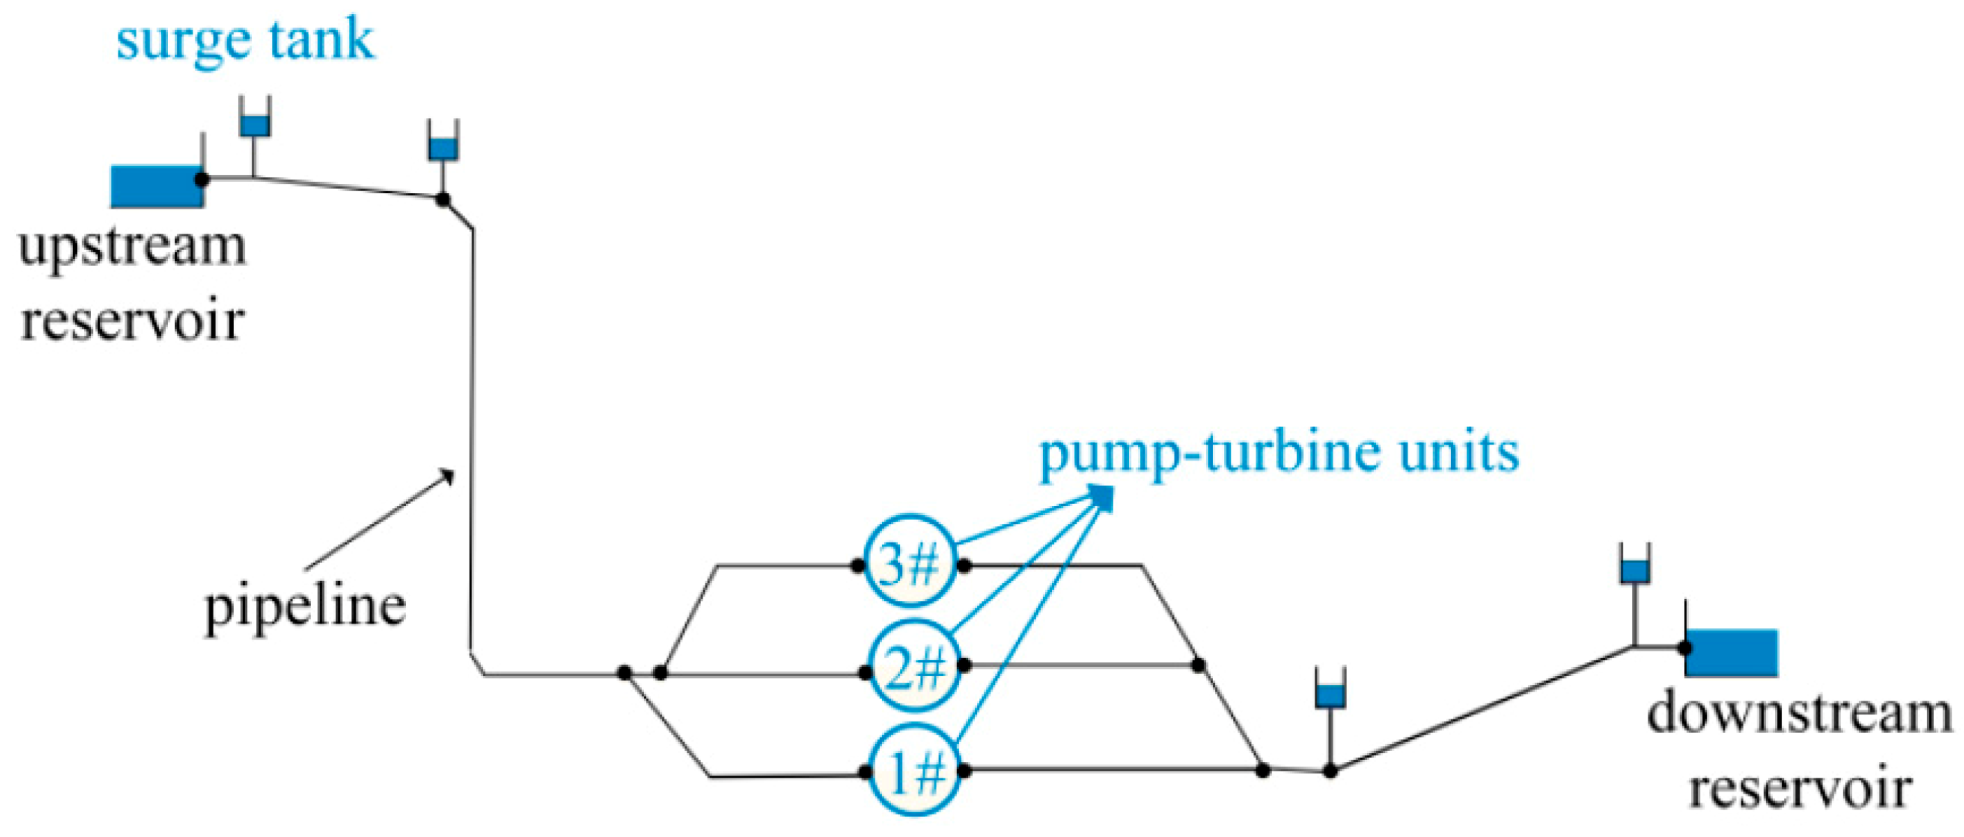
3.2. The Hydraulic System of Pump Storage Station

The considered hydraulic system consists of reservoirs, surge tanks, tunnels, pipelines, pump turbine units, and valves. The diagram of the hydraulic system is shown in Figure 4. The layout of three units with one diversion tunnel is adopted. The total length of the pipeline is more than 3.6 km. Surge tanks are placed at the upstream and downstream to reduce the rapid change of pressure caused by water hammer.
In this paper, the start-up process of 1# unit is the major concern. The other 2 units operate at normal condition and suffer small fluctuations induced by the start-up of 1# unit. The water level is 762.1 m at upstream reservoir and 98.0 m at downstream reservoir and assumed to remain constant during start up process. The guide vane opens with the rate of 0.48 degrees per second until the rotating rate reaches rated value, then speed controller begins to work and controls the guide vane opening angle.

3.3. Pump-Turbine Unit

The internal flow of casing, stay vane, guide vane, runner, and draft tube can be simulated as three-dimensional (3D) turbulent flow. The unit is shown in Figure 5. In order to provide complete hydraulic loads of runner, the labyrinth seals and clearances around runner are also considered. The rated head of the unit is 653 m. There are 16 guide vanes and the maximum opening degree is 24°.
The flow domain was discretized by tetrahedral mesh and hexahedral mesh. The total number of nodes is 4,643,402 and the number of elements is 9,737,666. The domain of runner has 1,171,402 nodes and the clearance has 1,771,714 nodes. In the region of high stress gradient, the size of mesh cells in CFD analysis is similar to that in FEM analysis. The mesh is shown in Figure 6.
The internal flow of the pump-turbine unit at typical time points was calculated, as shown in Table 1. Figure 7 shows the boundary conditions of CFD method. In this paper, the relative pressure coefficient C p is defined as
C p = p   P r e f ρ g H
where p is pressure, P r e f is the pressure at the end of downstream pipeline, H is the rated head. In Figure 7, Pin is total pressure coefficient at casing inlet, and Pout is static pressure coefficient at draft tube. These are calculated though 1D MOC and used as inlet and outlet boundary conditions of 3D CFD. All walls are set as no-slip walls. The domain of runner and clearances are rotating domains. The model of interface between rotating domain and stationary domain is set as transient rotor-stator to simulate the RSI phenomenon. The unsteady calculation is conducted with steady simulation result as initial guess. The number of timesteps is 300 in each revolution. In addition, the pressure-based solver is used in this study. Second-order accuracy is used for the pressure equation and second-order upwind discretization for other convection-diffusion equations.

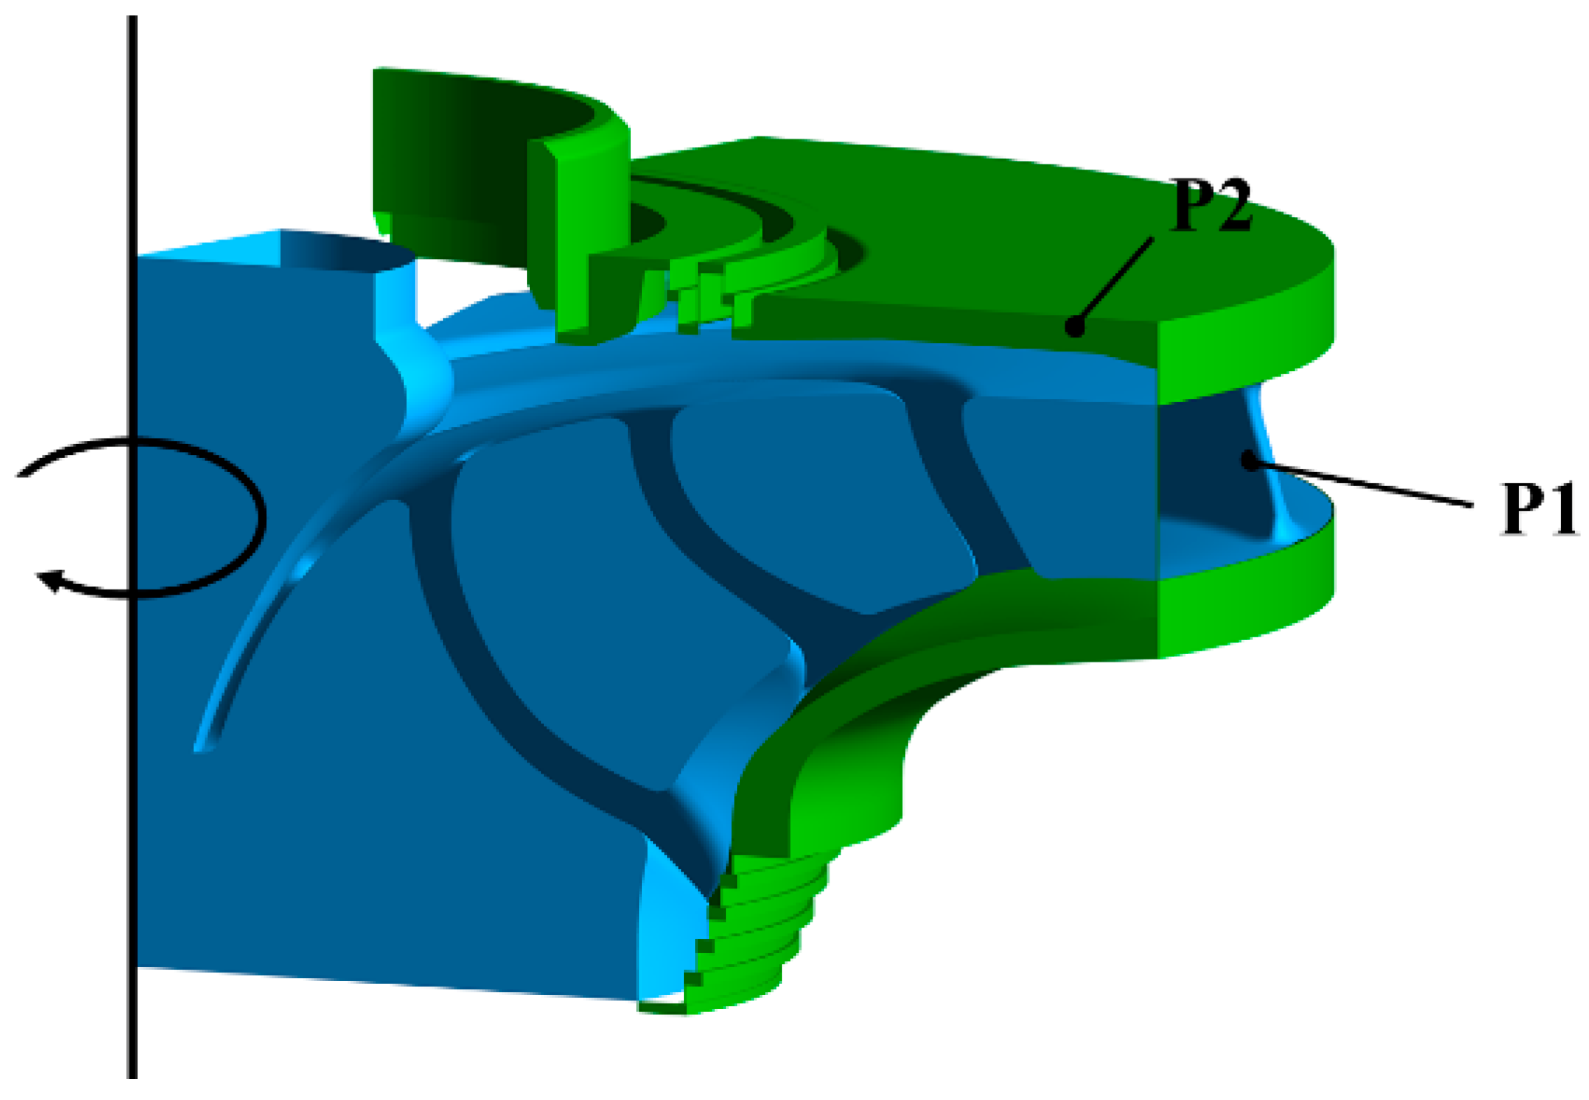
3.4. The Structure-Fluid Coupling Model

In this study, the influence of 3D flow on the dynamic response of runner is analyzed by one-way FSI simulation method, which is calculated using a coupling of Fluent and ANSYS Mechanical. The coupling process is as follows.
First, the Fluent simulation is conducted. The hydraulic loads at each step are obtained.
Second, the data transfer is performed manually. Pressure from the cell zones of Fluent simulation can be mapped onto locations associated with the ANSYS Mechanical mesh by using an interpolation method provided by ANSYS (ANSYS, Inc., Pittsburgh, PA, USA). Many FSI simulations require strict match at the interface of CFD grid and structural grid, which increases the complexity of meshing, and may cause a too fine mesh in modeling the dynamic stresses of runner. The interpolation method effectively avoids this problem.
Third, the ANSYS Mechanical simulation is performed, and the timestep is the same with CFD calculation.

4. Results and Discussion

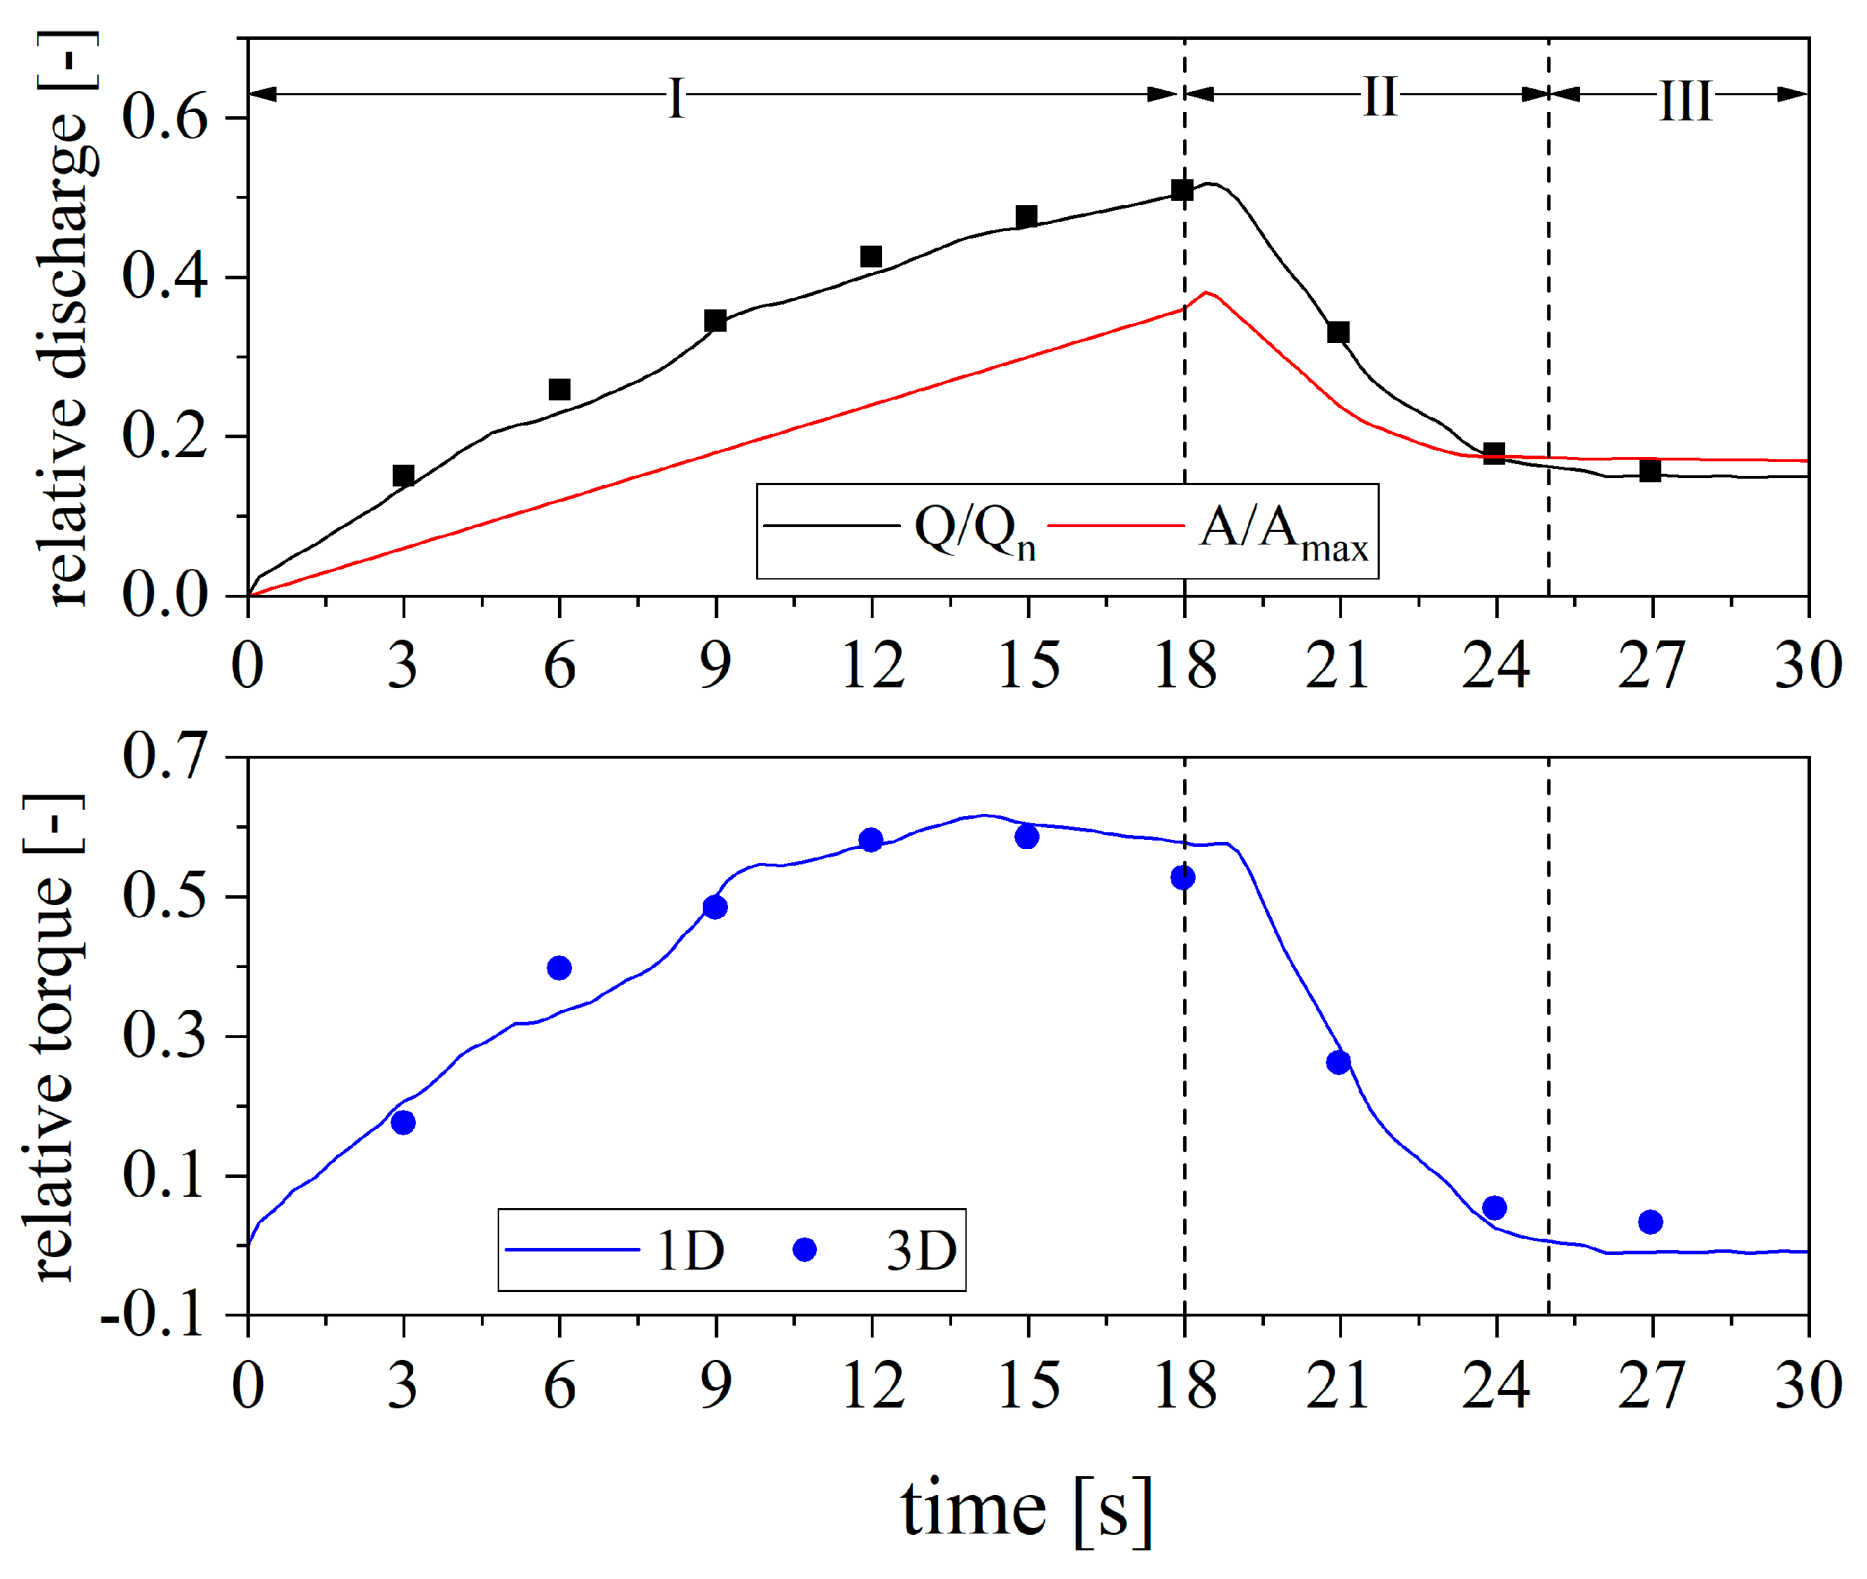
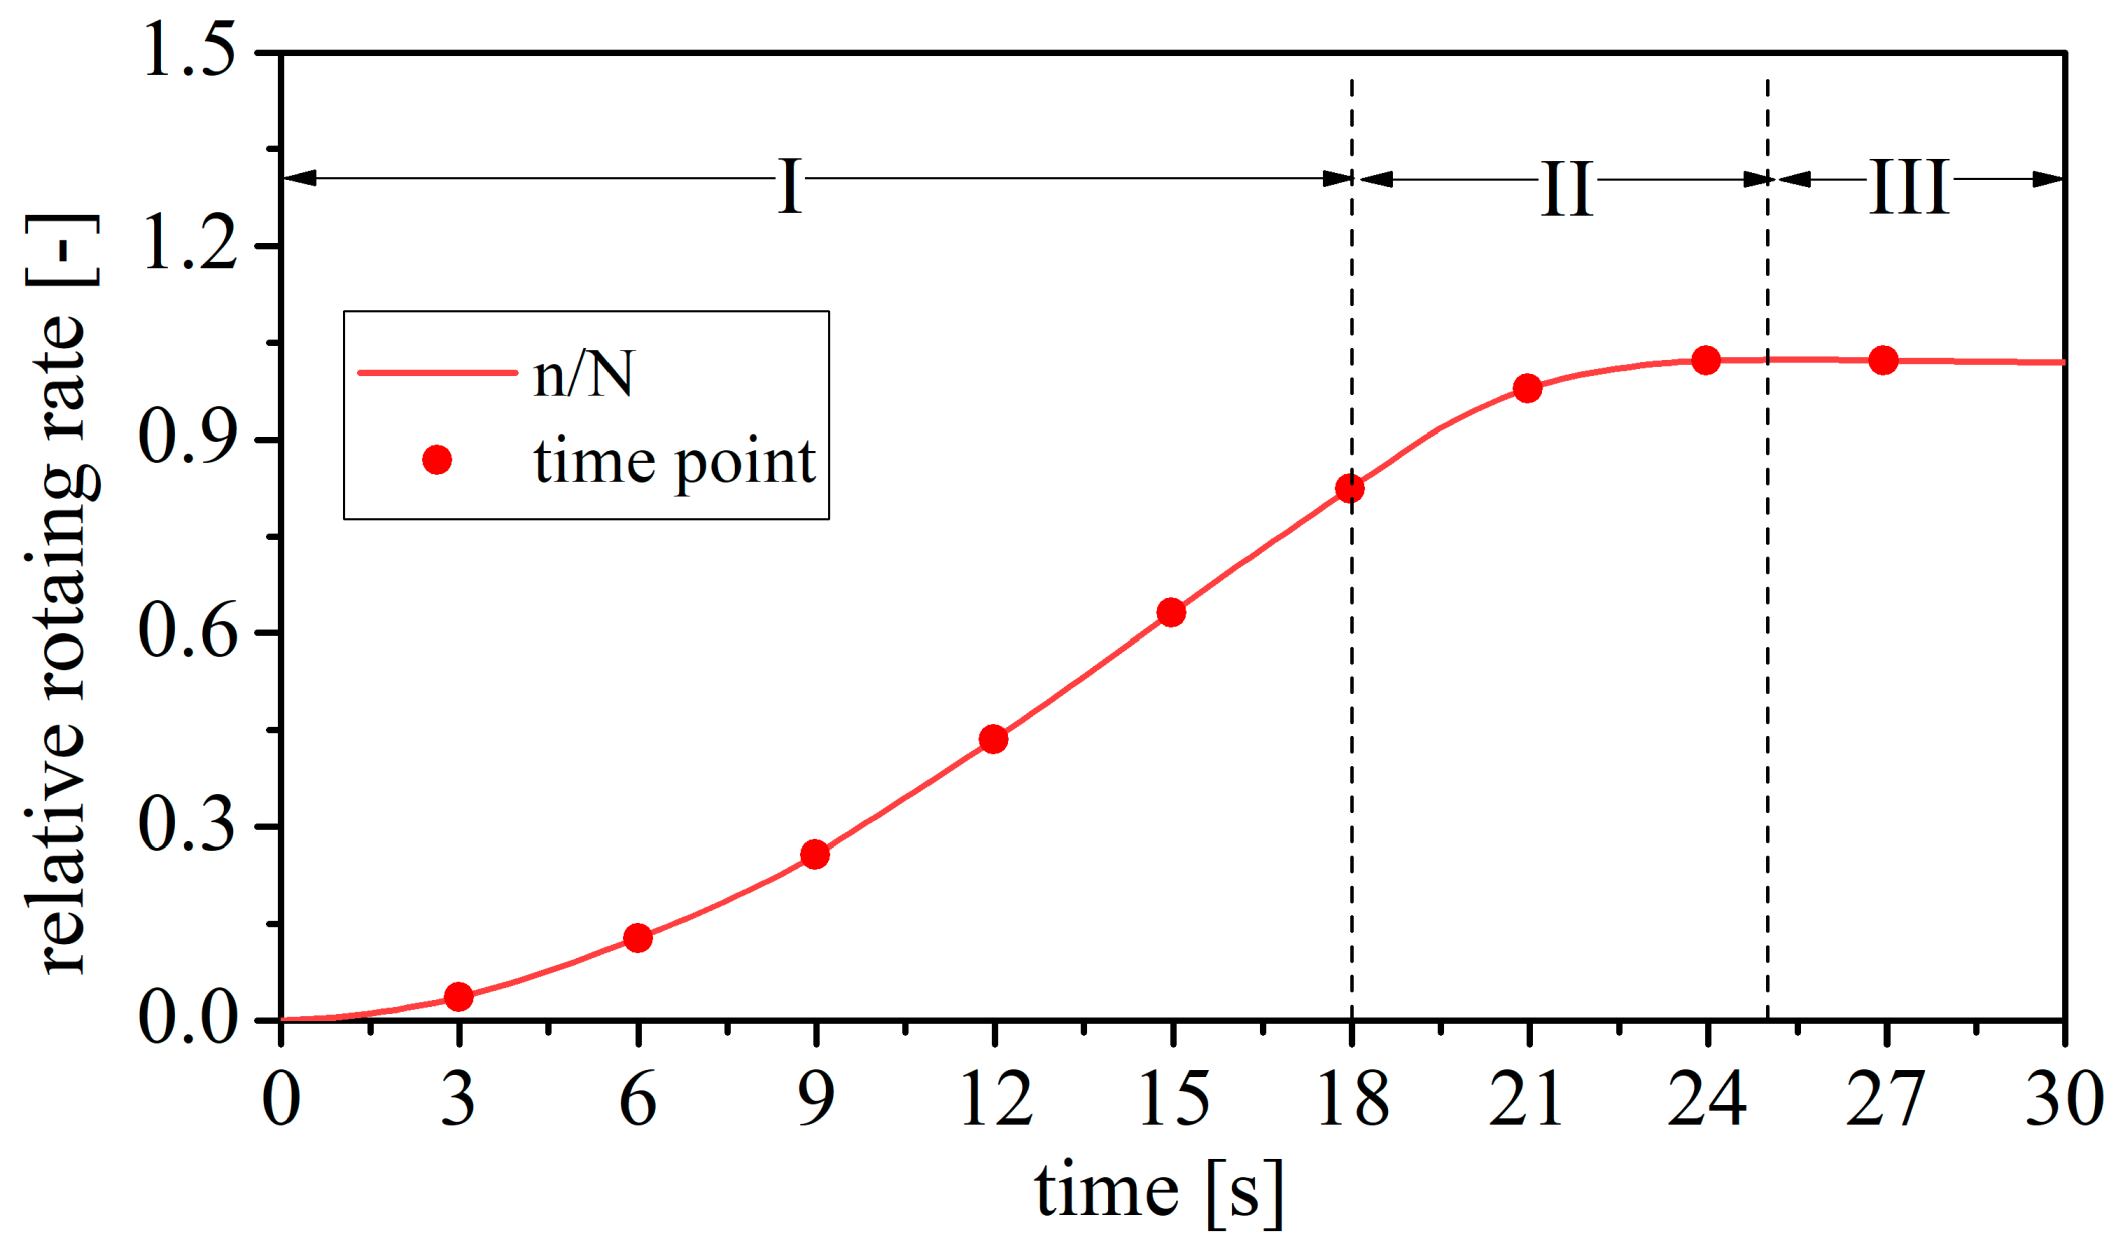
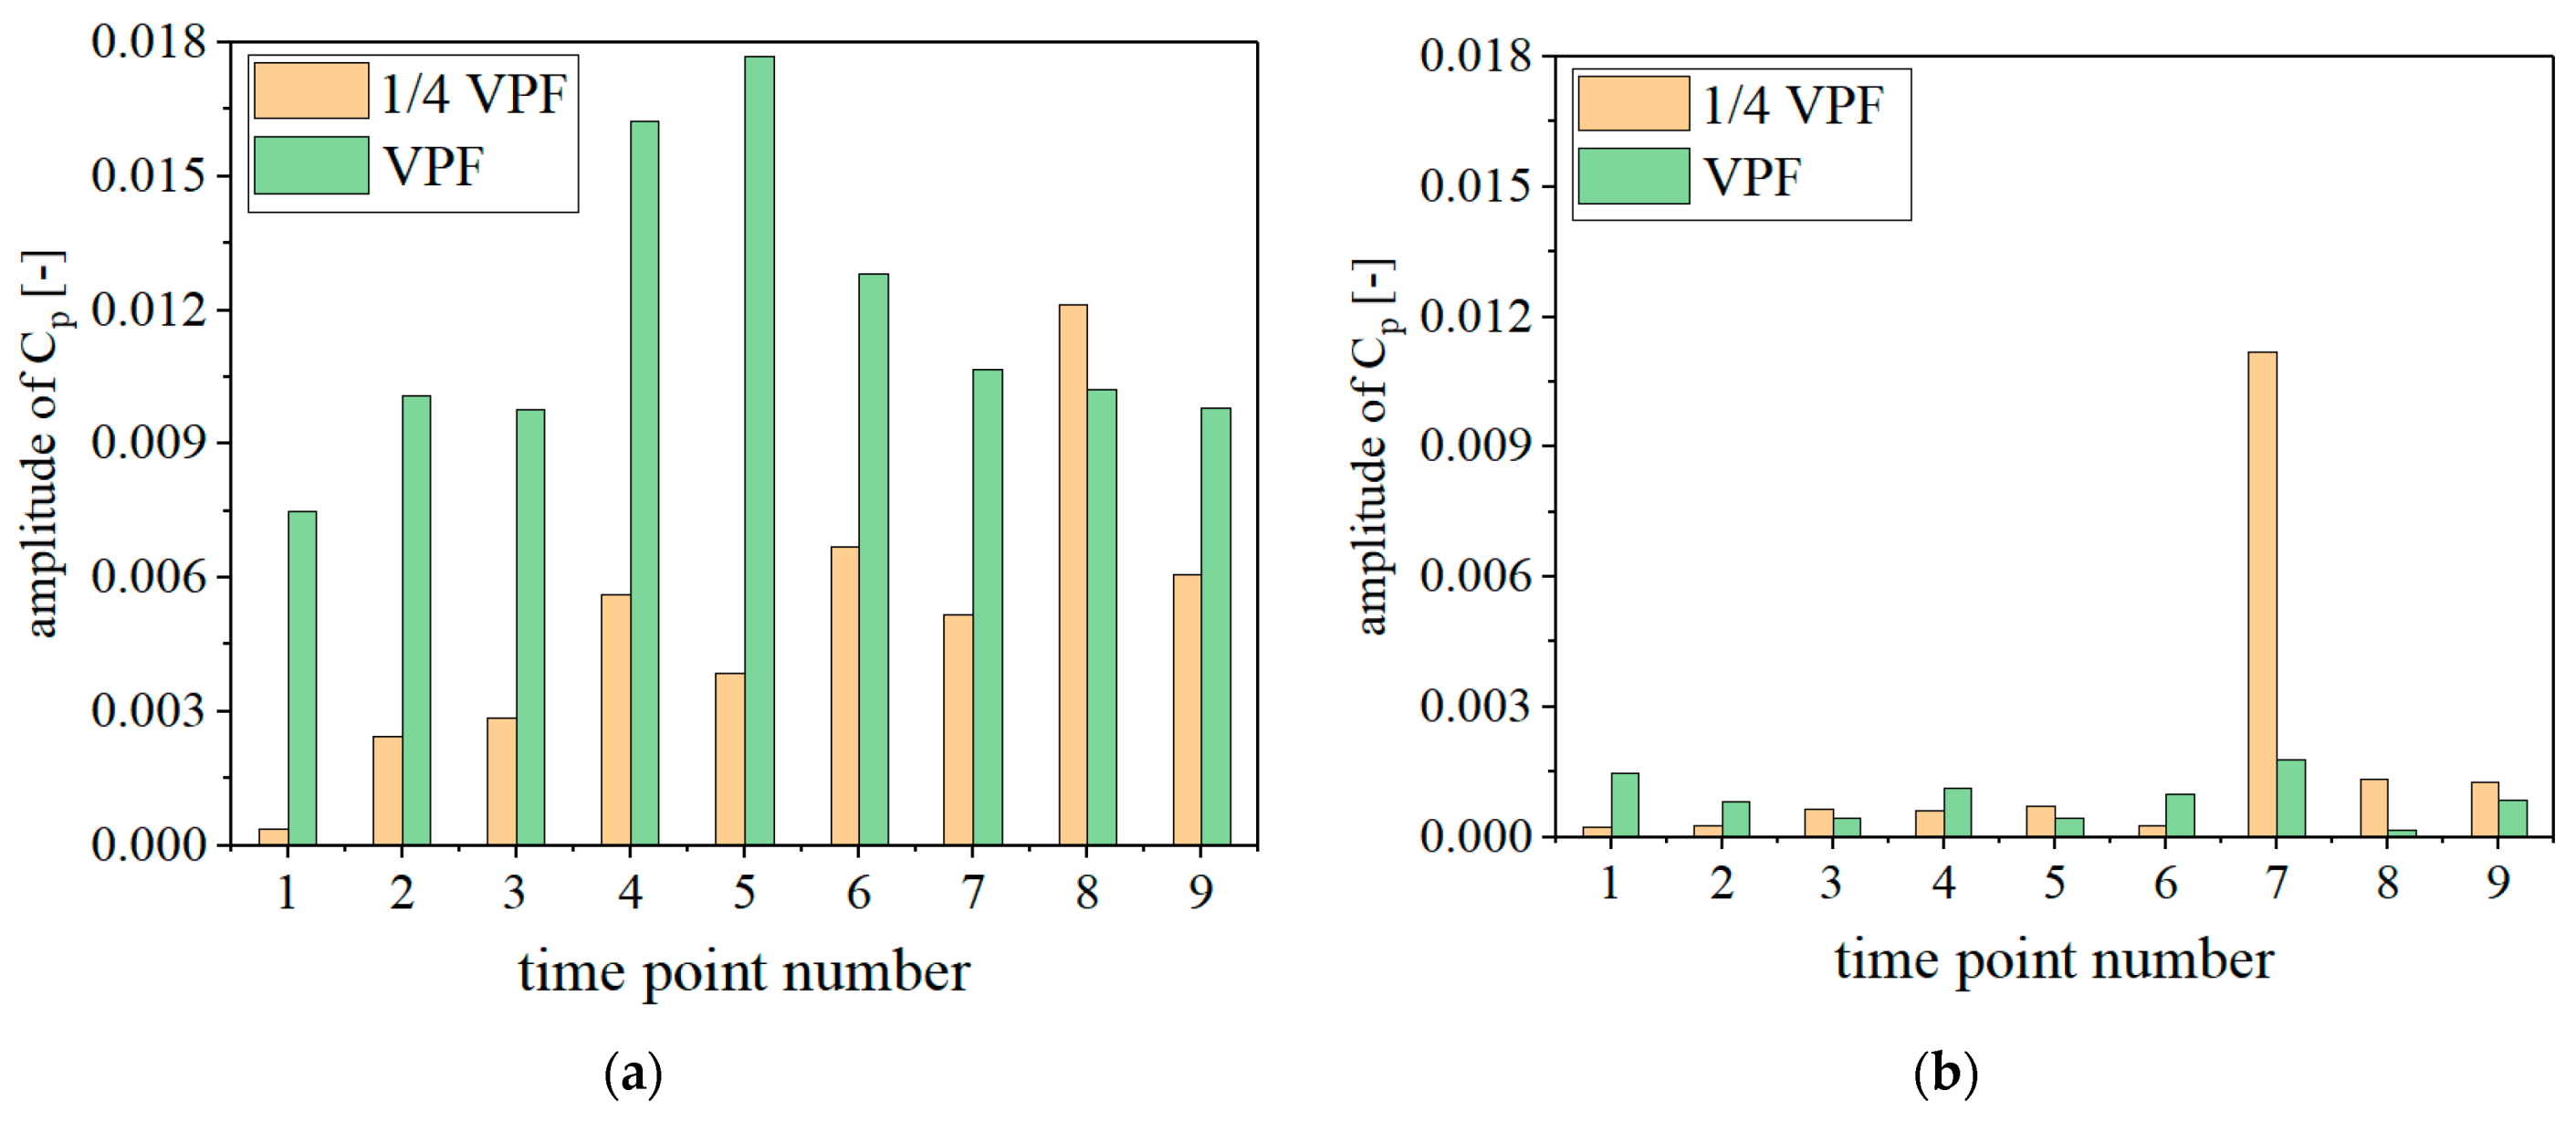
4.1. The Variation of Performance Characteristics

The energy characteristics such as discharge and power change rapidly during start-up process. Meanwhile, the pressure wave as a result of the operating condition change of unit travels through pipeline, and this travel in turn affects the operating condition change of unit. Through 1D MOC, this complex process can be simulated. However, in this paper, the pressure wave is not the key point and is not discussed here.
3D simulation was conducted based on the result of 1D MOC at typical time points. Total pressure and static pressure are set as inlet and outlet boundary condition respectively, so head is a given quantity. Discharge and torque on blades of 1# unit are calculated by 3D simulation and the verification is shown in Figure 8. The guide vane opening is also plotted here. The discharge, torque and guide vane opening are expressed as relative values: Q / Q n , T / T n and A / A m a x , where Q n and T n are rated discharge and torque, A m a x is the maximum guide vane opening. The calculation of 1D MOC are based on model test, therefore the consistency of 3D CFD results and 1D MOC results in Figure 8 indicates that the accuracy of 3D CFD is enough for this study.
The relative rotating rate is plotted in Figure 9, where N is the rated rotating rate. The start-up process in turbine mode can be divided into three stages. In the first stage, guide vane opens at preset speed. As a consequence of increasing water flow, torque on the blades increases. The increasing torque accelerates the rotation of runner, raising the rotating rate. At 18 s, rotating rate nearly reaches the rated value. Then the unit goes through the second stage. Torque on blades is reduced by closing the guide vanes while the rotating rate is maintained at rated value. At 25 s, the torque almost drops to zero. In third stage, the unit reaches speed-no-load condition and stabilizes in this condition.
In steady state CFD calculation, the flow in runner is modelled with Moving Reference Frame (MRF), and the phenomenon of RSI cannot be considered. Therefore, the static stress calculation at each point is not enough to reflect the true stress of runner. In this paper, unsteady simulation was conducted to model the flow in a whole rotation cycle. The dynamic stresses of runner were calculated using FSI method, which encounter for their temporal changes as the relative position of runner and guide vanes changing. Then the mean value is defined to describe the stress at each time point. It can be called as mean stress and expressed as
σ ¯ e q u = 1 T t = 0 T σ e q u d t
where T is the time for a whole rotation cycle of each time point.

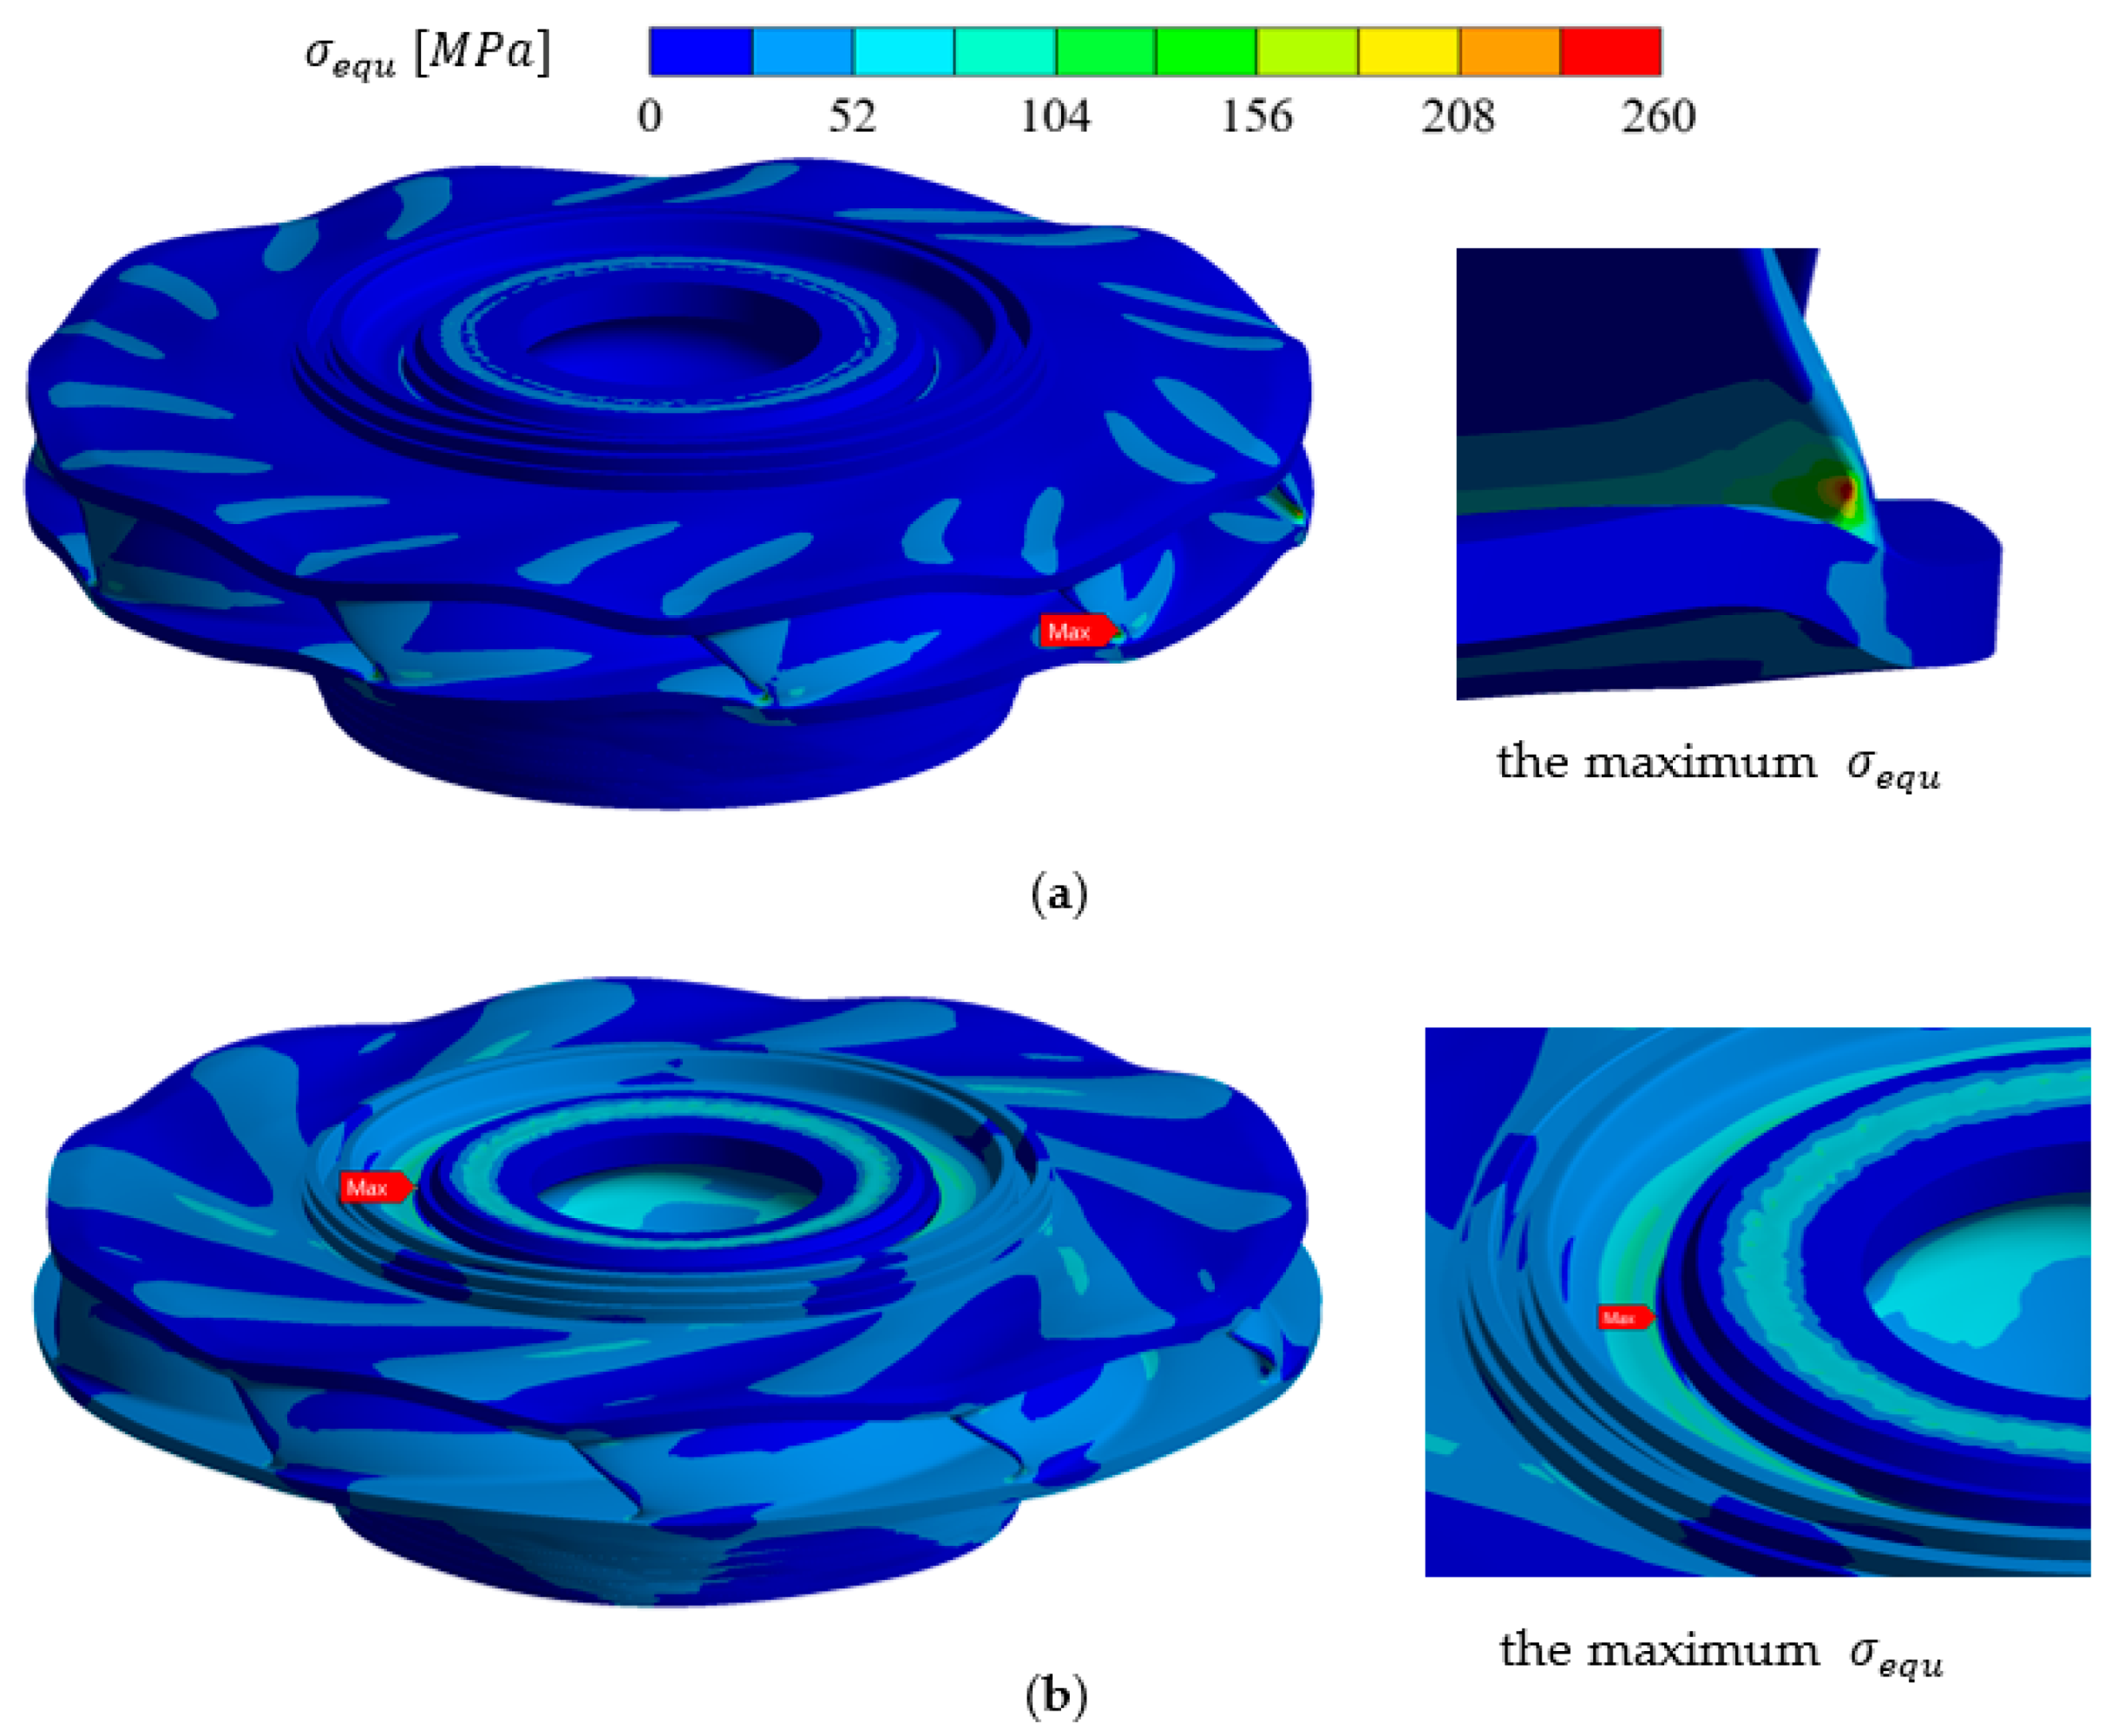
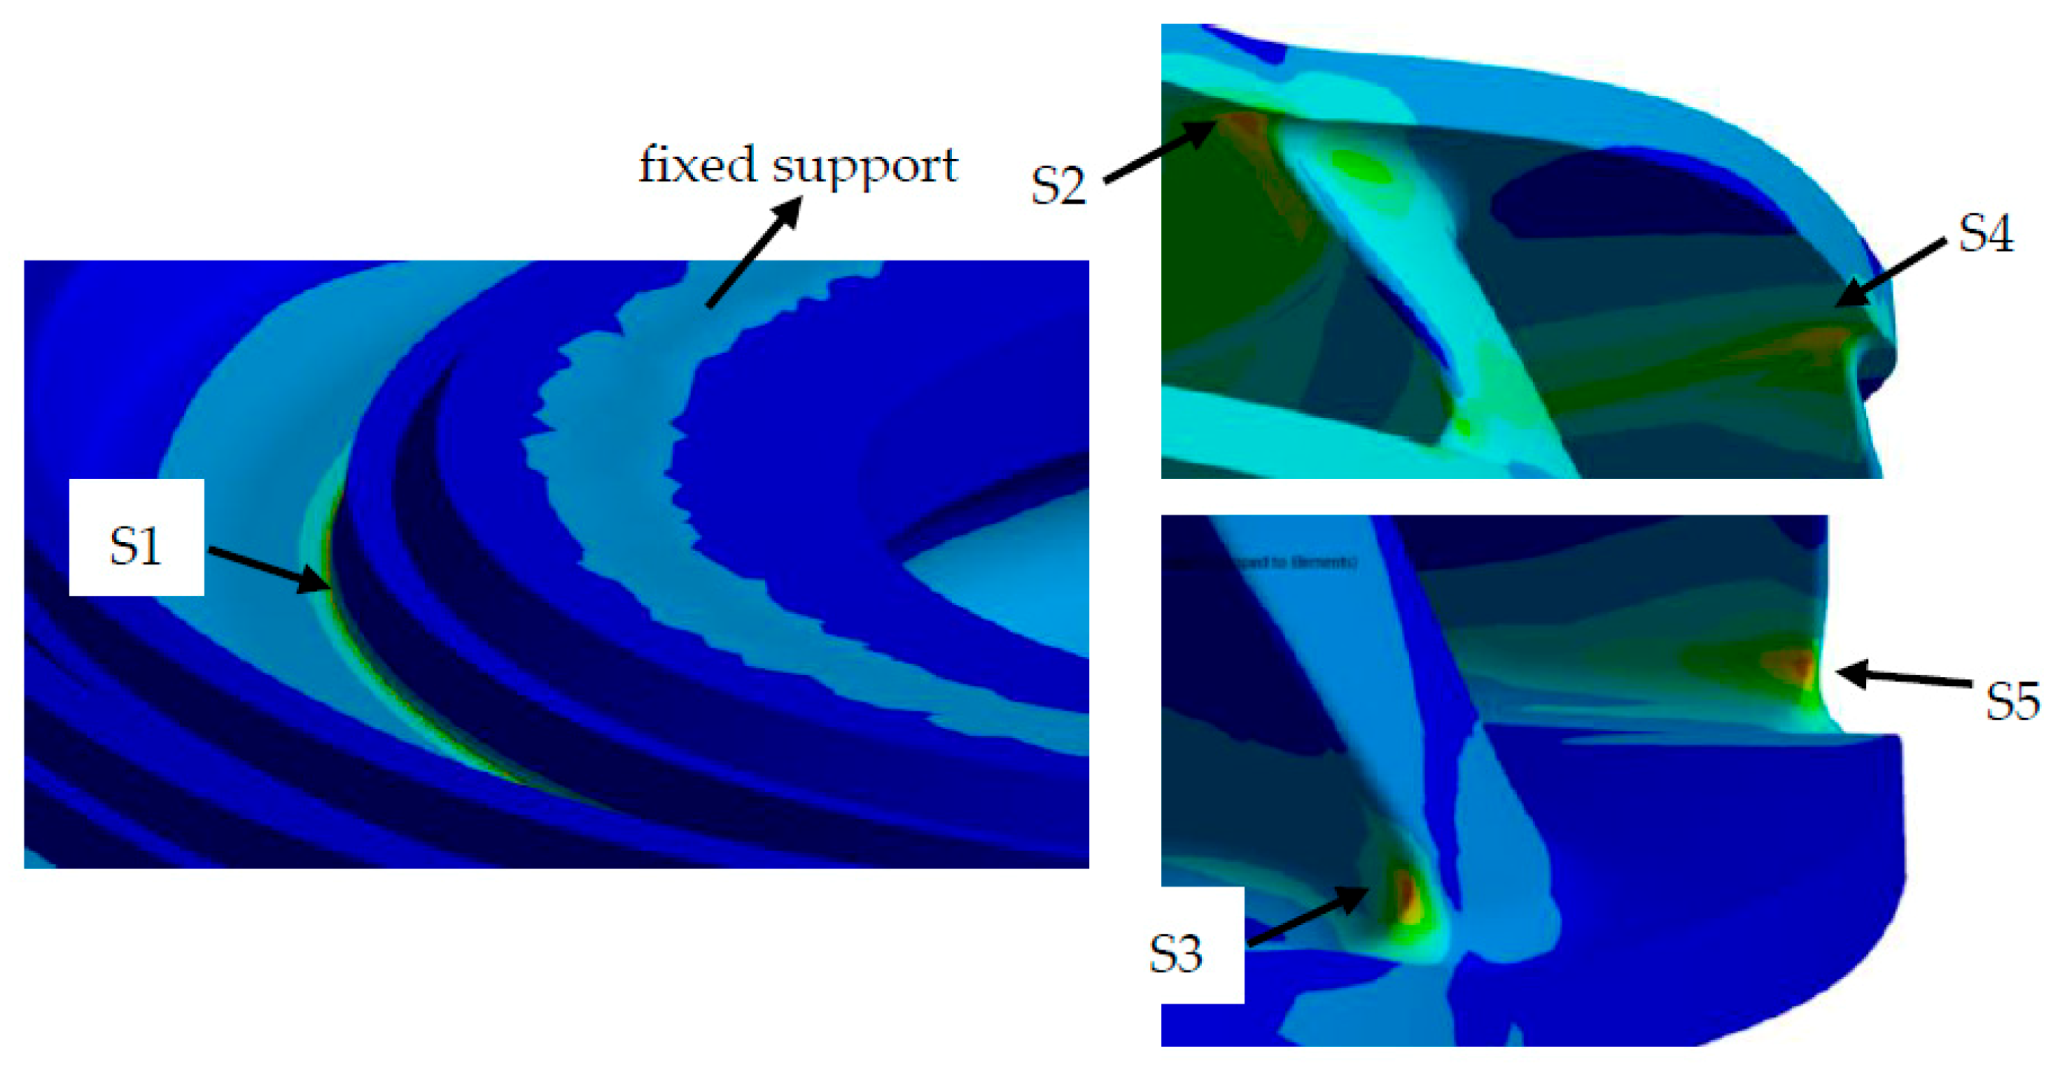
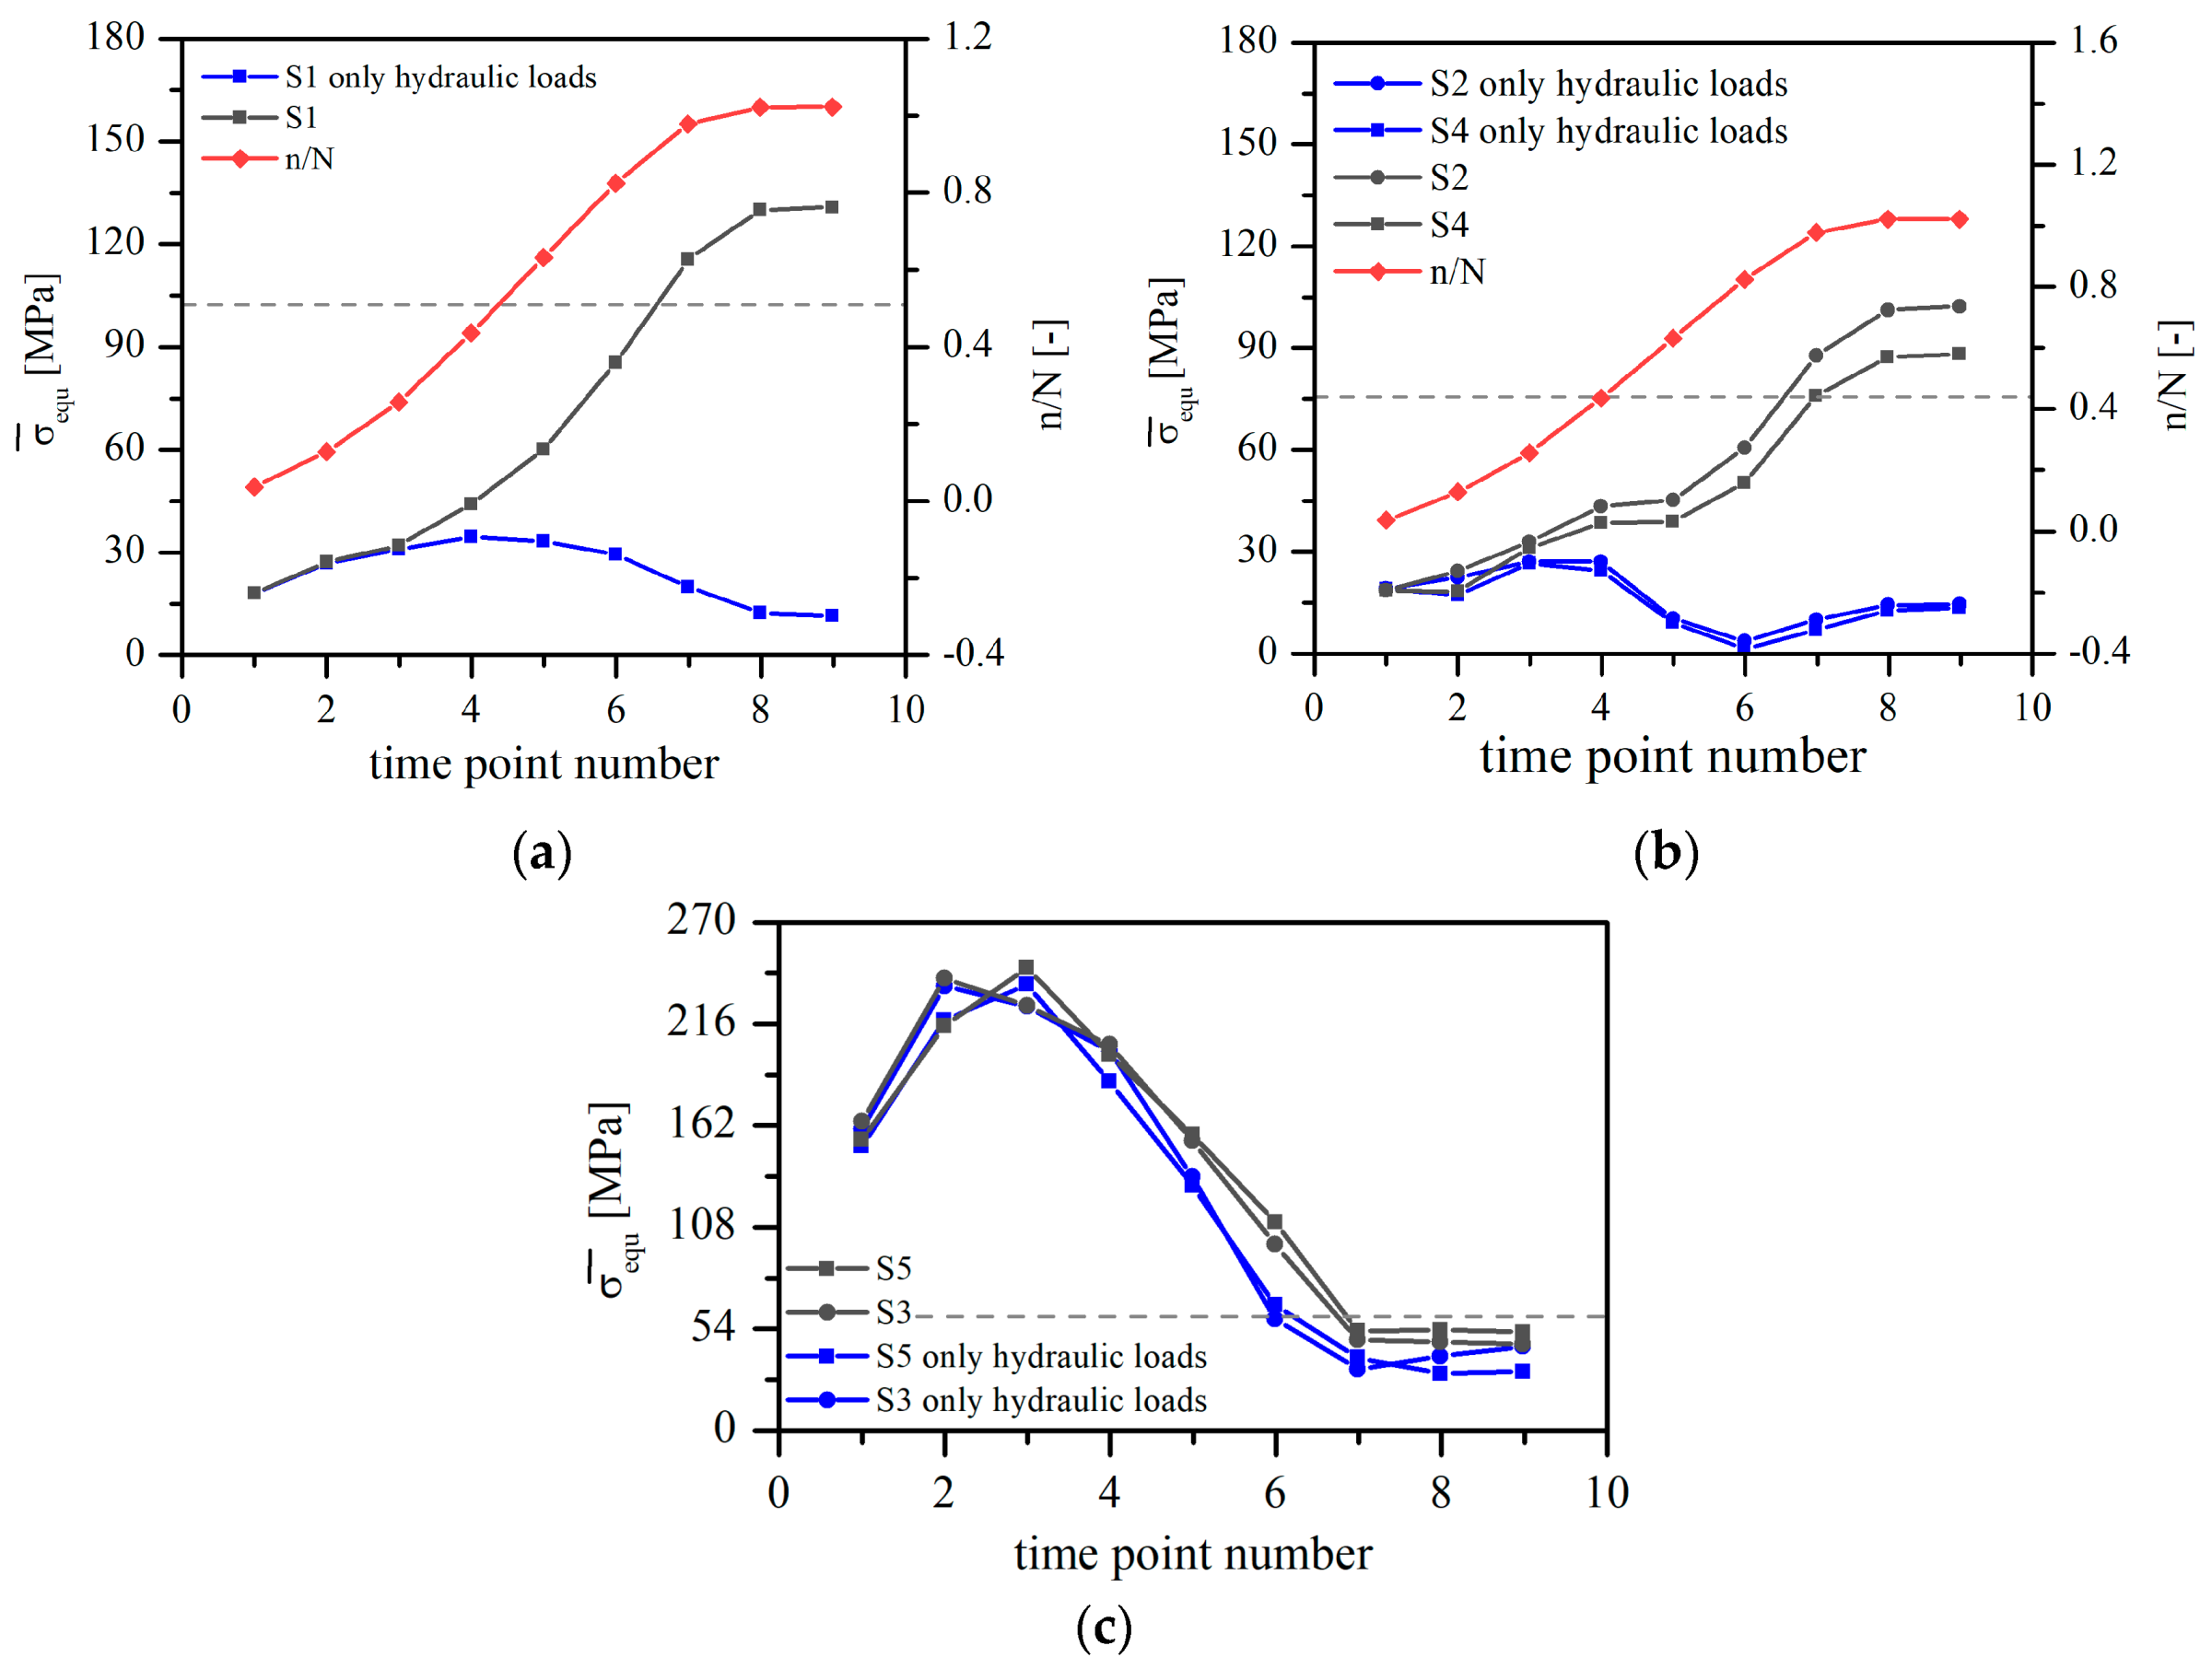
4.2. Mean Stresses of Runner

The stress characteristics of pump-turbine runner were obtained by FEM simulation. Two different types of stress distribution can be observed, as shown in Figure 10. In the first stage of start-up process, the fillets of leading edge and band suffered the maximum stress, as shown Figure 10a. There was no stress concentration appearing in other parts of runner. Among time points 1–6, the maximum stress at the concentration region was 245.7 MPa at TP3, the stress of other parts was less than 78 MPa. In the last two stages of start-up process, the ring near fixed support was the region of maximum stress, as shown in Figure 10b. The fillets of leading edge and band suffered low stress less than 55 MPa.
Further observation indicates that in the last two stages of start-up process, stress concentration also appeared at the fillets of leading edge and crown. For further explanation of the stress characteristics during start-up process, five nodes were selected in the high stress regions and marked as S1–S5, as shown in Figure 11. S2 and S3 locate at splitter blade while S4 and S5 locate at the main blade.
The mean stress of S1–S5 during start-up process is plotted in Figure 12. In order to make the influence of hydraulic loads explicit, the FEM analysis considering only hydraulic loads was performed and the mean stress is also shown in Figure 12. The stress at rated working condition was calculated, and marked as grey dotted lines.
As indicated in Figure 12, for S1, S2, and S4, the high stress in the last two stages of start-up process was mainly caused by centrifugal force. The stress is slightly higher than the value under rated working condition. Meanwhile, the hydraulic loads lead to the high stress of S3 and S5 in the first stage. The maximum stress of S5 at TP3 can be 3.56 times of rated working condition.
During start-up process, the rotating rate rises quickly in the first stage, and later the growth rate is under control, the value is near the rated value. Thus, centrifugal force contributes to a rapid rise of stress in first stage and the stable high stress in the last two stages. In addition to large centrifugal force, high rotating rate also leads to flow instabilities [26,27], which is another factor causing the high stress. There is circumferential velocity gradient between upper wall and lower wall of clearance, as shown in Figure 13. As rotating rate rises, velocity gradient increases; thus, the shear stress becomes larger, leading to the high stress of runner.
Due to the shape of the runner, the regions with sudden change of geometry such as S1–S5 can be easily influenced by centrifugal force. In addition, the fillets of trailing edge and crown\band are also high stress regions though these regions are not discussed in detail in this paper. Other parts of runner, for instance, the middle parts of blades, suffer low stress in the whole process and are hardly affected by centrifugal force.
From Figure 12b, more information can be found that the mean stress of S2 was larger than S4. Considering the fact that the size of elements near S2 is similar to that near S4, a reasonable explanation is the geometry difference of main blade and splitter blade caused the difference of mean stress. The leading edges of the two blades are almost the same. However, the splitter blade is more curved than main blade, as shown in Figure 14. The centrifugal force of blade causes the bending moment on the fillet of blade and crown, which is one of the reasons for the stress of S2 and S4. The more curved blade leads to the lager moment and larger mean stress.
For all the five nodes, the mean stress caused by hydraulic loads followed a similar law: increase and reach the maximal value in the first stage and then decrease. In this paper, the hydraulic loads on runner can be simplified as two axial forces ( F c r o w n and F b a n d ) and a torque on blades ( T ). It is the superposition of axial hydraulic forces and hydraulic torque on the blade that leads to this law.
Figure 15 provides the relative value of F c r o w n and F b a n d , which are defined as
F c r o w n * =   F c r o w n m r g
F b a n d * =   F b a n d m r g
where m r is the mass of all the rotating components. According to the regulations, the downward axial force is defined as positive. At TP1–6, F c r o w n and F b a n d drag crown and band away from each other. At TP7, F c r o w n and F b a n d both drop to near zero. AT TP8 and TP9, F c r o w n and F b a n d change direction and begin to push crown and band to each other. The stress of runner decreases to the minimum value at TP7 and then increases under the influence of axial forces.
The variation of T can be found in Figure 8 as relative value T / T n . At TP3–6, the value of T is higher than other time points, making the stress of runner higher. At TP7–9, T is close to 0, and the stress of runner also decreases.
The axial force and the torque both have great influence on the mean stress of runner. They are loaded together on the runner, causing the higher stress at TP3–4 and the lower stress at TP7–9.
However, compared to centrifugal force, the hydraulic loads effected only S3 and S5, as shown in Figure 12. The maximum stress caused by hydraulic loads of S1, S2, and S4 was less than 35 MPa, while that of S3 and S5 was as high as 236 MPa. First, the discharge is quite small in start-up process, so the flow direction is different from blade angle. When the water flows into runner, it impacts on the pressure side of blade, causing a high-pressure region at the impact point, as shown in Figure 16. The pressure distribution shows the pressure difference mainly affects the inlet area of blade. Therefore, S3 and S5 are easier to suffer large stress. Second, the angle between leading edge and axis is 32.9 degree for main blade and 32.6 degree for splitter blade. Compared with other pump-turbine runner shown in Figure 17, the runner in this paper has a more leaning leading edge. As shown in the sketch map, this leaning leading edge contributes to the gentle transition to crown and the steep transition to band. When hydraulic loads act on the runner, S3 concentrates stress more quickly than S2, as do S5 and S4.
At most time points, there was little difference between the pressure distributions in each passage of runner. Therefore, the mean stresses of S3 and S5 were almost the same. At TP3, the pressure distributions of two neighboring passages were different from each other, which can be seen in Figure 16. That is the reason why the mean stress of S5 was larger than of S3 at TP3.

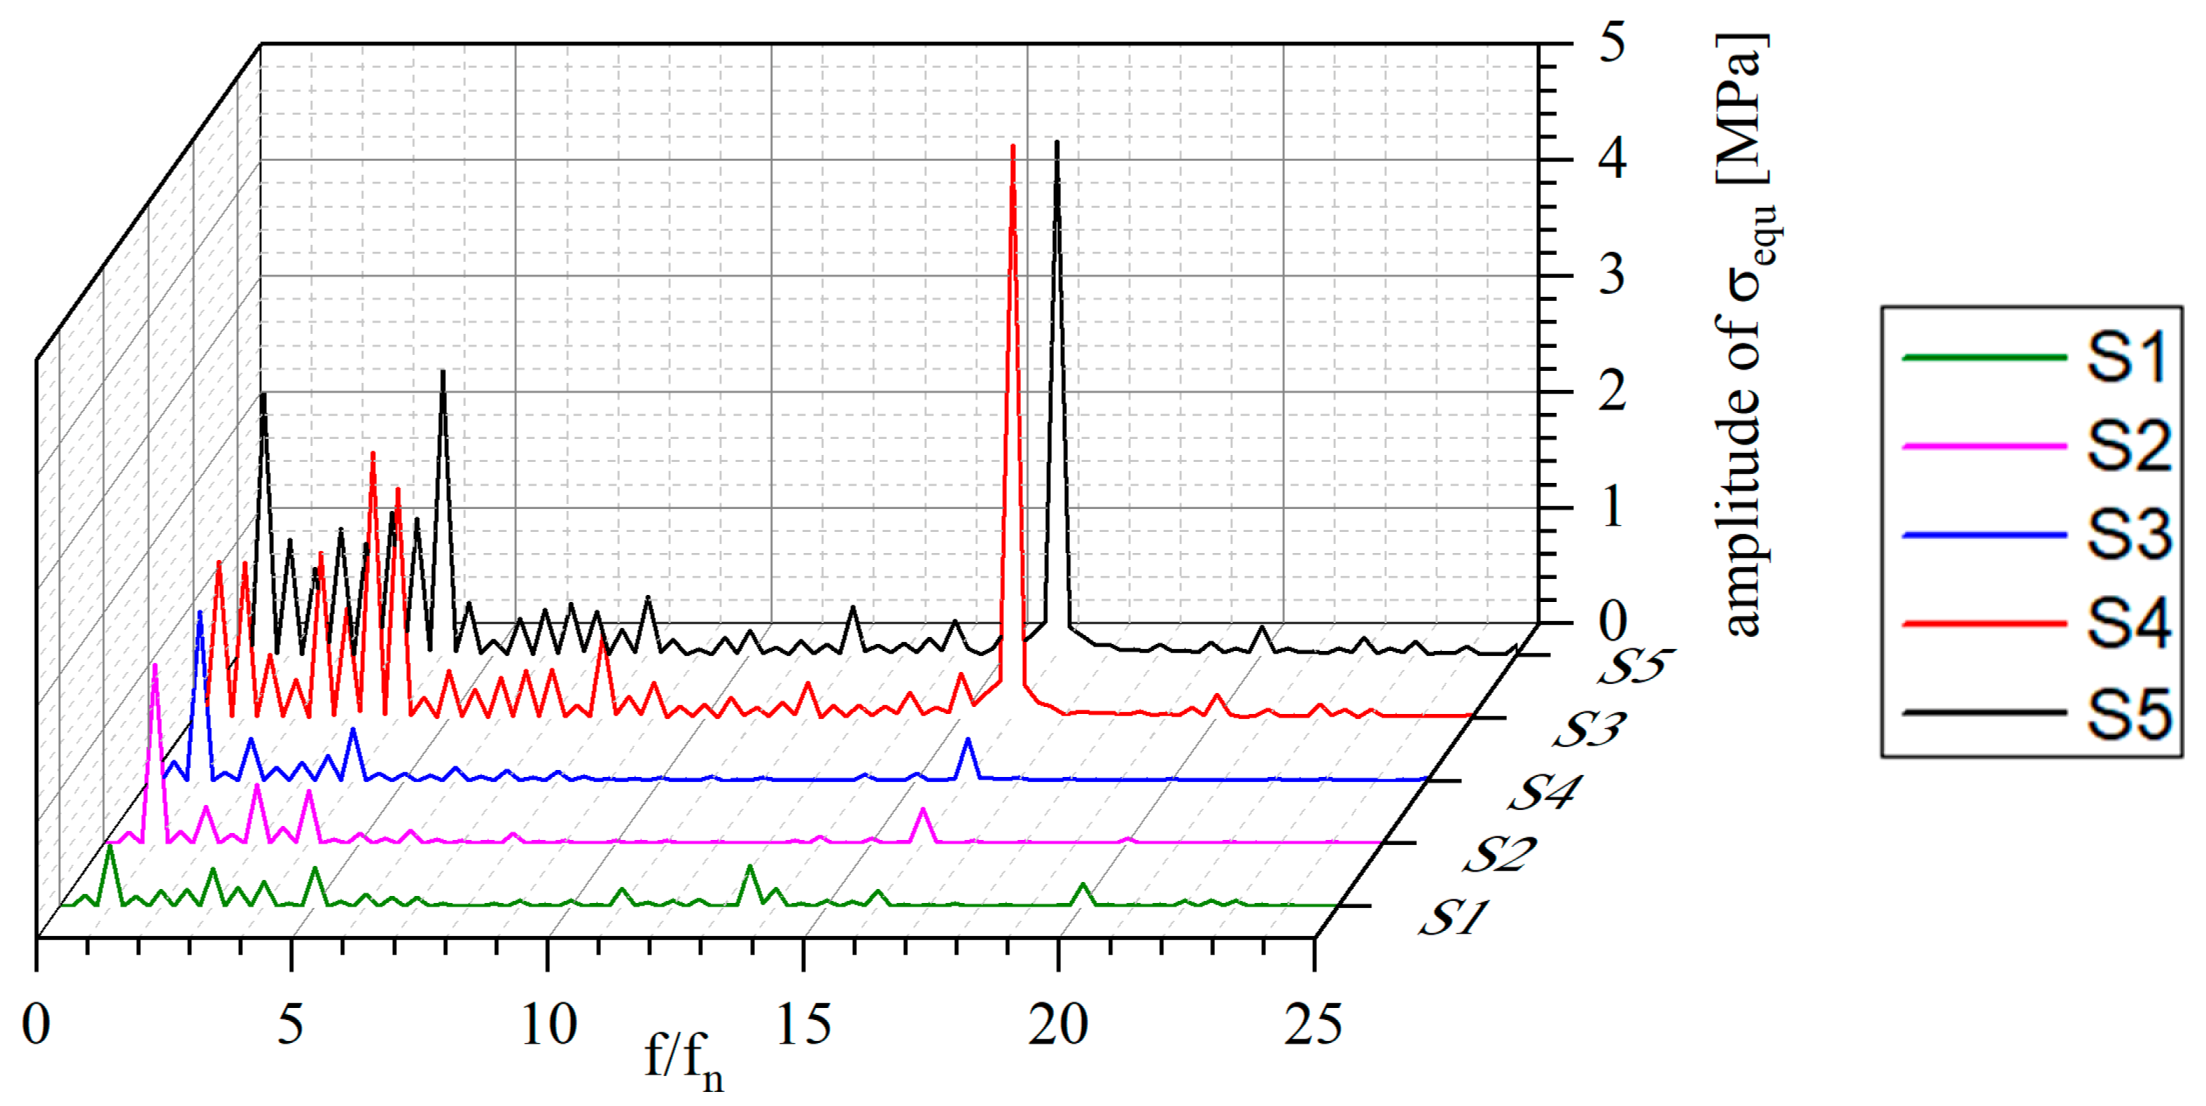
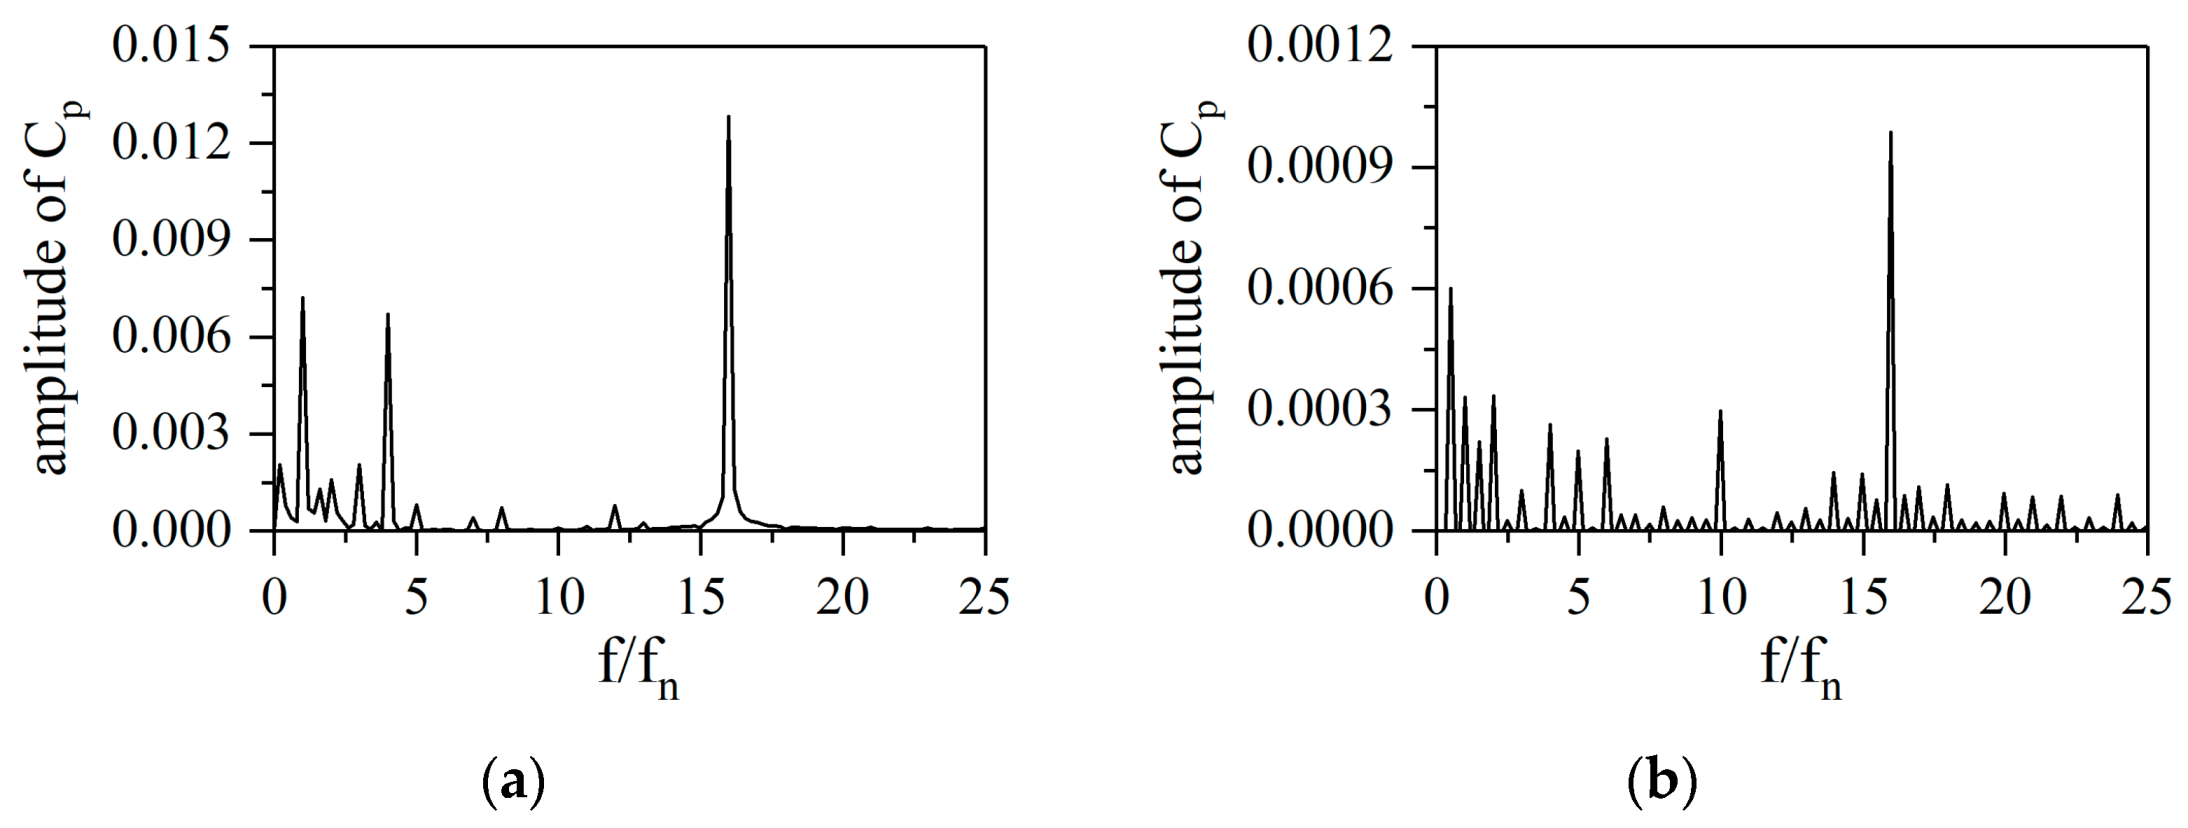
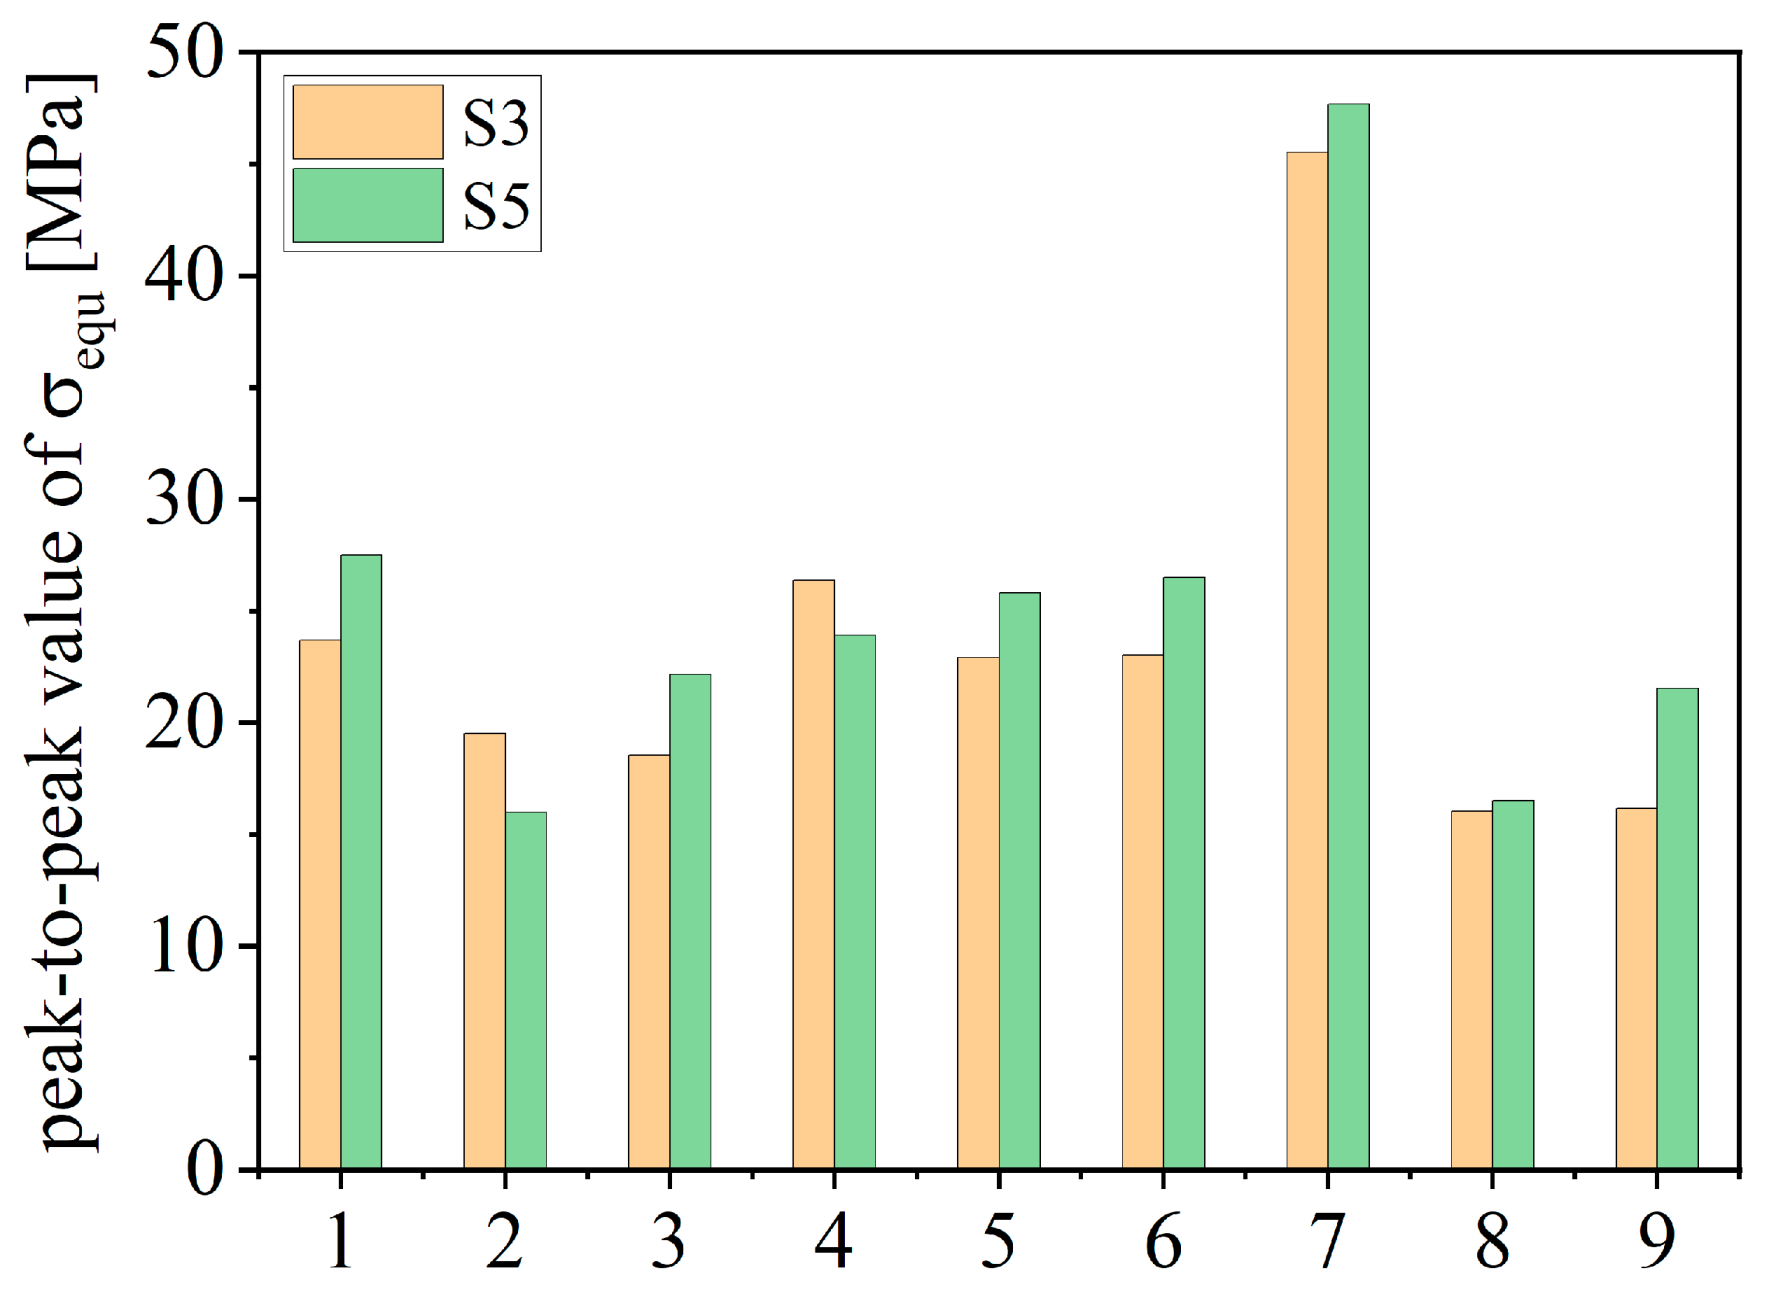
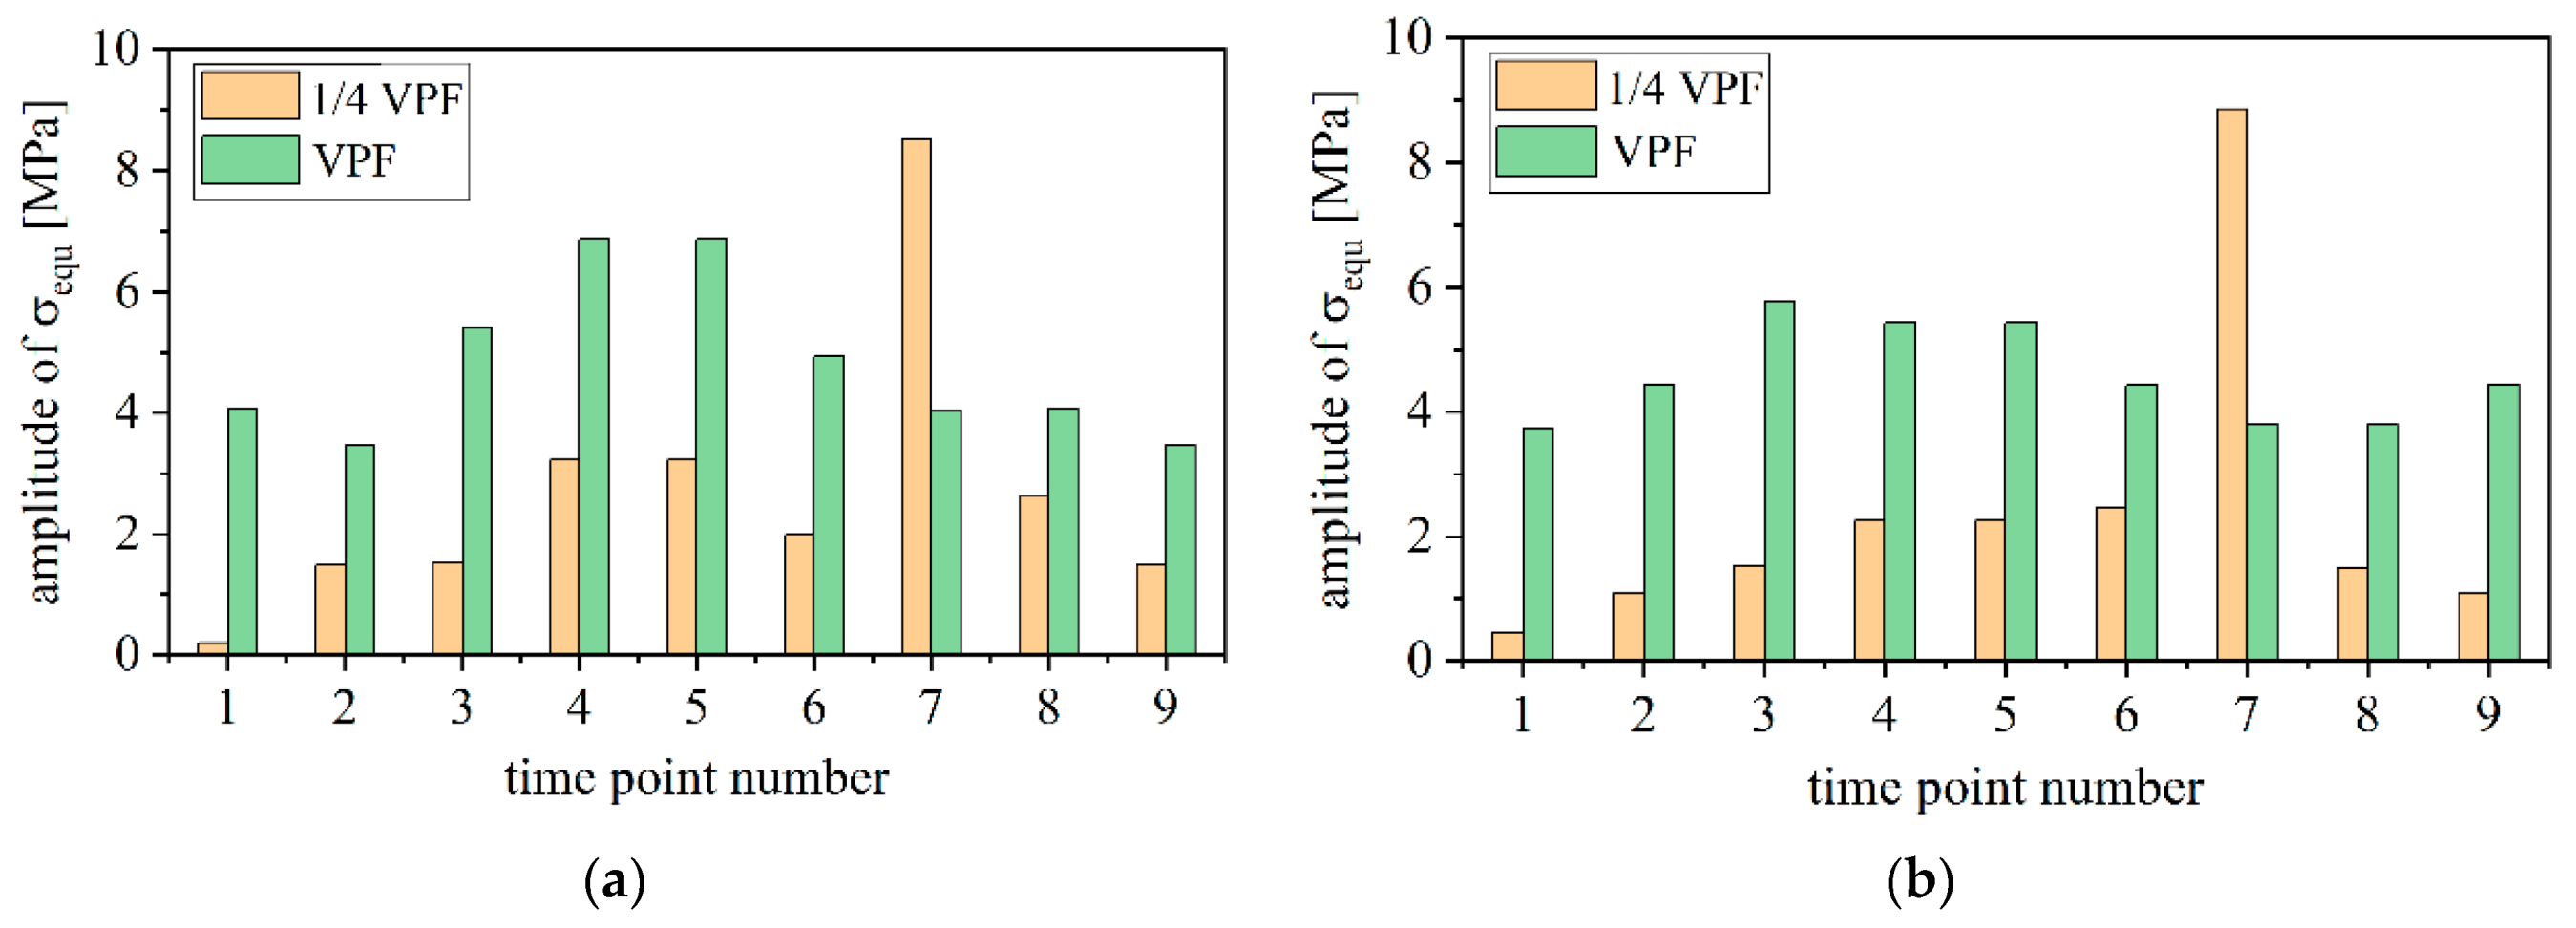
4.3. The Amplitudes and Frequency Components of Dynamic Stresses

At each time point, the stress of runner will change as the relative position of runner and guide vanes changes, also known as RSI. The pressure fluctuations induced by RSI are the main reason of dynamic stresses of runner. In this section, the variation of amplitudes and frequencies of dynamic stresses during start-up process will be discussed.
Figure 18 is the frequency domain diagram of dynamic stresses at TP6. The variable of horizontal axis is the ratio of frequency and rotating frequency f n . As can be seen from Figure 18, the amplitudes of S3 and S5 were far lager that of S1, S2, and S4. This is consistent with the previous analysis that stress of S3 and S5 were mainly affected by hydraulic loads while S1, S2, and S4 were by centrifugal force.
Two points in flow domain were selected to reflect the pressure fluctuation. The point in runner was named P1 and the point in clearance was P2, as shown in Figure 19. Figure 20 is the frequency domain diagram of relative pressure coefficient at TP6. The main frequency was 16 f n , usually called as vane passing frequency (VPF). The pressure fluctuations also included low frequency components (1–4 f n ), which were induced by the irregular flow in runner with small discharge. Under the effect of pressure fluctuation, the main frequency of dynamic stresses was also VPF. The low frequency components also existed in dynamic stresses, as shown in Figure 18.
The dynamic stresses at other time points were also investigated. The peak-to-peak value during start-up process is shown in Figure 21. In first stage, though the discharge and rotating rate were increasing, the peak-to-peak value did not show a significant growth trend and stabilized about 20 MPa. At TP7, the value increased and reached 50 MPa. Later on, it dropped back to about 20 MPa. Compared with the normal condition, peak-to-peak value in start-up process was far larger and may cause fatigue crack after a few times.
Figure 22 shows the amplitudes of 1/4 VPF and VPF in start-up process. At TP1, the pressure fluctuation in runner was mainly caused by RSI, thus VPF was the main frequency of dynamic stress while the amplitude of 1/4 VPF was almost zero. Later as the discharge and torque of runner increased, the amplitude of VPF rose slightly. The irregular flow in runner also became violent and led to an amplitude growth of 1/4 VPF. In second and third stage, the torque and discharge began to drop, but the influence of RSI continued, so the amplitude of VPF did not decrease. Moreover, there was a sudden rise of 1/4 VPF at TP7, and the amplitude fell rapidly at TP8. That was the reason for the maximum peak-to-peak value at TP7 in Figure 21.
The modal analysis was performed to tell whether the sudden rise of 1/4 VPF was caused by resonance. The natural frequency of first mode is 95.95 Hz and the mode shape is shown in Figure 23. There is a nodal diameter in this mode shape, so it is usually marked as 1ND [28]. This is a common mode shape for most runners and other structure similar with the disc [29,30]. The rotating rate at TP7 is 489.24 rpm, and the value of 1/4 VPF is 32.62 Hz, far from 95.95 Hz. Therefore, the steeply increase of dynamic stress at TP7 is not the contribution of resonance.
Then the effect of pressure fluctuation is taken into consideration. The amplitudes of two specific frequencies, 1/4 VPF and VPF at all time points were obtained and shown in Figure 24. For P1, VPF was the main frequency at most time points, as shown in Figure 24a. The pressure fluctuation induced by RSI and the vortex flow were violent in guide vane and runner. When it spread to clearances, the amplitude decreased. Thus, in most cases, the amplitude of P2 was far smaller than P1, as shown in Figure 24b. However, at TP7, the amplitude of 1/4 VPF was much greater than other time points. Considering the high-speed rotating flow in clearances and the approximately axial symmetry of clearances, the amplitude of pressure fluctuation is similar in the circumferential direction. When the strength of pressure fluctuation in clearances is enough, it can have a great influence on the dynamic stress of runner. At other time points, the strength of pressure fluctuation in clearance is low, the dynamic stress is mainly affected by the pressure fluctuation in runner.
The low frequency component such as 1/4 VPF in clearance may come from the vortex generation and shedding process or the stochastic events as mentioned in Ref. [12]. The reasons of the sudden increase of 1/4 VPF pressure fluctuation will be discussed in further work.

5. Conclusions

The dynamic stresses of pump-turbine runner during start-up process in turbine mode were calculated in this paper. The coupling of 1D pipeline and 3D pump-turbine unit was conducted to obtain the performance characteristics and internal flow characteristics of the unit during the transient process. The dynamic stresses of runner were simulated using one-way FSI method. The influence of both inner surface and outer surface was taken into consideration in the interaction of fluid and structure. The conclusions are as follows:
(1) The start-up process was divided into three stages in this paper. In the first stage the discharge and hydraulic torque rise up, the runner is accelerated. In the second stage, rotating rate reaches the rated value, the guide vane begins to close, and the hydraulic torque of blades decreases gradually to zero. Finally, in the third stage, the unit stabilizes in speed-no-load condition.
(2) In the first stage of start-up, the maximum stress could be generated at the fillets of leading edge and band, and can reach 3.56 times of rated working condition. It was mainly induced by the increasing torque on blades and the large axial forces of crown and band. Moreover, as rotating rate rise, the centrifugal force and fluid shear stress in clearance increases. As a result, stress of the ring near fixed support quickly increased in first stage and was finally maximized in contrast with other parts of runner in the second and third stage.
(3) The amplitude of dynamic stresses could be maximized at the fillets of leading edge and band. In most of time during start-up, the dynamic stress was mainly characterized by VPF due to the RSI, which was the determining factor causing pressure fluctuation. However, the severe pressure fluctuation in clearance was found in the second stage with the main frequency of 1/4 VPF. It can also be a leading factor of dynamic stresses in a short time. Therefore, the pressure fluctuation in clearance should be taken into consideration in the stage of runner design.
In this paper, the added mass and transient integral effect were not taken into consideration. Their influence on the dynamic stresses in start-up process will be studied in further work.

Author Contributions

Methodology, Z.W.; investigation, F.C.; validation, H.B. writing—original draft preparation, F.C.; writing—review and editing, S.-H.A., Z.M., and Y.L.; funding acquisition, Z.W. All authors have read and agreed to the published version of the manuscript.

Funding

This research was funded by National Key R&D Program of China, grant number 2016YFC0401905 and National Natural Science Foundation of China, grant number 51909131.

Institutional Review Board Statement

Not applicable.

Informed Consent Statement

Not applicable.

Data Availability Statement

Not applicable.

Acknowledgments

Special thanks are due to the Construction and Management Branch of CSG Power Generation Co. Ltd.

Conflicts of Interest

The authors declare no conflict of interest.

References

  1. Li, D.Y.; Gong, R.Z.; Wang, H.J.; Wei, X.Z.; Liu, Z.S.; Qin, D.Q. Analysis of Rotor-Stator Interaction in Turbine Mode of a Pump-Turbine Model. J. Appl. Fluid Mech. 2016, 9, 2559–2568. [Google Scholar] [CrossRef]
  2. Frunzǎverde, D.; Muntean, S.; Mǎrginean, G.; Campian, V.; Marsavina, L.; Terzi, R. Failure analysis of a Francis turbine runner. IOP Conf. Ser. Earth Environ. Sci. 2010, 12, 012115. [Google Scholar] [CrossRef]
  3. Egusquiza, E.; Valero, C.; Huang, X.; Jou, E.; Guardo, A.; Rodriguez, C. Failure investigation of a large pump-turbine runner. Eng. Fail. Anal. 2012, 23, 27–34. [Google Scholar] [CrossRef] [Green Version]
  4. Egusquiza, M.; Egusquiza, E.; Valentin, D.; Valero, C.; Presas, A. Failure investigation of a Pelton turbine runner. Eng. Fail. Anal. 2017, 81, 234–244. [Google Scholar] [CrossRef]
  5. Wang, H.; Tsukamoto, H. Fundamental Analysis on Rotor-Stator Interaction in a Diffuser Pump by Vortex Method. ASME J. Fluids Eng. 2001, 123, 737–747. [Google Scholar] [CrossRef]
  6. Kubota, Y.; Suzuki, T.; Tomita, H.; Nagafugi, T.; Okamura, C. Vibration of rotating bladed disc excited by stationary distributed forces. Bull. JSME 1983, 26, 1952–1957. [Google Scholar] [CrossRef] [Green Version]
  7. Seidel, U.; Hübner, B.; Löfflad, J.; Faigle, P. Evaluation of RSI-induced stresses in Francis runners. IOP Conf. Ser. Earth Environ. Sci. 2012, 15, 5. [Google Scholar] [CrossRef]
  8. Bouajila, S.; De Colombel, T.; Lowys, P.Y.; Maitre, T. Hydraulic Phenomena Frequency Signature of Francis Turbines Operating in Part Load Conditions. IOP Conf. Ser. Earth Environ. Sci. 2016, 48, 082001. [Google Scholar] [CrossRef] [Green Version]
  9. Ausoni, P.; Farhat, M.; Escaler, X.; Egusquiza, E.; Avellan, F. Cavitation Influence on von Kármán Vortex Shedding and Induced Hydrofoil Vibrations. ASME. J. Fluids Eng. 2007, 129, 966–973. [Google Scholar] [CrossRef] [Green Version]
  10. Nennemann, B.; Morissette, J.F.; Chamberland-Lauzon, J.; Monette, C.; Braun, O.; Melot, M. Challenges in Dynamic Pressure and Stress Predictions at No-Load Operation in Hydraulic Turbines. IOP Conf. Ser. Earth Environ. Sci. 2014, 22, 032055. [Google Scholar] [CrossRef] [Green Version]
  11. Mende, C.; Weber, W.; Seidel, U. Progress in load prediction for speed-no-load operation in Francis turbines. IOP Conf. Ser. Earth Environ. Sci. 2016, 49, 062017. [Google Scholar] [CrossRef] [Green Version]
  12. Morissette, J.F.; Chamberland-Lauzon, J.; Nennemann, B.; Monette, C.; Giroux, A.M.; Coutu, A. Stress predictions in a Francis turbine at no-load operating regime. IOP Conf. Ser. Earth Environ. Sci. 2016, 49, 072016. [Google Scholar] [CrossRef] [Green Version]
  13. Botero, F.; Hasmatuchi, V.; Roth, S.; Farhat, M. Non-intrusive detection of rotating stall in pump-turbines. Mech. Syst. Signal Process. 2014, 48, 162–173. [Google Scholar] [CrossRef]
  14. Nicolle, J.; Giroux, A.M.; Morissette, J.F. CFD configurations for hydraulic turbine startup. IOP Conf. Ser. Earth Environ. Sci. 2014, 22, 032021. [Google Scholar] [CrossRef]
  15. Pacot, O.; Kato, C.; Guo, Y.; Yamade, Y.; Avellan, F. Large Eddy Simulation of the Rotating Stall in a Pump-Turbine Operated in Pumping Mode at a Part-Load Condition. J. Fluids Eng. 2016, 138, 111102. [Google Scholar] [CrossRef]
  16. Hasmatuchi, V.; Farhat, M.; Roth, S.; Botero, F.; Avellan, F. Experimental Evidence of Rotating Stall in a Pump-Turbine at Off-Design Conditions in Generating Mode. J. Fluids Eng. 2011, 133, 5. [Google Scholar] [CrossRef]
  17. Li, D.; Gong, R.; Wang, H.; Wei, X.; Liu, Z.; Qin, D. Numerical investigation on transient flow of a high head low specific speed pump-turbine in pump mode. J. Renew. Sustain. Energy 2015, 7, 063111. [Google Scholar] [CrossRef]
  18. Fu, X.; Li, D.; Wang, H.; Zhang, G.; Li, Z.; Wei, X. Influence of the clearance flow on the load rejection process in a pump-turbine. Renew. Energy 2018, 127, 310–321. [Google Scholar] [CrossRef]
  19. Fu, X.; Li, D.; Wang, H.; Zhang, G.; Li, Z.; Wei, X. Analysis of transient flow in a pump-turbine during the load rejection process. J. Mech. Sci. Technol. 2018, 32, 2069–2078. [Google Scholar] [CrossRef]
  20. Li, D.; Wang, H.; Li, Z.; Nielsen, T.K.; Goyal, R.; Wei, X. Transient characteristics during the closure of guide vanes in a pump turbine in pump mode. Renew. Energy 2018, 118, 973–983. [Google Scholar] [CrossRef]
  21. Jintao, L.; Shuhong, L.; Yuekun, S.; Yulin, W.; Leqin, W. Three dimensional flow simulation of load rejection of a prototype pump-turbine. Eng. Comput. 2012, 29, 417–426. [Google Scholar] [CrossRef]
  22. Li, Z.; Bi, H.; Wang, Z.; Yao, Z. Three-dimensional simulation of unsteady flows in a pump-turbine during start-up transient up to speed no-load condition in generating mode. Proc. Inst. Mech. Eng. Part A J. Power Energy 2016, 230, 570–585. [Google Scholar] [CrossRef]
  23. Zuo, Z.; Fan, H.; Liu, S.; Wu, Y. S-shaped characteristics on the performance curves of pump-turbines in turbine mode–A review. Renew. Sustain. Energy Rev. 2016, 60, 836–851. [Google Scholar] [CrossRef]
  24. Huang, X.; Chamberland-Lauzon, J.; Oram, C.; Klopfer, A.; Ruchonnet, N. Fatigue analyses of the prototype Francis runners based on site measurements and simulations. IOP Conf. Ser. Earth Environ. Sci. 2014, 22, 012014. [Google Scholar] [CrossRef] [Green Version]
  25. He, L.; Zhou, L.; Ahn, S.-H.; Wang, Z.; Nakahara, Y.; Kurosawa, S. Evaluation of gap influence on the dynamic response behavior of pump-turbine runner. ENG Comput. 2019, 36, 491–508. [Google Scholar] [CrossRef]
  26. Shafieian, M.; Zavar, M.; Rahmanian, M. Simulation and Control of Surge Phenomenon in Centrifugal Compressors. Traitement Signal 2019, 36, 259–264. [Google Scholar] [CrossRef]
  27. Jin, Y.; Fu, Y.; Qian, Y.; Zhang, Y. A Moore-Greitzer Model for Ducted Fans in Ground Effect. J. Appl. Fluid Mech. 2020, 13, 693–701. [Google Scholar] [CrossRef]
  28. Egusquiza, E.; Valero, C.; Liang, Q.; Coussirat, M.; Seidel, U. Fluid Added Mass Effect in the Modal Response of a Pump-Turbine Impeller. In Proceedings of the ASME 2009 International Design Engineering Technical Conferences and Computers and Information in Engineering Conference (IDETC/CIE2009), San Diego, IL, USA, 30 August–2 September 2009; Volume 1, pp. 715–724. [Google Scholar]
  29. Valentín, D.; Presas, A.; Egusquiza, E.; Valero, C. Experimental study on the added mass and damping of a disk submerged in a partially fluid-filled tank with small radial confinement. J. Fluids Struct. 2014, 50, 1–17. [Google Scholar] [CrossRef]
  30. Valentín, D.; Presas, A.; Egusquiza, E.; Valero, C.; Egusquiza, M. Experimental Study of a Vibrating Disk Submerged in a Fluid-Filled Tank and Confined with a Nonrigid Cover. J. Vib. Acoust. 2017, 139, 436. [Google Scholar] [CrossRef]
Figure 1. Finite element model of runner (R1 is the node at the ring near fixed support; R2 is the node at the fillet of leading edge and crown; R3 is the node at the fillet of leading edge and band).
Processes 09 00499 g001
Figure 2. Mesh independency analysis.
Processes 09 00499 g002
Figure 3. The fluid structure interaction (FSI) interface.
Processes 09 00499 g003
Figure 4. The diagram of the hydraulic system.
Processes 09 00499 g004
Figure 5. The pump-turbine unit (a) pump-turbine unit; (b) runner (blue) and clearances (green).
Processes 09 00499 g005
Figure 6. Mesh of the flow domain (a) the whole flow domain; (b) runner; (c) clearance between runner and head cover; (d) clearance between runner and bottom ring.
Processes 09 00499 g006
Figure 7. The inlet and outlet boundary conditions.
Processes 09 00499 g007
Figure 8. The variation of torque and discharge during start-up process.
Processes 09 00499 g008
Figure 9. The variation of rotating rate (n/N).
Processes 09 00499 g009
Figure 10. Stress distribution at start-up process (a) TP3; (b) TP9.
Processes 09 00499 g010
Figure 11. Selected nodes in high stress regions.
Processes 09 00499 g011
Figure 12. The change of mean stresses in start-up process (a) S1; (b) S2 and S4; (c) S3 and S5.
Processes 09 00499 g012
Figure 13. The velocity gradient in clearance.
Processes 09 00499 g013
Figure 14. The comparison of geometry between main blade and splitter blade.
Processes 09 00499 g014
Figure 15. Axial forces of runner.
Processes 09 00499 g015
Figure 16. Pressure distribution and streamlines in the middle section of runner (Cp).
Processes 09 00499 g016
Figure 17. The leaning leading edge of runner studied in this paper.
Processes 09 00499 g017
Figure 18. Frequency domain diagram of dynamic stresses at TP6.
Processes 09 00499 g018
Figure 19. The pressure fluctuation measure points (P1 is the pressure fluctuation recording point in runner; P2 is the pressure fluctuation recording point in clearance).
Processes 09 00499 g019
Figure 20. Frequency domain diagram of pressure coefficient at TP6. (a) P1; (b) P2.
Processes 09 00499 g020
Figure 21. The peak-to-peak value of dynamic stress.
Processes 09 00499 g021
Figure 22. The dynamic stress amplitude of 1/4 VPF and VPF. (a) S3; (b) S5.
Processes 09 00499 g022
Figure 23. The mode shape of runner. (a) front view; (b) top view.
Processes 09 00499 g023
Figure 24. The pressure fluctuation amplitude at 1/4 VPF and VPF. (a) P1; (b) P2.
Processes 09 00499 g024
Table 1. Time points.
Time Point NumberTime [s]
TP13
TP26
TP39
TP412
TP515
TP618
TP721
TP824
TP927
Publisher’s Note: MDPI stays neutral with regard to jurisdictional claims in published maps and institutional affiliations.

