Article

Removal of Anionic and Cationic Dyes from Wastewater Using Activated Carbon from Palm Tree Fiber Waste

by
Basma G. Alhogbi
1,*,
Shoruq Altayeb
1,
Effat. A. Bahaidarah
1 and
Mahmoud F. Zawrah
2
1
Department of Chemistry, Faculty of Science, King Abdulaziz University, Jeddah 21589, Saudi Arabia
2
National Research Centre, Center of Excellence for Advanced Sciences-Nano Group, 12622 Dokki, Cairo, Egypt
*
Author to whom correspondence should be addressed.
Processes 2021, 9(3), 416; https://doi.org/10.3390/pr9030416
Submission received: 25 January 2021 / Revised: 11 February 2021 / Accepted: 19 February 2021 / Published: 25 February 2021
(This article belongs to the Special Issue New Processes: Working towards a Sustainable Society)

Abstract

:
This study focuses on using a facile method for the green preparation of activated carbon (AC) from palm tree fiber (PTF) waste. The synthesized cost-effective AC was investigated for the removal of an anionic dye (Congo red, CR) and a cationic dye (Rhodamine B, RhB) from wastewater. The morphological and structural characterization of the synthesized AC were performed by scanning electron microscopy (SEM), transmission electron microscopy (TEM), surface area, Fourier transform infrared spectroscopy (FTIR), total pore volume, average pore diameter and pore size distribution, zeta potential, and zero-point charge. To investigate the adsorption efficiency, different parameters such as adsorbent dosage, solution pH, initial dye concentration, and duration were applied using the batch experiments. Various adsorption isotherm and kinetics models were applied to study the adsorption mechanism and dynamics. The results showed that chemical activation with a weak acid (H3PO4) at 400 °C for 30 min is a fast method for the activation of each precursor and produces a high yield. The result of analysis showed an increase in the adsorption capacity at pH 2. The maximum adsorption capacity was 9.79 and 26.58 mg g−1 at 30 min for CR dye and RhB dye, respectively. The optimum adsorbent dosage for the activated carbon from palm tree fiber (PTFAC) was 0.15 g with a high percentage removal of CR (98.24%) and RhB (99.86%) dyes. The adsorption isotherm and kinetic studies were found to be favorable and feasible for assessing the adsorption of dyes with the Langmuir model and pseudo-second-order reaction, respectively. In addition, the AC showed reusability up to five cycles. The results showed that the synthesized AC was environmentally friendly and successfully removed dyes from wastewater.

1. Introduction

The continuous growing population and their requirements have seriously contaminated water with several undesirable materials, for example, artificial dyes [1]. Synthetic dyes obtained from organic or inorganic compounds are mainly composed of two compounds—chromophores and auxochromes. The chromophore produces the color of dye, whereas the auxochrome is responsible for the intensity of color [2,3]. Before the invention of artificial dyes in 1956, the natural dyes obtained from plant sources as roots, berries, bark, leaves, wood, fungi, and lichens were used [4]. After 1956, artificial dyes derived from petrochemicals were used as coloring agents for several products in the market. Additional engaging colors have been introduced to various advanced industries such as textiles, paper, animal skin tanning, food processing, plastic, cosmetic, and dye-producing industries [5]. Synthetic dyes are usually carcinogenic, cause serious damage to water resources, and contribute to environmental pollution. The environmental and health concerns associated with the wastewater effluents have led scientists to search for simple, inexpensive, and rapid solutions. The putrefaction of dyes from wastewater can be done using three methods, namely physical, biological, and chemical methods [6]. These include precipitation, oxidation, coagulation, adsorption, and membrane separation [7,8,9]. Among these methods, adsorption is a cost-effective, simple, and feasible technique for the removal of organic dyes from wastewater. Many synthetic ingredients have been effectively used as adsorbents for the elimination of contaminants from water [10,11,12].
Among them, activated carbon (AC) is considered as the most commonly used adsorbent in the industry for the removal of contaminants [13]. The pore structure of the AC is quite developed with a high surface area and good adsorption capacity. The external chemical functional groups and structural properties of AC make it suitable for many applications used for the elimination of organic and inorganic contaminants from contaminated water [14,15]. However, the fabrication of marketable AC is costly; thus, research attention has been paid to develop a low-cost and competent AC using several sources. The production of AC from natural sources or agroindustry wastelands was considered because they are renewable, highly available, and cost-effective, and they have good properties. Thus, their disposal is required for a cleaner environment. In this regard, many researchers have reported on the preparation of AC from various industrial denim fabric waste [16] and agriculture waste (biomasses) such as coconut coir, apricot stones [17], Nigella sativa L [18], palm shell [19], pecan shell [20], pine cone [21], tapioca peel [22], macadamia nutshell [23], Mucuna pruriens and Manihot esculenta [24], snail shell [25], and tea leaves [26].
There are two methods to produce AC: physical and chemical activation. In physical activation, raw material is carbonized and then activated with steam and carbon dioxide. Chemical activation involves the impregnation of a chemical-activating agent in the precursor material followed by activation at temperatures between 400 and 700 °C under the nitrogen atmosphere [27]. The advantages of chemical activation are the following: (a) it occurs in a shorter time compared to that prepared by physical activation; (b) the produced AC has a high surface area with high yield; and (c) the activating chemical agent influences the breakdown of carbon and prevents the development of tar and volatile substance, thereby increasing the yield of AC. In addition, in the case of chemical activation, the process of dehydration and oxidation requires lower temperatures compared to that in the physical activation [28]. In the chemical activation method, ZnCl2, KOH, and H3PO4 are extensively used as chemical-activating agents for the activation of lignocellulosic materials, which have not been carbonized. In addition, KOH is used for the activation of coal precursors or chars. The most common of activating agents include KOH and ZnCl2 since they provide microporous features, which restricts these materials’ applications for the adsorption of high molecular weight molecules in aqueous solution [16]. Thus, attempts were made toward the use of H3PO4 as a proper and low-cost activating agent for of AC as reported earlier for many biosorbent lignocellulosic material [16]. In the literature, various parameters were studied such as the concentration of activation agent, temperature, and activation time [29,30,31].
The present study focuses on the facile preparation of AC from biomass by chemical and thermal activation methods. The vast number of date palm trees in Saudi Arabia is about 23 million. Thus, palm tree fiber (PTF) is one of the greatest freely existing biomasses, and it is common agricultural waste in Saudi Arabia. Therefore, PTF has been chosen as the specific biomass in order to produce more economical Ac and easy accessibility collection [32]. The parameters such as the activation agent, activation temperature, and activation time were investigated for PTF activation in this study. Another goal of the study was to use various analytical techniques to examine the efficiency of the prepared AC to remove anionic dye Congo red (CR) and cationic dye rhodamine B (RhB) from polluted water. The influence of initial concentration, duration, adsorbent dosage, and pH on the adsorption of CR and RhB were studied. Performing equilibrium isotherm and kinetics of adsorption for CR and RhB as well as exploring the re-generation of used activated carbon from palm tree fiber (PTFAC) were also considered as the main objectives.

2. Materials and Experimental Procedures

2.1. Instruments

The pH values of dyes and adsorbent powder were measured using a pH meter (MP220; Mettler Toledo). A cyclone mill (CT 193 CyclotecTM; Mill Collection) was used to ground the sample, and the sample was sifted by a KimLab ISO 3310 Std Test Sieve; the required size was a 0.43 mm mesh size. The mixtures were agitated using a reciprocating shaker (cat. no. 3006; GFL Shakers). The samples were carbonized in a muffle furnace (A-550; Vulcan), and after washing, they were dried in an oven (FN 055/120 Dry Heat Sterilizers). The spectroscopic reading was generated by using a UV-vis spectrophotometer (UV-1650PC, Shimadzu). Transmission electron microscopy (TEM) was performed using JEM-1230 (JEOL). The zeta potential of the PTFAC was measured by a Zetasizer (version 7.04, serial number MAL 1074157; Malvern Instruments). Scanning electron microscopy (SEM) was performed by Quanta FEG250. Fourier transform infrared spectroscopy (FTIR) was conducted by using a Spectrum Two FTIR Spectrometer (PerkinElmer) at the absorption spectra range of 4000–400 cm−1.

2.2. Materials and Chemical Reagent

Palm tree fiber waste was collected from the locally available palm trees on the campus of King Abdulaziz University, Jeddah, Saudi Arabia. The PTF was washed multiple times with hot distilled water to eliminate dust and impurities and then dried in sunlight for a few days. The dried palm fiber was crushed to powder form, sifted to the desired particle size, and used to prepare the AC. The obtained granular particle size of the pulverized fiber was approximately 0.43 mm. Raw materials and the prepared AC are shown in Figure 1.
Congo red anionic dye (HiMedia) and RhB cationic dye (Sigma Chemical) were used as adsorbates (Table 1). Stock dyes solution (1000 mg L−1) was made by dissolving a suitable amount of dye powder, which was accurately weighed on an electronic balance using deionized water. During the adsorption experiments, a diluted dye solution that had a concentration between 5 and 50 mg L−1 was prepared from the stock solution. The chemicals reagents such as H3PO4, H2SO4, HCl, and KOH were supplied by Fisher Scientific.

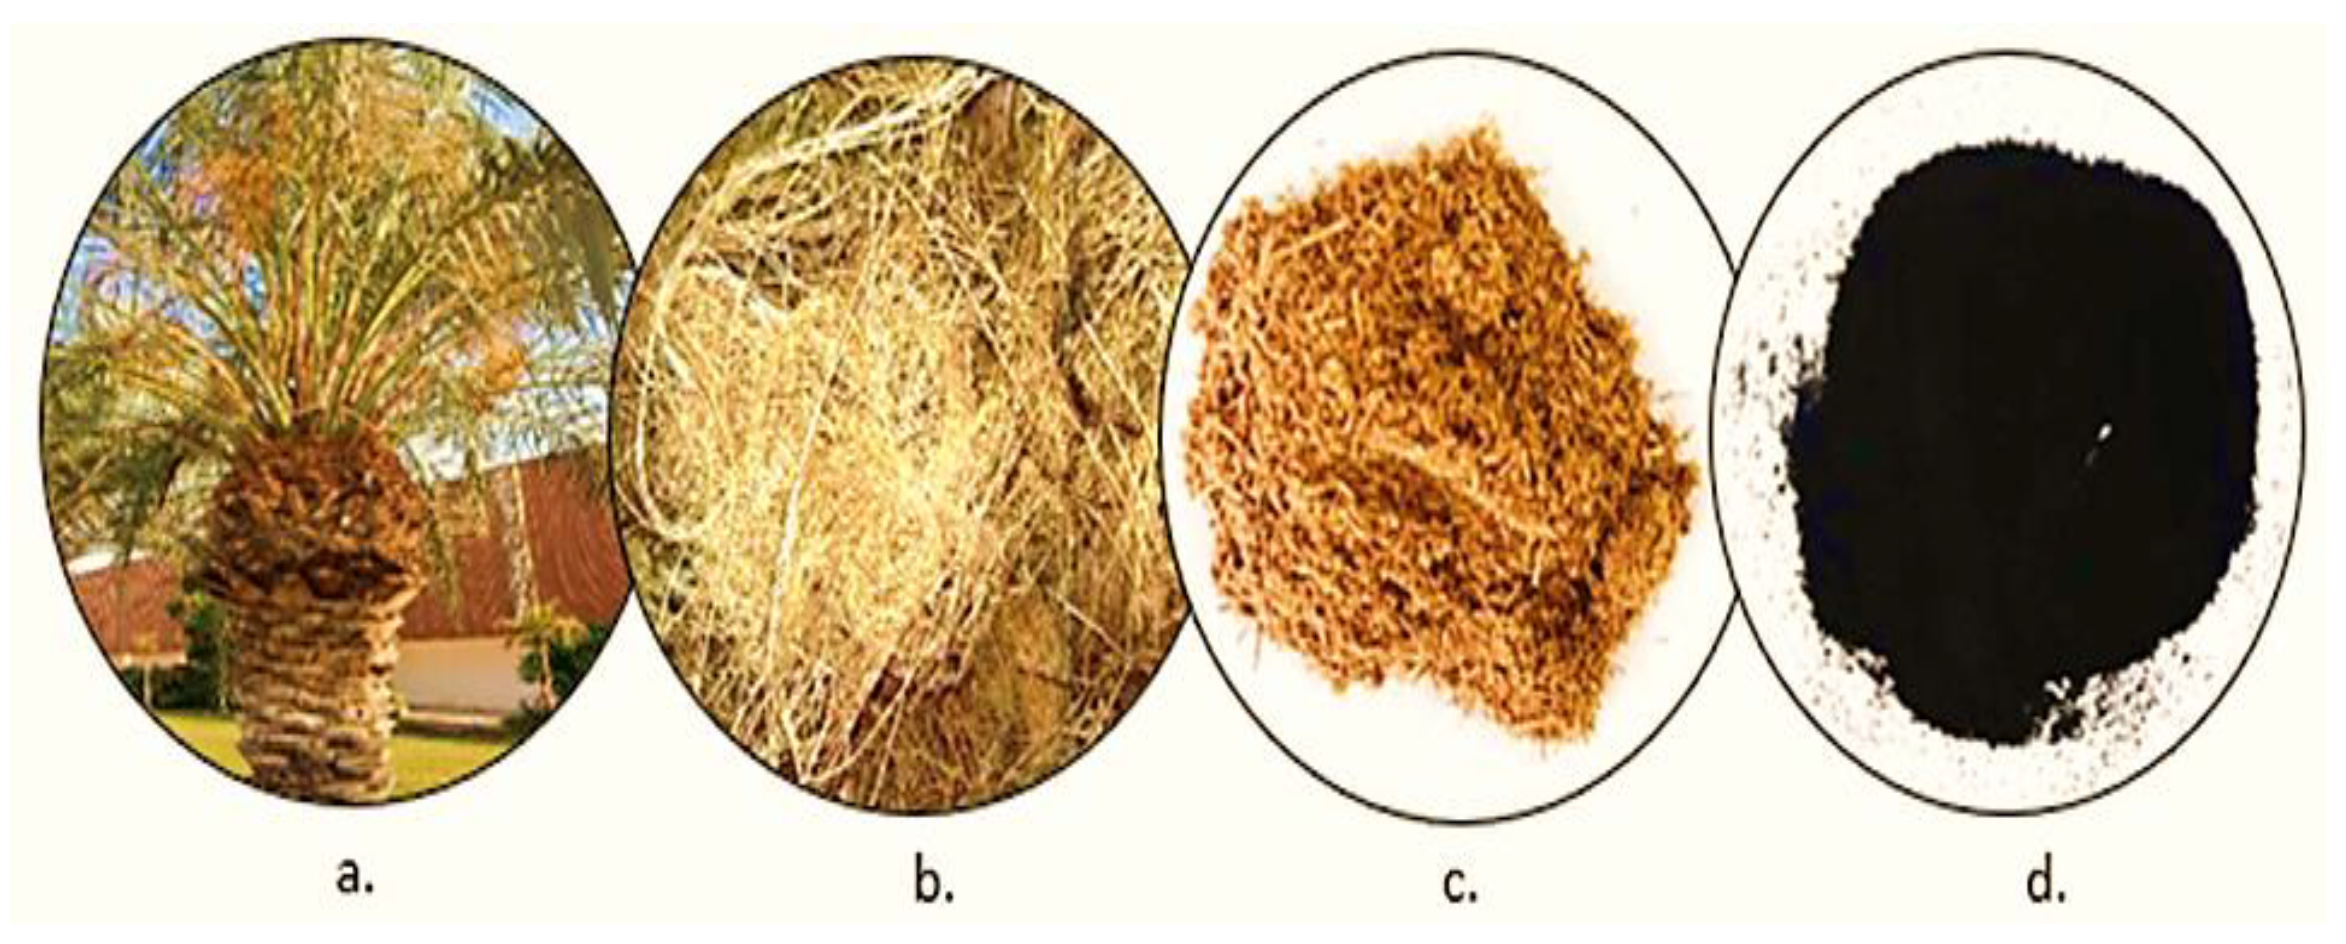
2.3. Chemical and Thermal Activation of Carbon from Palm Tree Fiber

The activation was carried out by impregnation of the PTF with various chemical agents as such as phosphoric acid (85%), sulfuric acid (98%), and potassium hydroxide (2 M) with an impregnation ratio of chemical/biomass being 3:1. The duration of the process was 24 h. The experiment was done under full safety precautions. Inside a fume hood, the chemical agent was added gradually to PTF to obtain a mixture. Then, the slurry was filtered, washed, and dehydrated in a dryer oven at 130 °C for 2 h. The designed samples of chemically activated carbon PTF were termed as CAPTF-H3PO4, CAPTF-H2SO4, and CAPTF-KOH. The pyrolysis process was carried out to increase the efficiency of the fibers activated by phosphoric acid (85%). The fibers were carbonized at 200, 300, 400, 500, 600, and 700 °C several times (30, 60, 120, and 180 min) in a muffle furnace using a covered porcelain crucible for reduced oxygen. Then, they were cooled at room temperature and soaked in 1.0 M NaOH for 2 h. After soaking, the obtained materials were washed thoroughly with hot distilled water followed by cold distilled water to remove all free acid until they attained a neutral pH. Then, they were oven-dried at 130 °C for 2 h. Finally, the dried materials were milled into a fine powder and kept in a plastic bag until used. The samples produced by activated carbon palm tree fiber were termed as PTFAC, as shown in Figure 1.
The adsorption process was performed by the batch-adsorption method. To select the fiscal chemical-activating agent (i.e., H3PO4, H2SO4, or KOH), the best pyrolysis temperature (200, 400, 600, or 800 °C), and suitable time (30, 60, 80, and 120 min) to remove CR and RhB dyes, the synthesized PTFAC were conducted under the following conditions: volume of dye solution = 20 mL, initial concentration = 25 mg L−1, contact time = 120 min, temperature = 25 °C, adsorbent dose = 0.1 g, agitation speed = 300 rpm, pH = natural.

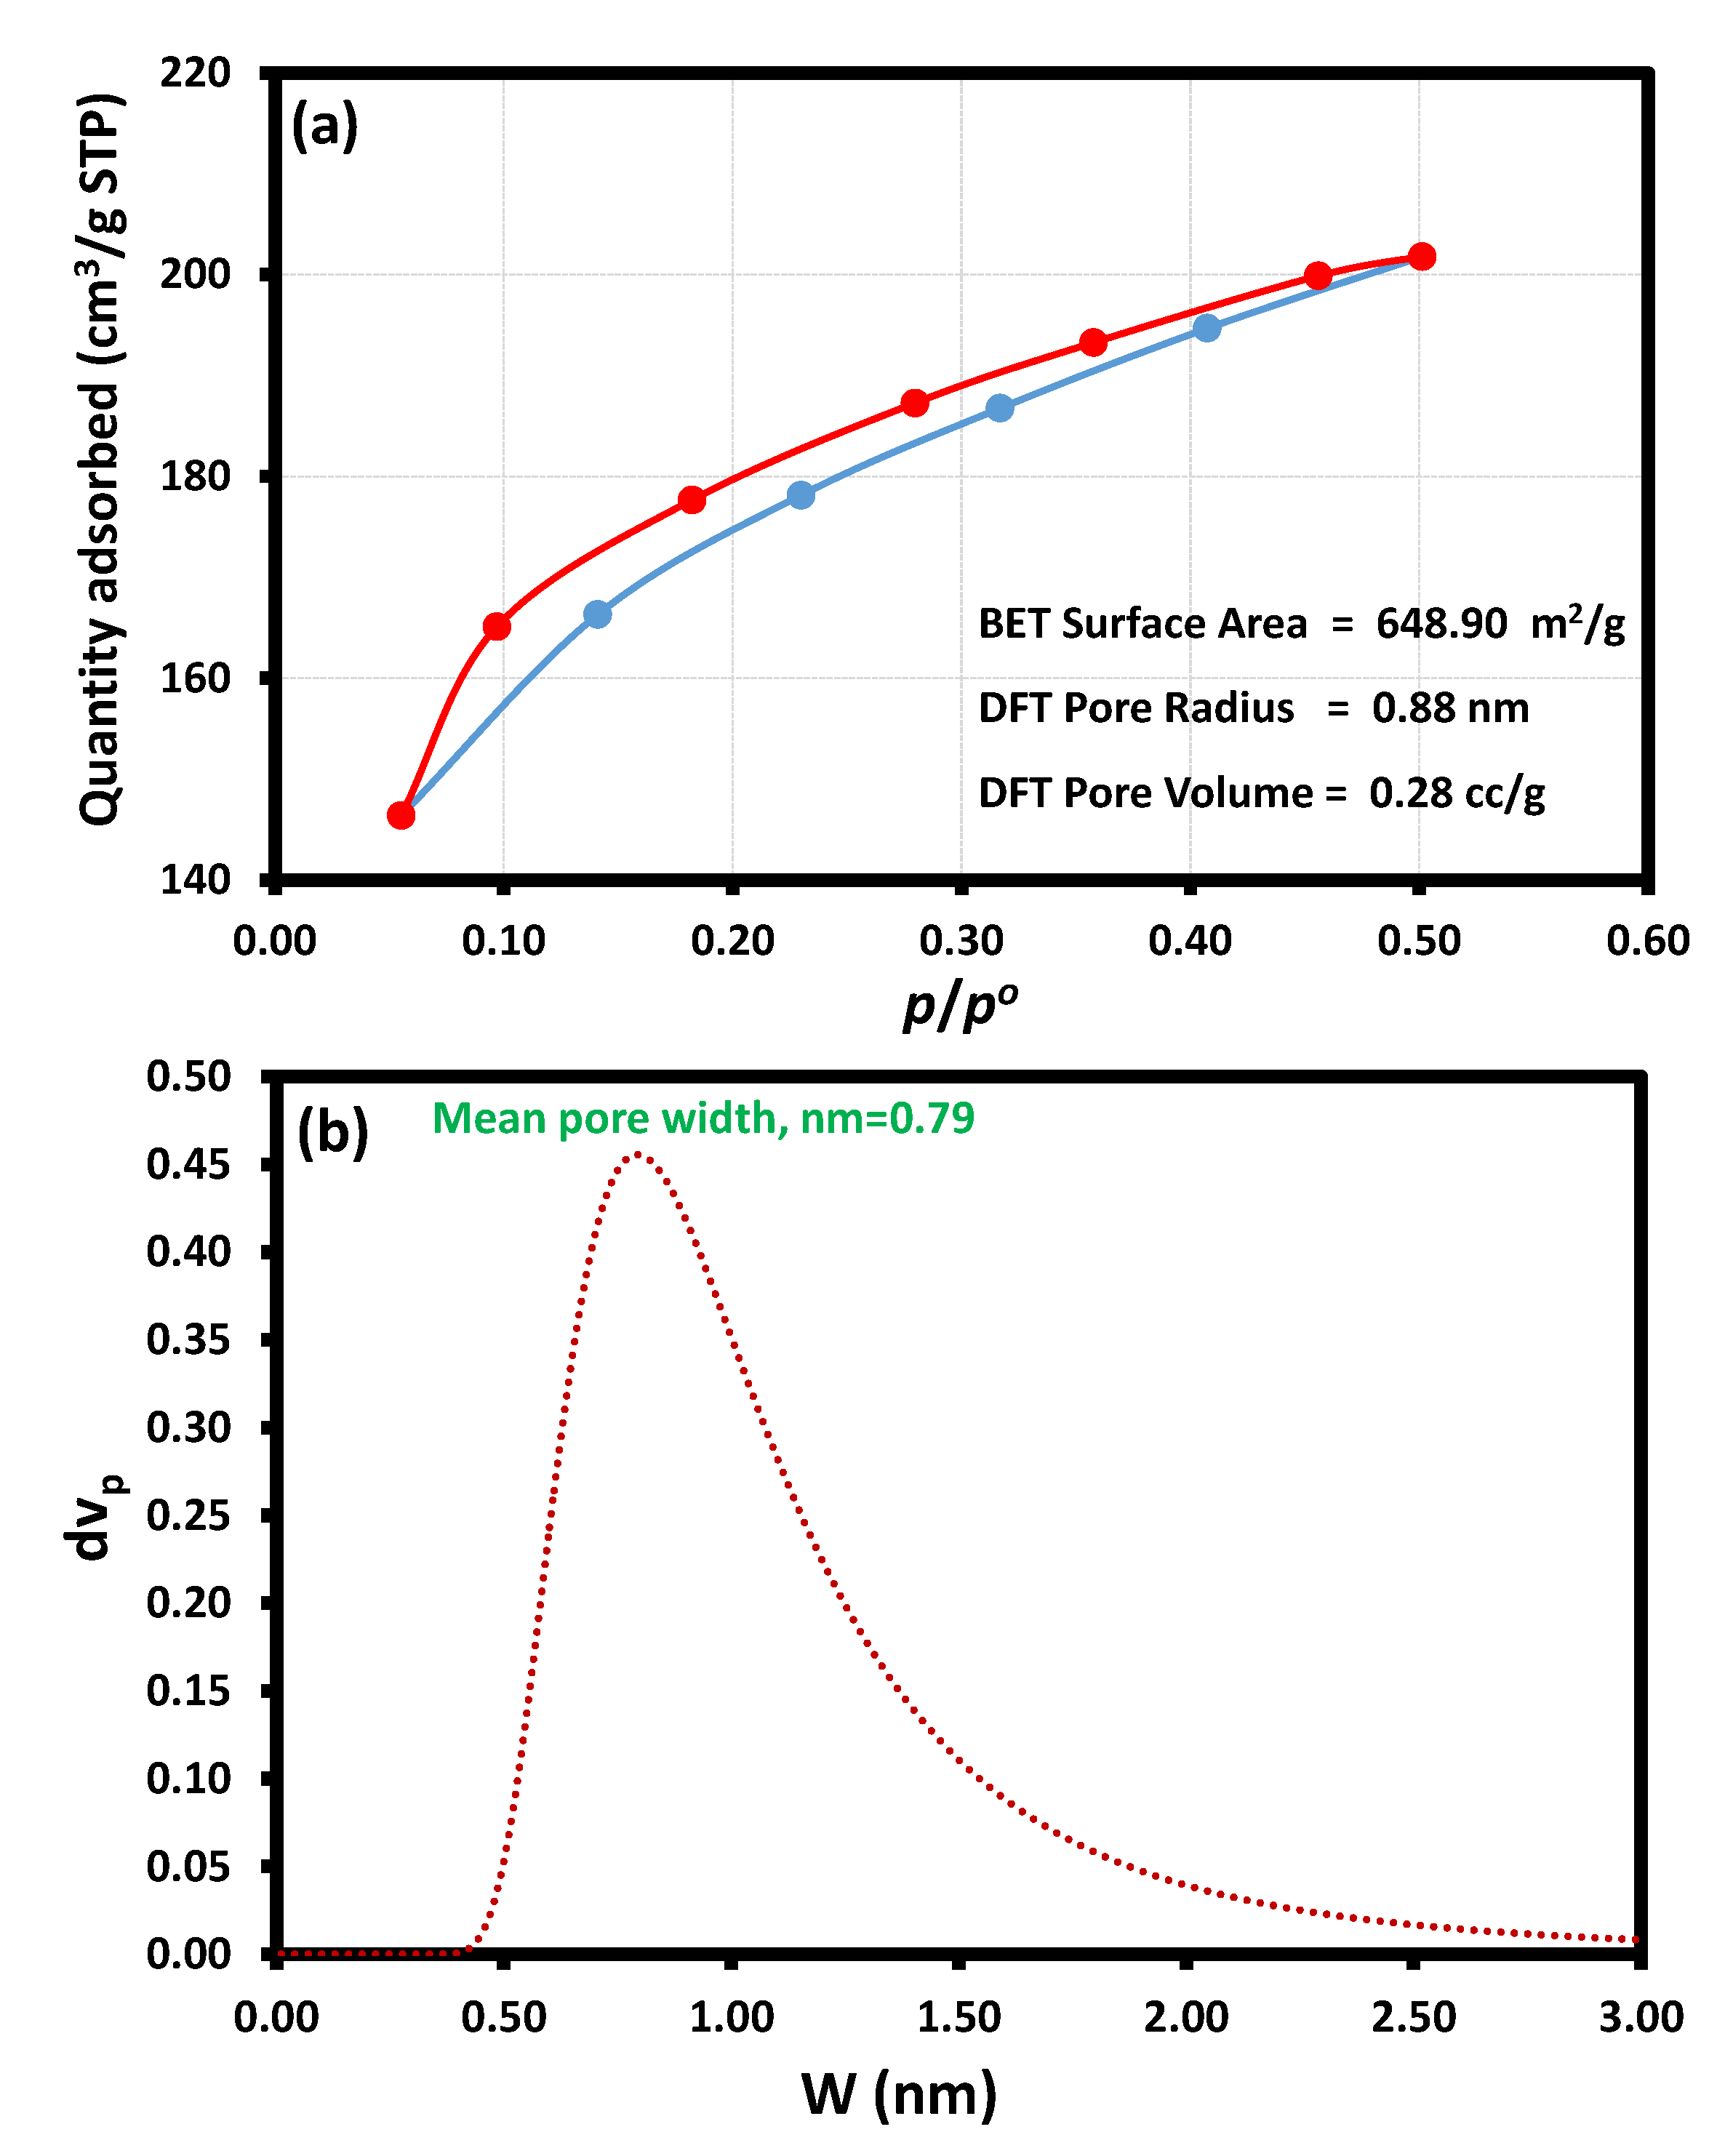
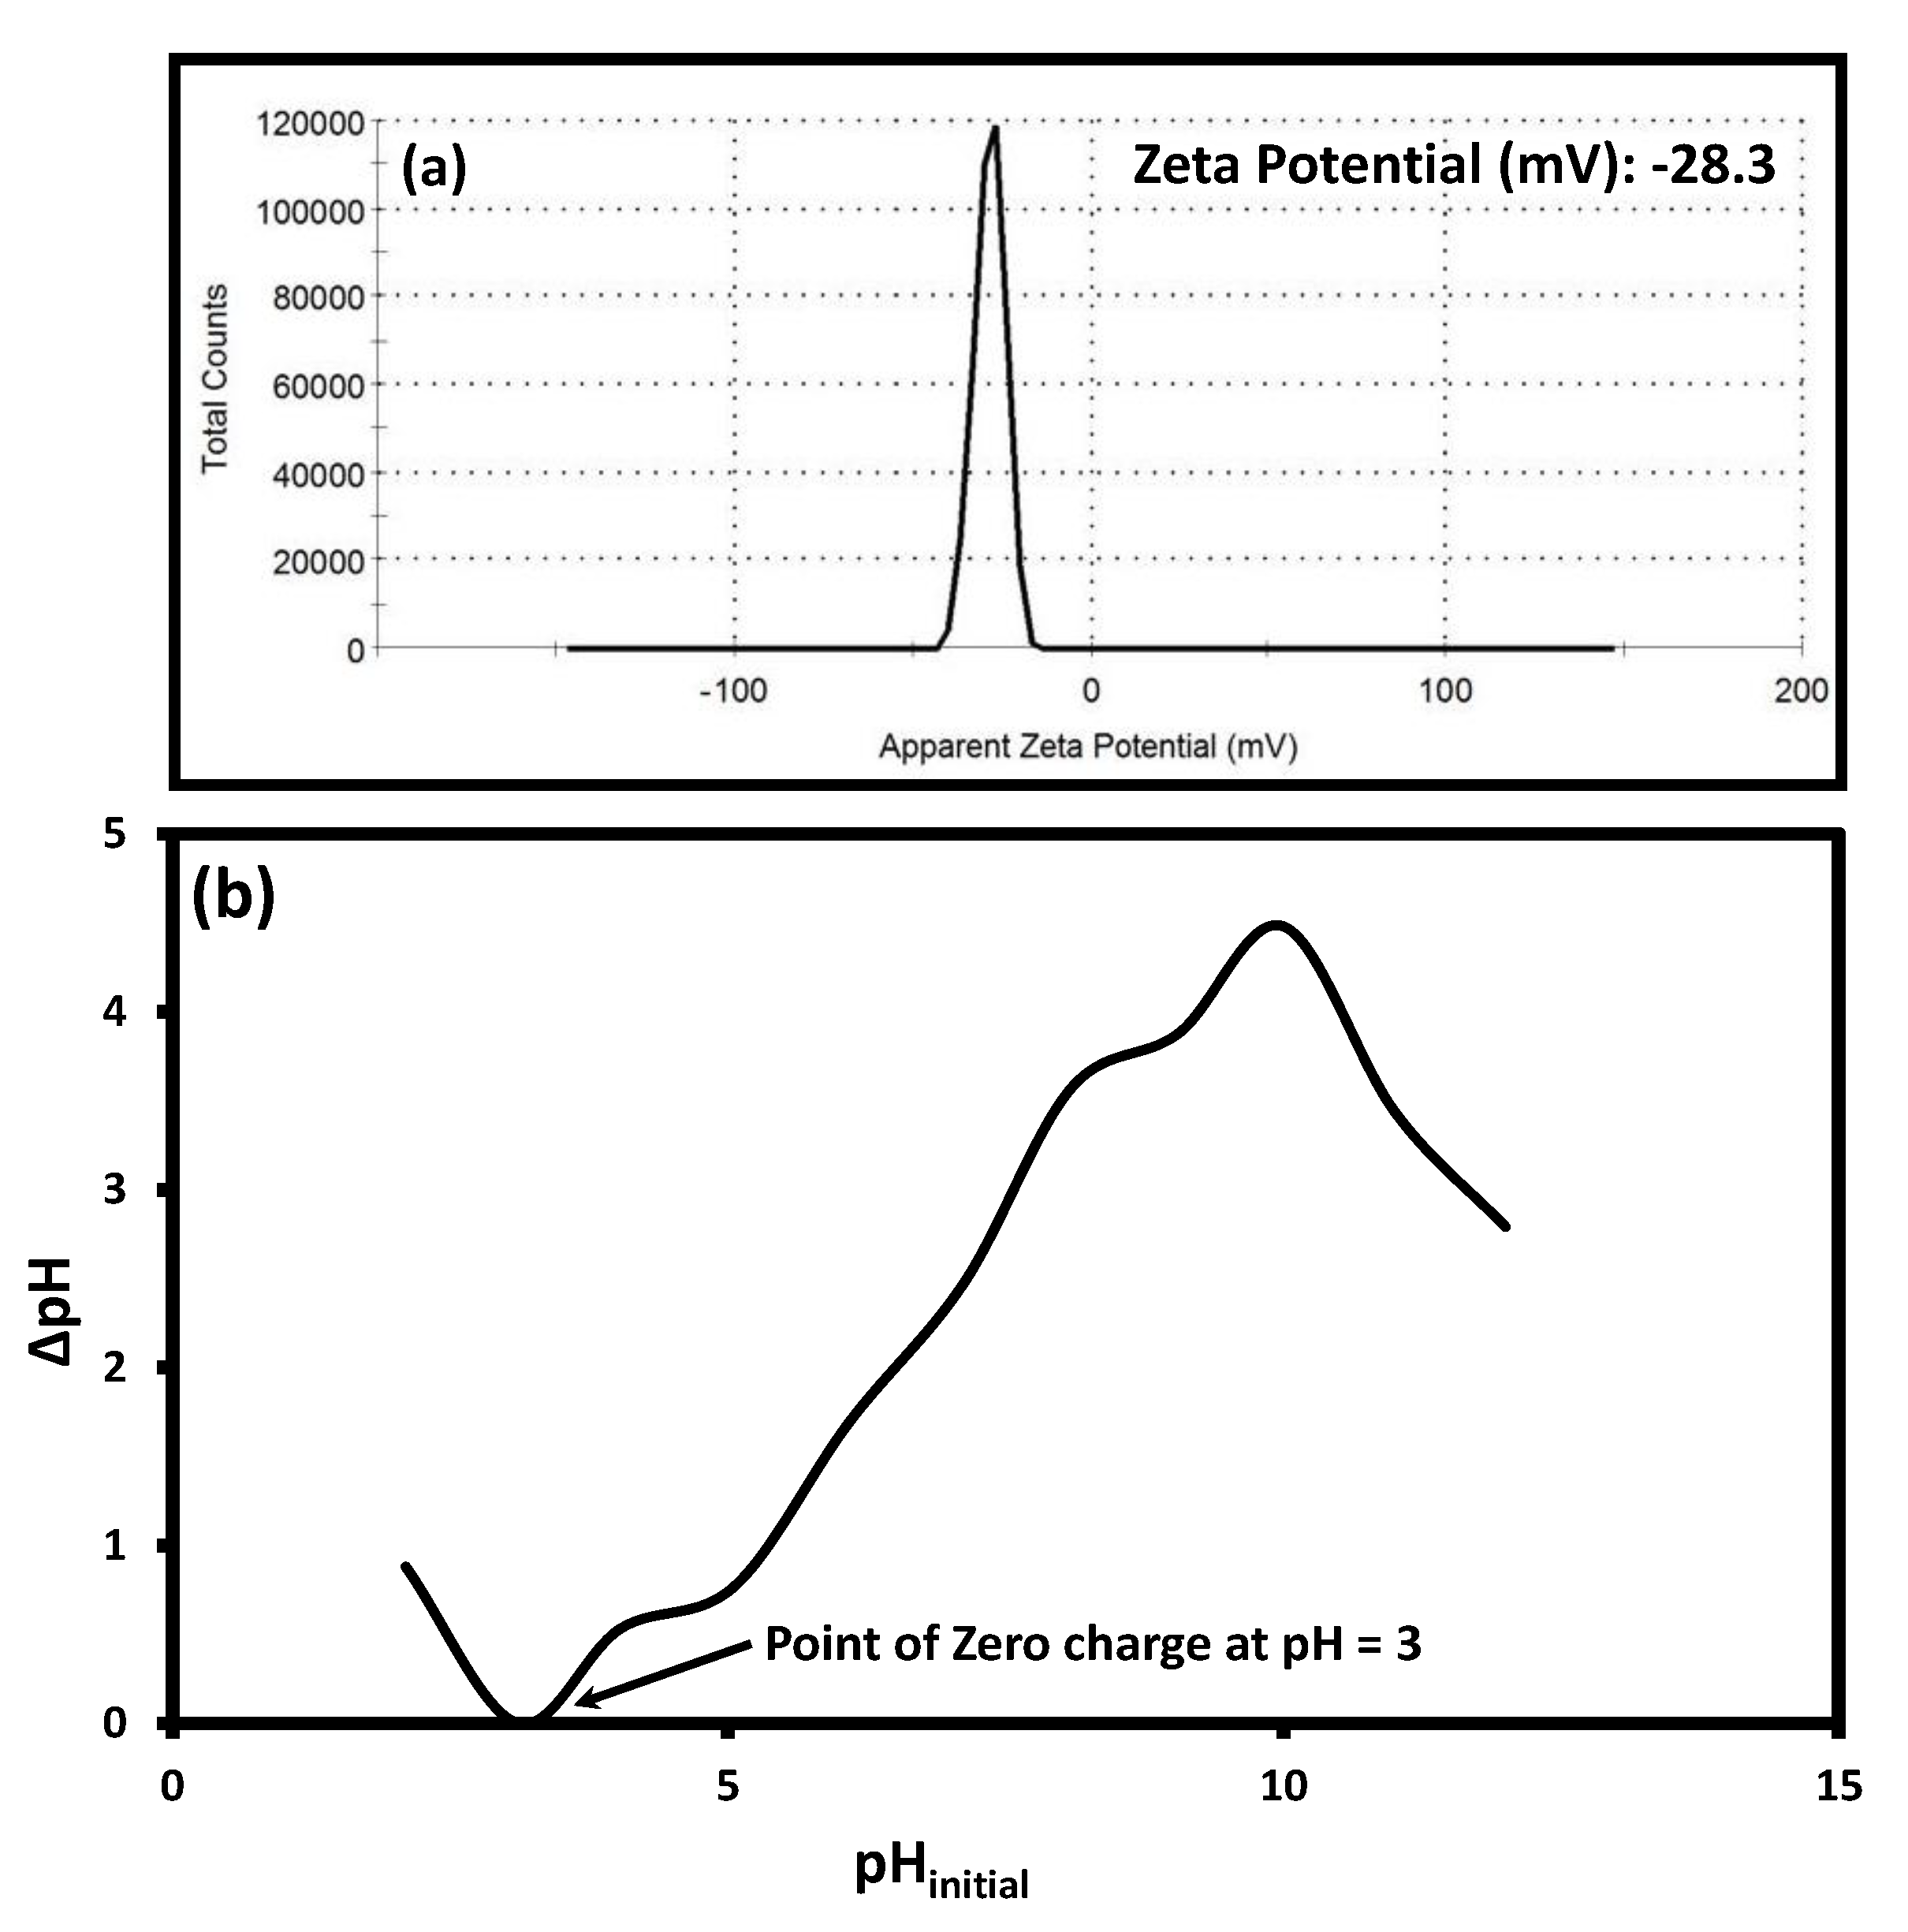
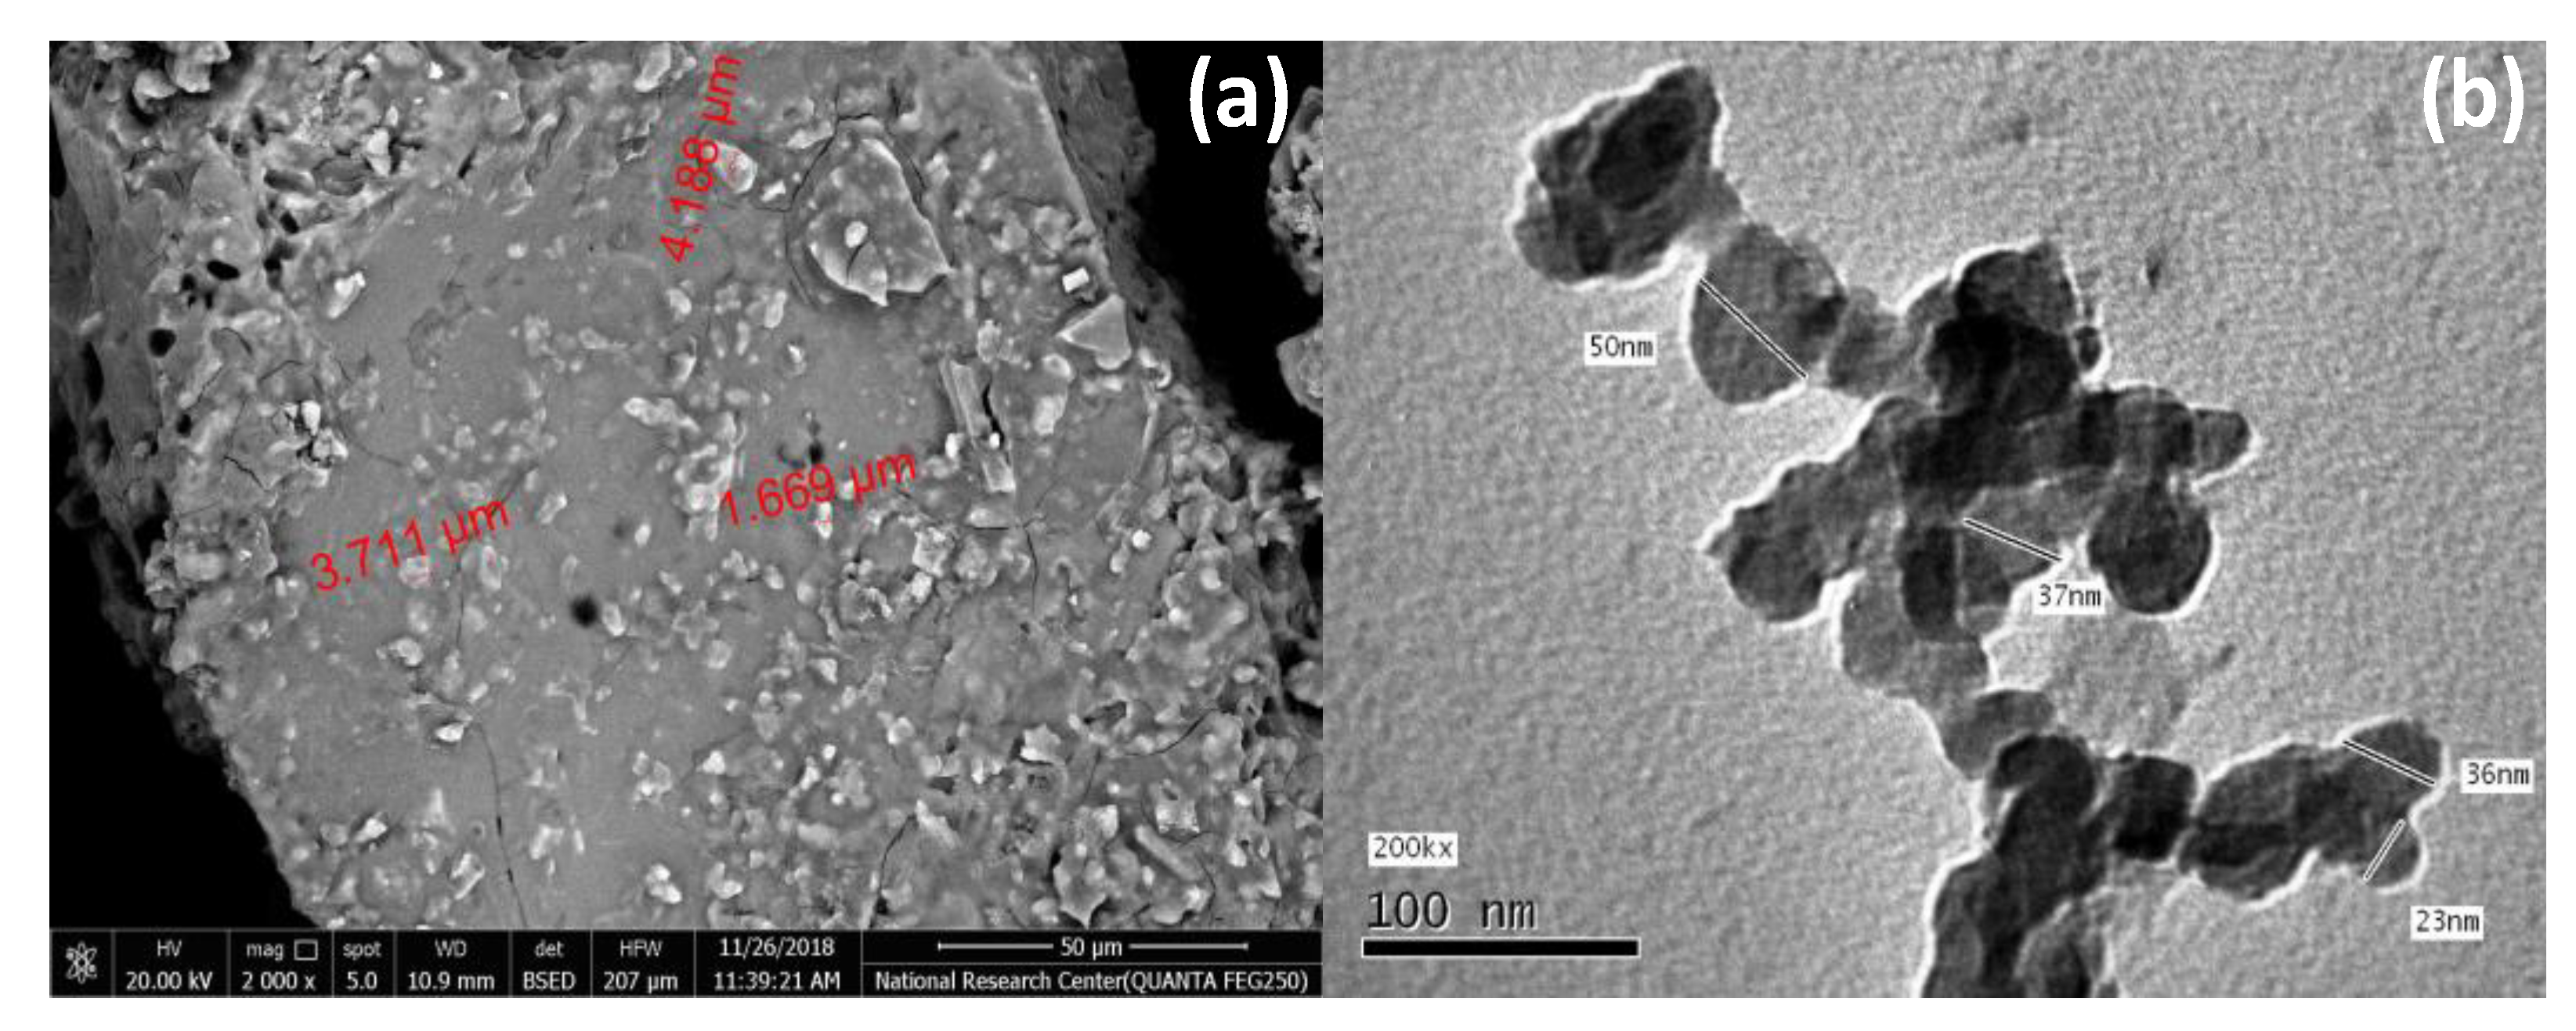
2.4. Characterization of AC

The specific surface area, total pore volume, average pore diameter, and pore size distribution of the prepared AC were examined by Brunauer–Emmett–Teller (BET) N2 adsorption method. The presence of porosity, microanalysis, and surface morphology of the PTFAC carbonized at 400 °C were studied by using the SEM and TEM. The FTIR technique was used to study the effect of chemical treatment on biomasses and to recognize various functional groups present on the surface of the materials. This technique was used to examine the surface functional groups of the ACs.
Zeta potential measurement was used for determining the surface charge of AC particles in the solution. In other words, the possible difference between the dispersion medium and the stationary layer of fluid attached to the particle was measured by zeta potential. The pH of the solution with distilled water was measured as follows: the mixture was prepared in a ratio of 10 mL water to 1.0 g of carbon; this mixture was stirred, and the pH was measured several times until a constant value was reached. The pH of zero-point charge (pHzpc) for AC was determined by the batch equilibrium method. During the measurement, the solid/liquid ratio was 1:1000; that is, 0.05 g AC was added to 50 mL of water. This suspension was left for 48 h, and the pH was measured and found to be 3. In another experiment, 0.05 g of AC was mixed with 50 mL of 0.1 M NaCl, and the pH of solution was fixed between 2 and 12 by 0.1 M hydrochloric acid or 0.1 M sodium hydroxide. The solution was stirred for 48 h on a shaker bath at an agitation speed of 120 rpm and at room temperature (25 °C). Thereafter, the final pH values were recorded, and the difference between the original and final pH values (ΔpH = pHinitial − pHfinal) was calculated and compared with the initial ones.

2.5. Adsorption Processing

The adsorption of dyes onto PTFAC was assessed using batch adsorption experiments. The procedure was performed as follows: First, a series of dye solutions with initial concentrations of 5.0–50 mg L−1 was prepared. Second, dye solutions with different pH values (2.0–12) were prepared. Finally, 20 mL of dye solution was added into 50 mL volumetric flasks with different amounts of PTFAC adsorbent doses (0.05–0.25 g). Then, the mixtures were stirred in a shaker at an agitation speed of 250 rpm at different times (5.0–120 min) at room temperature. The solutions were filtered using the Whatman Qualitative Filter Paper Grade 2. The dye concentration was determined by using the UV-visible spectrophotometer at wavelength 554 nm and 496 nm for RhB and CR dyes, respectively. All the experiments were performed in triplicate, and the mean values were recorded. The amount of all dyes adsorbed by the PTFAC and the removal percentage was calculated by Equations (1) and (2), respectively:
R e m o v a l   % = C o C e C o × 100
q e = ( C o C e ) m × V
where qe is the quantity of adsorbed dye on 0.1 g of PTFAC (mg g−1), Co is the original dye concentration (mg L−1), Ce is the residual concentration of the solution at equilibrium (mg L−1), V is the volume of dye solution (L), and m is the amount of the adsorbent PTFAC (g).

2.6. Desorption Studies and Regeneration

To understand the sustainability of regenerating the AC and make the process more economical, desorption trials were performed to determine the efficiency of the AC. The traits of an excellent adsorbent should include not only high adsorption capacity but also reduction of the overall cost of the adsorbent by possessing high desorption capacity. Desorption studies of PTFAC were carried out using different concentrations of acetic acid CH3COOH, sodium hydroxide NaOH, and different pH values of distilled water. The R-PTFAC is a sample after adsorption used to study the regeneration and recycle. Thereafter, 0.1 g R-PFAC was added to 50 mL desorption solutions (0.1, 0.5, 1.0 M NaOH; 0.1, 0.5, 1.0 M CH3COOH) and distilled water and the pH was adjusted (2.5, 4.5, 6.5, 8.5, and 10.5). Then, it was stirred in a shaker at 250 rpm for 3 h at room temperature. After desorption, R-PTFAC was washed with distilled water until it became neutral and was reused for the removal of RhB and CR dyes from solution. The adsorption–desorption studies were performed for five sequential cycles. The dye concentration in the filtrate was examined by the UV–vis spectrophotometer. The effectiveness of the desorbed dye from AC was evaluated by Equation (2).

2.7. Application of Real Water Samples

The real water samples were collected from the water sewage treatment plant and tap water at King Abdulaziz University, Jeddah City. The well water and seawater samples were collected from Rabigh City. The samples were applied by the adsorption of dyes onto the PTFAC using batch experiment. Under the same condition of the adsorption process, the removal percentage was calculated by Equation (2).

3. Results and Discussion

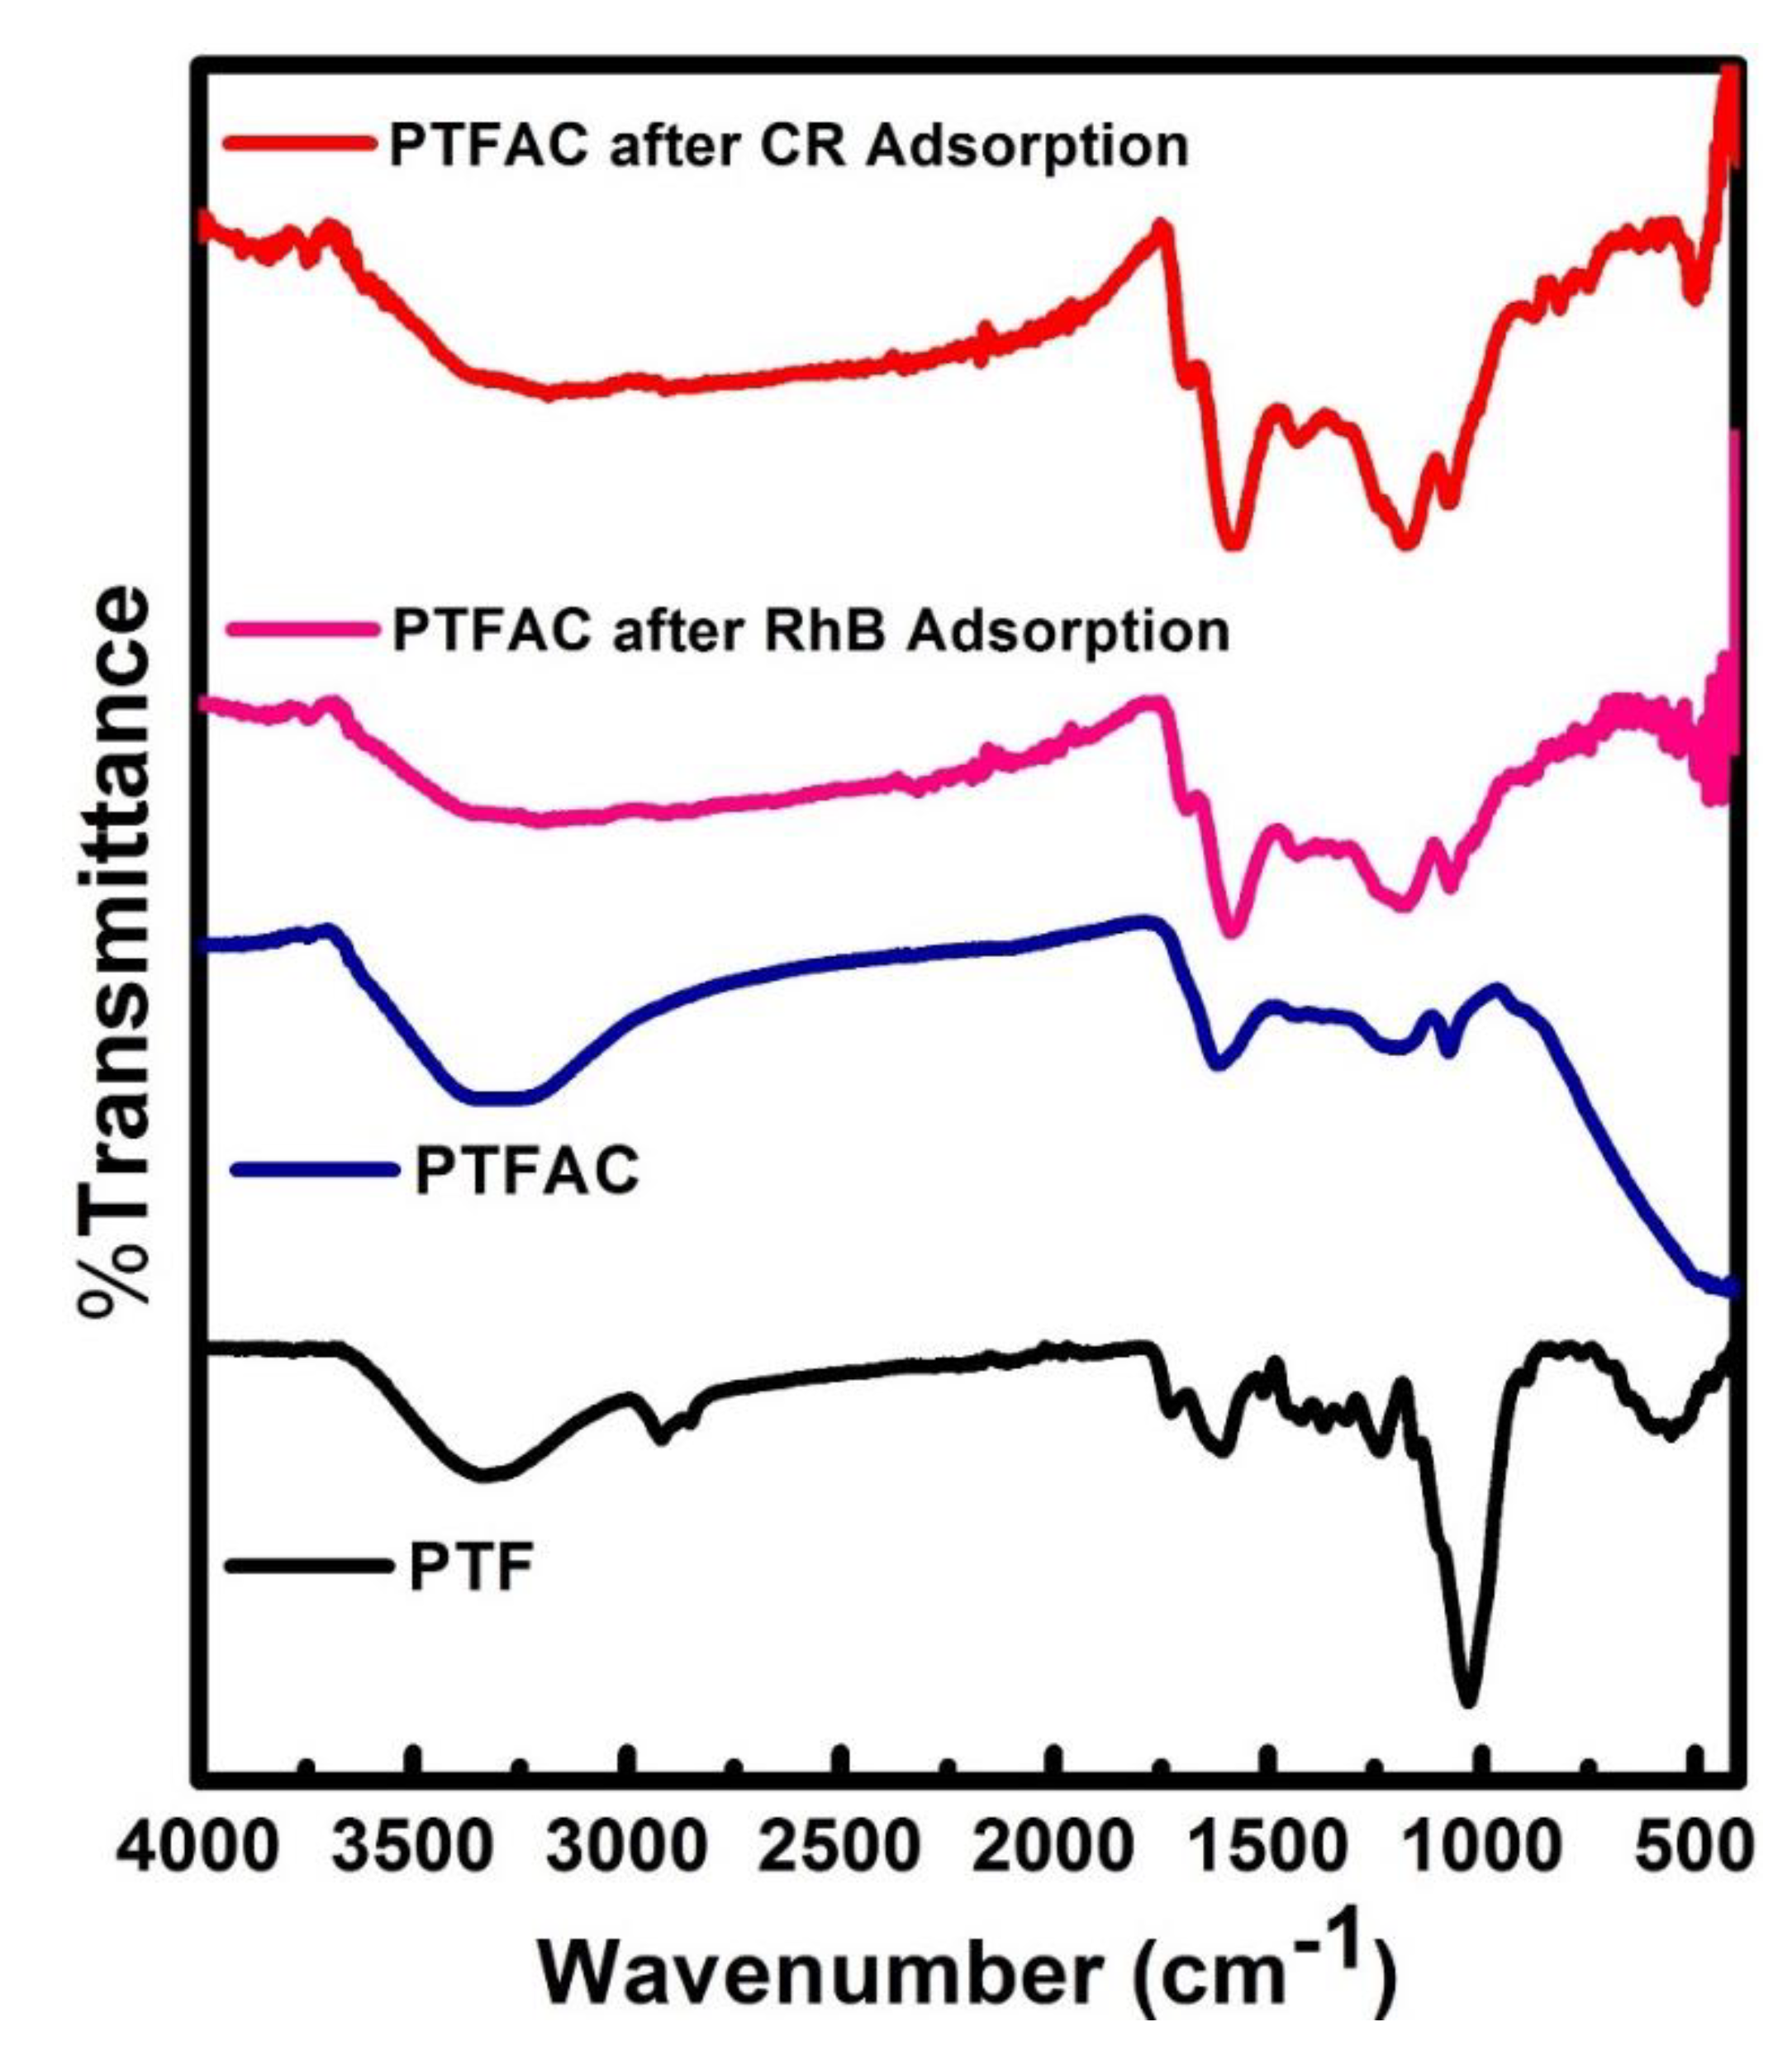
3.1. Physical Properties, Characterization, and Morphology of Synthesized PTFAC

Surface area, total pore volume, and mean pore diameter of the prepared AC, as determined by adsorption/desorption isotherm of nitrogen, are shown in Figure 2a. As a result, the prepared AC has a 648.90 m2 g−1 (BET) specific surface area and 2.83 cm3 g−1 total pore volume. It is noteworthy to mention that the specific surface area for the raw material before activation was 9.0 m2 g−1 [33]. As per the results of adsorption/desorption isotherms presented in Figure 2a,b, the AC carbon follows type V isotherm of mesoporous materials with a 0.79 nm mean pore diameter, and the process is proceeded with multilayer adsorption. The data found are in line with the surface area value reported in the literature based on the modification method such as chemicals, physical, or pyrolysis activation [17].
On the other hand, the zeta potential and zero-point charge of the prepared AC are presented in Figure 3. The prepared PTFAC shows a zeta potential value of −28.3 mV and has high surface electronegativity. The pH values for PTFAC in a solution and pHzpc were 3.56 and 3, respectively. This means that the surface of PTFAC behaves as positively charged under a pH value of 3 and negatively charged beyond a pH value of 3 [34]. In addition, similar values of pHzpc have been reported for white pine sawdust (pHzpc 3.65) [35] and Virgin Granular AC activation by HNO3 (pHzpc 3.0) [36], which are close to the value observed in this study.
Figure 4 shows the SEM image of the palm fiber carbonized at 400 °C and TEM image of the AC after grinding. Figure 4a show that after thermal treatment, the fiber is converted into a skeleton of carbon grains with a size range between 1 and 4 µm. The TEM image of PTF shows a rough surface and porosity (Figure 4a). Meanwhile, the SEM image of raw biomass PTF is reported in ref. [33]. The PTF has a rough surface with no evidence of porosity and is covered by arrays of protrusions, which can be Si particles. The porosity of carbon is due to the decomposition of lignin, cellulose, and hemicellulose during carbonization, resulting in the formation of micropores and mesopores [37,38]. The cell structure of the PTFAC can be seen clearly by TEM. After grinding, the particles were converted into rounded and edged grains with a size range of 20–50 nm (Figure 4b). Furthermore, the TEM image of raw biomass PTF indicates that the cell wall structure of the fiber is almost round [36].
The examination of the prepared AC before and after the adsorption of dyes by FTIR can give better insight into the expected attraction forces between the PTFAC and dyes. Figure 5 shows the FTIR spectra of the PTF and after the adsorption of CR and RhB dyes by PTFAC. As shown in Figure 5, the following function groups are detected in the spectra: the band observed at around 3335 cm−1 in the fiber and PTFAC spectra was attributed to the O–H stretching of the hydroxyl group of alcohol present in cellulose and lignin, and the band at 1625 cm−1 was attributed to O–H bending of adsorbed water [39,40]. The band at 2900 cm−1 was ascribed to the unsaturated C–H stretching vibration of the alkene or aromatic groups [39]. The band observed at around 2925 cm−1 in the spectrum of fiber was attributed to C–H vibration of organic matters in the fiber, which had nearly vanished in the PTFAC, indicating that most of the elements such as hydrogen and oxygen are removed after activation [16,41]. The bands at around 1605–1620 cm−1 were attributed to the C=C stretching vibration in the aromatic rings [42]. The bands between 1238.81 cm−1 and 1032.31 cm−1 were attributed to the C–O stretching in carboxylic groups present in cellulose, typically originating from the oxidized carbon [18,20]. The FTIR spectrum of PTFAC demonstrates significant change by lowering peaks intensities when contrasted to the PTF spectrum. The bands between 1220 and 1118 cm−1 can also ascribed to phosphorous species, such as hydrogen-bonded P=O, stretching vibrations O–C in P–O–C of aromatic, P=OOH, and polyphosphate chain P–O–P [29,31]. In addition, the band around 1032.31 cm−1 assigned to the silicon atom initially attached to the oxygen atom Si–O [43]. The bands observed at around 470 cm−1, the spectra of carbons, were assigned to the siloxane Si–O–Si group [43]. When the surface of PTFAC was covered by dyes, most of its characteristic bands disappeared or mostly evanesced due to the adsorption of dye on its surface. For example, O–H, C=C, and C–O bands and all types of phosphorous species bands and Si–O–Si groups disappeared. This observation enhances the electrostatic attraction forces between the adsorbent and adsorbed dyes through noncovalent interactions, which may include dipole–dipole interaction, intermolecular forces, and hydrogen bonding interaction.

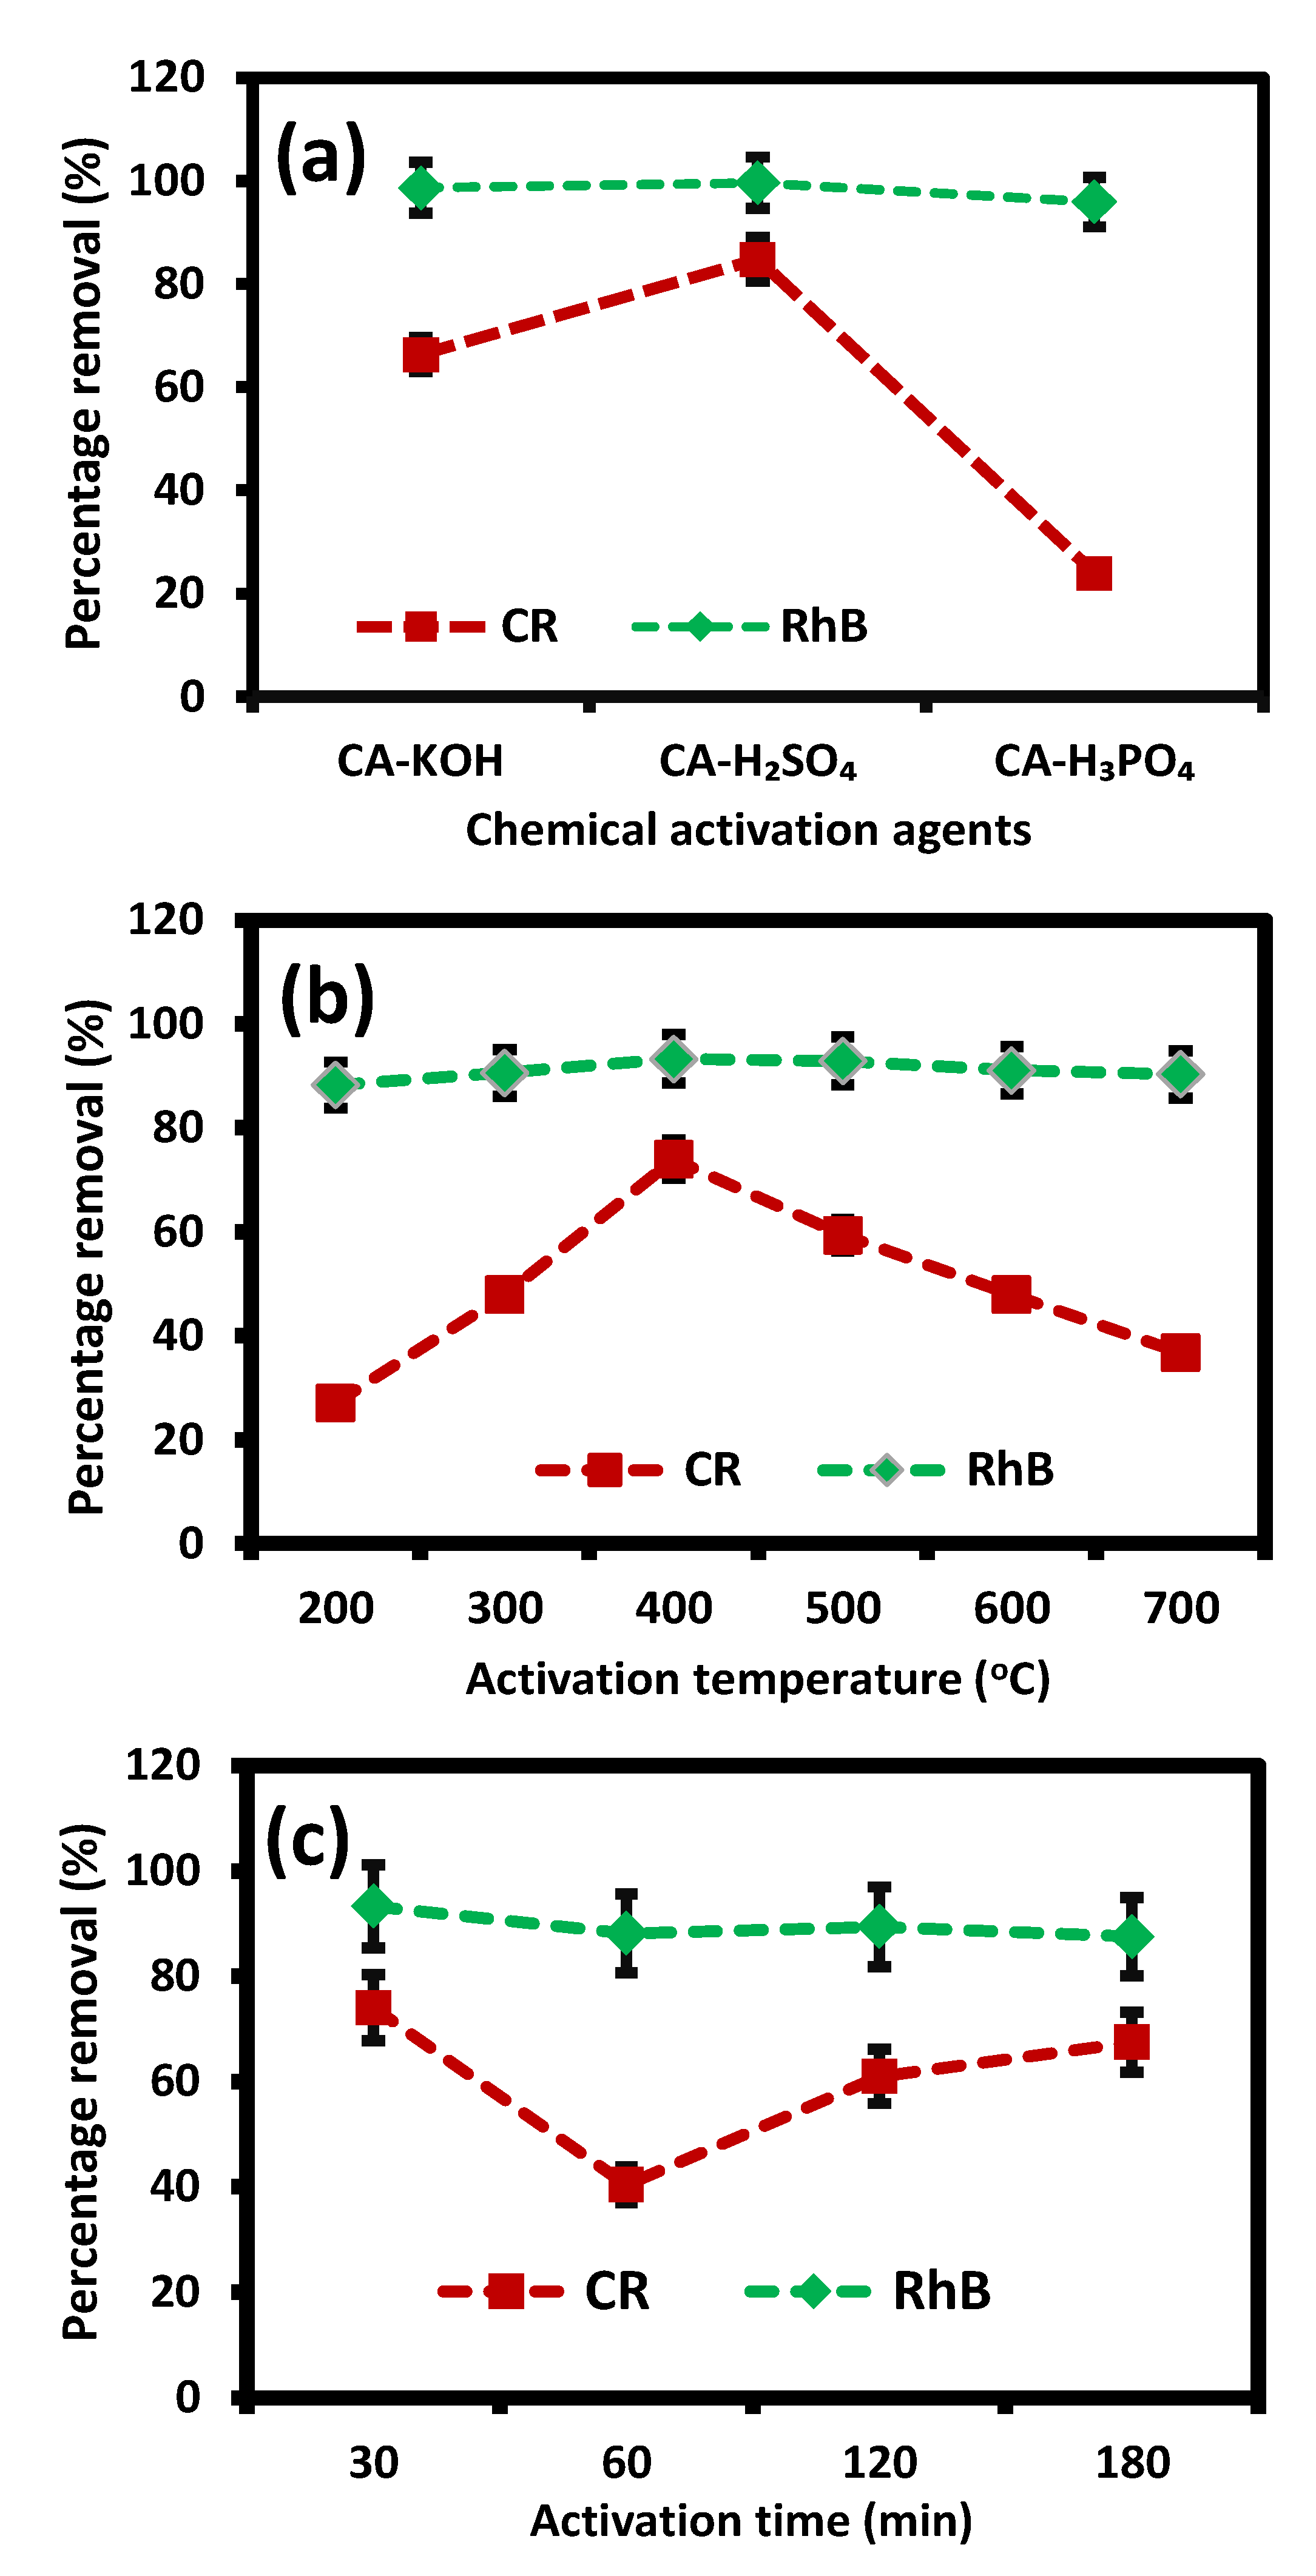
3.2. Optimization of Preparation Conditions for PTFAC

To optimize the preparation conditions of PTFAC, adsorption trial tests were carried out using PTF activated with different chemical agents such as H3PO4 (85%), H2SO4 (98%), and KOH (2 M) with an impregnation ratio of 3:1 (chemical/biomass). In addition, adsorption trial tests were conducted on the AC prepared at different temperatures at various times. Figure 6 shows the removal percentage of CR and RhB dyes by PTF activated by H2SO4, H3PO4, and KOH. From the mentioned dyes, the fiber activated by H2SO4 showed the highest removal percentage; hence, the H2SO4 is considered a strong oxidizing and dehydrating agent. As a result of the strong acid and base, H2SO4 and KOH exert a high corrosive effect on the precursor that produces weight loss of the precursor, which is less than that of the raw material. Indeed, the activation of AC by H3PO4 improves the pore structure during the thermal treatment, which improves the porosity in terms of macropores and mesopores of the PTFAC [8,44]. Thus, the activation by H3PO4 is highly recommended for functionalization of the surface of the used bioadsorbent that has an environmentally friendly in nature and easy to recover and recycle properties [17,45].
The removal percentage of dyes, adsorbed on PTFAC prepared at different temperatures and times, are shown in Figure 6b,c, respectively. Thermal treatment data revealed the chemical activation of AC with H3PO4 at 400 °C for 30 min in a facile and fast short analytical time process for AC activation. Thus, it can be concluded that the cellulose and hemicellulose in the PTF gradually decompose at 400 °C, resulting in a high specific surface area. On the other hand, a long activation time causes degradation and decreases the surface area and porosity of carbons, damaging the pores because of the excessive reaction with other activated agents. Hence, chemical activation with H3PO4 at 30 min is adopted in the subsequent study for dyes removal in batch mode.

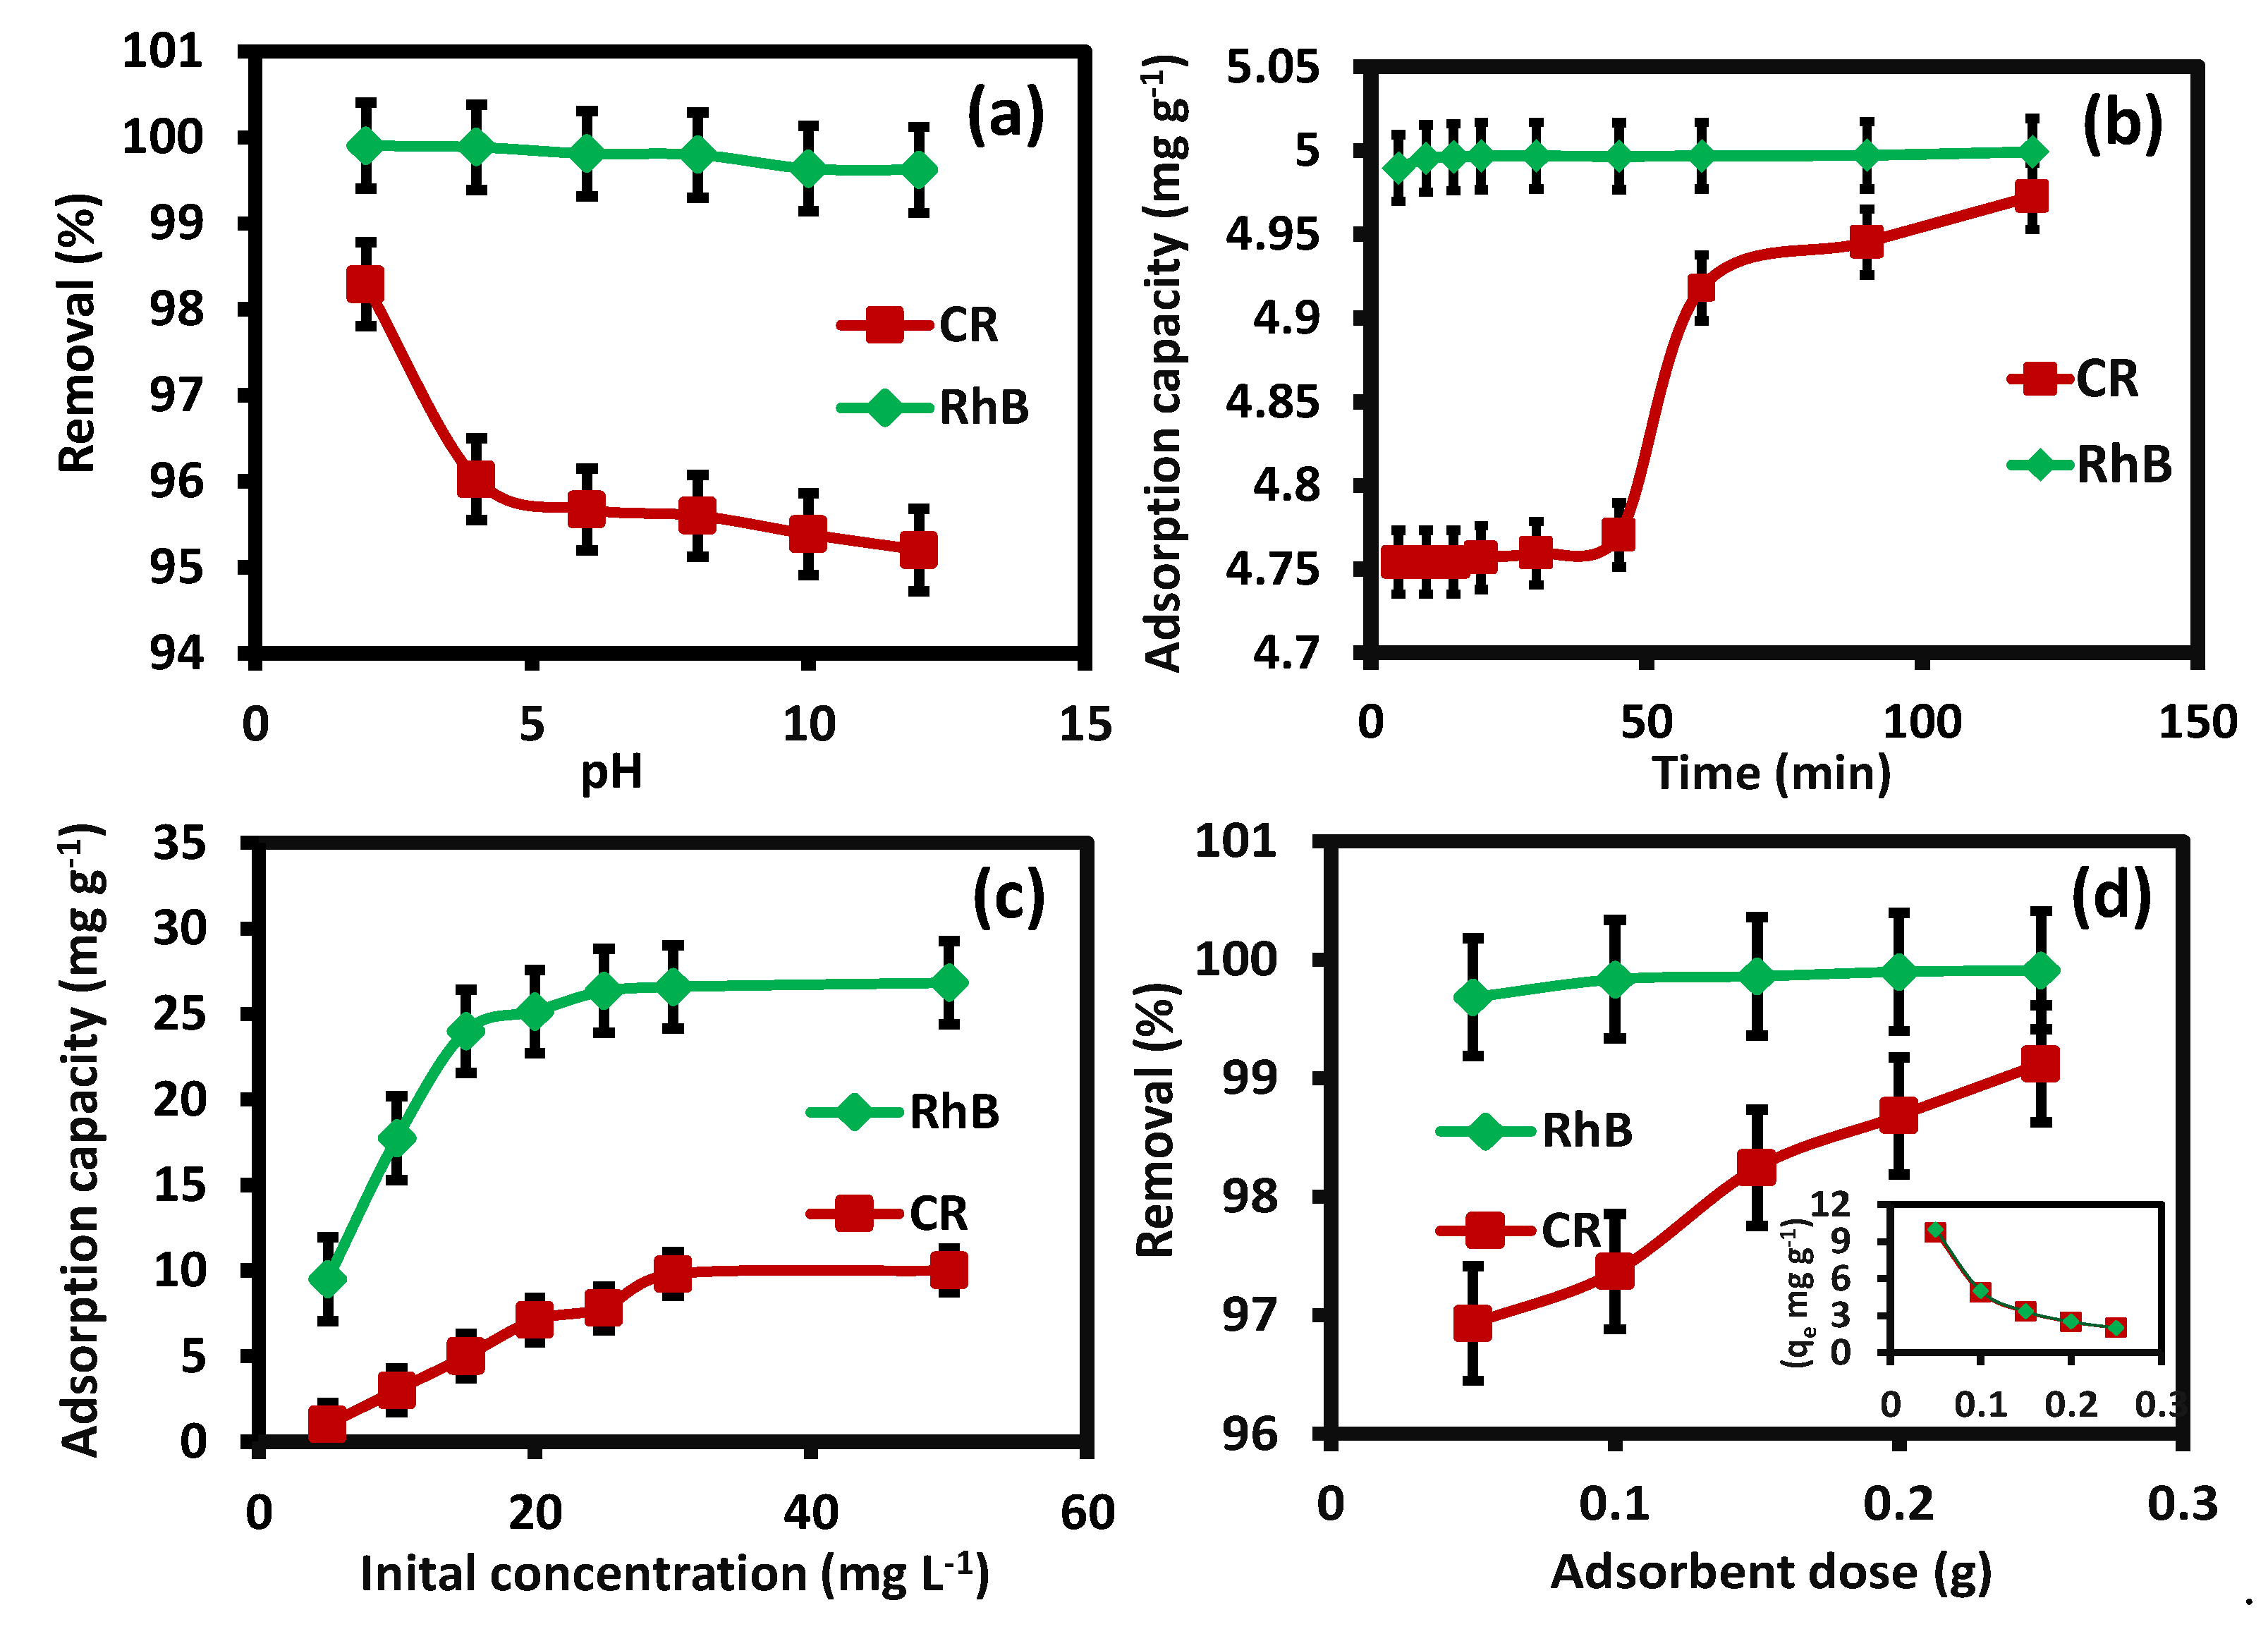
3.3. Influence of Parameters on the Adsorption Process (pH, Duration, Initial Concentration, Adsorbent Dosage)

The batch experiment was done to study the influence parameters using Co = 25 mg L−1, PTFAC mass = 0.1 g, V = 20 mL, t = 25 °C). In the adsorption process, the charge on the adsorbent and the characteristics of adsorbate in solution are determined by the pH, which has a radical impact on the adsorption ability. Figure 7a shows the effect of pH between (2.0–12) on the removal percentage of CR and PhB dyes by PTFAC. Upon increasing the pH values, the removal percentage declined slightly from 98.3% to 95.2% in the case of CR and from 99.9% to 99.6% for RhB; apparently, the maximum adsorption is observed at pH 2.0. As the zero-point charge of the adsorbent is at pH 3, it means that the adsorption is high when pH is less than pHzpc and low when pH is more than pHzpc. However, the cation dye (RhB) and anion dye (CR) at different pH values show high percentage removal, which makes the PTFAC significant in the removal of wastewater, because dyes in wastewater are usually in a wide pH range. It is well known that the adsorption of dyes by the AC can proceed by van der Waals, electrostatic, and H-bonding interactions. The CR is a dipolar molecule; it exists in an anionic form with red color at basic pH and in a cationic form with blue color at acidic pH. It is also observed that the surface of AC is covered by phenolic and carboxylic groups due to oxidation from the atmosphere and water medium [46]. At lower pH, protonation of phenolic (PhOH) and carboxylic acid (COOH) groups occurs on the surface of PTFAC, which leads to an increase in electrostatic interactions with the cationic CR dye; therefore, the adsorption of CR on the AC surface is higher. However, at a higher pH, the carboxylic and phenolic groups on the surface of AC are expected to be completely ionized to carboxylate (COO−) and phenoxide (PhO−) ions. Thus, the electrostatic repulsion between the anionic–CR and anionic–AC surface decreases the adsorption capacity. In the case of RhB, the pH has no significant effect on the removal percentage. The RhB may exist in cationic, laconic, or zwitterionic forms depending on the pH of the solution medium. At lower pH, the RhB dye ions are cationic and present in a monomeric molecular form that could easily enter the pore structure of the carbon, resulting in higher adsorption. At higher pH, the RhB dye ions are zwitterionic and present in dimer molecular form. The electrostatic interaction between the carboxylate ion and xanthene groups in zwitterionic results in the formation of dimers of bigger molecular forms that cannot easily enter the pores of carbon, resulting in lower adsorption. The adsorption at all pH values in both the dyes shows a very insignificant variation, indicating no ion exchange has occurred. So, the physical forces such as van der Waals, hydrogen bonding and dipole–dipole interactions might participate in this developed adsorption [30]. Similar studies on the effect of pH at acidic media in removing RhB and CR dyes by other adsorbents reported that RhB and CR dyes have maximum adsorption at pH 3.0 [47].
The duration plays an important role in the adsorption process of RhB and CR dyes by PTFAC. Figure 7b shows that the removal percentage increases with the increase in the duration, with high values of percentage between the range (5.0–120 min). The dyes recorded a high absorption rate; their values were between 95.1% at 5 min and 99.5% at 120 min for CR dye, whereas they were 99.7% at 5.0 min and 99.9% at 120 min for RhB dye. It indicated that the PTFAC has a high efficiency in removing both adsorbed dyes. This is because of the very rapid adsorption that was found during the first 5.0 min, and even then, the amount of the adsorbate increased with time and reached a constant value of the maximum adsorption at 120 min. However, the availability of vacant active sites on the surface of the PTFAC is the result of the rapid increase in adsorption during the initial stage. Eventually, the process slows down due to the diffusion of dyes into the pores of the PTFAC, because the external sites were fully occupied [8]. A similar study reported an increase in the quantity of adsorption dyes with increased contact time. Using an initial concentration of 1.0 g L−1, it was found that Raphia hookerie fruit epicarp could adsorb 312 mg/g RhB dye at acidic pH, and equilibrium was attained at 40 min for an initial dye concentration of 400 mg L−1 [47].
The effect of the initial concentration parameter is significant in determining the effectiveness of the adsorbent. The influence of initial dye concentration 5.0 to 50 mg L−1 on the adsorption capacity of PTFAC is shown in Figure 7c. The adsorption capacities (qe) were increased with the increase in the initial dye’s concentration from 5.0 to 50 mg L−1. The adsorption capacities were between 0.99 and 9.99 mg g−1 and 9.51 and 26.83 mg g−1 for CR and RhB days, respectively. After 25 mg L−1 initial concentration, no significant change was observed in the adsorption capacity; thus, the adsorption process reached the equilibrium. Initially, the adsorption process starts from the boundary layer; then, it diffuses into the adsorbent surface, and finally diffuses into the porous structure of the adsorbent [8]. In a similar study, an increase in the quantity of the dye adsorbed was observed on increasing the initial concentration of 1.0 g L−1 of R. hookerie fruit epicarp for adsorption capacity with 43.5 mg g−1 of RhB dye for an initial dye concentration of 50 mg L−1, while it can have a high adsorption of 312 mg g−1 of RhB dye for an initial dye concentration of 400 mg L−1 [47].
The influence of adsorbent dosage (0.05 to 0.25 g) is shown in Figure 7d. The figure shows that the removal amount of RhB and CR dyes by PTFAC increased with the increase in the adsorbent dosage. Then, the equilibrium was attained after 0.1 g of PTFAC. There was not much increase in the removal percentage of the dye. The percentage adsorbed of CR dye increased from 97% (9.69 mg g−1) for the adsorbent dosage of 0.05 g to 99% (1.99 mg g−1) for the adsorbent dosage of 0.25 g. The adsorption capacity of RhB dye increased from 99.6% (9.96 mg g−1) to 99.9% (1.99 mg g−1) with an increase in the adsorbent dosage of 0.05 to 0.25 g, respectively. The high removal efficiency with a high amount of adsorbent (0.05–25 g) is due to the availability of binding sites for adsorption. The adsorption capacity (qe) of the adsorbent was found to decrease with an increase in the adsorbent dosage, which could be due to the interaction of adsorbent particles such as aggregation or agglomeration, resulting in the decrease of the total surface area [8]. A similar study reported the increase in the percentage of adsorbed dye on increasing the adsorbent dosage [48]. Another study reported the RhB dye concentration to be 100 mg L−1; at acidic pH, the percentage adsorption of RhB dye increased from 85.19% to 88.88% as the adsorbent dosage increased from 1.0 to 5.0 mg L−1 [47].

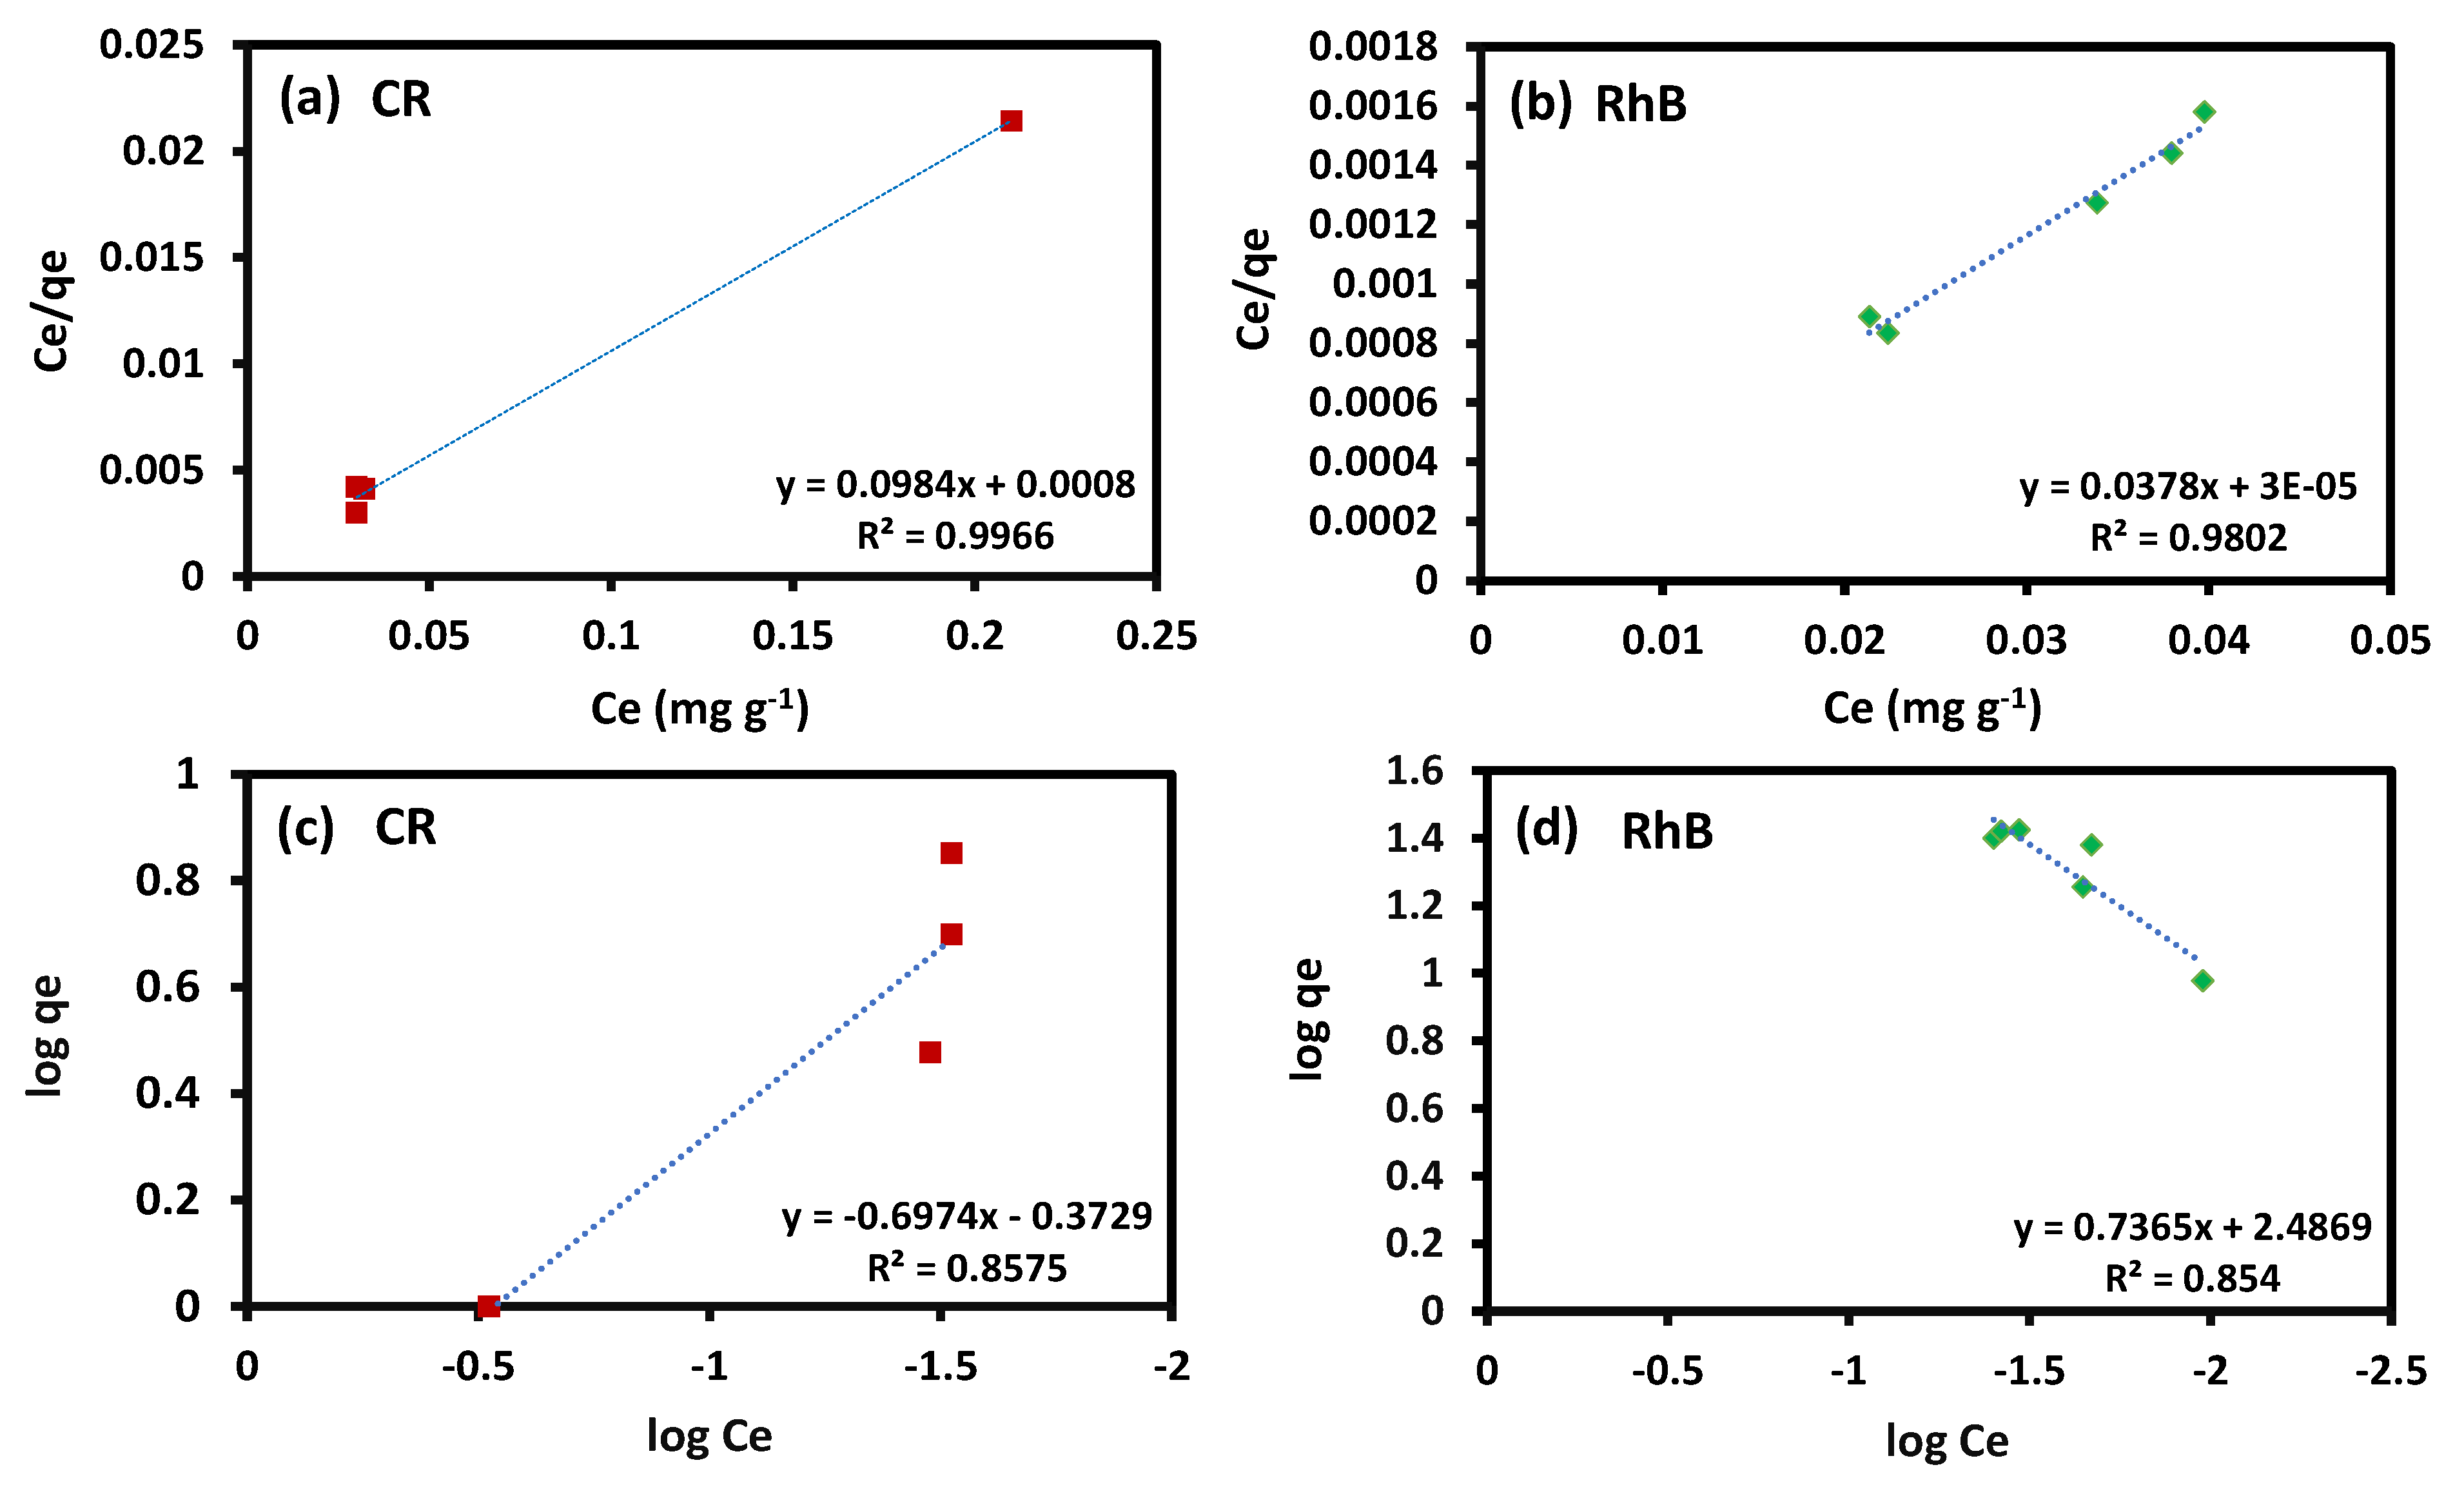
3.4. Adsorption Isotherms

Adsorption isotherm studies are very important as they describe how the adsorbed molecules are distributed between the PTFAC and the CR and RhB dyes in the solutions at equilibrium. They offer essential designing of the adsorption process by evaluating the adsorption effectiveness of the adsorbent. In this work, adsorption equilibrium data of CR and RhB dyes on PTFAC were analyzed by Langmuir and Freundlich adsorption isotherm models. The Langmuir isotherm model is the most extensively used system, which is based on a perfect hypothesis that adsorption occurs on the adsorbent at exact homogeneous sites and can be useful for monolayer adsorption [49]. The linear equation of the Langmuir isotherm model is presented below Equation (3).
C e q e = 1 q   K l + 1 q max C e  
where qmax is the maximum adsorption capacity and Kl (L/mg) is the Langmuir constant. qmax and Kl can be calculated by drawing Ce/qe (specific adsorption) against Ce (Figure 8a). An additional important factor of Langmuir isotherm is the dimensionless separation factor (Rl), which provides an understanding on the favorability of the adsorption process. This has been given in Equation (4).
R ι = 1 1 + K ι   C o
In the adsorption process, the separation factor Rl specifies whether the adsorption isotherm is unfavorable (Rl > 1), satisfactory (0 < Rl < 1), irreversible (Rl = 0.0), or linear (Rl = 1.0) [6,15]. The Freundlich isotherm model measures the adsorption capacity and intensity of the adsorbate on heterogeneous surfaces, but it does not predict the maximum adsorption [50]. The linear form of the Freundlich isotherm is expressed by Equation (5).
log   ( q e ) = log   ( K f ) + 1 n log   ( C e )  
As Kf and 1/n are the Freundlich constants, they help calculate the capacity and strength of adsorption, respectively. Kf and n can be obtained from the intercept and slope by drawing log qe versus log Ce, respectively (Figure 8b). The n value gives the degree of nonlinearity between the concentration of the solution and adsorbent. When n = 1.0, the adsorption is linear, whereas n < 1 suggests that the adsorption process is chemical. However, if n > 1, it means that the physical adsorption is satisfactory [15].
The Langmuir and Freundlich isotherms selected to explicate the interaction of CR and RhB dyes with PTFAC are shown in Figure 8. Figure 8a shows the Langmuir isotherm; as the linear correlation coefficient value (R2) represents the accuracy of the model, it is found near the unity. The R2 values for the CR were 0.996, and for RhB, these were 0.980. The Freundlich isotherm in Figure 8b shows R2 values for CR and RhB to be 0.8575 and 0.8541, respectively. Thus, this suggests that the adsorption values of CR and RhB dyes are the best fit to the Langmuir adsorption model [49]. Based on the calculated data, the coefficients of Langmuir and Freundlich isotherms models are illustrated in Table 2. The Langmuir model shows a maximum adsorption capacity for CR dye at 10.4 mg g−1 and for RhB dye at 26.5 mg g−1 by PTFAC. The dimensionless separation factor (Rl) value found for CR dye was 0.04 and that for RhB dye was 0.034, indicating a favorable adsorption [6,15]. In addition, the highest value of the constant Kl for CR was 81.91 L mg−1, and for RhB, it was 1264.5 L mg−1, which indicates a strong bonding of dyes onto PTFAC [30]. In this study, the value of n for RhB adsorption was above unity, indicating favorable physical adsorption, but the value of n for CR was below unity, indicating chemical adsorption.
In addition, the chi-square test was considered to calculate the best fitted model and validation of adsorption kinetics [51], using Equation (6).
χ 2 = ( q e , exp q e , cal   ) 2 q e , cal
where qe,exp and qe,cal are the experimental and calculated data of adsorption capacity at equilibrium (mg g−1) for each model. This error equation is used to express the distributed error among the calculated and experimental values of the isotherm model. When the error is minor, it proves that the isotherm model is well fitted. According to the χ2 analysis, it was found that the Langmuir isotherm model showed a lower χ2 value for CR dye (0.013) and RhB dye (0.001), as depicted in Table 2, suggesting that the adsorption of both dyes was monolayer type. The previous study reported that the acid-activated red mud can adsorb the CR dye, and the Langmuir isotherm model is the best fit because the chi-square was low [52].

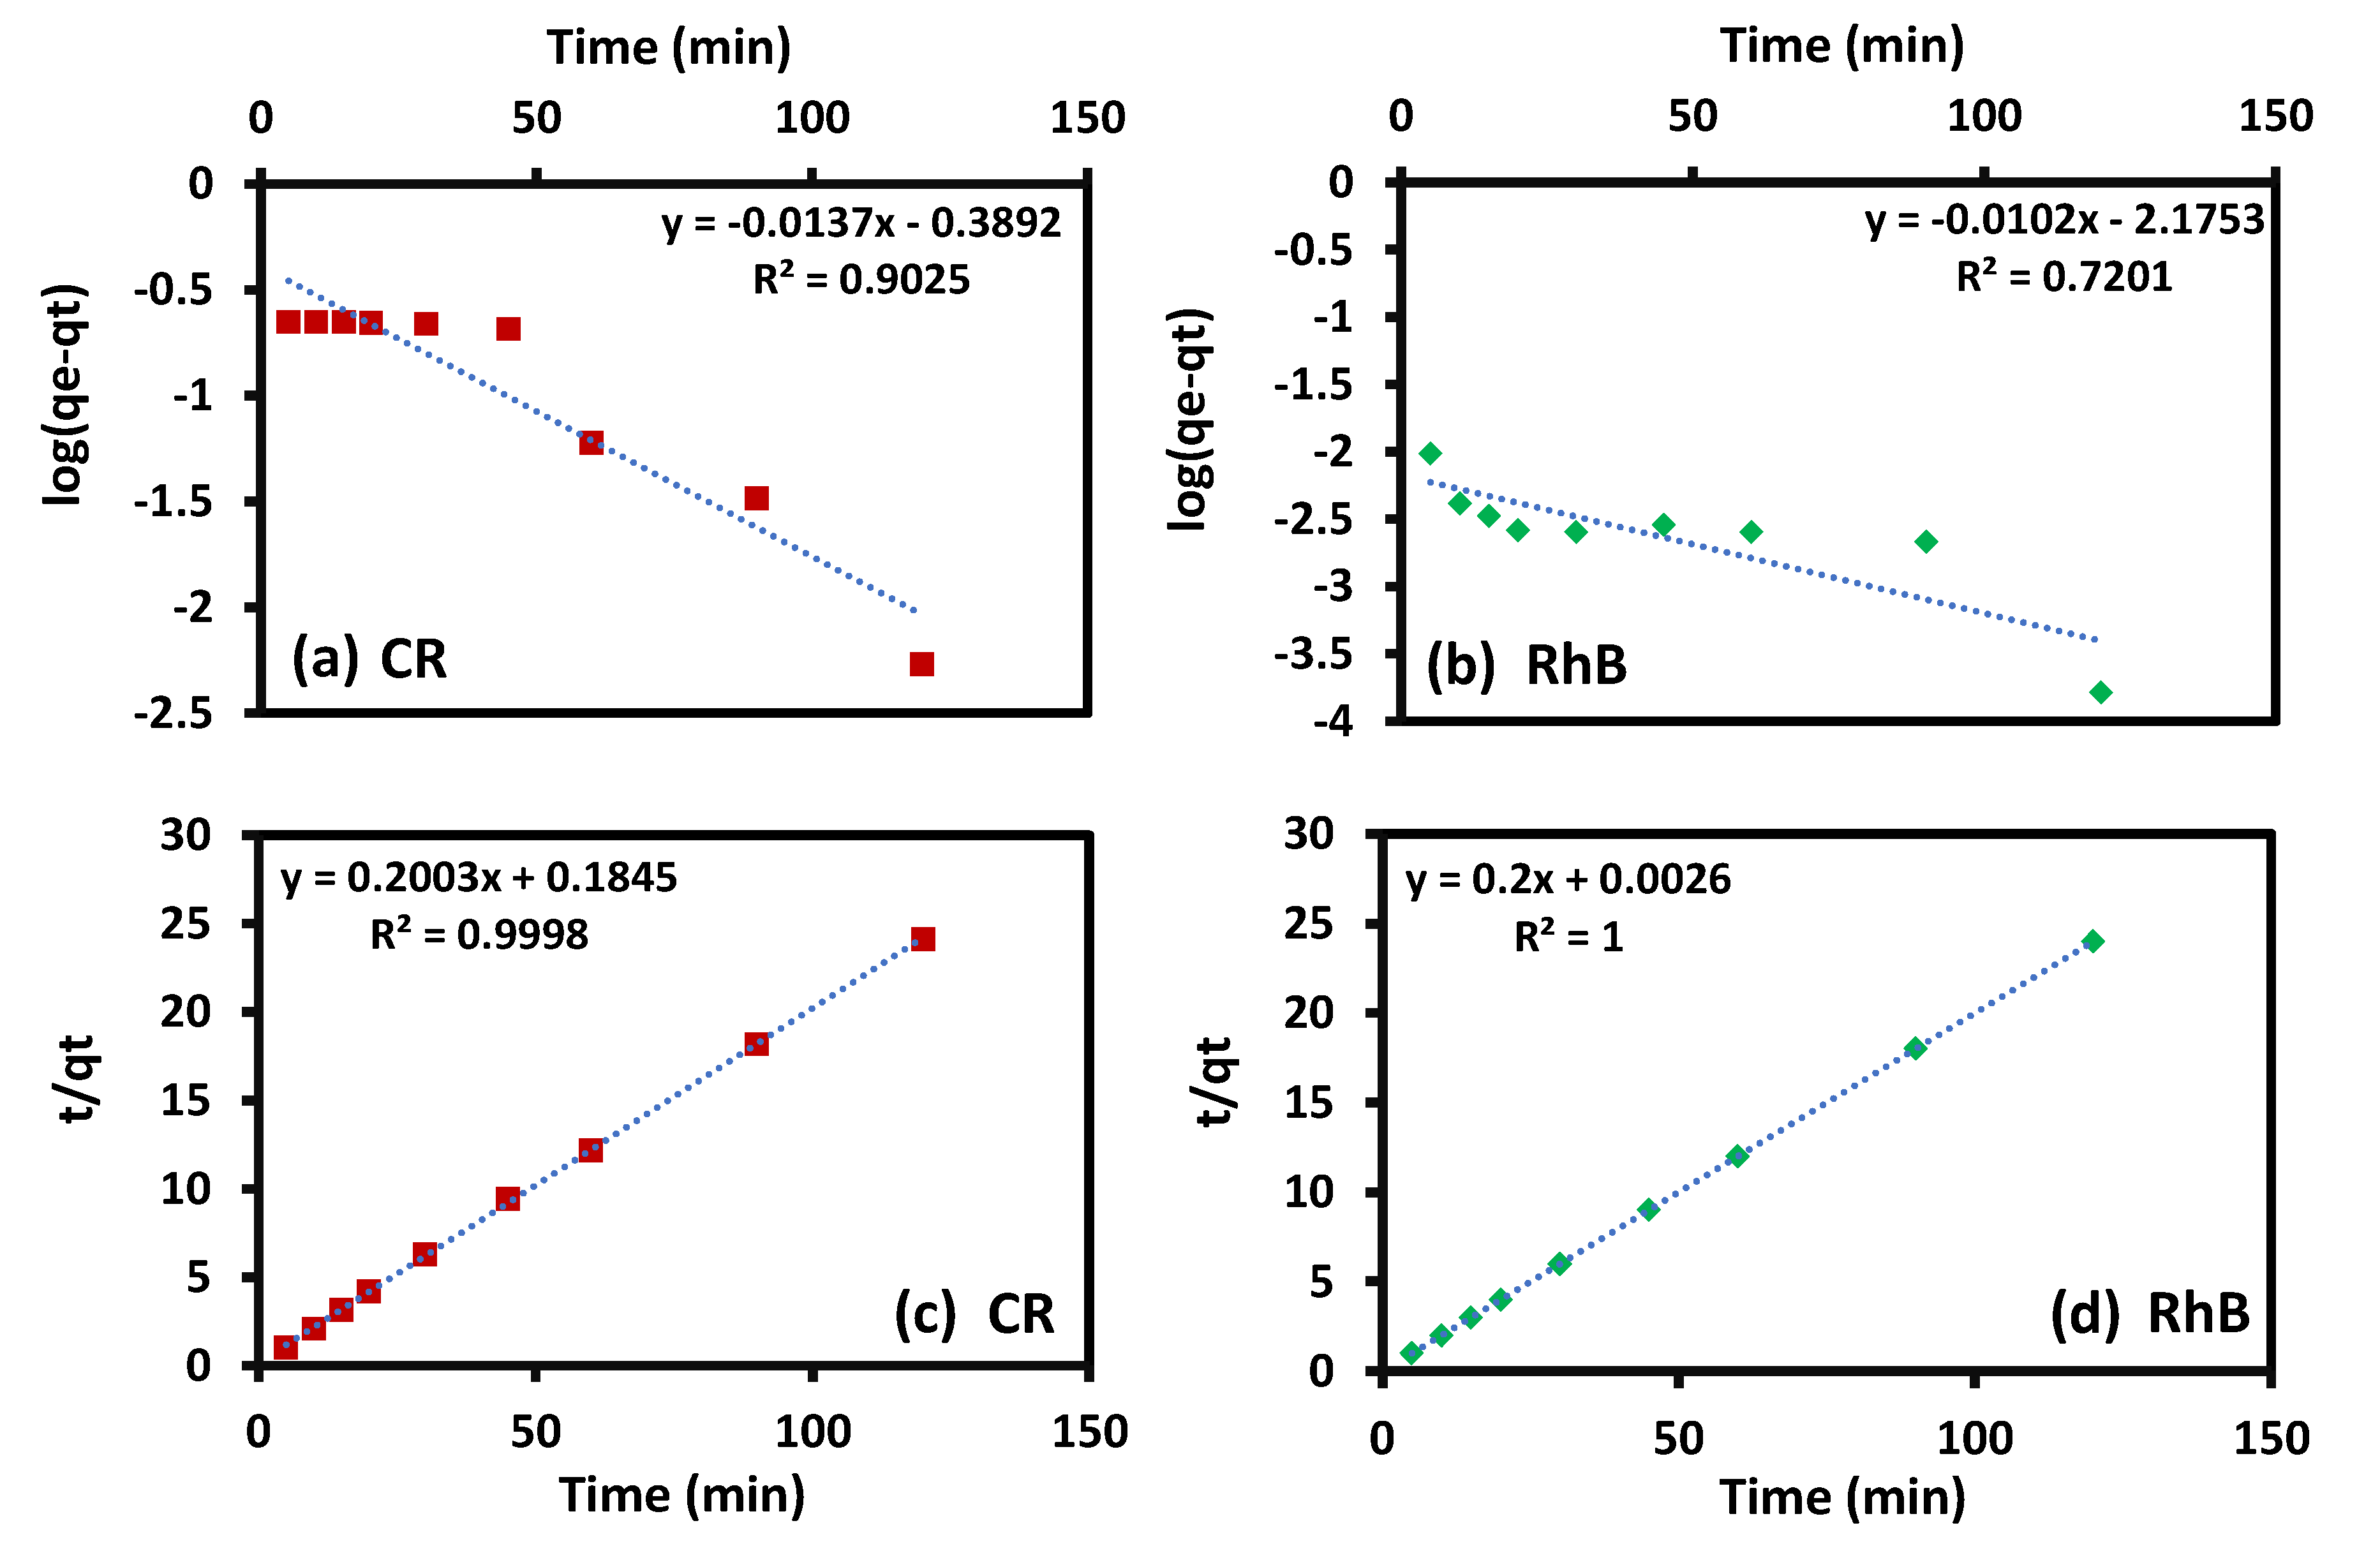
3.5. Adsorption Kinetics

Kinetic investigations offer an important indication to realize the adsorption dynamics or adsorption mechanism using pseudo-first-order and pseudo-second-order models. The mathematical term of the pseudo-first-order model [53] is expressed in Equation (7).
log ( q e q t   ) = log q e   k 1 2.303   t    
where qt (mg g−1) and qe (mg g−1) are the quantities of dyes adsorbed at time t and at equilibrium, respectively. k1 is the rate constant of the pseudo-first-order model (min−1). The plot of log (qe – qt) versus t for the adsorption of CR and RhB dyes on PTFAC results in linear graphs with a negative slope (Figure 9a); k1 and qe are determined from the slope and intercept, respectively. In this case, the calculated qe (CR 0.408, RhB 0.006 mg g−1) values of both dyes were considerably different from the qexp values. This suggests that the data do not fit well with the first-order model.
The pseudo-second-order model describes that the adsorption process is a chemical process. It describes the proportion between the rate constant and the engaged active sites. The linear equation of the pseudo-second-order rate model is given in Equation (8).
t q t = 1 K 2   q e 2 + t q e
where k2 is the pseudo-second-order model adsorption rate constant. The drawing of t/qt against t provides linear graphs. The values of qe and k2 can be determined from the slope and intercept of the PTFAC graph (Figure 9b).
The pseudo-first-order model in Table 3 shows that the calculated qe value is 0.408 mg/g for CR dye and 0.006 mg g−1 for RhB dye. The values vary significantly lower than the experimental qe values, which are 4.972 mg g−1 for CR dye and 4.999 mg g−1 for RhB dye. However, with the pseudo-second-order model, the calculated qe values are 4.992 mg g−1 for CR dye and 4.998 mg g−1 for RhB dye, which are similar to the experimental qe values. In addition, the obtained R2 values are very close to ones for the pseudo-second-order kinetics adsorption process, which were 0.999 and 1.0 for CR dye and RhB dye, respectively. The χ2 test was used to validate the kinetics models [47,54]. As χ2 values are generally found to be low, the value for CR dye was 7.74 × 10⁻⁵, and for RhB dye, it was 2.01 × 10⁻⁸. This indicated that the adsorption kinetics data obey the pseudo-second-order model. This is similar to a report on the adsorption of RhB dye onto the area-modified R. hookerie epicarp [47].
The adsorption of CR and RhB dyes on PTFAC is an intricate process that involves physical forces acting through pores contained and chemical bonding derived from the active groups on the PTFAC adsorbent [43,54]. Activation by phosphoric acid also enhances the acidic-containing functional groups on PTFAC, resulting in better dye removal from the aqueous solution by the used adsorbent [33]. FTIR analysis revealed the existence of hydrogen bonds between CR, RhB, and the surface of PTFAC. The H bonding interaction occurred between hydroxyl groups at the PTFAC surface and nitrogen-containing functional groups of CR and RhB in acidic medium in addition to the specific attraction between negatively charged COO and SO3 groups of CR dye and the positively charged PTFAC surface [47,55]. Protonation of –OH and –COOH groups present at the PTFAC surface in addition to the van der Waals force also enhances the uptake of the used analytes [47,55].

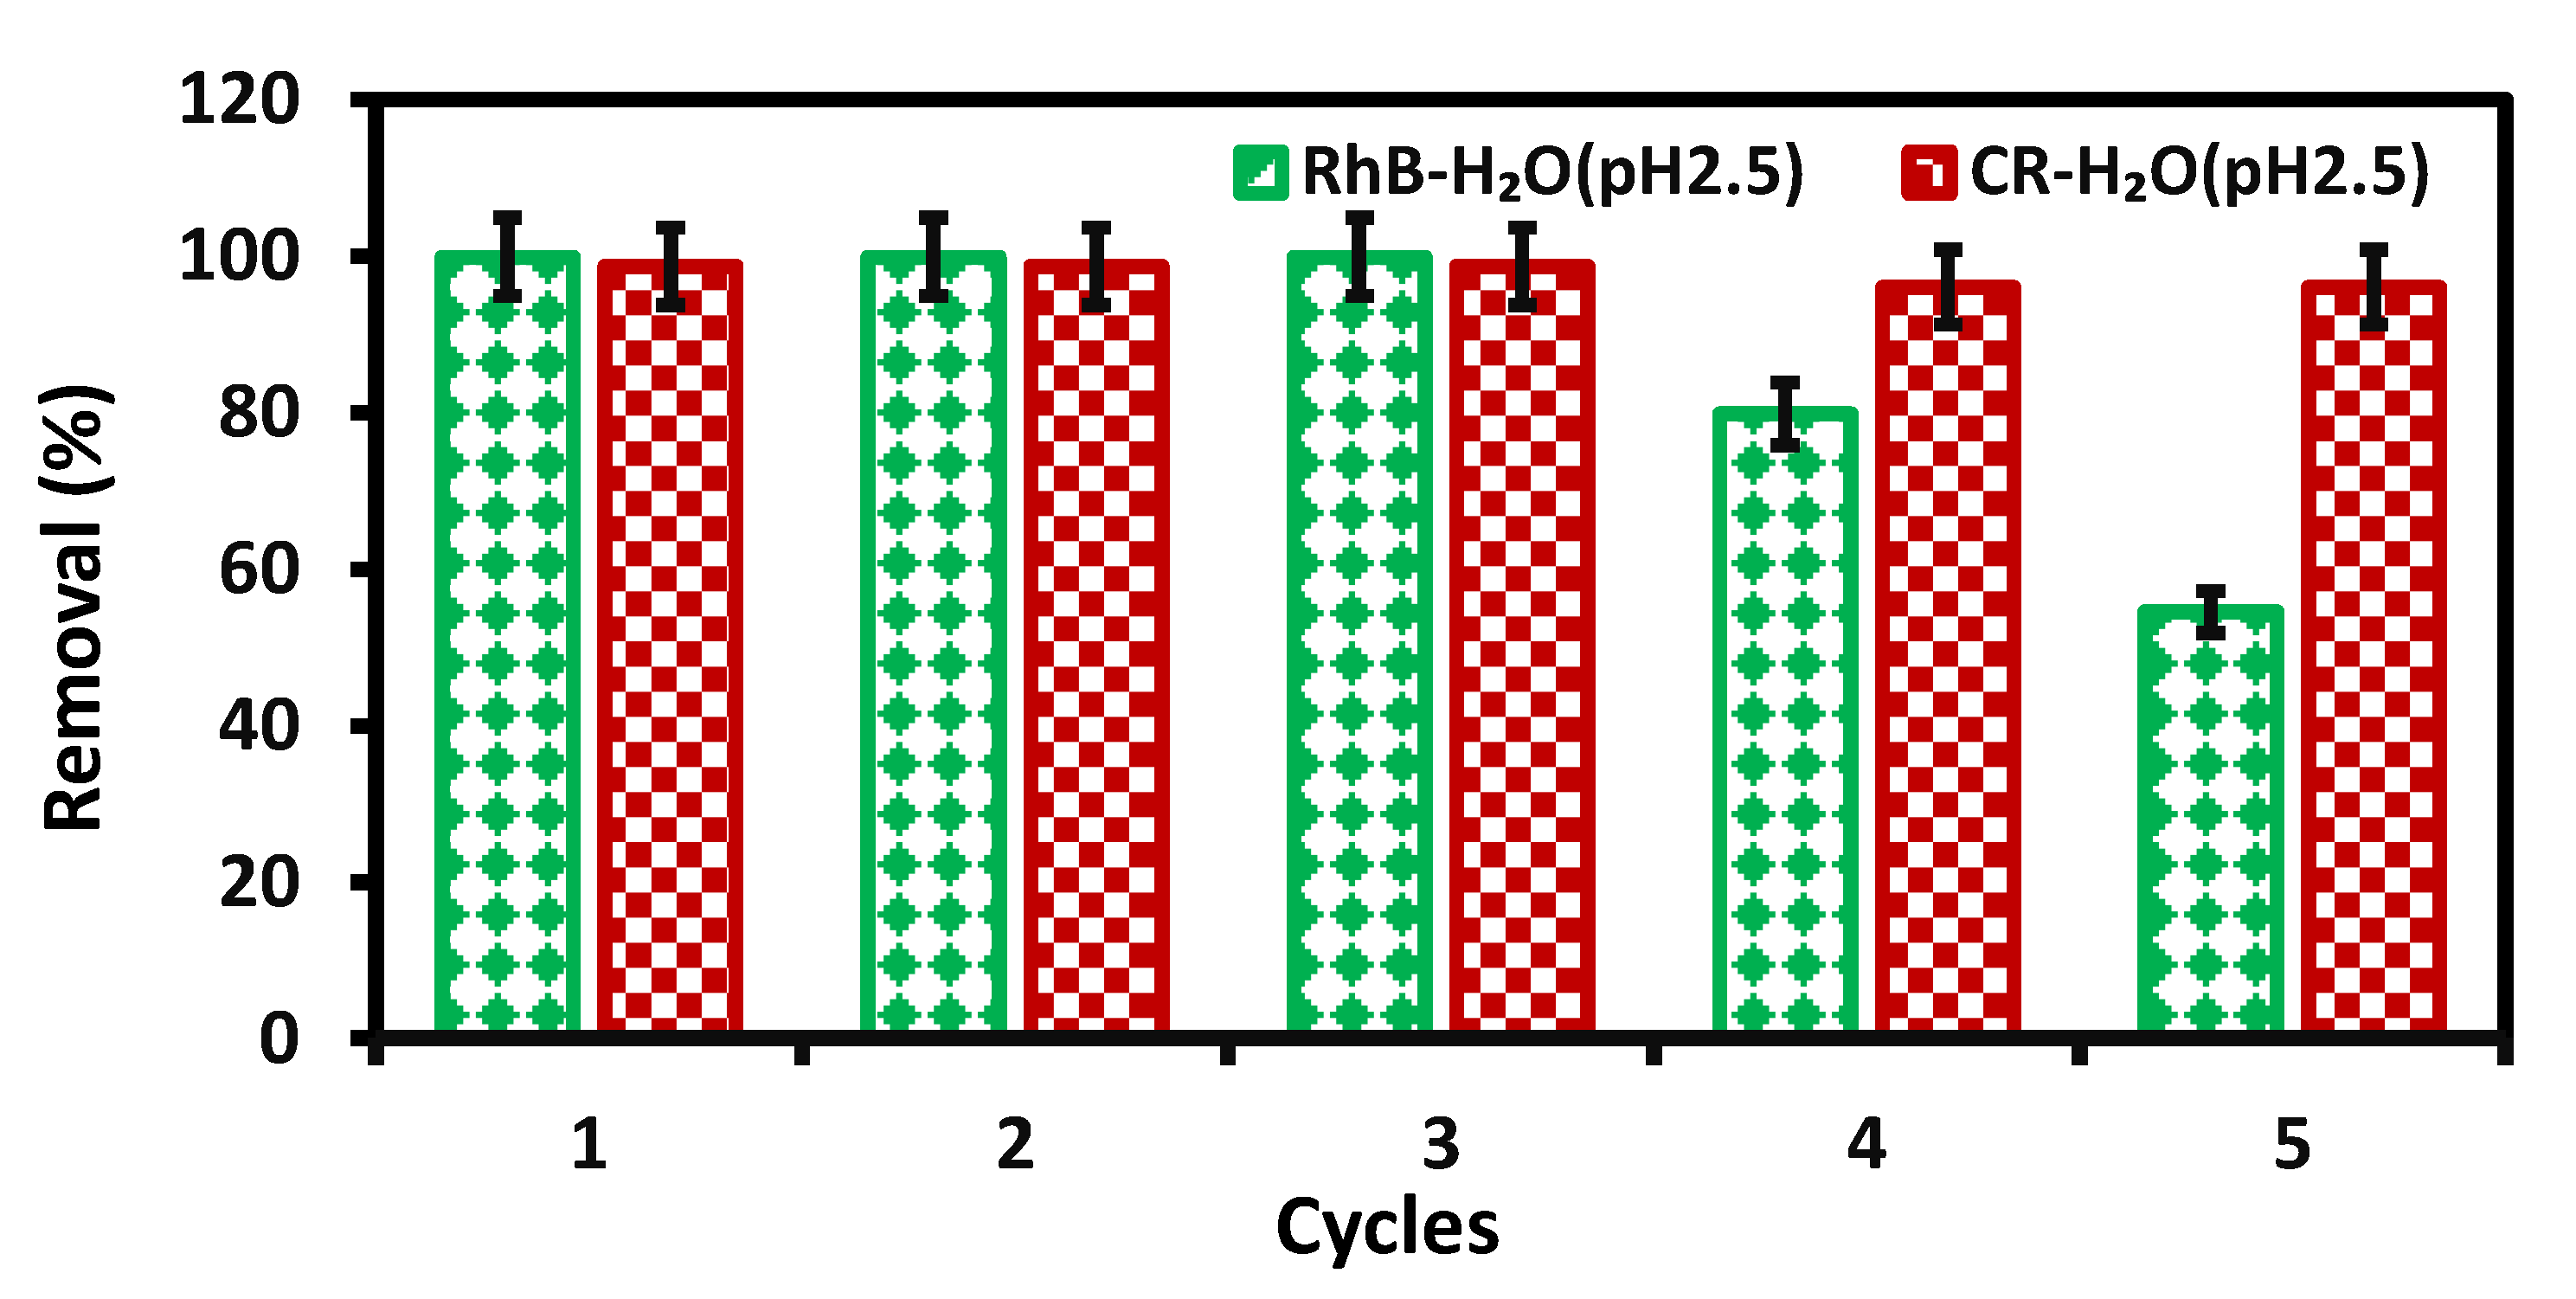
3.6. Desorption and Regeneration Studies

Desorption studies help to explain the adsorption mechanism in the recovery of the adsorbent and to investigate the possibility of regeneration of used PTFAC loaded with RhB and CR dyes. Table 4 shows that the desorption using distilled water by adjusting pH to 2.5, 4.5, 6.5, 8.5, and 10.5 has a high desorption efficiency and is very close (in percentage) to the CH3;COOH and NaOH (0.1, 0.5, and 1.0 M). Thus, the PTFAC loaded with RhB dye showed a high stability in the adsorption process. The desorption percentage at pH values of 2.5, 4.5, 6.5, 8.5, and 10.5 was 99.88%, 99.84%, 99.84%, 99.81%, and 99.77%, respectively, whereas in the desorption of CR loaded on PTFAC, the percentage decreased with increasing the pH from 2.5 to 10.5, which was 98.68%, 97.36%, 96.1%, 93.42%, and 93.42%, respectively. Hence, the optimum desorption percentage of CR and RhB was observed at pH 2.5 using distilled water as a green desorption reagent. This indicates that the adsorption of the dyes is mainly due to the Van der Waals, electrostatic, and H-bonding interactions, and chemisorption mechanism [48]. In addition, the regeneration study of the adsorbent might yield an efficient economical treatment process. Figure 10 shows the regeneration cycle of PTFAC with CR and RhB dyes. It has no significant change of percentage removal in CR dye. The removal percentage was between 98.68 and 96.1%, which indicated that the use of PTFAC could be increased to more than five cycles. Thus, PTFAC showed high resistance to adsorption efficiency after five regeneration cycles, whereas there was a decrease in percentage removal in RhB dye with the increase of the number of cycles from the first cycle (99.88%) to the fifth cycle (54.49%). That was due to the effect of the repeated use of the PTFAC on the adsorption process. These dyes loaded on the PTFAC surface can change superficial structures and result in the loss or blockage of the adsorption sites in the AC. The magnetic lignosulfonate FCS studied two regeneration cycles for CR, and removal was 83% after five cycles [56]. It can be concluded that PTFAC is an efficient high-potential adsorbent for the removal of cationic and anionic dyes and can be recycled several times.

3.7. Environmental Water Treatment

This study investigated the efficiency of PTFAC as an environmental application by determining the highest percentage removal of CR and RhB dyes. The environmental water samples were filtrated through No. 2 Whatman Qualitative filter paper; then, the spike method was used by obtaining a 15 mg L−1 dyes concentration. Table 5 shows the percentage removal of CR and RhB dyes from contaminated water. Thus, the percentage removal values for RhB dye were 99.8% for tap water, 99.3% for well water, 99.4% for seawater, and 98.3% for sewage water from the treatment plant. The percentage removal values for CR dye were 99.8% for tap water, 94.4% for well water, 93.3% for seawater, and 92.3% for sewage water from the treatment plant. This indicates the PTFAC has high stability to remediate water from CR and RhB dye. The removal percentages from the highest to the lowest are tap water > well water > seawater > sewage water from the treatment plant. These results confirmed that PTFAC could be used to treat RhB and CR wastewater in the environmental application without adjusting the pH of the wastewater. Thus, the PTFAC has high removal efficiency in the remediation of contaminated water from anion and cation dyes.

4. Conclusions

In the current study, palm fiber was successfully used as solid waste for the production of AC activated by H3PO4 at 400 °C after 30 min. The established method is a facile and fast method that can be used as an efficient adsorbent for the elimination of anionic and cationic dyes from wastewater. The texture and surface characteristics of the prepared PTFAC showed 648.90 m2g−1 surface area, 2.83 cm3g−1 total pore volume, and 0.79 nm mean pore diameter with a zeta potential value of −28.3 mV and point of zero charge (pHzpc) equal to 3. The FTIR study indicated the presence of various functional groups. The results of the adsorption process of the prepared PTFAC showed that pH, adsorbent dosage, contact duration, and initial dye concentration have a dominant effect on the adsorption of CR and RhB dyes. The Langmuir isotherm showed a maximum monolayer CR and RhB adsorption capacity of 10.4 mg g−1 and 26.5 mg g−1, respectively, of an initial concentration 25 mg L−1 at pH 2.0, 25 °C, 120 min, and 0.1 g/20 mL adsorbent dose of AC. The kinetic studies showed that the adsorption process fits in with the pseudo-second-order kinetics. The desorption and regeneration studies of adsorbent were found to be effective until the fifth regeneration cycle by using distilled water an eco-friendly desorption reagent at pH 2.5, suggesting that the adsorbent could be regenerated and reused. Hence, the investigation concludes that the PTFAC prepared from PTF is a cost-effective and promising adsorbent toward dyes from environments.

Author Contributions

B.G.A. supervision, project administration, writing—original draft, Writing—review & editing; S.A., methodology, formal analysis, writing—original draft; E.A.B., supervision, validation; M.F.Z., investigation, formal analysis. All authors have read and agreed to the published version of the manuscript.

Funding

This work was funded under Deanship of Scientific Research (DSR), King Abdulaziz University, Jeddah, grant number G-569-247-39.

Institutional Review Board Statement

Not applicable.

Informed Consent Statement

Not applicable.

Data Availability Statement

Not applicable.

Acknowledgments

The authors express their sincere thanks and acknowledge the financial support by Deanship of Scientific Research (DSR), King Abdulaziz University, Jeddah for facilitating the research work.

Conflicts of Interest

The authors declare no conflict of interest.

References

  1. Tian, C.; Feng, C.; Wei, M.; Wu, Y. Enhanced adsorption of anionic toxic contaminant Congo Red by activated carbon with electropositive amine modification. Chemosphere 2018, 208, 476–483. [Google Scholar] [CrossRef] [PubMed]
  2. Moussavi, G.; Mahmoudi, M. Removal of azo and anthraquinone reactive dyes from industrial wastewaters using MgO nanoparticles. J. Hazard. Mater. 2009, 168, 2–3. [Google Scholar] [CrossRef]
  3. Chen, Y.; Hermens, J.L.; Jonker, M.T.; Arnot, J.A.; Armitage, J.M.; Brown, T.; Nichols, J.W.; Fay, K.A.; Droge, S.T. Which Molecular Features Affect the Intrinsic Hepatic Clearance Rate of Ionizable Organic Chemicals in Fish? Env. Sci. Technol. 2016, 50, 12722–12731. [Google Scholar] [CrossRef] [PubMed]
  4. Saxena, S.; Raja, A.S.M. Natural Dyes: Sources, Chemistry, Application and Sustainability Issues. In Roadmap to Sustainable Textiles and Clothing; Textile Science and Clothing Technology (Springer Singap.); Muthu, S., Ed.; Spring: Berlin/Heidelberg, Germany, 2014; pp. 37–80. [Google Scholar] [CrossRef]
  5. Freundlich. Uber die Adsorption in Lösungen. J. Phys. Chem. 1906, 57, 385.
  6. Aly, Z.; Graulet, A.; Scales, N.; Hanley, T. Removal of Aluminium from Aqueous Solutions Using PAN-Based Adsorbents: Characterisation, Kinetics, Equilibrium and Thermodynamic Studies. Environ. Sci. Pollut. Res. 2014, 21, 3972–3986. [Google Scholar] [CrossRef]
  7. Suhas, V.K.; Gupta, P.J.M.; Carrott, R.; Singh, M.; Chaudhary, S.K. Cellulose: A review as natural, modified and activated carbon adsorbent. Bioresour. Technol. 2016, 216, 1066–1076. [Google Scholar] [CrossRef]
  8. Danish, M.; Khanday, W.A.; Hashim, R.; Sulaiman, N.S.B.; Akhtar, M.N.; Nizami, M. Application of optimized large surface area date stone (Phoenix dactylifera ) activated carbon for rhodamin B removal from aqueous solution: Box-Behnken design approach. Ecotoxicol. Environ. Saf. 2017, 139, 280–290. [Google Scholar] [CrossRef]
  9. Zhu, L.; Wang, Y.; He, T.; You, L.; Shen, X. Assessment of Potential Capability of Water Bamboo Leaves on the Adsorption Removal Efficiency of Cationic Dye from Aqueous Solutions. Polym. Environ. 2016, 24, 148–158. [Google Scholar] [CrossRef]
  10. Yao, T.; Guo, S.; Zeng, C.; Wang, C.; Zhang, L. Investigation on efficient adsorption of cationic dyes on porous magnetic polyacrylamide microspheres. J. Hazard. Mater. 2015, 292, 90–97. [Google Scholar] [CrossRef] [PubMed]
  11. Bousba, S.; Meniai, A.H. Adsorption of 2-chlorophenol onto sewage sludge based adsorbent: Equilibrium and kinetic study. Chem. Eng. Trans. 2013, 35, 859–864. [Google Scholar]
  12. Tian, H.; Peng, J.; Lv, T.; Sun, C.; He, H. Preparation and performance study of MgFe2O4/metal-organic framework composite for rapid removal of organic dyes from water. J. Solid State Chem. 2018, 257, 40–48. [Google Scholar] [CrossRef]
  13. Fu, K.; Yue, Q.; Gao, B.; Wang, Y.; Li, Q. Activated carbon from tomato stem by chemical activation with FeCl2, COLSUA Colloids and Surfaces. Phys. Eng. Asp. 2017, 529, 842–849. [Google Scholar] [CrossRef]
  14. Vohra, M.S. Adsorption-Based Removal of Gas-Phase Benzene Using Granular Activated Carbon (GAC) Produced from Date Palm Pits. Arabian J. Sci Eng. 2015, 40, 3007–3017. [Google Scholar] [CrossRef]
  15. Somaia, G.M.; Sahar, M.A. Preparation of environmentally friendly activated carbon for removal of pesticide from aqueous media. Int. J. Indust. Chem. 2017, 8, 121–132. [Google Scholar]
  16. Silva, T.L.; Cazetta, A.L.; Souza, P.S.C.; Zhang, T.; Asefa, T.; Almeida, V.C. Mesoporous activated carbon fibers synthesized from denim fabric waste: Efficient adsorbents for removal of textile dye from aqueous solutions. J. Clean. Prod. 2018, 171, 482–490. [Google Scholar] [CrossRef]
  17. Mosbah, M.b.; Mechi, L.; Khiari, R.; Moussaoui, Y. Current State of Porous Carbon for Wastewater Treatment. Processes 2020, 8, 1651. [Google Scholar] [CrossRef]
  18. Abdel-Ghani, N.T.; El-Chaghaby, G.A.; Rawash, E.S.A.; Lima, E.C. Adsorption of Coomassie Brilliant Blue R-250 dye onto novel activated carbon prepared from Nigella sativa L. waste: Equilibrium, kinetics and thermodynamics running. J. Chil. Chem. Soc. 2017, 62, 3505–3511. [Google Scholar] [CrossRef]
  19. Choong, C.E.; Kim, M.; Yoon, S.; Lee, G.; Park, C.M. Mesoporous La/Mg/Si-incorporated palm shell activated carbon for the highly efficient removal of aluminum and fluoride from water. J. Taiwan Inst. Chem. Eng. 2018, 93, 306–314. [Google Scholar] [CrossRef]
  20. Kaveeshwar, A.R.; Ponnusamy, S.K.; Revellame, E.D.; Gang, D.D.; Zappi, M.E.; Subramaniam, R. Pecan shell based activated carbon for removal of iron(II) from fracking wastewater: Adsorption kinetics, isotherm and thermodynamic studies. Process. Saf. Environ. Prot. 2018, 114, 107–122. [Google Scholar] [CrossRef]
  21. Bhomick, P.C.; Supong, A.; Baruah, M.; Pongener, C.; Sinha, D. Pine Cone biomass as an efficient precursor for the synthesis of activated biocarbon for adsorption of anionic dye from aqueous solution: Isotherm, kinetic, thermodynamic and regeneration studies. Sustainable Chem. Pharm. 2018, 10, 41–49. [Google Scholar] [CrossRef]
  22. Getu, A.; Sahu, Q. Removal of Reactive Dye using Activated Carbon from Agricul-tural Waste. J. Eng. Geol. Hydrogeol. 2014, 2, 23. [Google Scholar] [CrossRef]
  23. Wongcharee, S.; Aravinthan, V.; Erdei, L. Mesoporous activated carbon-zeolite composite prepared from waste macadamia nut shell and synthetic faujasite. Chin. J. Chem. Eng. 2019, 27, 226–236. [Google Scholar] [CrossRef]
  24. Pongener, C.; Bhomick, S.P.; Upasana Bora, R.L.; Goswamee, A.; Supong, D.S. Sand-supported bio-adsorbent column of activated carbon for removal of coliform bacteria and Escherichia coli from water. Int. J. Environ. Sci. Technol. 2017, 14, 1897–1904. [Google Scholar] [CrossRef]
  25. Gumus, R.H.; Okpeku, I. Production of Activated Carbon and Characterization from Snail Shell Waste ( Helix pomatia ). Adv. Chem. Eng. Sci. 2015, 5, 51–61. [Google Scholar] [CrossRef] [Green Version]
  26. Goswami, M.; Phukan, P. Enhanced adsorption of cationic dyes using sulfonic acid modified activated carbon. J. Environ. Chem. Eng. 2017, 5, 3508–3517. [Google Scholar] [CrossRef]
  27. Shamsuddin, M.S.; Yusoff, N.R.N.; Sulaiman, M.A. Synthesis and Characterization of Activated Carbon Produced from Kenaf Core Fiber Using H3PO4 Activation. Procedia Chem. 2016, 19, 558–565. [Google Scholar] [CrossRef] [Green Version]
  28. Chowdhury, S.; Pan, S.; Balasubramanian, R.; Das, P. Date Palm Based Activated Carbon for the Efficient Removal of Organic Dyes from Aqueous Environment. Sustain. Agric. Rev. 2019, 34, 247–263. [Google Scholar]
  29. Kumar, A.; Jena, H.M. Preparation and characterization of high surface area activated carbon from Fox nut (Euryale ferox) shell by chemical activation with H3PO4. Results Phys. 2016, 6, 651–658. [Google Scholar] [CrossRef] [Green Version]
  30. Thitame, P.V.; Shukla, S.R. Adsorptive removal of reactive dyes from aqueous solution using activated carbon synthesized from waste biomass materials. Int. J. Environ. Sci Technol. 2016, 13, 561–570. [Google Scholar] [CrossRef] [Green Version]
  31. Gao, X.L.; Wu, Z.; Li, Q.; Xu, W.; Tian, R.W. Preparation and characterization of high surface area activated carbon from pine wood sawdust by fast activation with H3PO4 in a spouted bed, J Mater Cycles Waste Manag Journal of Material Cycles and Waste Management. J. Mater. Cycles Waste Manag. 2018, 20, 925–936. [Google Scholar] [CrossRef]
  32. Al-Oqla, F.M.; Alothman, O.Y.; Jawaid, M.; Sapuan, S.M.; Es-Saheb, M.H. Processing and Properties of Date Palm Fibers and Its Composites. Biomass Bioenergy 2014, 1–25. [Google Scholar] [CrossRef]
  33. Alhogbi, B.G.; Salam, M.A.; Ibrahim, O. Environmental Remediation of Toxic Lead Ions from Aqueous Solution Using Palm Tree Waste Fibers Biosorbent. Desal. Water Treat. 2019, 145, 179–188. [Google Scholar] [CrossRef]
  34. Chahinez, H.O.; Abdelkader, O.; Leila, Y.; Tran, H.N. One-stage preparation of palm petiole-derived biochar: Characterization and application for adsorption of crystal violet dye in water. Env. Technol. Innov. 2020, 19, 100872. [Google Scholar] [CrossRef]
  35. Salazar-Rabago, J.; Leyva-Ramos, R. Novel Biosorbent with High Adsorption Capacity Prepared by Chemical Modification of White Pine (Pinus Durangensis) Sawdust. Adsorption of Pb (II) from Aqueous Solutions. J. Environ. Manag. 2016, 169, 303–312. [Google Scholar] [CrossRef] [PubMed]
  36. Wang, S.; Zhu, Z.; Coomes, A.; Haghseresht, F.; Lu, G. The Physical and Surface Chemical Characteristics of Activated Carbons and the Adsorption of Methylene Blue from Wastewate. J. Colloid Interface Sci. 2005, 284, 440–446. [Google Scholar] [CrossRef] [PubMed]
  37. Jabar, J.M.; Odusote, Y.A.; Alabi, K.A.; Ahmed, I.B. Kinetics and mechanisms of congo-red dye removal from aqueous solution using activated Moringa oleifera seed coat as adsorbent. Appl. Water Sci. 2020, 10, 1–11. [Google Scholar] [CrossRef]
  38. Deng, J.; Xiong, T.; Wang, H.; Zheng, A.; Wang, Y. Effects of Cellulose, Hemicellulose, and Lignin on the Structure and Morphology of Porous Carbons. Sustain. Chem. Eng. 2016, 4, 3750–3756. [Google Scholar] [CrossRef]
  39. Ojedokun, A.T.; Bello, O.S. Kinetic modeling of liquid-phase adsorption of Congo red dye using guava leaf-based activated carbon. Appl. Water Sci. 2017, 7, 1965–1977. [Google Scholar] [CrossRef] [Green Version]
  40. Yakout, S.M.; El-Deen, G.S. Characterization of activated carbon prepared by phosphoric acid activation of olive stones. Arabian J. Chem. 2016, 9, S1155–S1162. [Google Scholar] [CrossRef] [Green Version]
  41. Nasser, R.A.; Salem, S.M.Z.; Hiziroglu, H.A.; Al-Mefarrej, A.S.; Mohareb, M.; Alam, I.M.A. Chemical Analysis of Different Parts of Date Palm (Phoenix Dactylifera L.) Using Ultimate, Proximate and Thermo-Gravimetric Techniques for Energy Production. Energies 2016, 9, 374. [Google Scholar] [CrossRef] [Green Version]
  42. Daoud, M.; Benturki, O.; Kecira, Z.; Daoud, M.; Girods, P.; Donnot, A. Removal of Reactive dye (BEZAKTIV Red S-MAX) from Aqueous Solution by Adsorption onto Activated Carbons Prepared from Date Palm Rachis and Jujube Stones. J. Mol. Liq. 2017, 243, 799–809. [Google Scholar] [CrossRef]
  43. Buhani1, S.; Aditiya, I.; Al Kausar, R.; Sumadi; Rinawati. Production of a Spirulina sp. Algae Hybrid with a Silica Matrix as an Effective Adsorbent to Absorb Crystal Violet and Methylene Blue in a Solution. Sustain. Environ. Res. 2019, 29, 27. [Google Scholar]
  44. Marsh, H.; Rodríguez-Reinoso, F. Activated Carbon, Activation Processes (Chemical). Elsevire (Lond. UK) 2006, 6, 322–365. [Google Scholar]
  45. Yorgun, S.; Yildiz, D. Preparation and Characterization of Activated Carbons from Paulownia Wood by Chemical Activation with H3PO4. J. Taiwan Inst. Chem. Eng. 2015, 53, 122–131. [Google Scholar] [CrossRef]
  46. Pego, M.F.F.; Veiga, T.R.L.A.; Bianchi, M.; Carvalho, L. Surface modification of activated carbon by corona treatment. J. Ann. Braz. Acad. Sci. 2019, 91, 1678–2690. [Google Scholar] [CrossRef] [PubMed]
  47. Inyinbor, A.A.; Adekola, F.A.; Olatunji, G.A. Kinetics and isothermal modeling of liquid phase adsorption of rhodamine B onto urea modified Raphia hookerie epicarp. App. Water Sci. 2017, 7, 3257–3266. [Google Scholar] [CrossRef] [Green Version]
  48. Sivarajan, A.; Shanmugapriya, V. Determination of isotherm parameters for the adsorption of Rhodamine B dye onto activated carbon prepared from Ziziphus jujuba seeds. Asian J. Res. Chem. 2017, 10, 362. [Google Scholar] [CrossRef]
  49. Langmuir, I. The Adsorption of Gases on Plane Surfaces of Glass, Mica and Platinum. Am. Chem. Soc. 1968, 40, 1361–1402. [Google Scholar] [CrossRef] [Green Version]
  50. Urano, K.; Koichi, Y.; Nakazawa, Y. Equilibria for adsorption of organic compounds on activated carbons in aqueous solutions I. Modified Freundlich isotherm equation and adsorption potentials of organic compounds. J. Colloid Interface Sci. 1981, 81, 477–485. [Google Scholar] [CrossRef]
  51. Zamri, T.K.; Abdul Munaim, M.S.; Abdul Wahid, Z. Regression analysis for the adsorption isotherms of natural dyes onto bamboo yarn. Int. Res. J. Eng. Technol. 2017, 4, 1699–1703. [Google Scholar]
  52. Tor, A.; Cengeloglu, Y. Removal of Congo Red from Aqueous Solution by Adsorption onto Acid Activated Red Mud. J. Hazard. Mater. 2006, 138, 409–415. [Google Scholar] [CrossRef]
  53. Pathak, U.; Jhunjhunwala, A.; Roy, A.; Das, P.; Kumar, T.; Mandal, T. Efficacy of spent tea waste as chemically impregnated adsorbent involving ortho-phosphoric and sulphuric acid for abatement of aqueous phenol—Isotherm, kinetics and artificial neural network modelling. Environ. Sci. Pollut. Res. 2020, 27, 20629–20647. [Google Scholar] [CrossRef] [PubMed]
  54. Auta, M.; Hameed, B. Coalesced Chitosan Activated Carbon Composite for Batch and Fixed-Bed Adsorption of Cationic and Anionic Dyes. Colloids Surf. B Biointerfaces 2013, 105, 199–206. [Google Scholar] [CrossRef] [PubMed]
  55. Ahmad, R.; Kumar, R. Adsorptive Removal of Congo Red Dye from Aqueous Solution Using Bael Shell Carbon. Appl. Surf. Sci. 2010, 257, 1628–1633. [Google Scholar] [CrossRef]
  56. Hu, L.; Guang, C.; Liu, Y.; Su, Z.; Gong, S.; Yao, Y.; Wang, Y. Adsorption behavior of dyes from an aqueous solution onto composite magnetic lignin adsorbent. Chemosphere 2020, 246, 125757. [Google Scholar] [CrossRef] [PubMed]
Figure 1. (a) Date palm tree, (b) Palm fibers, (c) Palm fibers powder, and (d) Activated carbon powder.
Processes 09 00416 g001
Figure 2. (a) Adsorption/desorption isotherm and (b) pore size distribution of activated carbon from palm tree fiber (PTFAC).
Processes 09 00416 g002
Figure 3. (a) Zeta potential and (b) Point of zero charge of PTFAC.
Processes 09 00416 g003
Figure 4. (a) SEM image of palm tree fiber carbonized at 400 °C and (b) TEM image of PTFAC.
Processes 09 00416 g004
Figure 5. The comparison of Fourier transform infrared spectroscopy (FTIR) spectra of palm tree fiber (PTF) before and after the activation and after adsorption of Rhodamine B (RhB) and Congo red (CR) dyes by PTFAC.
Processes 09 00416 g005
Figure 6. The removal percentage of CR and RhB dyes on the synthesized PTFAC with different (a) chemical activation reagents, (b) activation temperature of CA-PTF-H3PO4, and (c) activation times of CA-PTF-H3PO4 at 400 °C.
Processes 09 00416 g006
Figure 7. Influence of (a) pH, (b) contact time, (c) initial concentration, and (d) adsorbent dosage on elimination the RhB and CR dyes from solution by PTFAC (test conditions: T = 298 K, V = 20 mL).
Processes 09 00416 g007
Figure 8. Adsorption isotherms: Langmuir model of (a) CR dye; (b) RhB dye and Freundlich model for the adsorption of (c) CR dye; (d) RhB dye by PTFAC (reaction conditions: T= 298 K, pH = 2.0, Co = 25 mg L−1, mass = 0.15 g, V = 20 mL, shaking time = 120 min).
Processes 09 00416 g008
Figure 9. Adsorption kinetics: pseudo-first-order model of (a) CR dye; (b) RhB dye and pseudo-second-order model for the adsorption of (c) CR dye; (d) RhB dye by PTFAC (reaction conditions: T= 298 K, pH = 2.0, Co = 25 mg L−1, mass = 0.15 g, V = 20 mL).
Processes 09 00416 g009
Figure 10. Regeneration cycle of PTFAC after adsorption by RhB and CR dyes.
Processes 09 00416 g010
Table 1. Properties of synthetic dyes.
DyesRhodamine B (RhB)Congo Red (CR)
Molecular formulaC28H31N2O3ClC32H22N6Na2O6S2
Molecular structure Processes 09 00416 i001 Processes 09 00416 i002
Molecular weight (g/mol)479.02696.66
Chemical/Dye classXanthene dyeDiazo dye
λmax (nm)554 nm496 nm
Table 2. Adsorption isotherm parameters calculated for RhB and CR dyes adsorbed by PTFAC*.
Adsorption IsothermParametersCRRhB
Langmuirqmax (mg g−1)/Co (25 mg L−1)10.426.5
Kl (L mg−1)81.911264.5
Rl0.040.034
R20.9960.980
χ20.0131 × 10⁻³
FreundlichKf (mg g−1) (mg L−1)0.243.07 × 102
1/n−1.431.357
R20.8570.854
χ24.1313 × 10⁻³
* Reaction conditions: T= 298 K, pH = 2.0, Co = 25 mg L−1, mass = 0.15 g/ 20 mL, shaking time = 120 min.
Table 3. Adsorption kinetics parameters calculated for RhB and CR dyes adsorbed on PTFAC*.
Kinetic ModelsParametersCRRhB
Pseudo first orderqe,cal (mg g−1)0.4080.006
k1 (1/min)−0.031−0.023
R20.900.72
χ251.053732.3
Pseudo second orderqe,cal (mg g−1)4.9924.998
k2 (g mg−1 min−1)1.35 × 10−39.75 × 10−3
R20.9991
χ27.744 × 10−52.011 × 10−8
qe,exp 4.9724.999
* Reaction conditions: T = 298 K, 0.15 g/20 mL, Co = 25 mg L−1.
Table 4. Desorption percentage of CR and RhB dyes by PTFAC with different desorption reagents.
Desorption ReagentDesorption, %
CRRhB
CH3;COOH (0.1 M)90.7899.69
CH3;COOH (0.5 M)92.1099.73
CH3;COOH(1 M)89.4799.65
NaOH (0.1 M)93.4299.77
NaOH (0.5 M)92.1099.81
NaOH (1 M)92.1099.84
H2O (pH 2.5)98.6899.88
H2O (pH 4.5)97.3699.84
H2O (pH 6.5)96.0599.84
H2O (pH 8.5)93.4299.81
H2O (pH 10.5)93.4299.77
Table 5. Adsorptive percent removal of CR and RhB dyes from real water samples by PTFAC.
Tap WaterWell WaterSeawaterSewage Water Treatment Plant
Dyes
% Removal of RhB 99.899.399.498.3
% Removal of CR 99.894.493.392.3
Publisher’s Note: MDPI stays neutral with regard to jurisdictional claims in published maps and institutional affiliations.

