
Pressure Fluctuation Characteristics of High-Speed Centrifugal Pump with Enlarged Flow Design

Abstract
:1. Introduction
2. Theory of Enlarged Flow Design
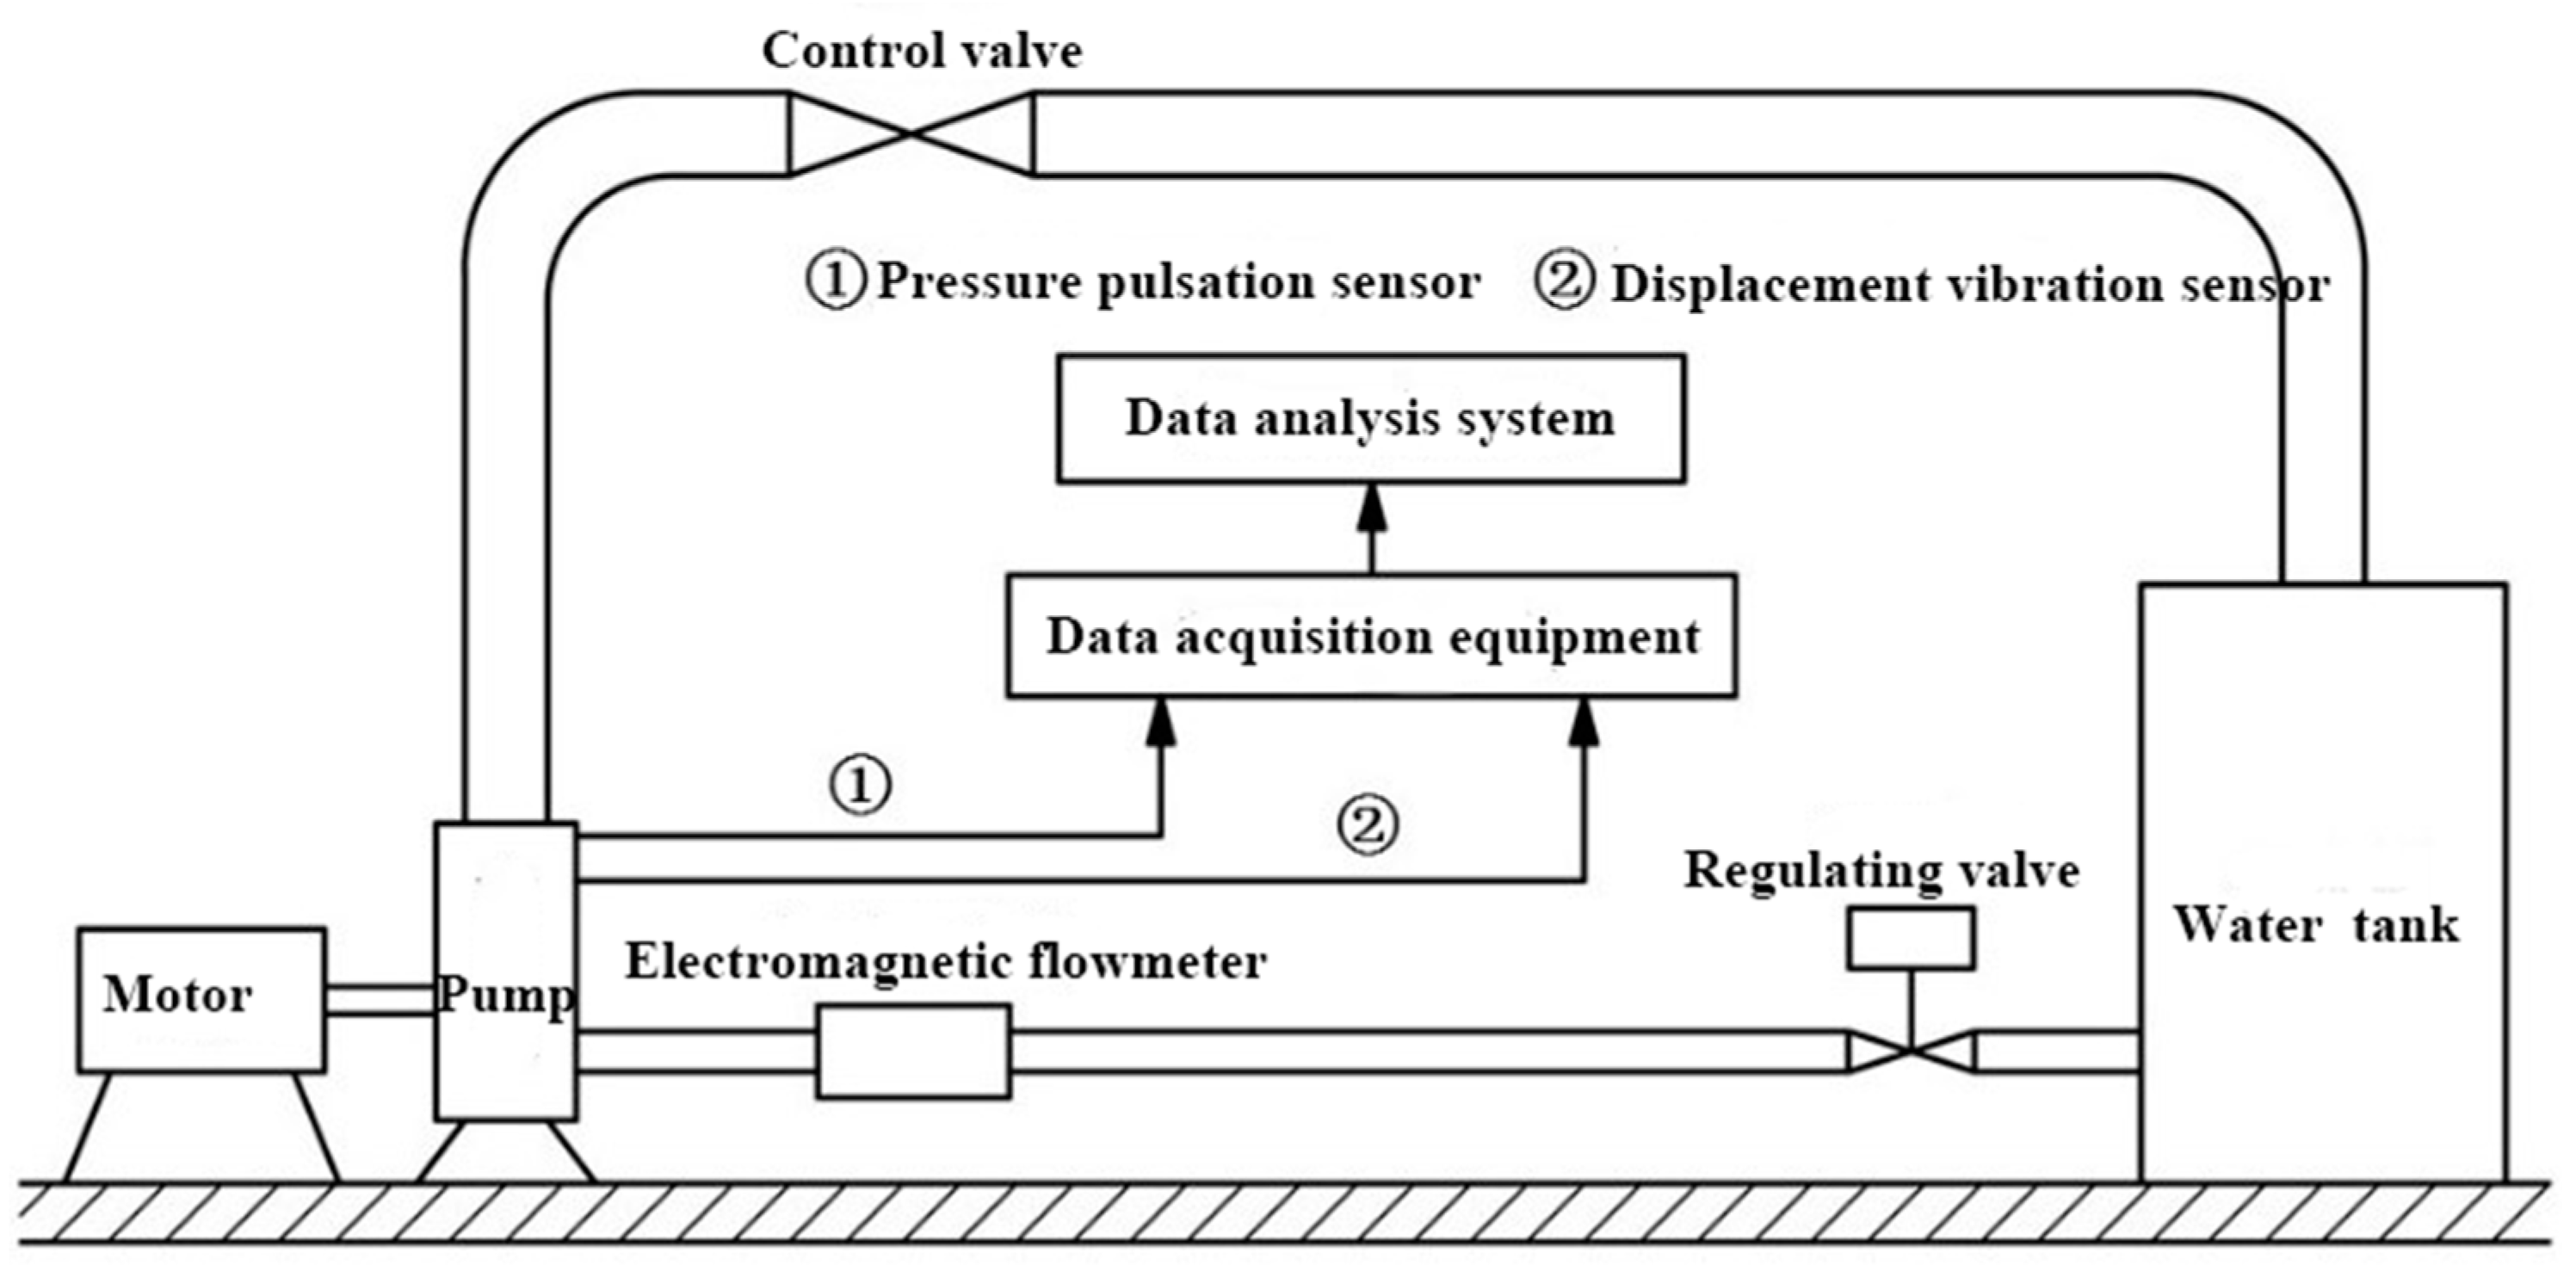
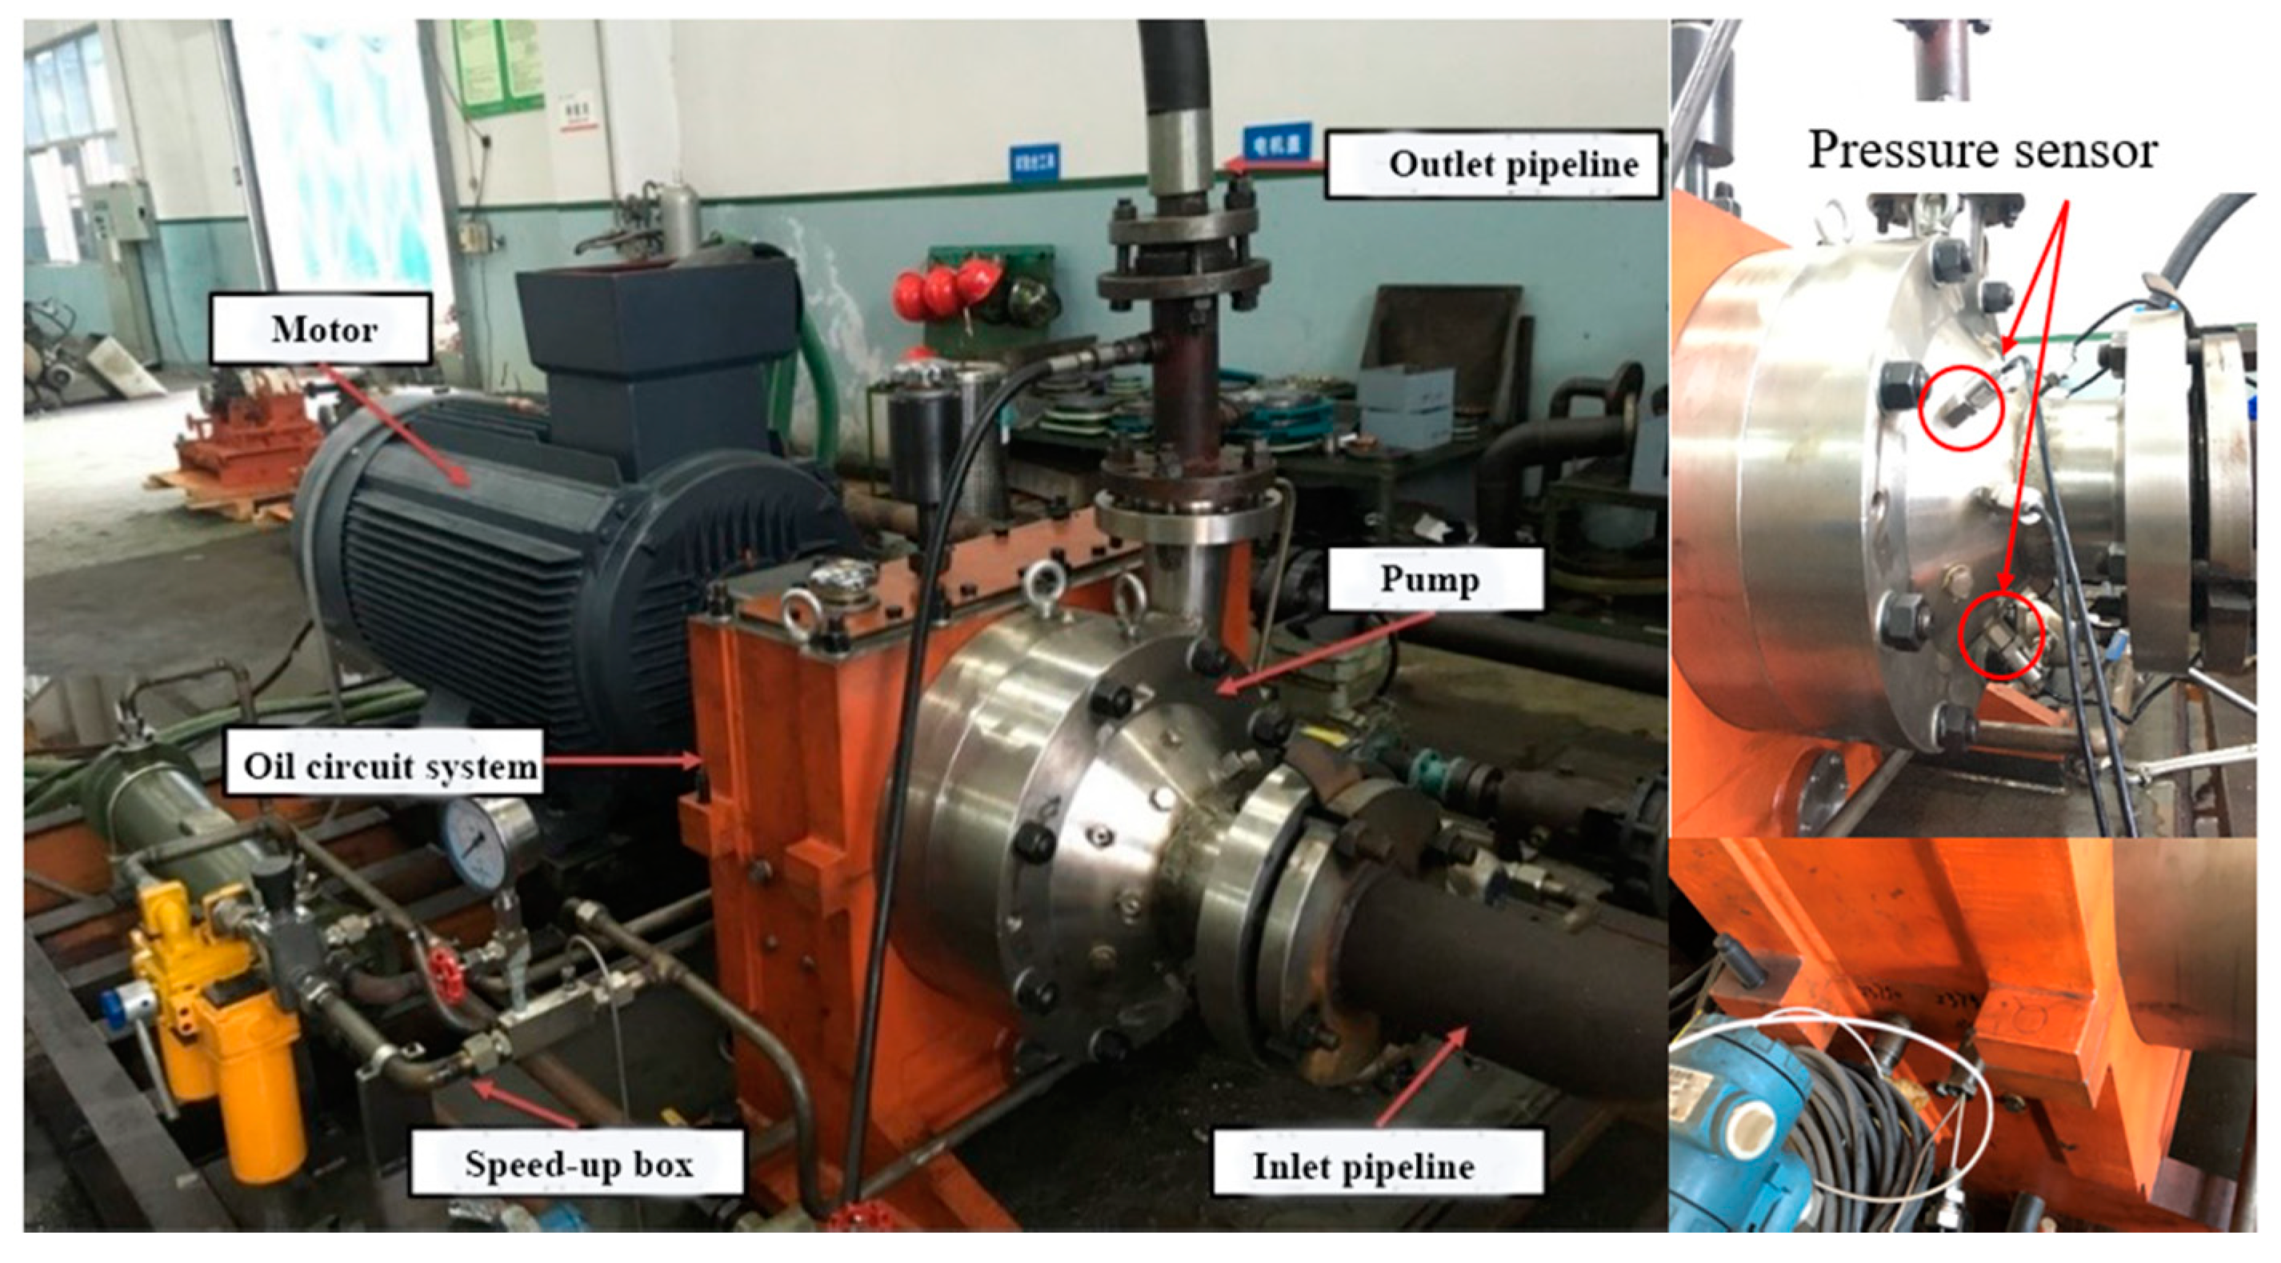
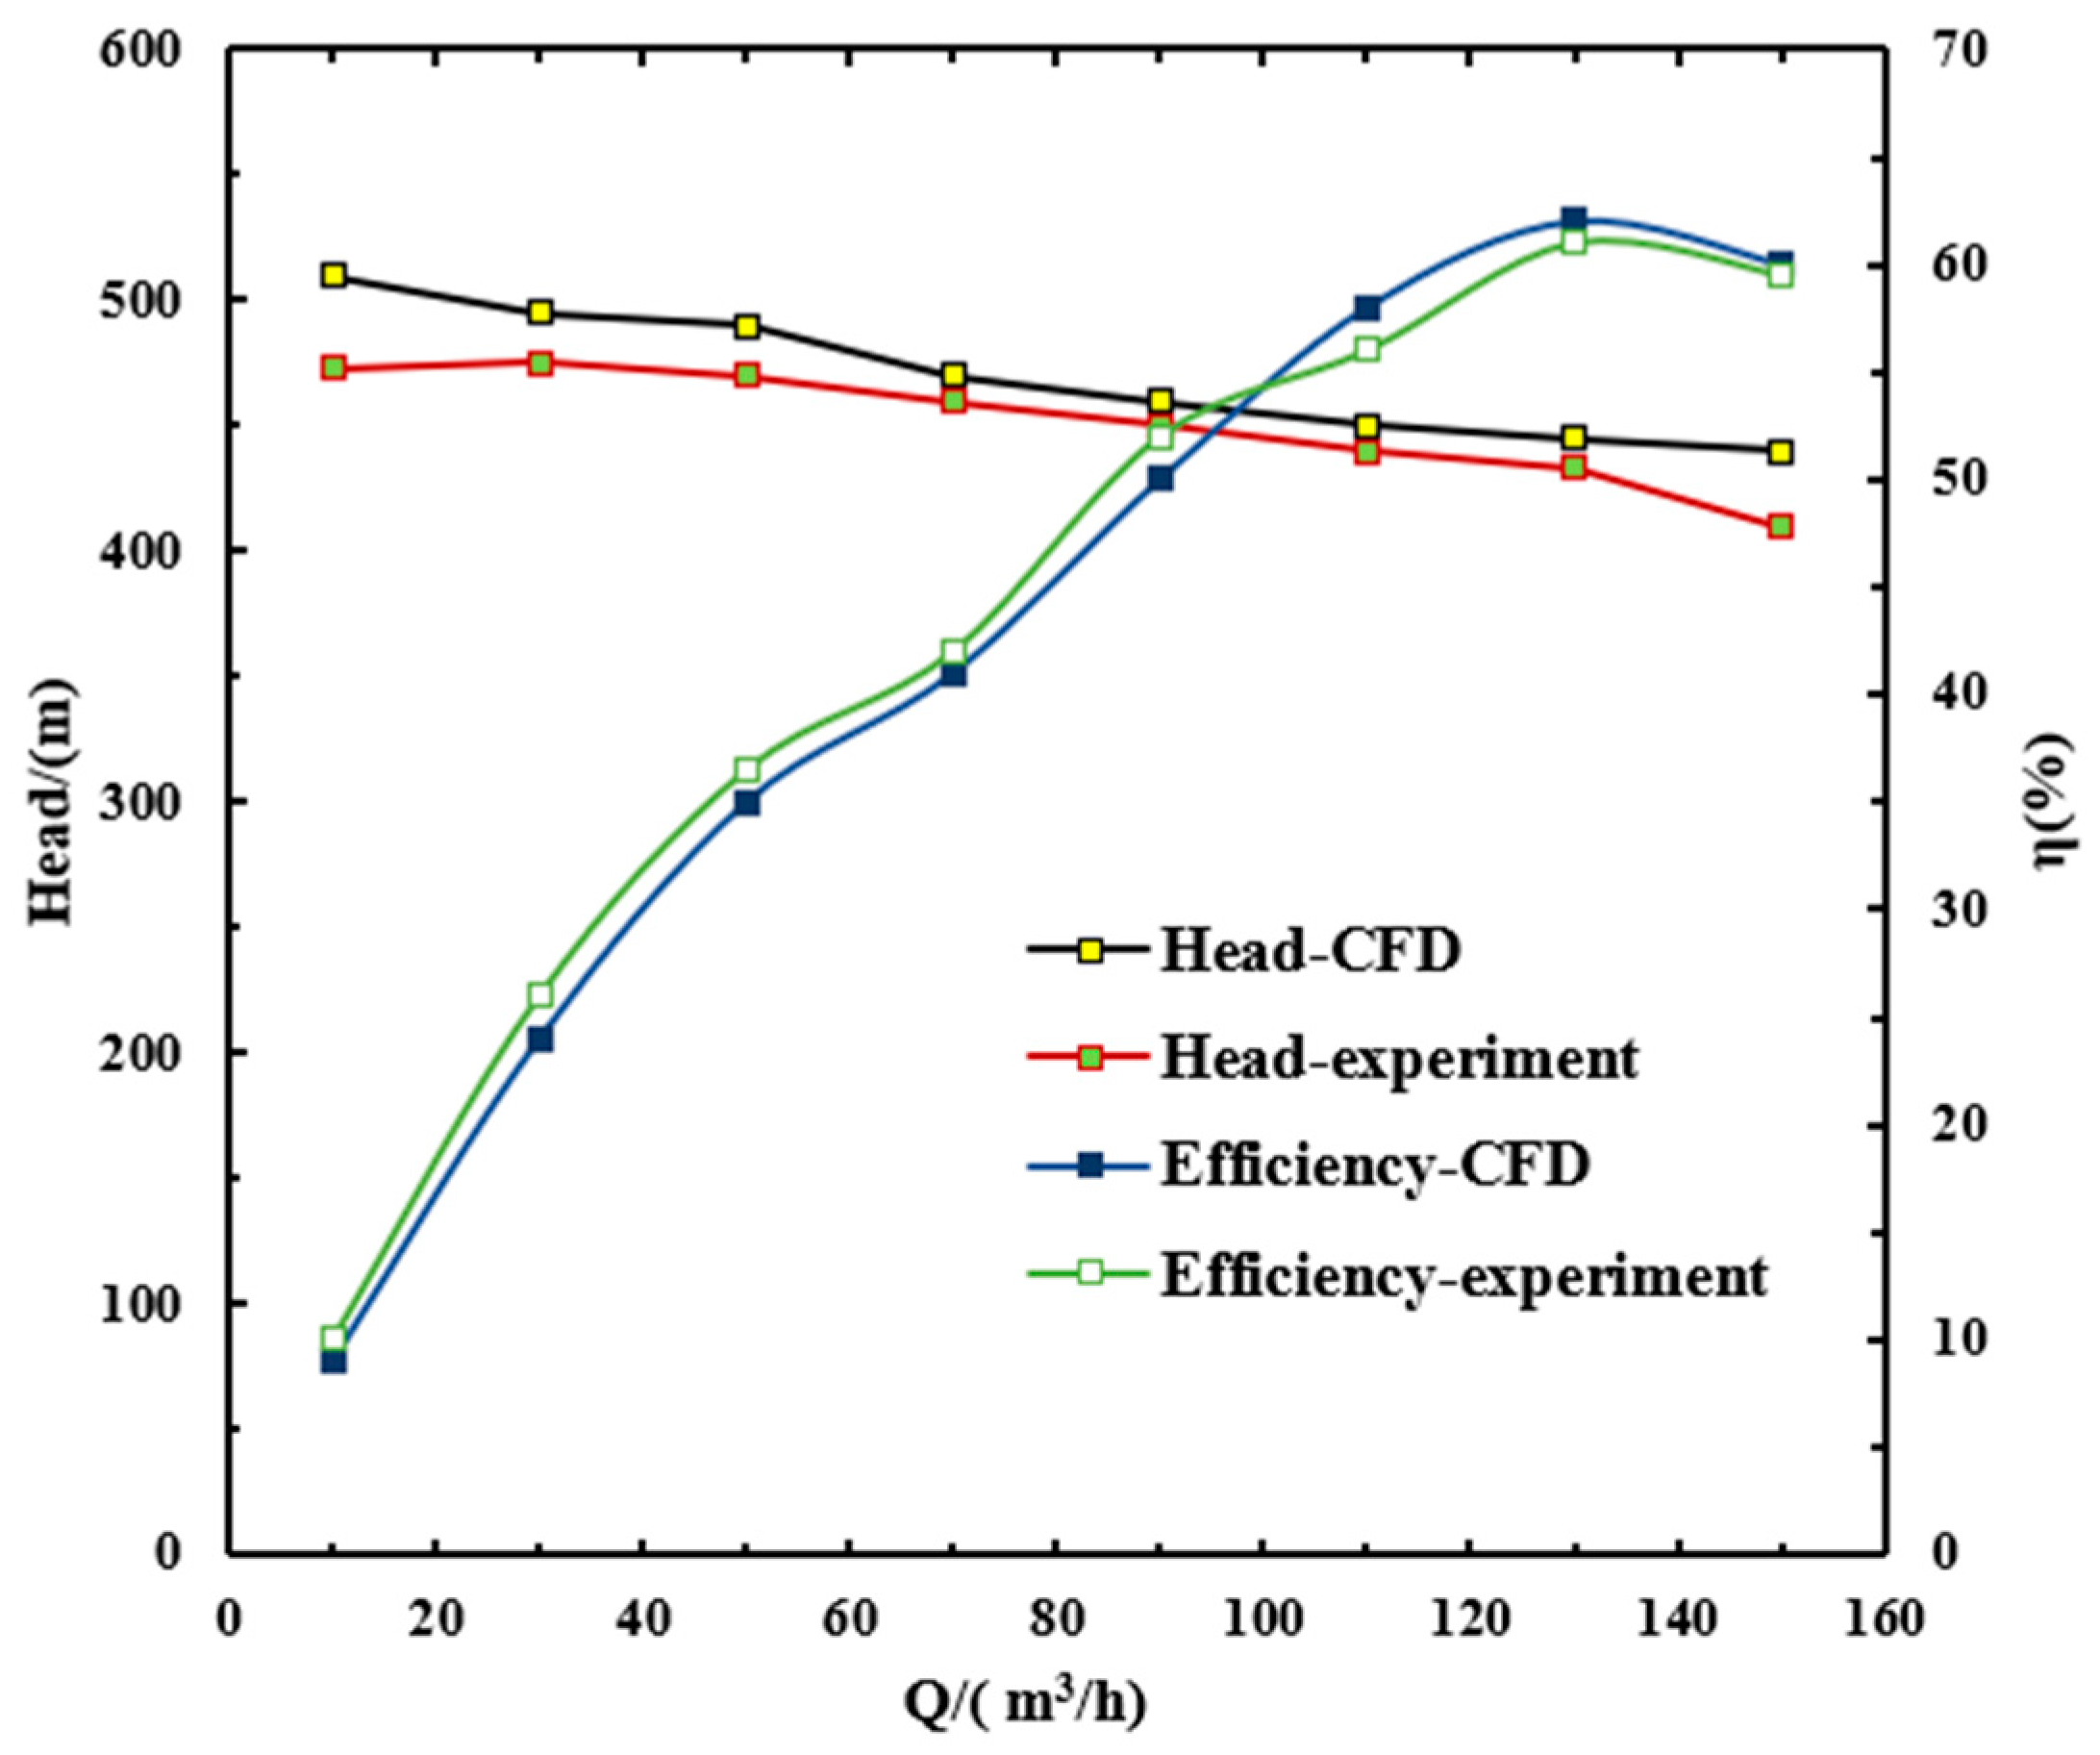
3. Experiment
4. Numerical Setups
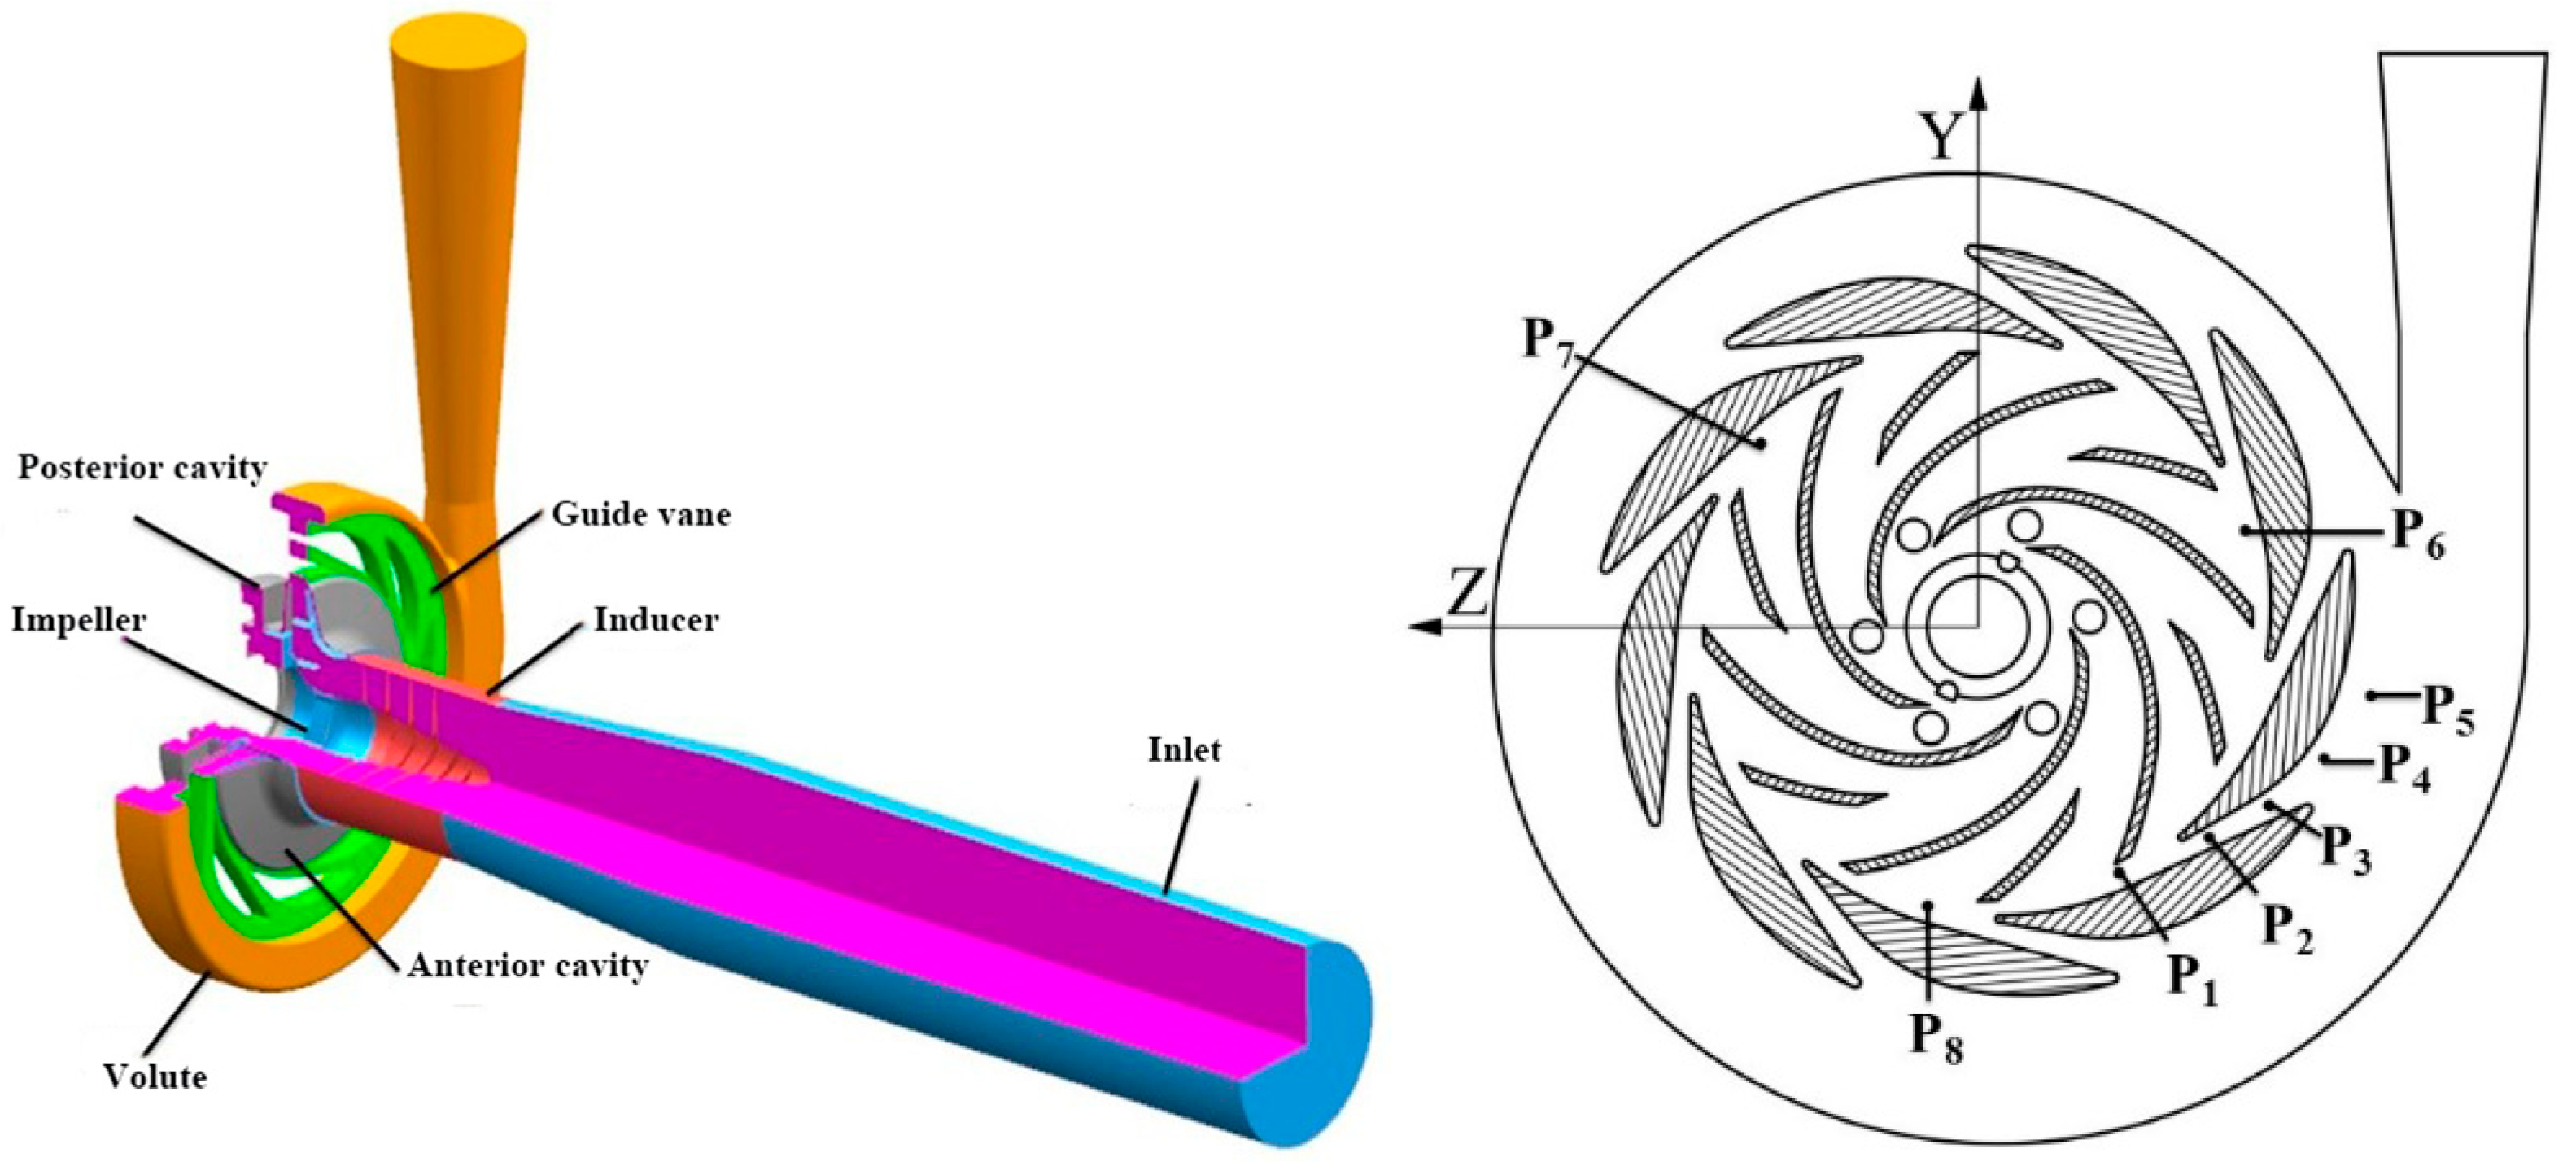
4.1. Pump Model
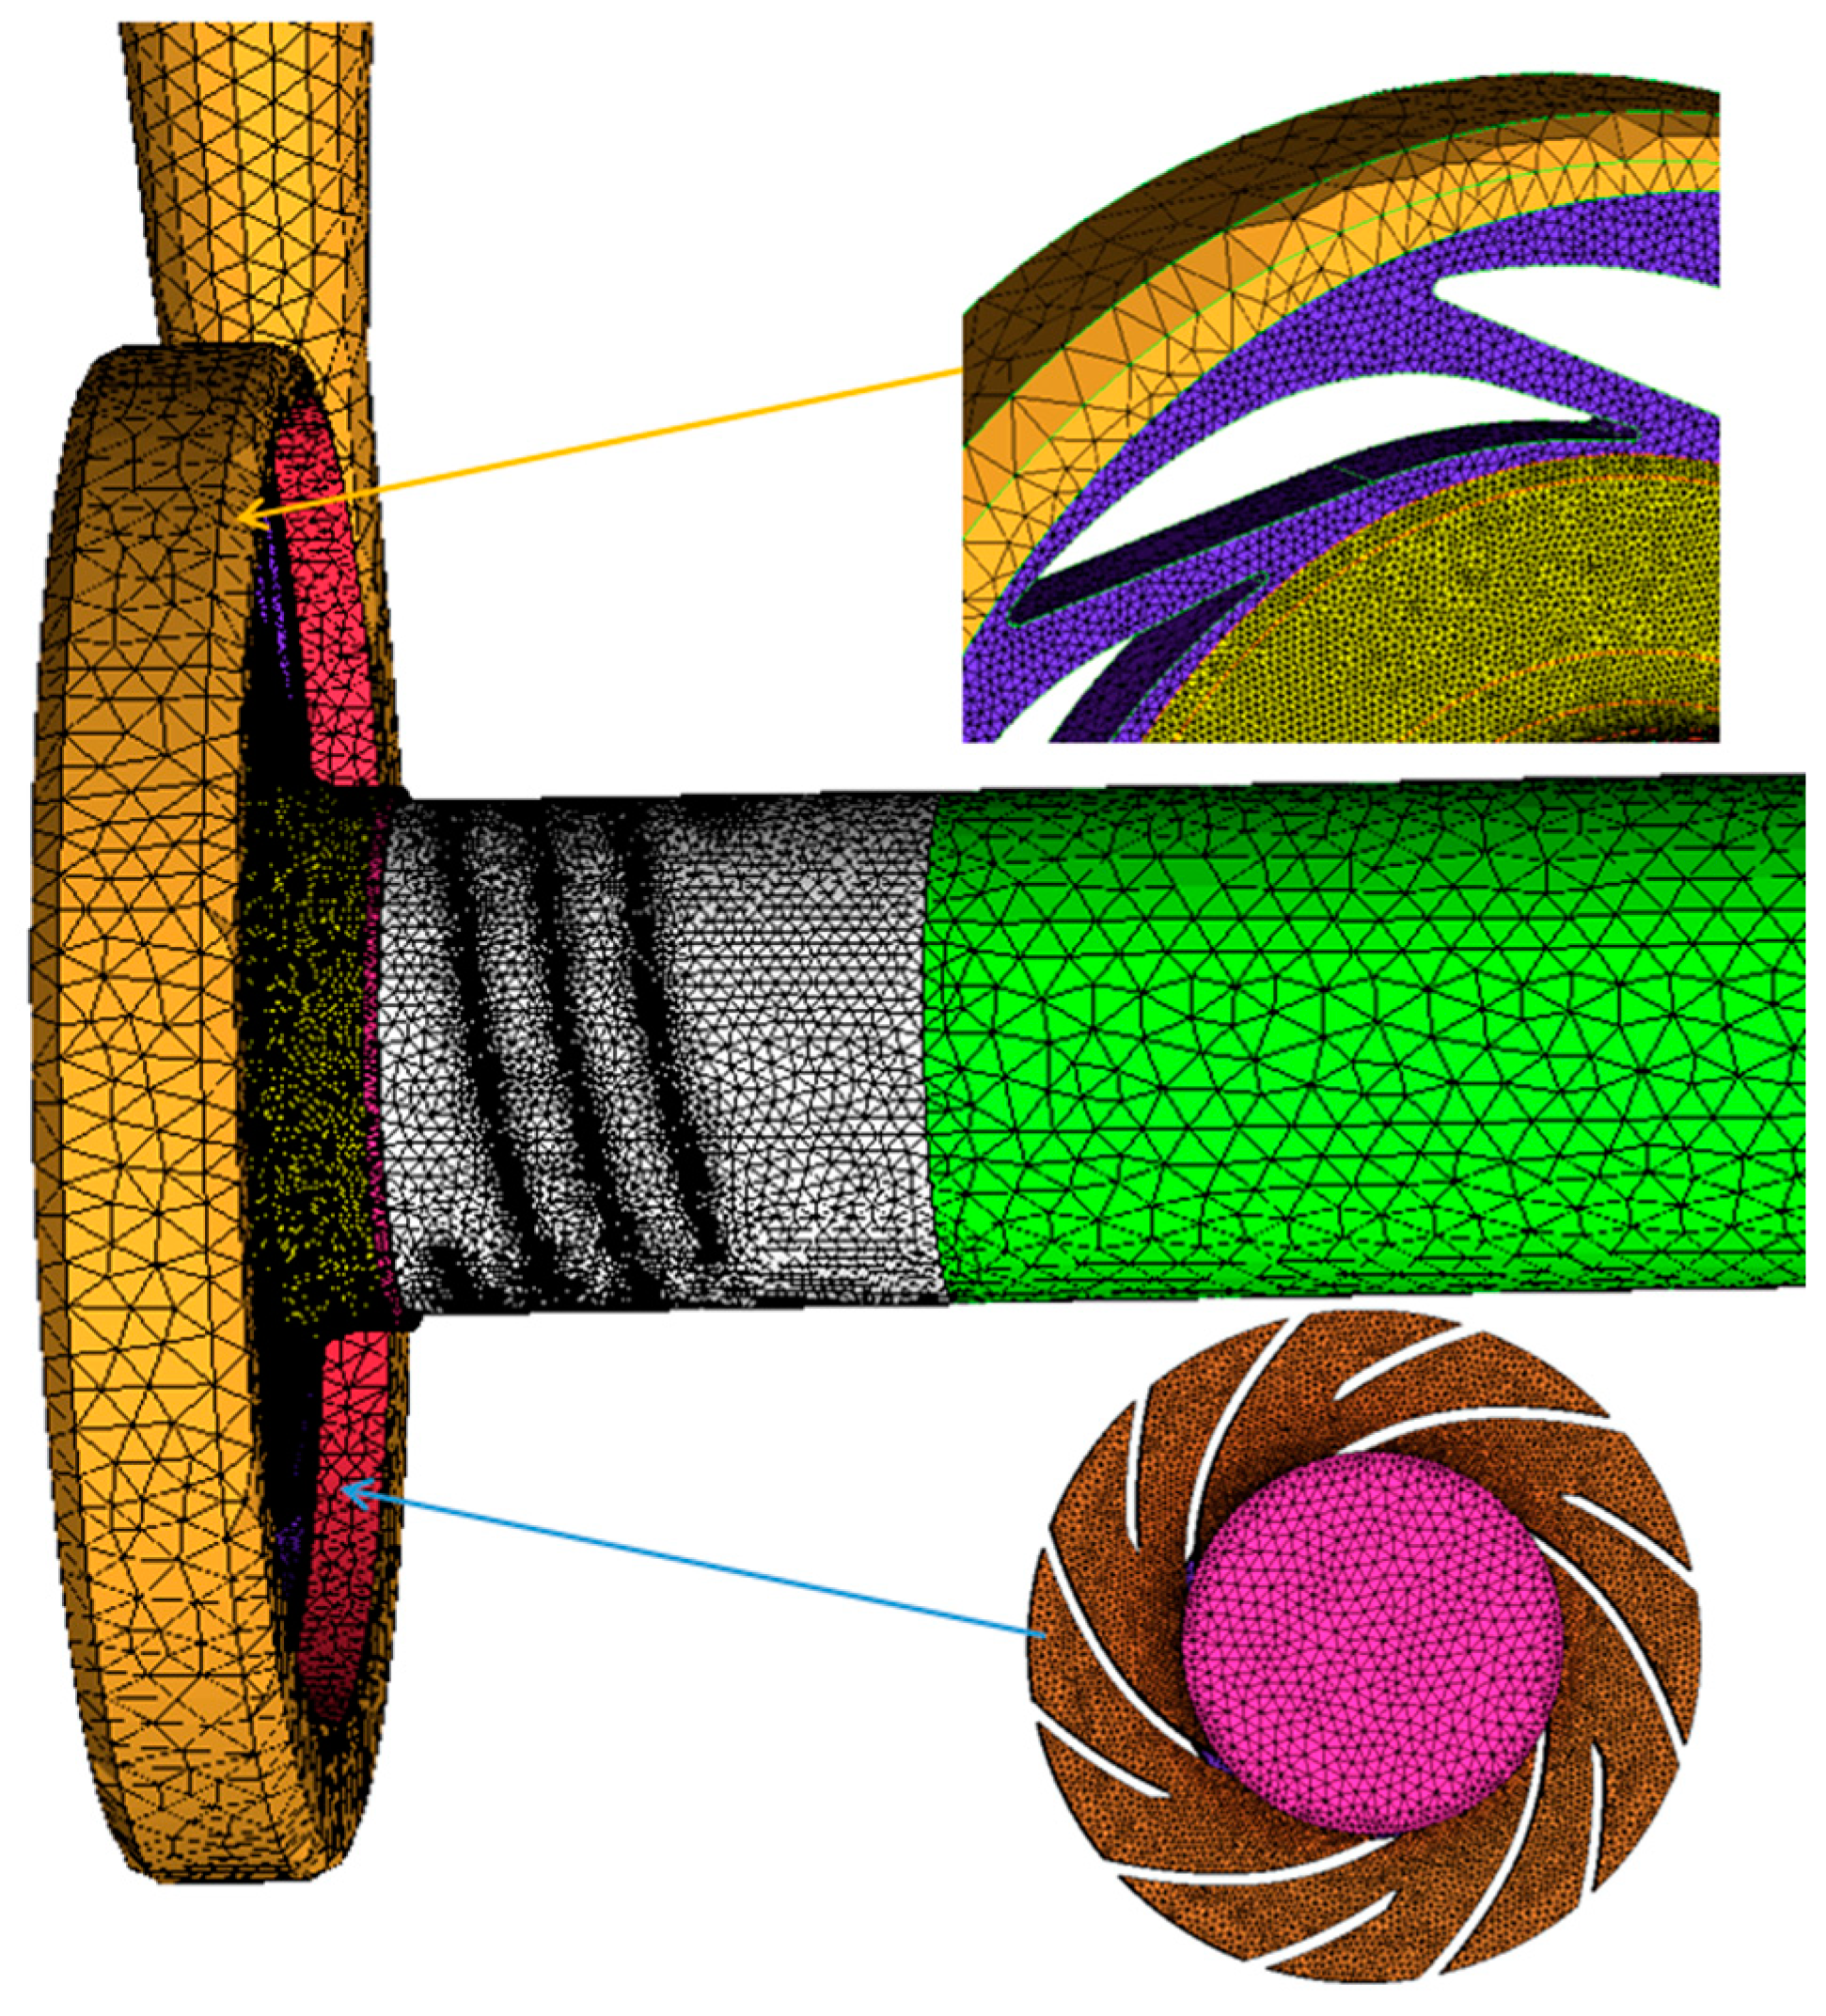
4.2. Mesh
4.3. Turbulence Model
4.4. Boundary Conditions
5. Numerical Results and Analysis
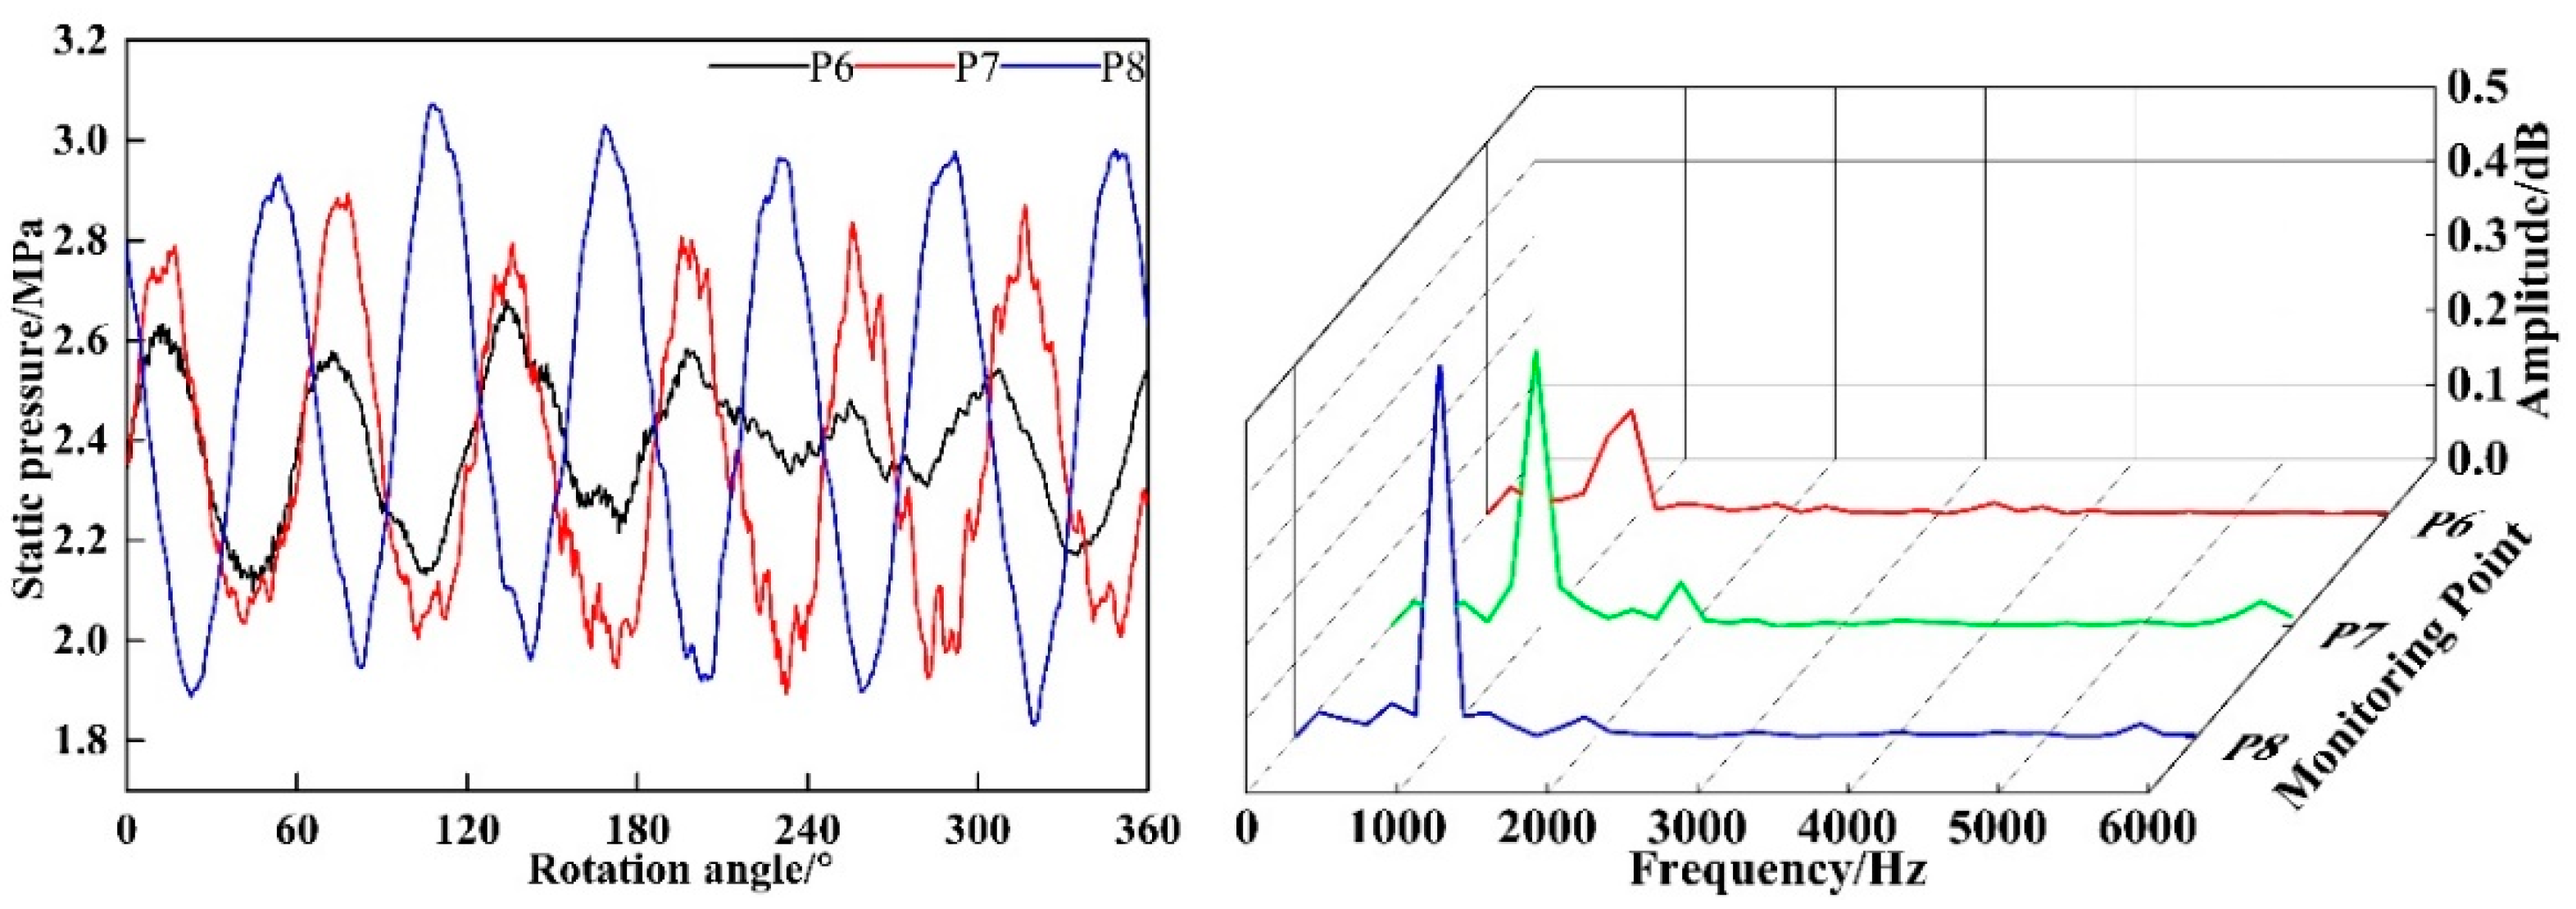
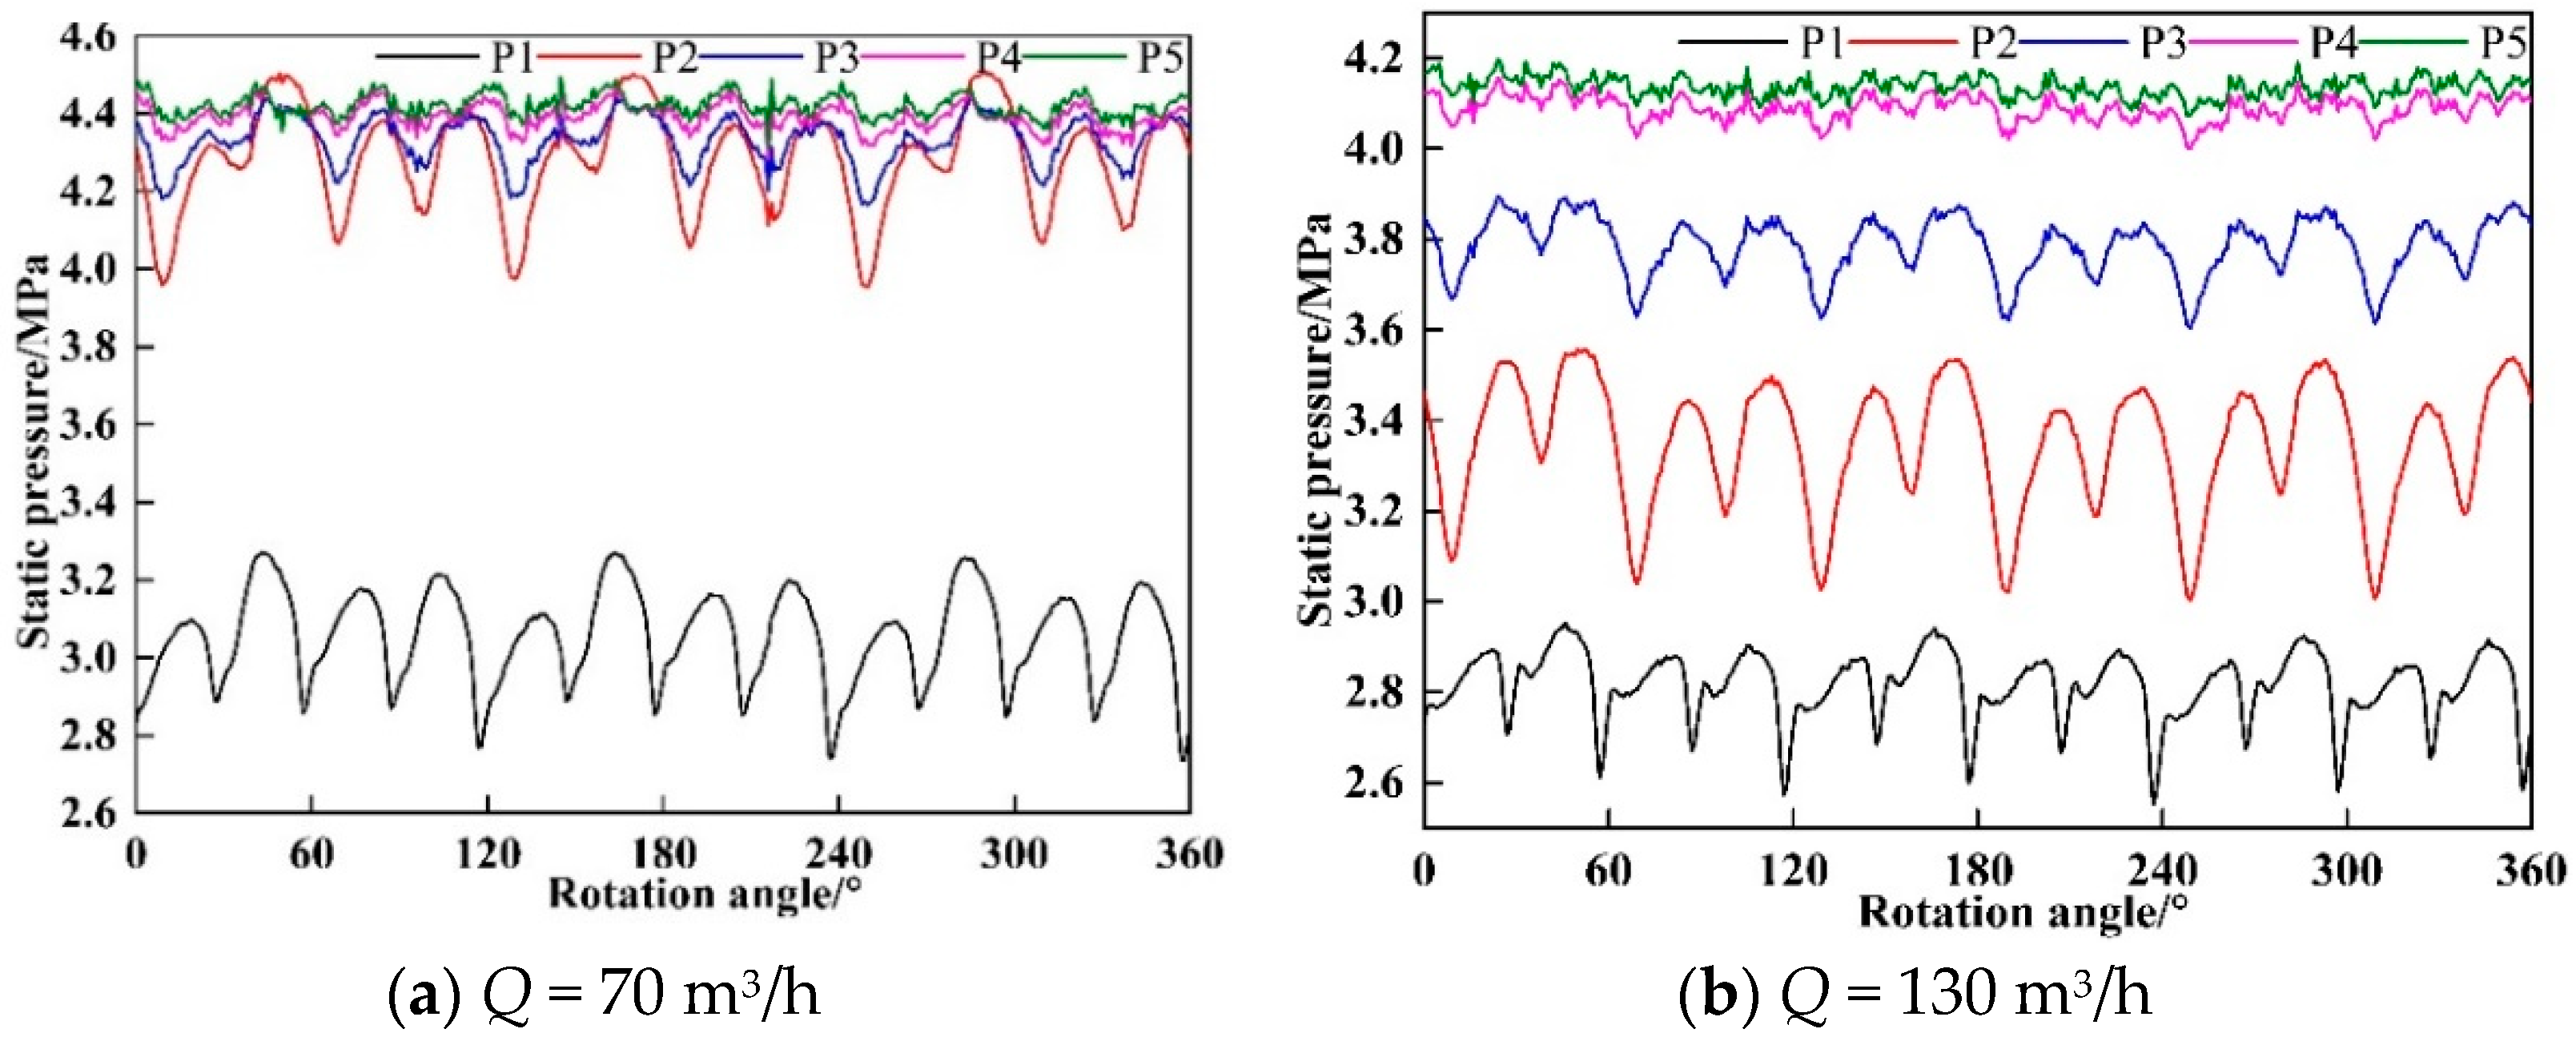
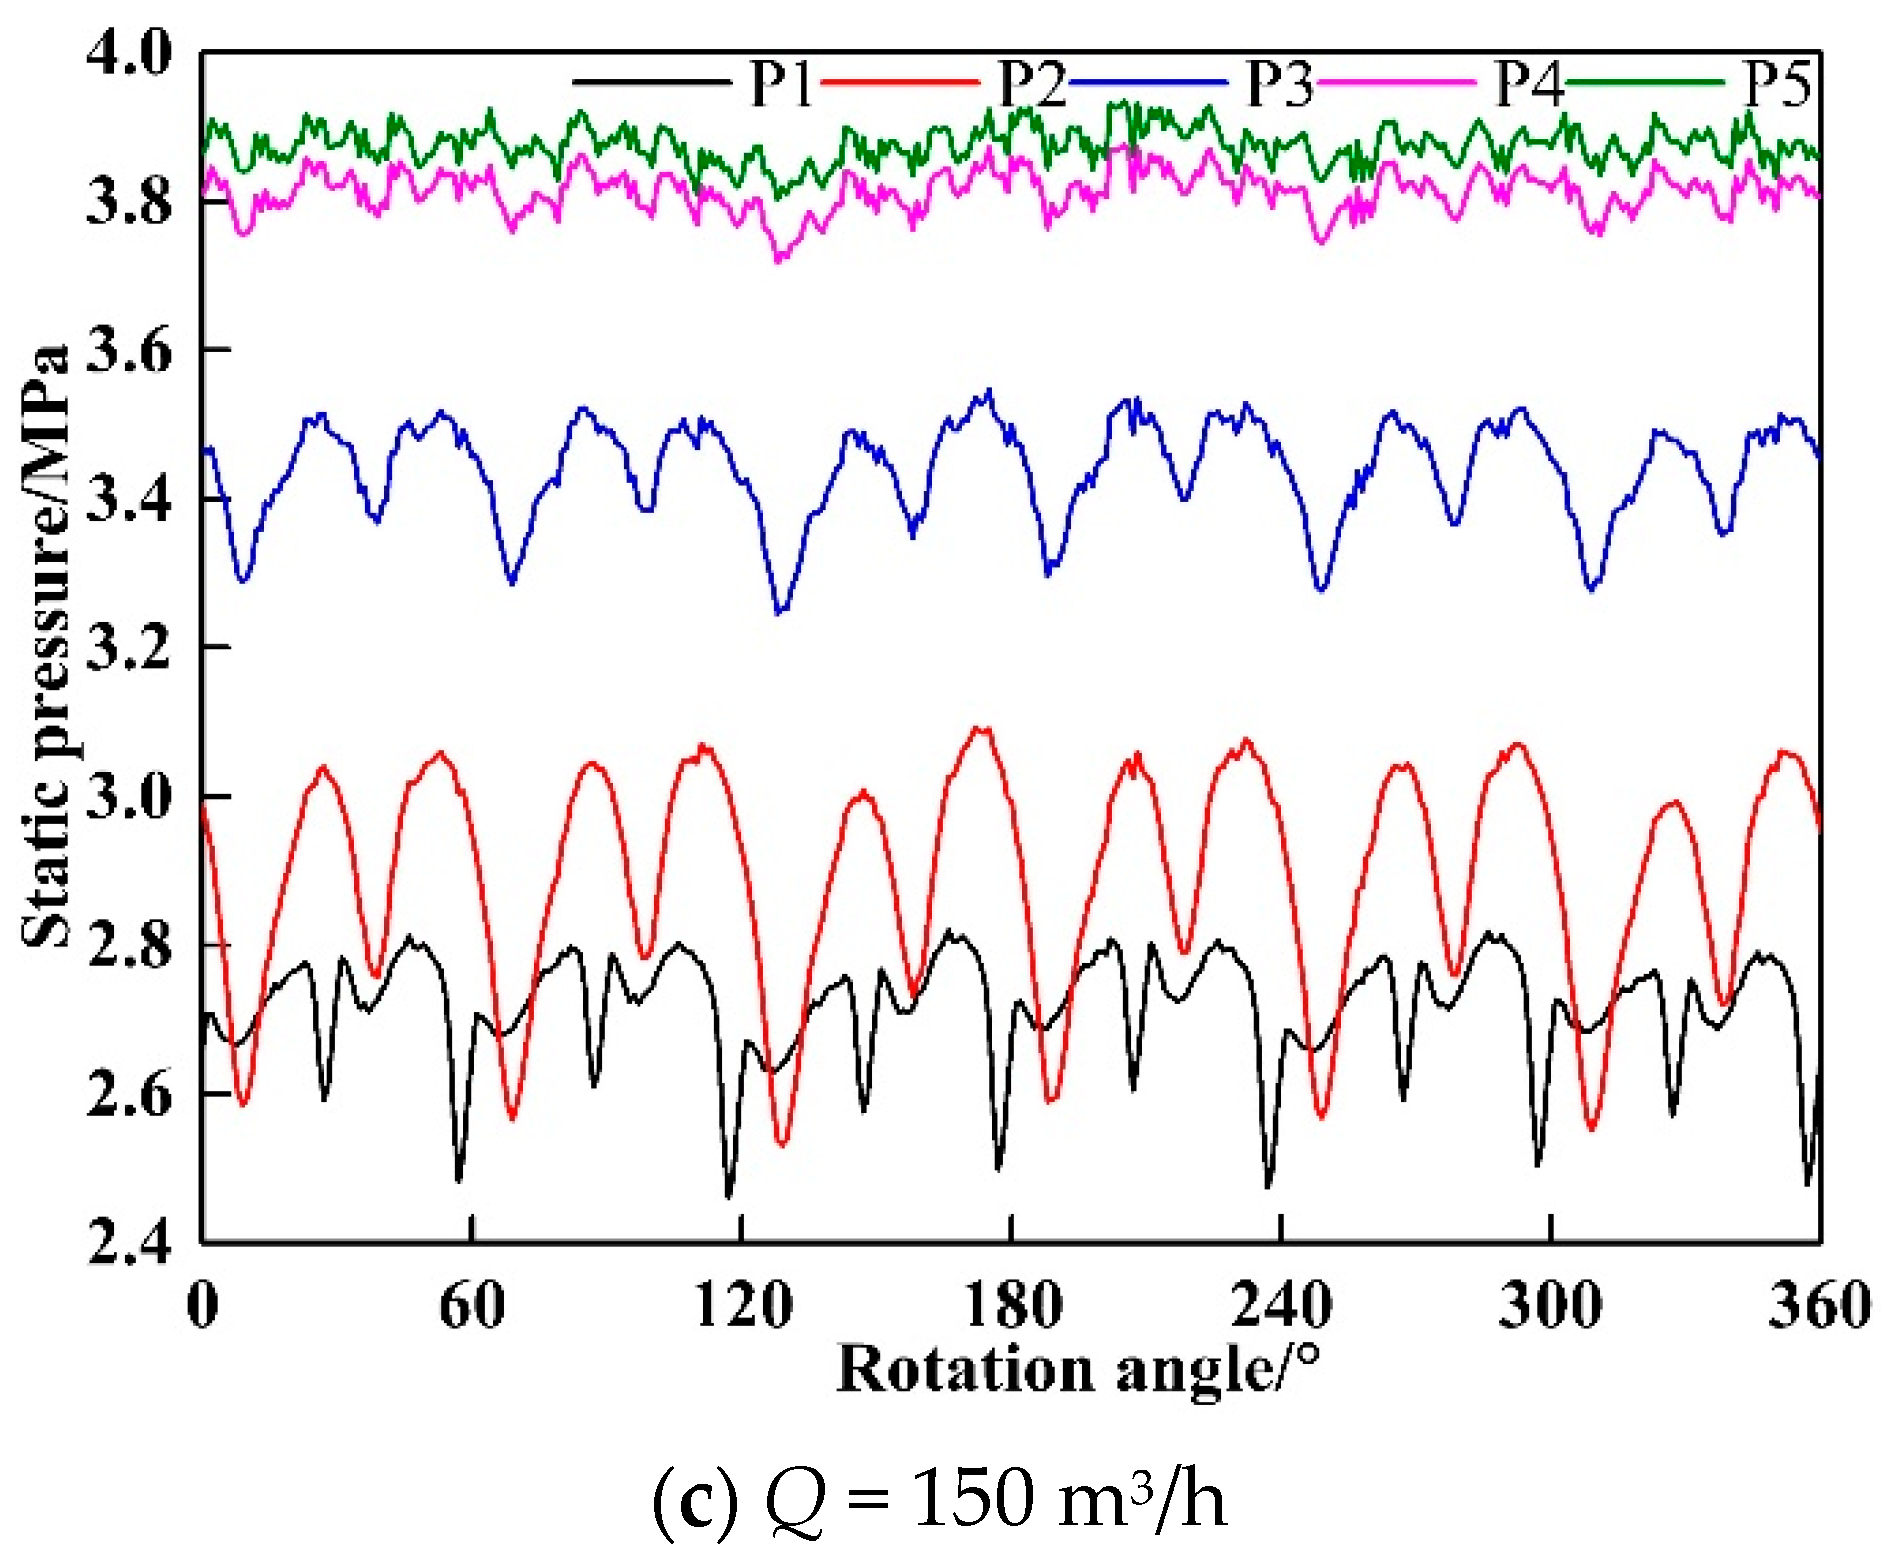
5.1. Pressure Analysis of Guide Vane
5.2. Pressure Analysis of Static and Dynamic Interference
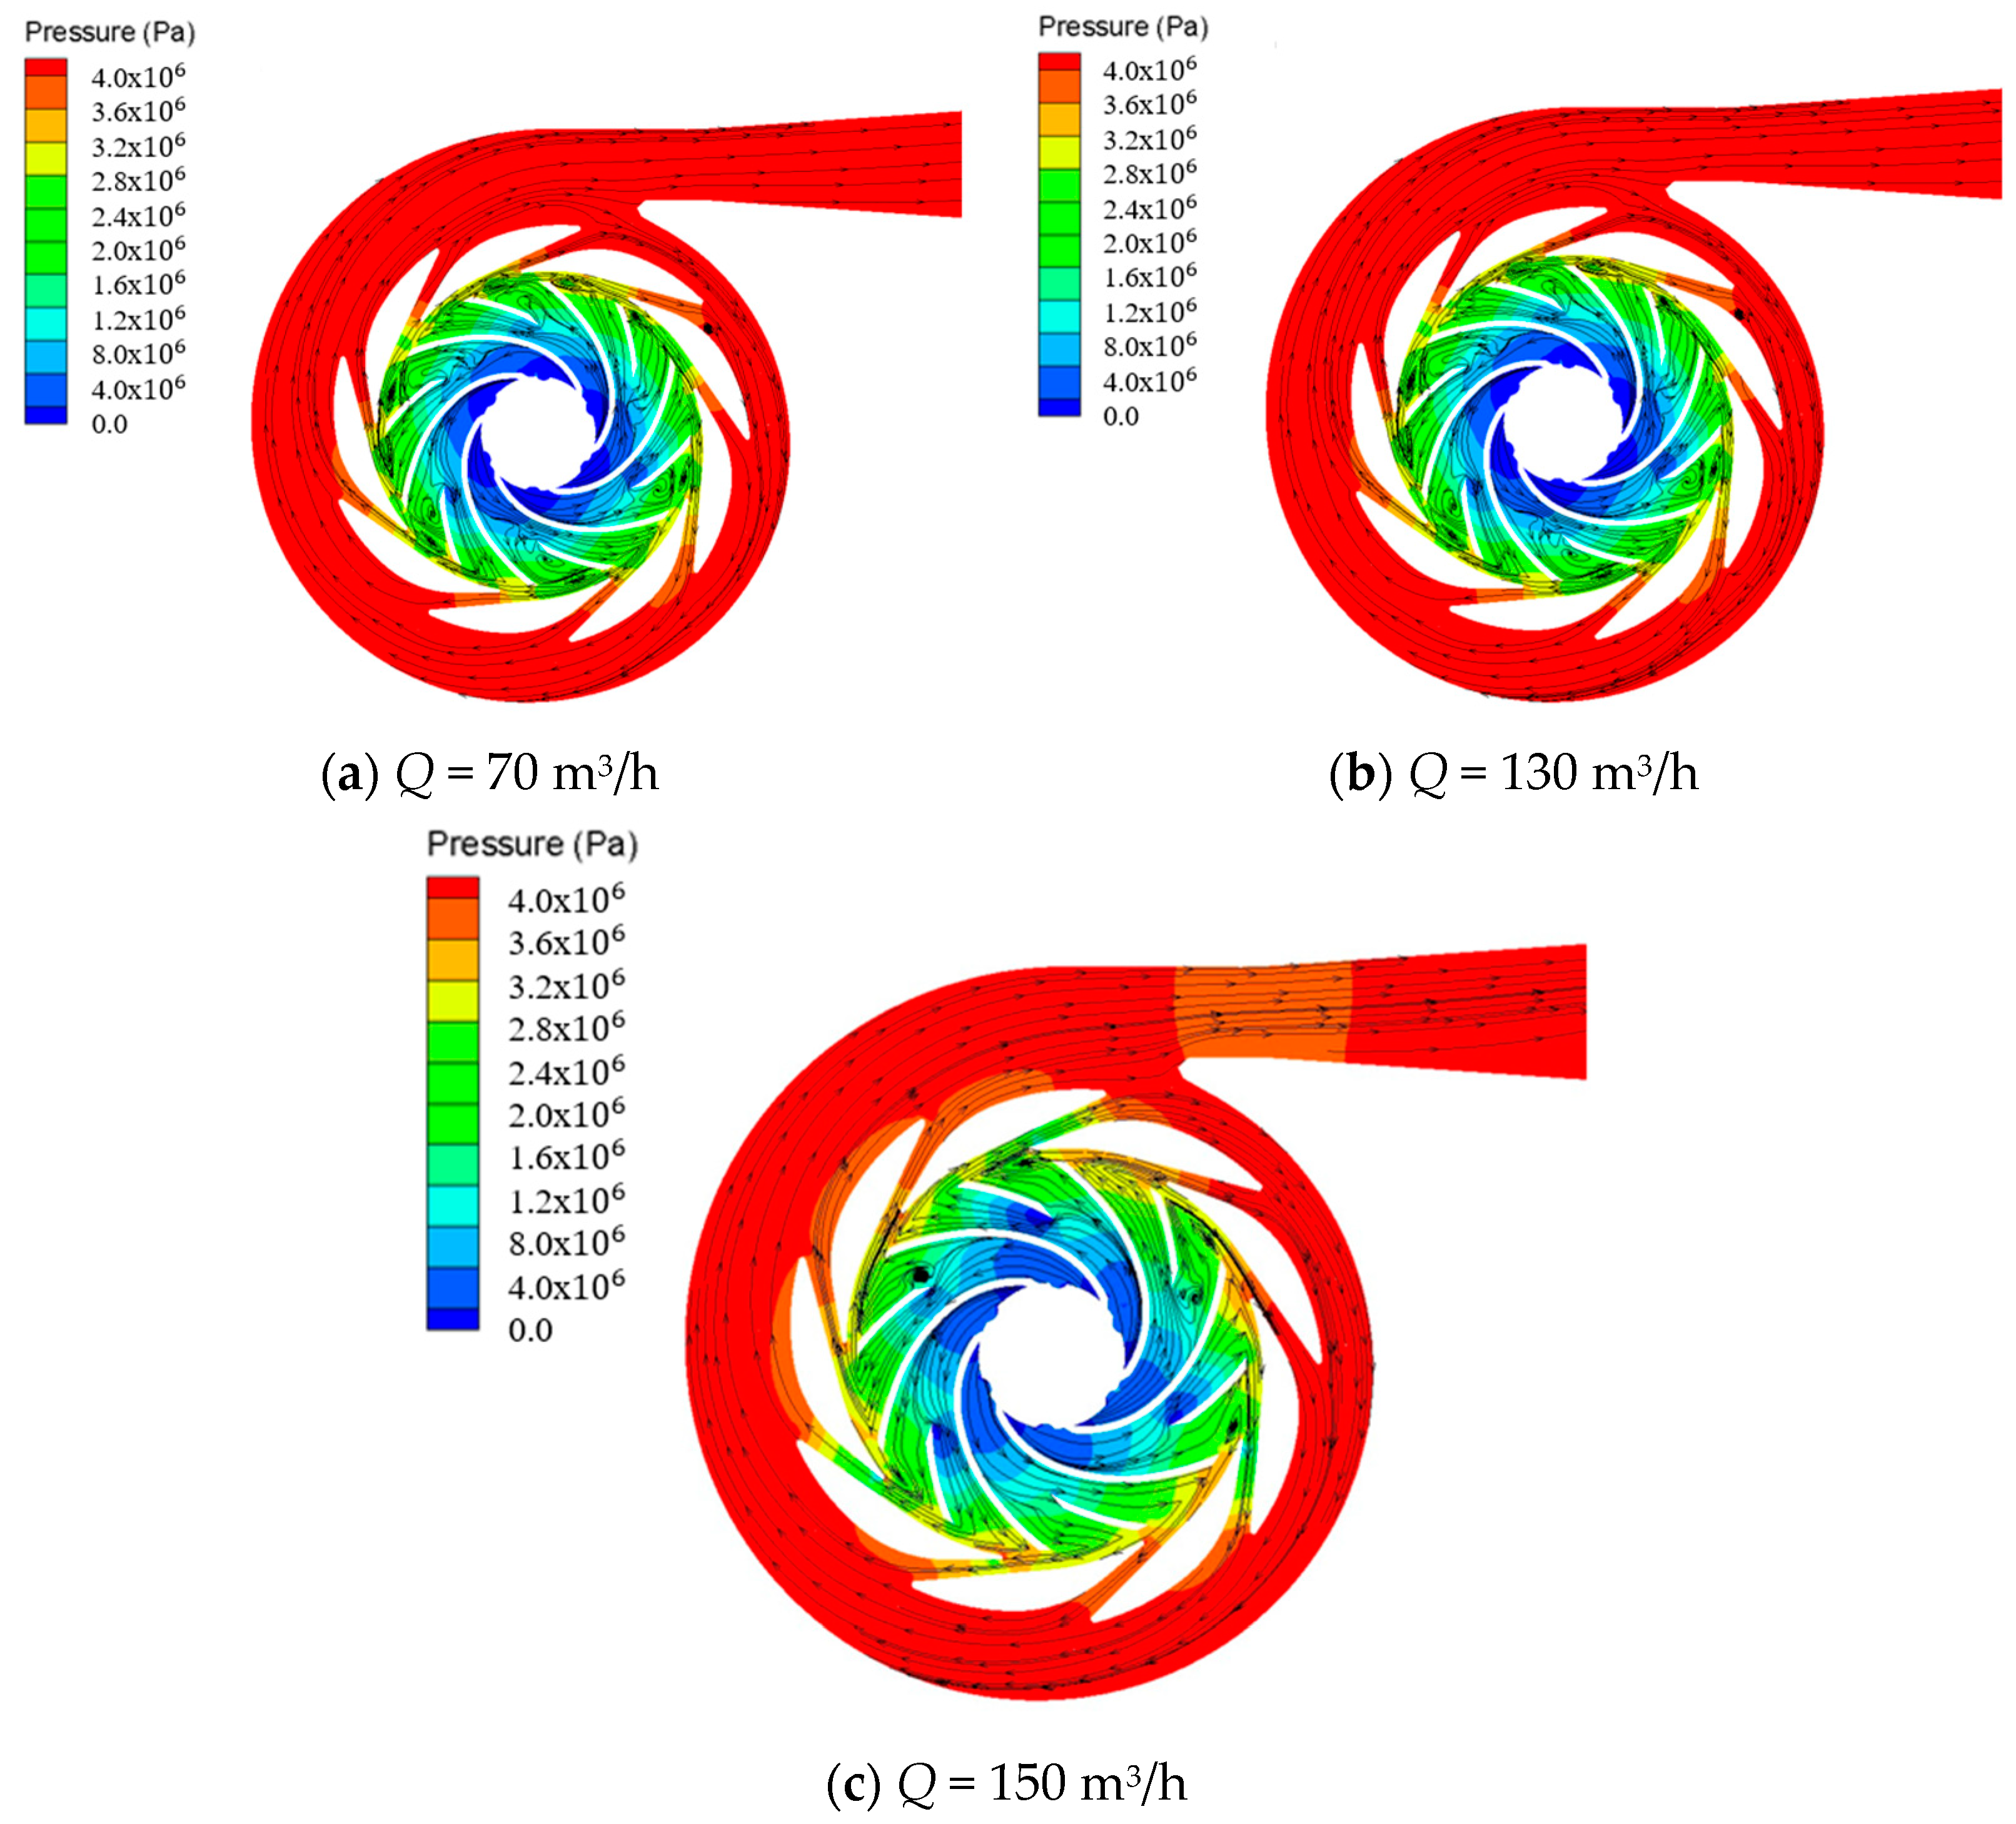
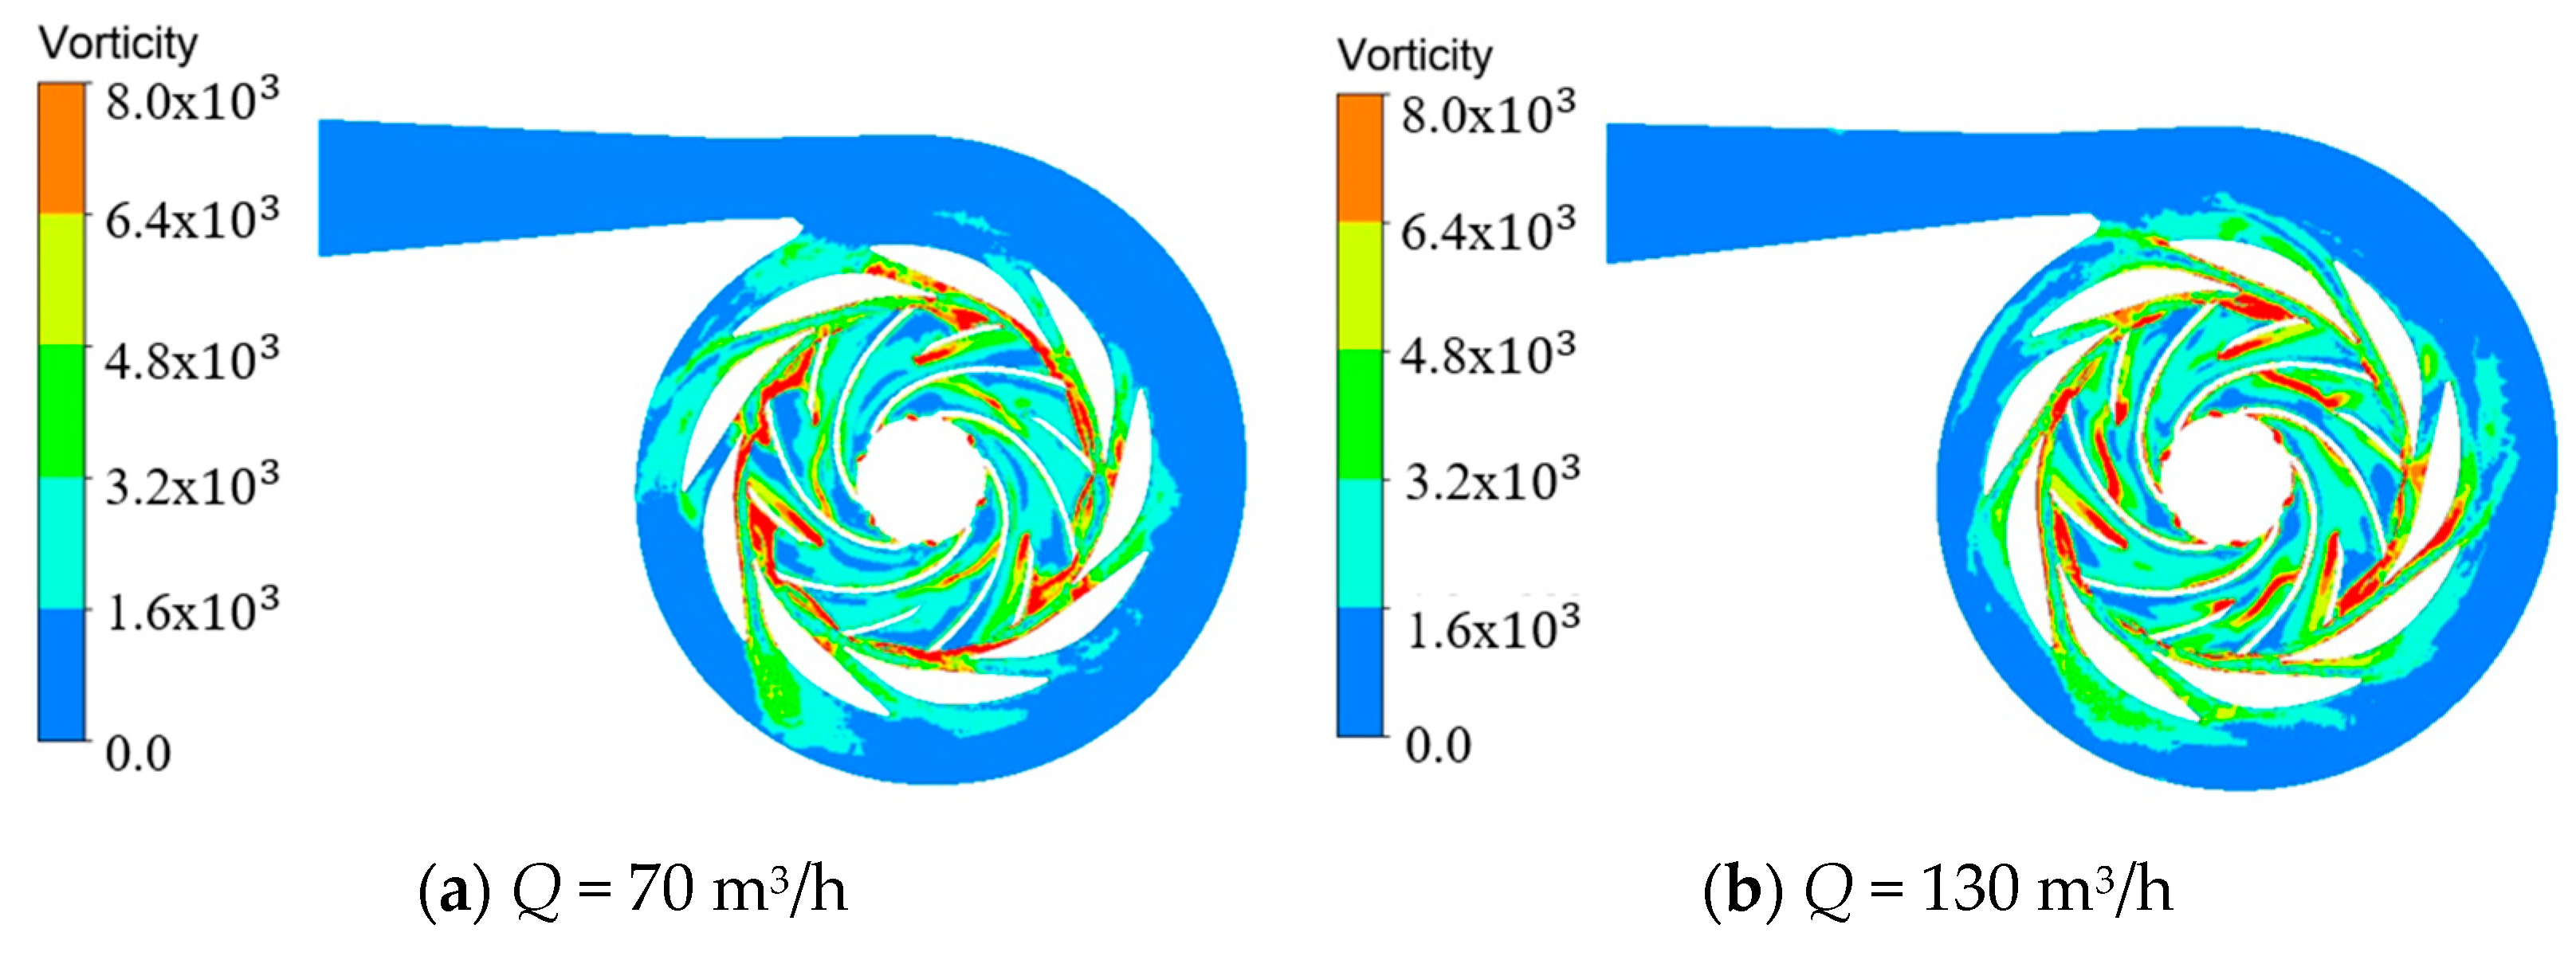
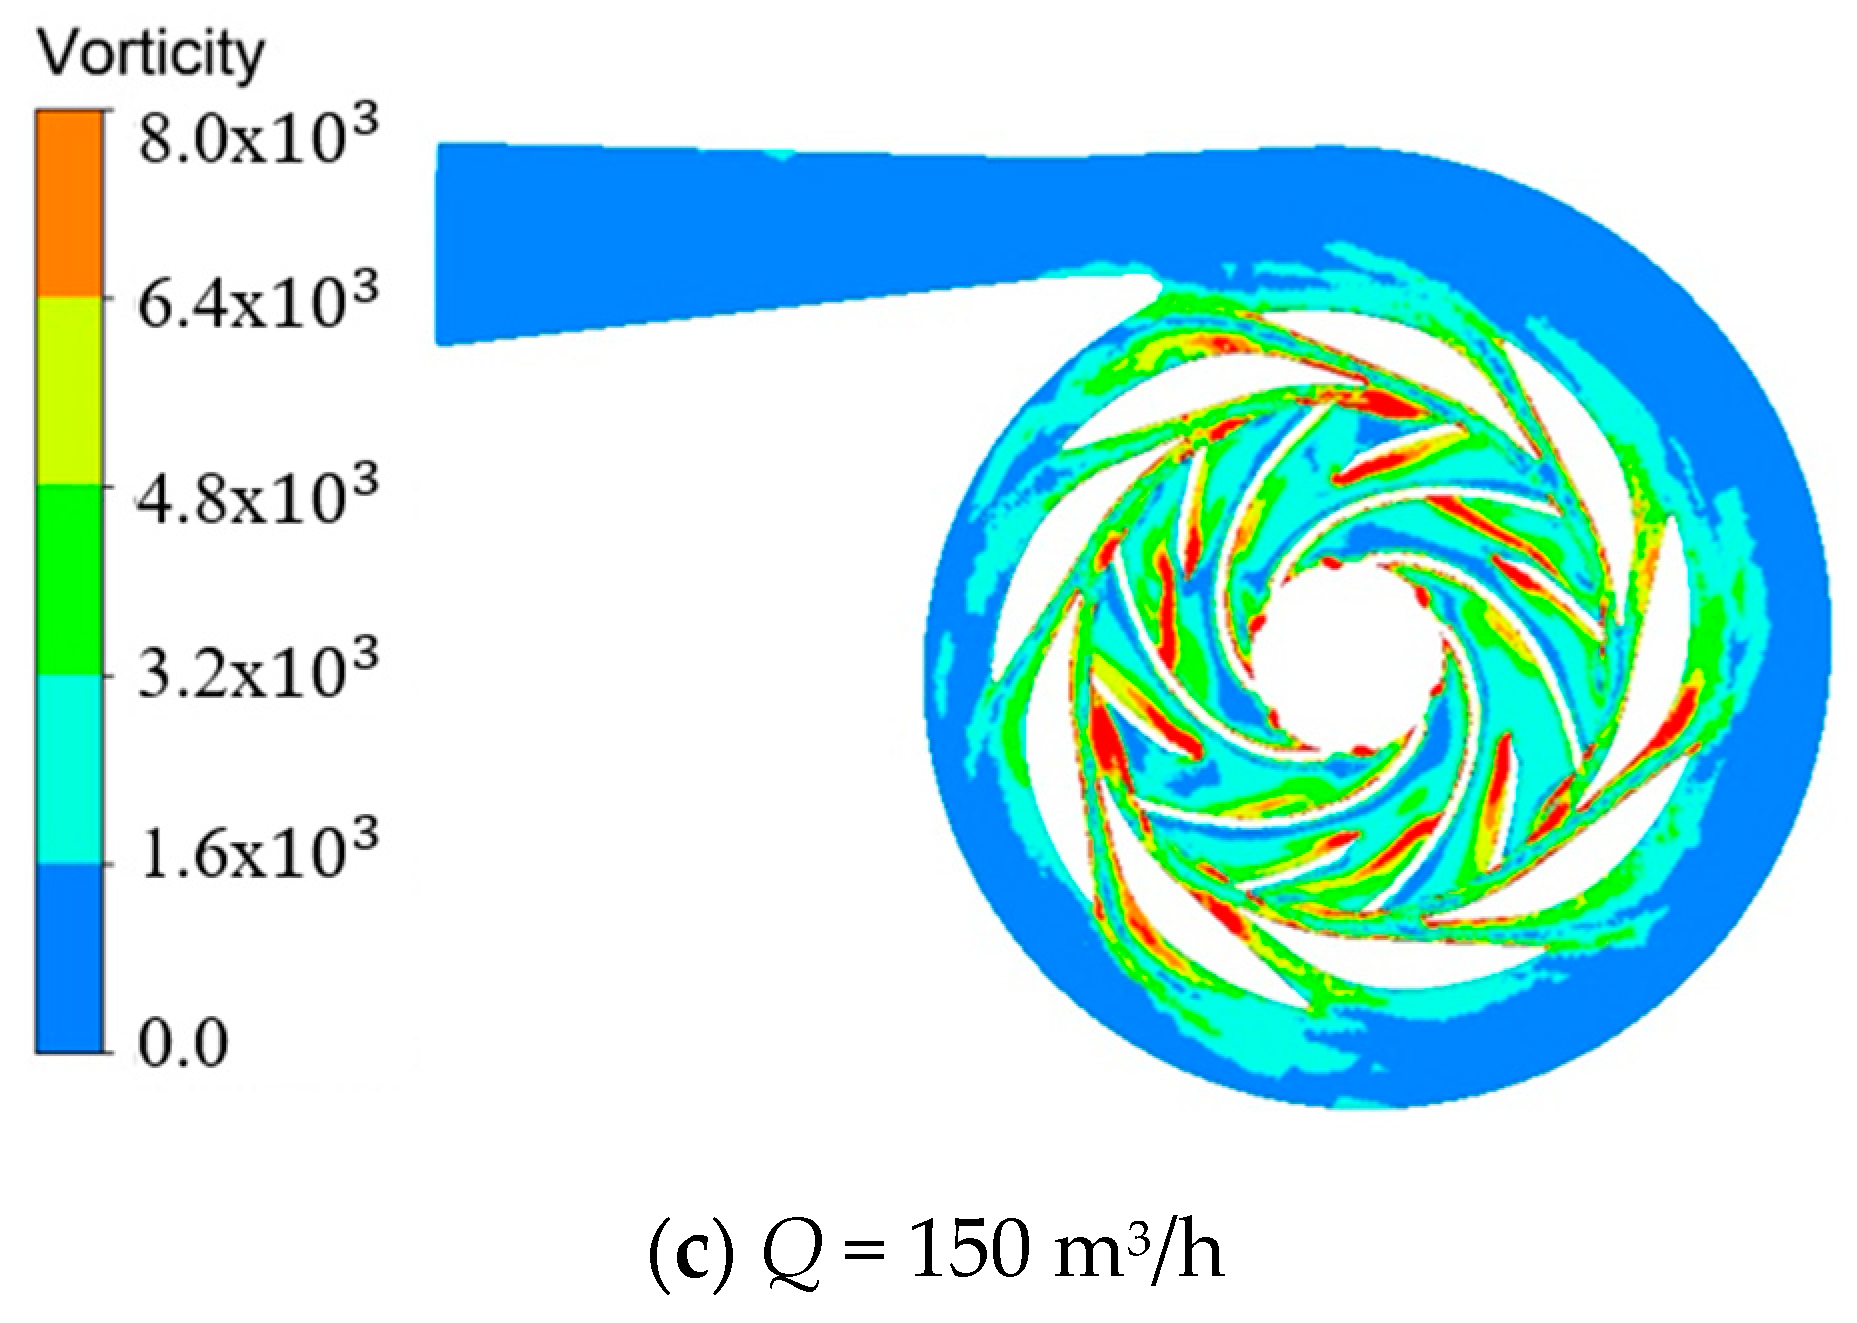
5.3. Vorticity Analysis
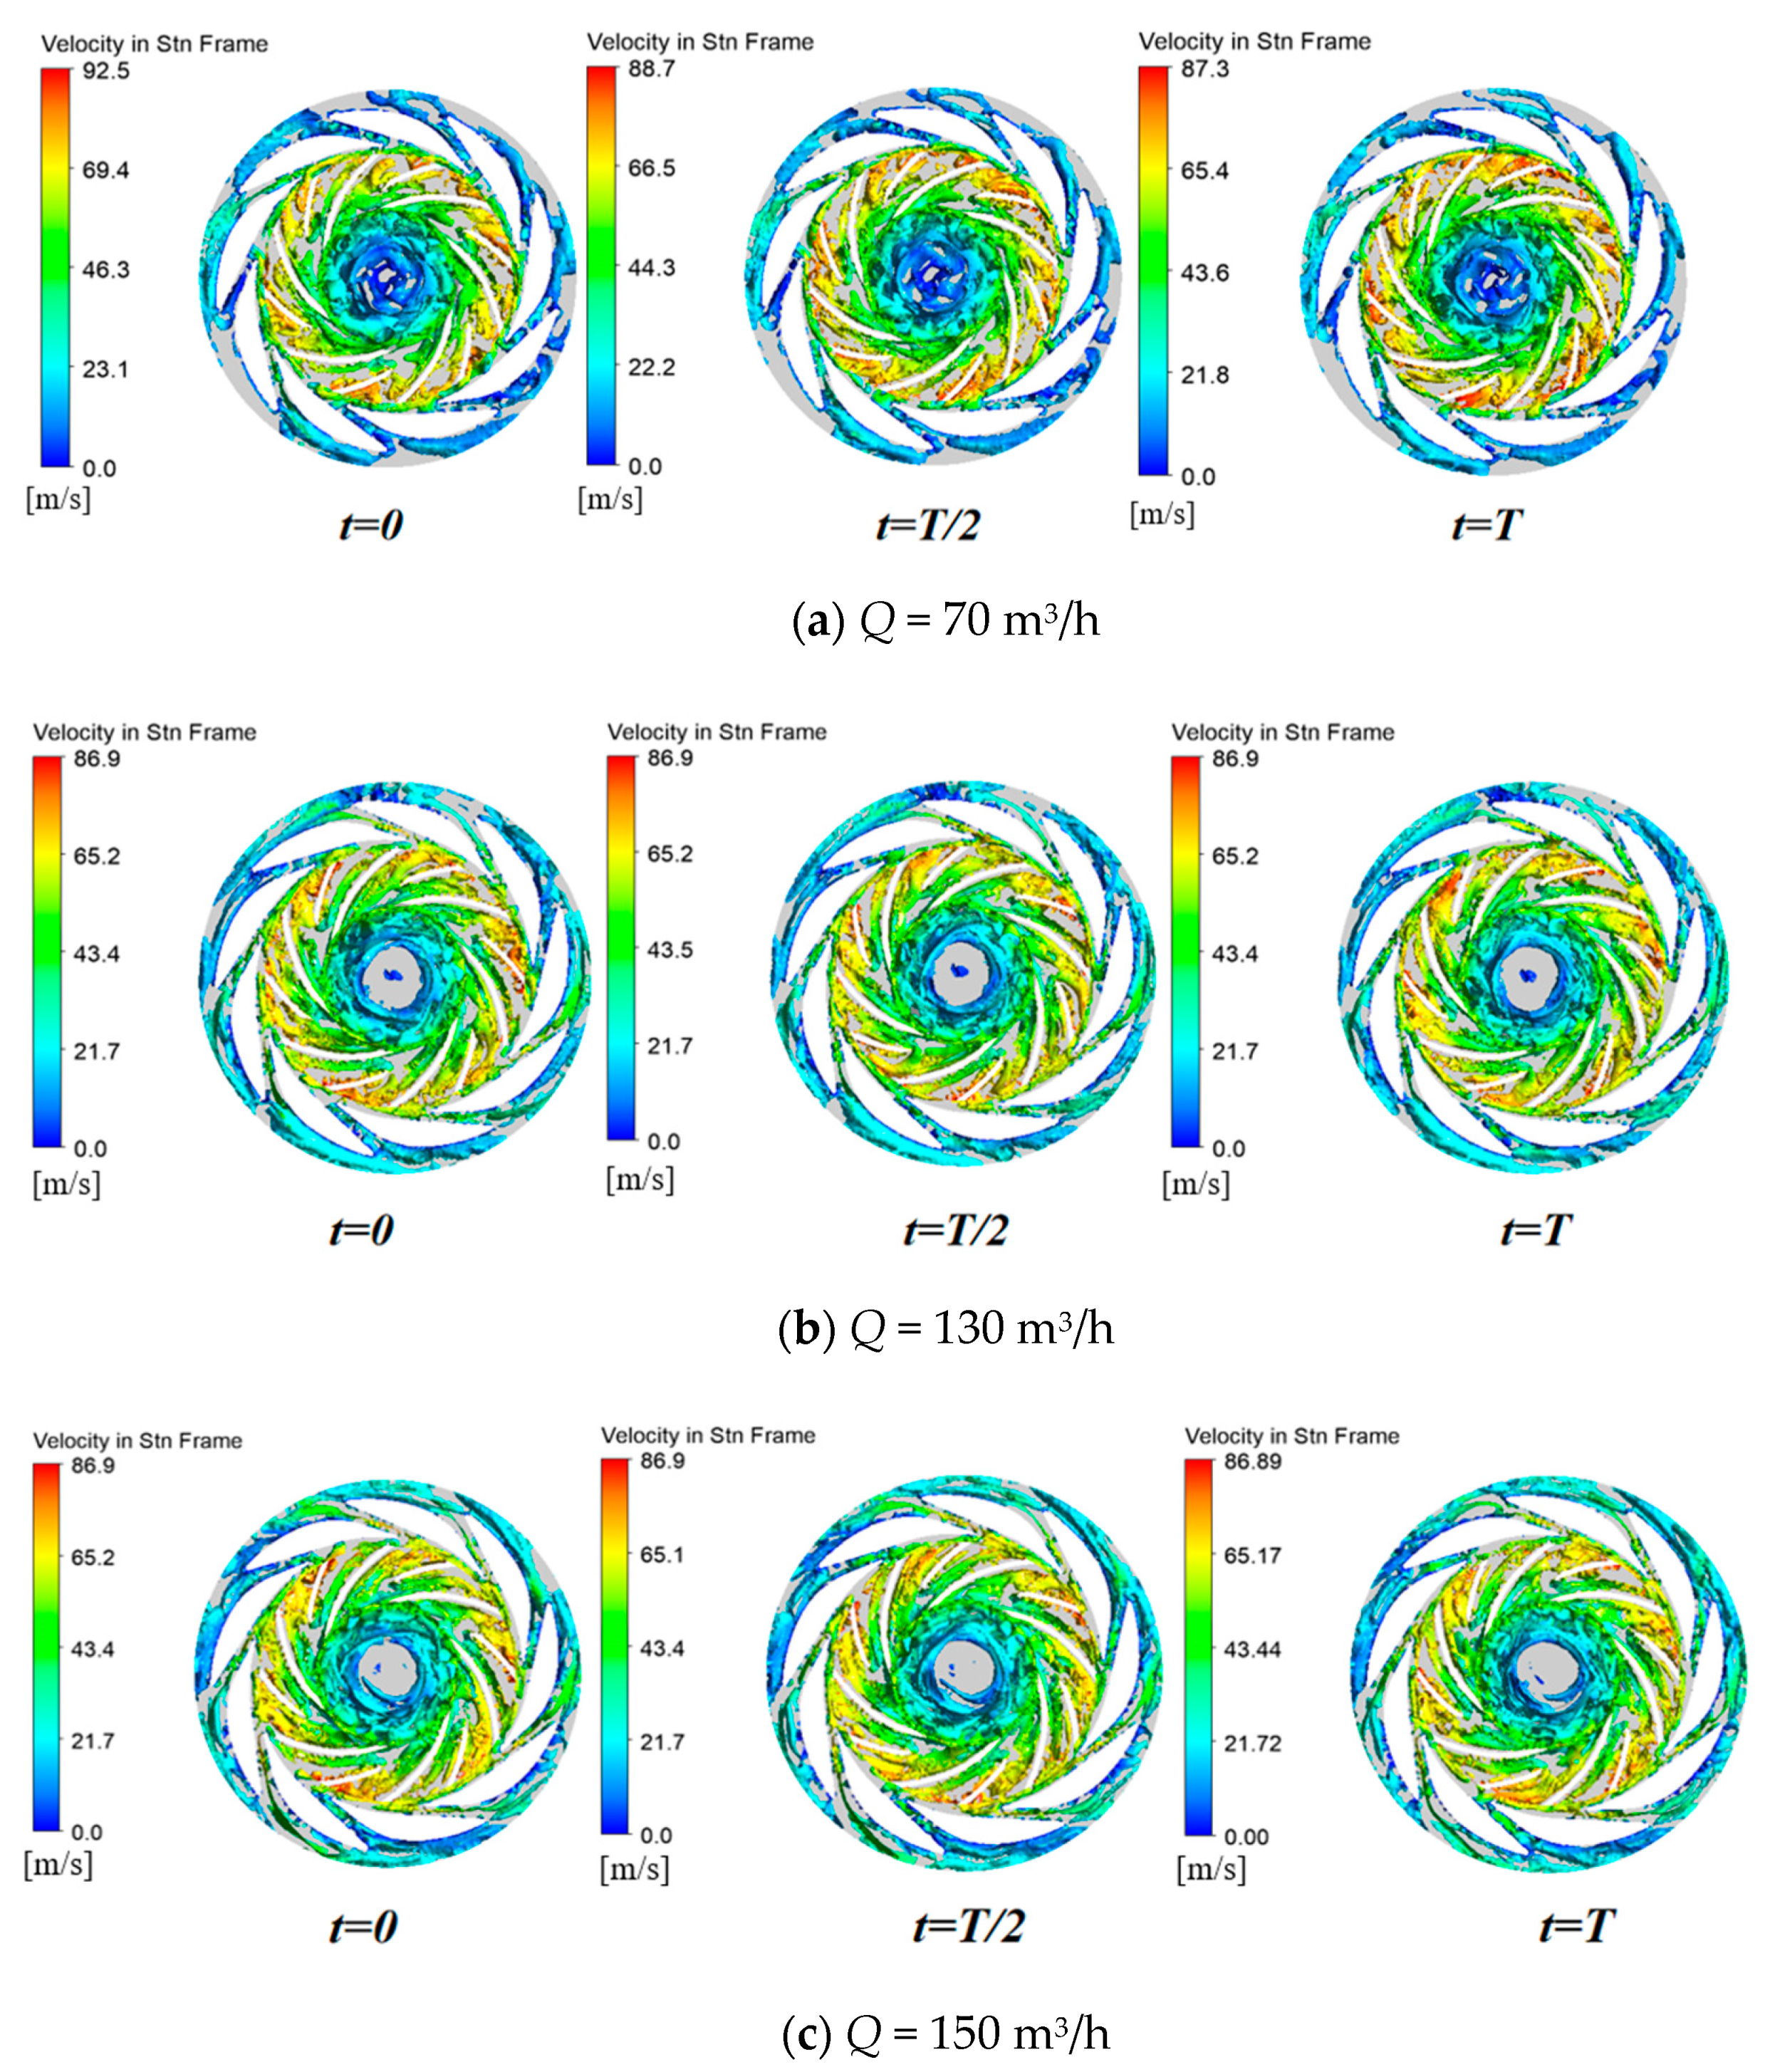
5.4. Vibration Analysis
6. Conclusions
- (1)
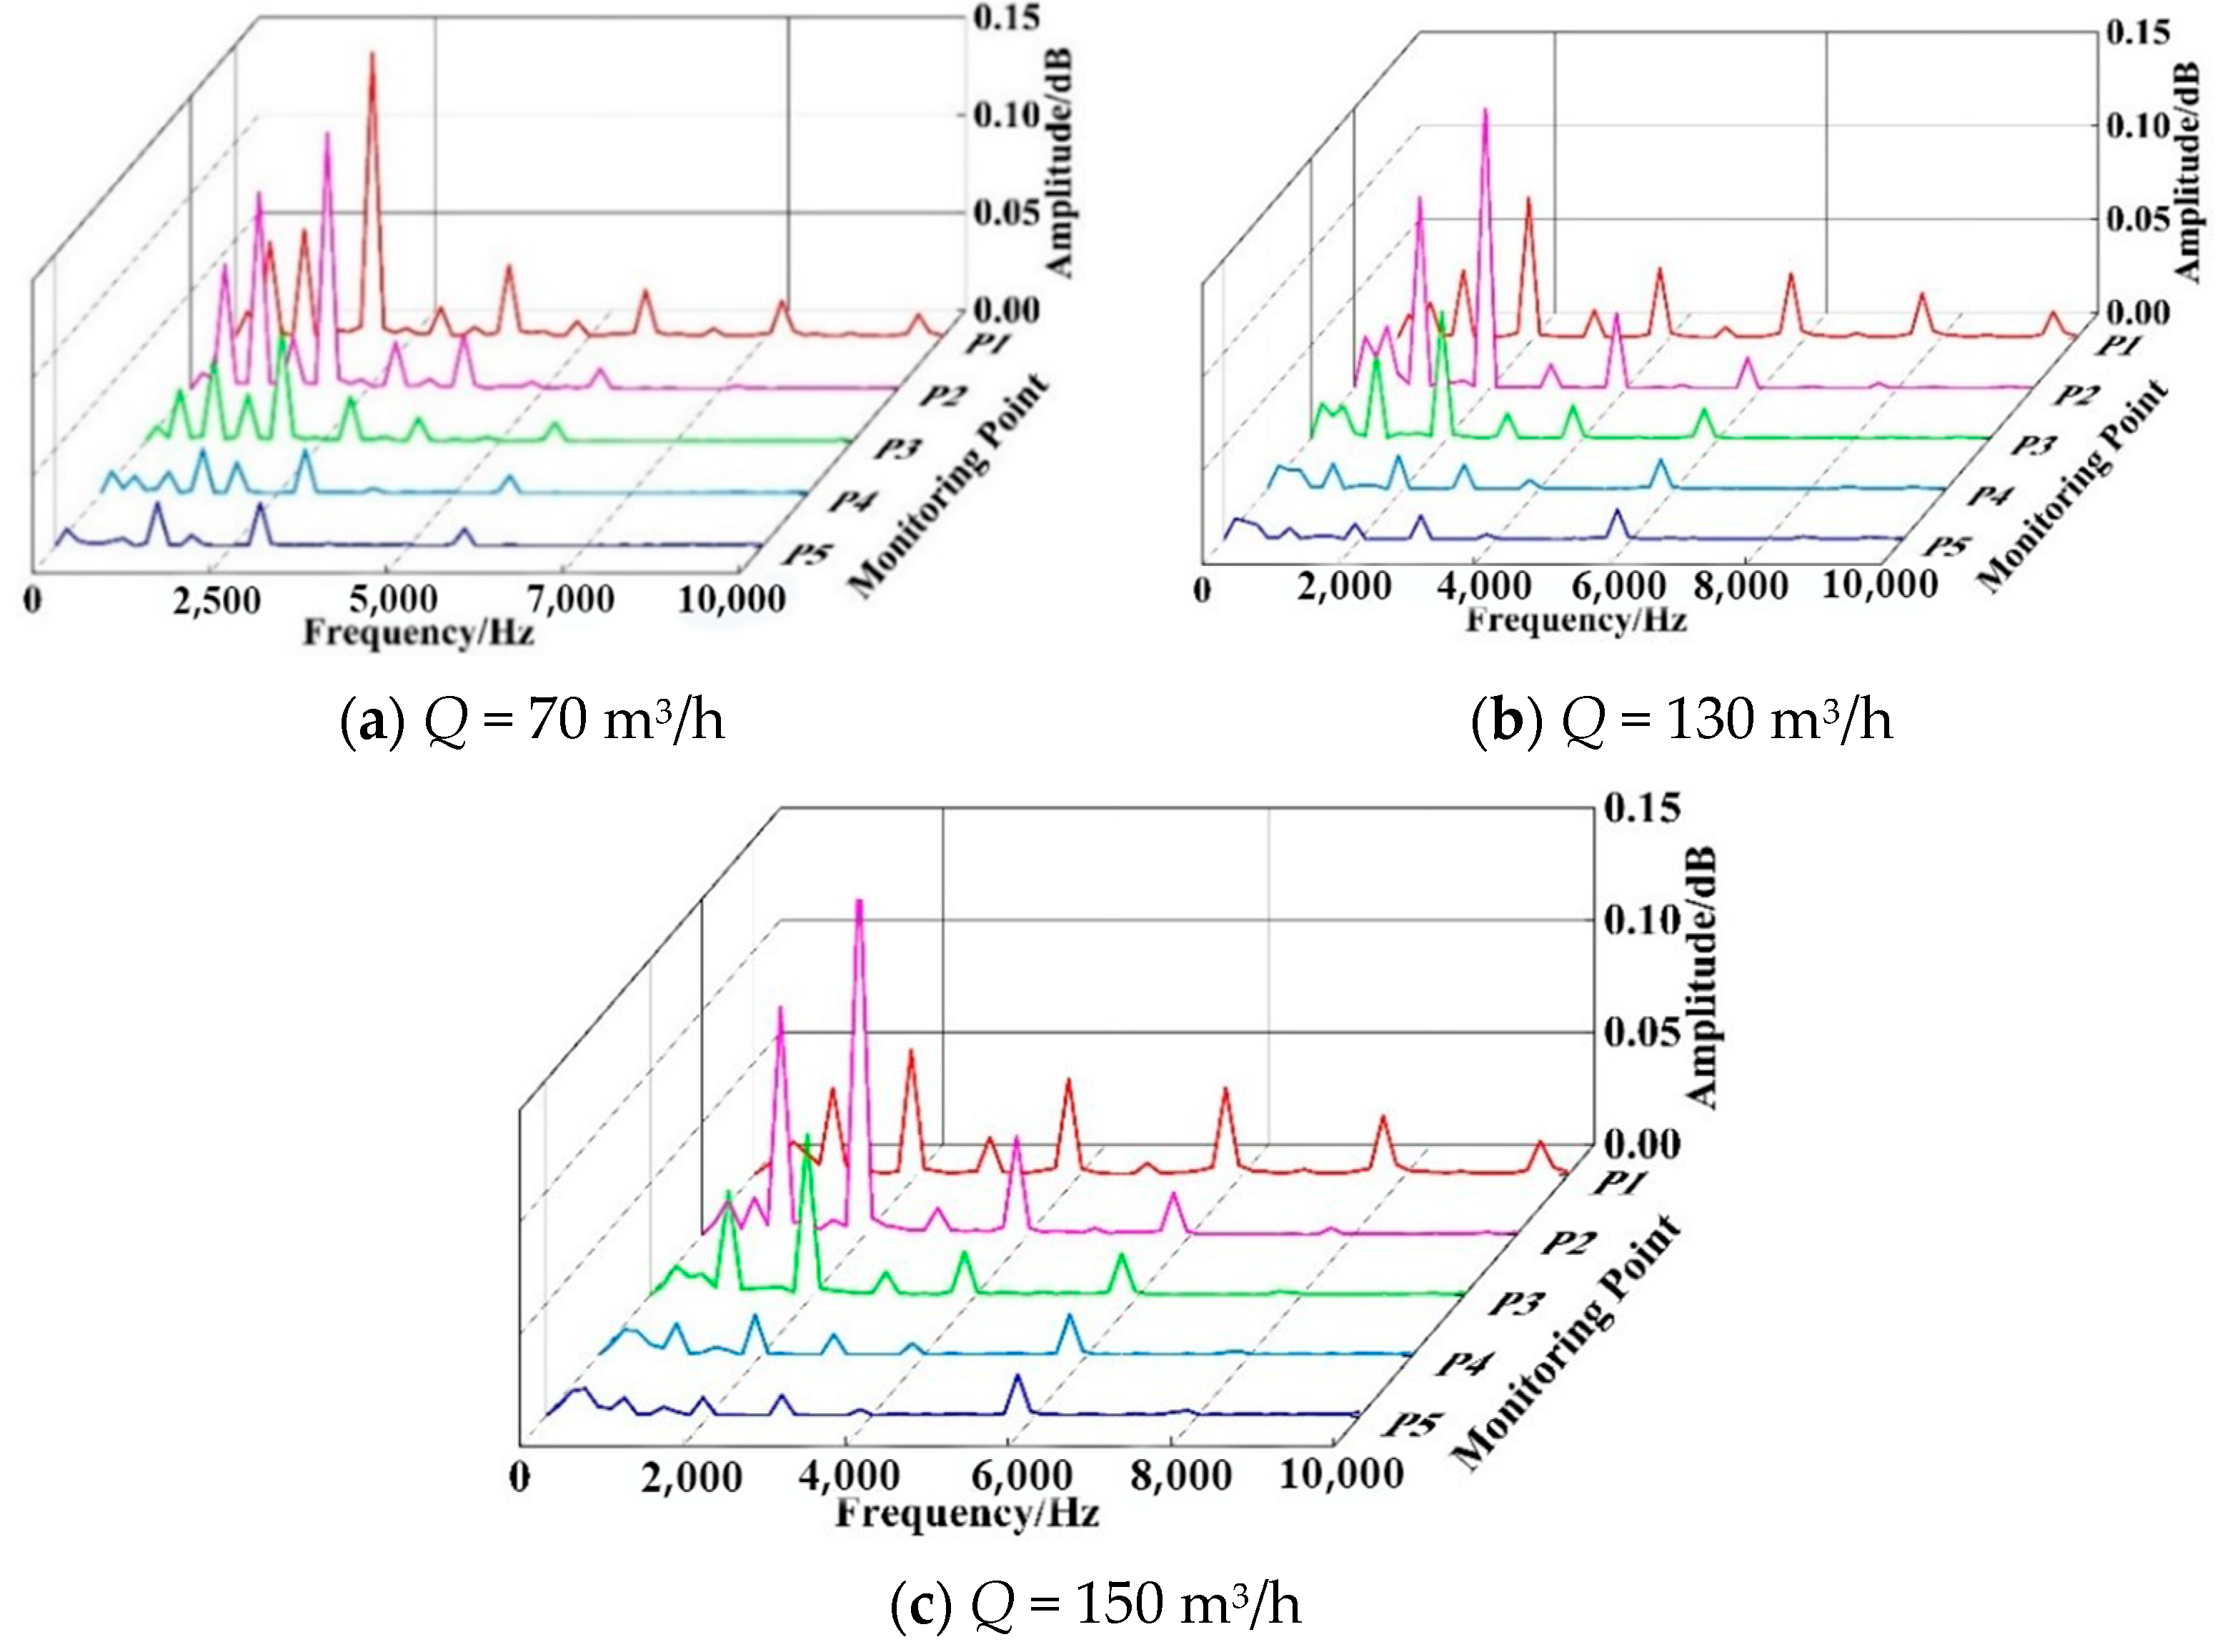
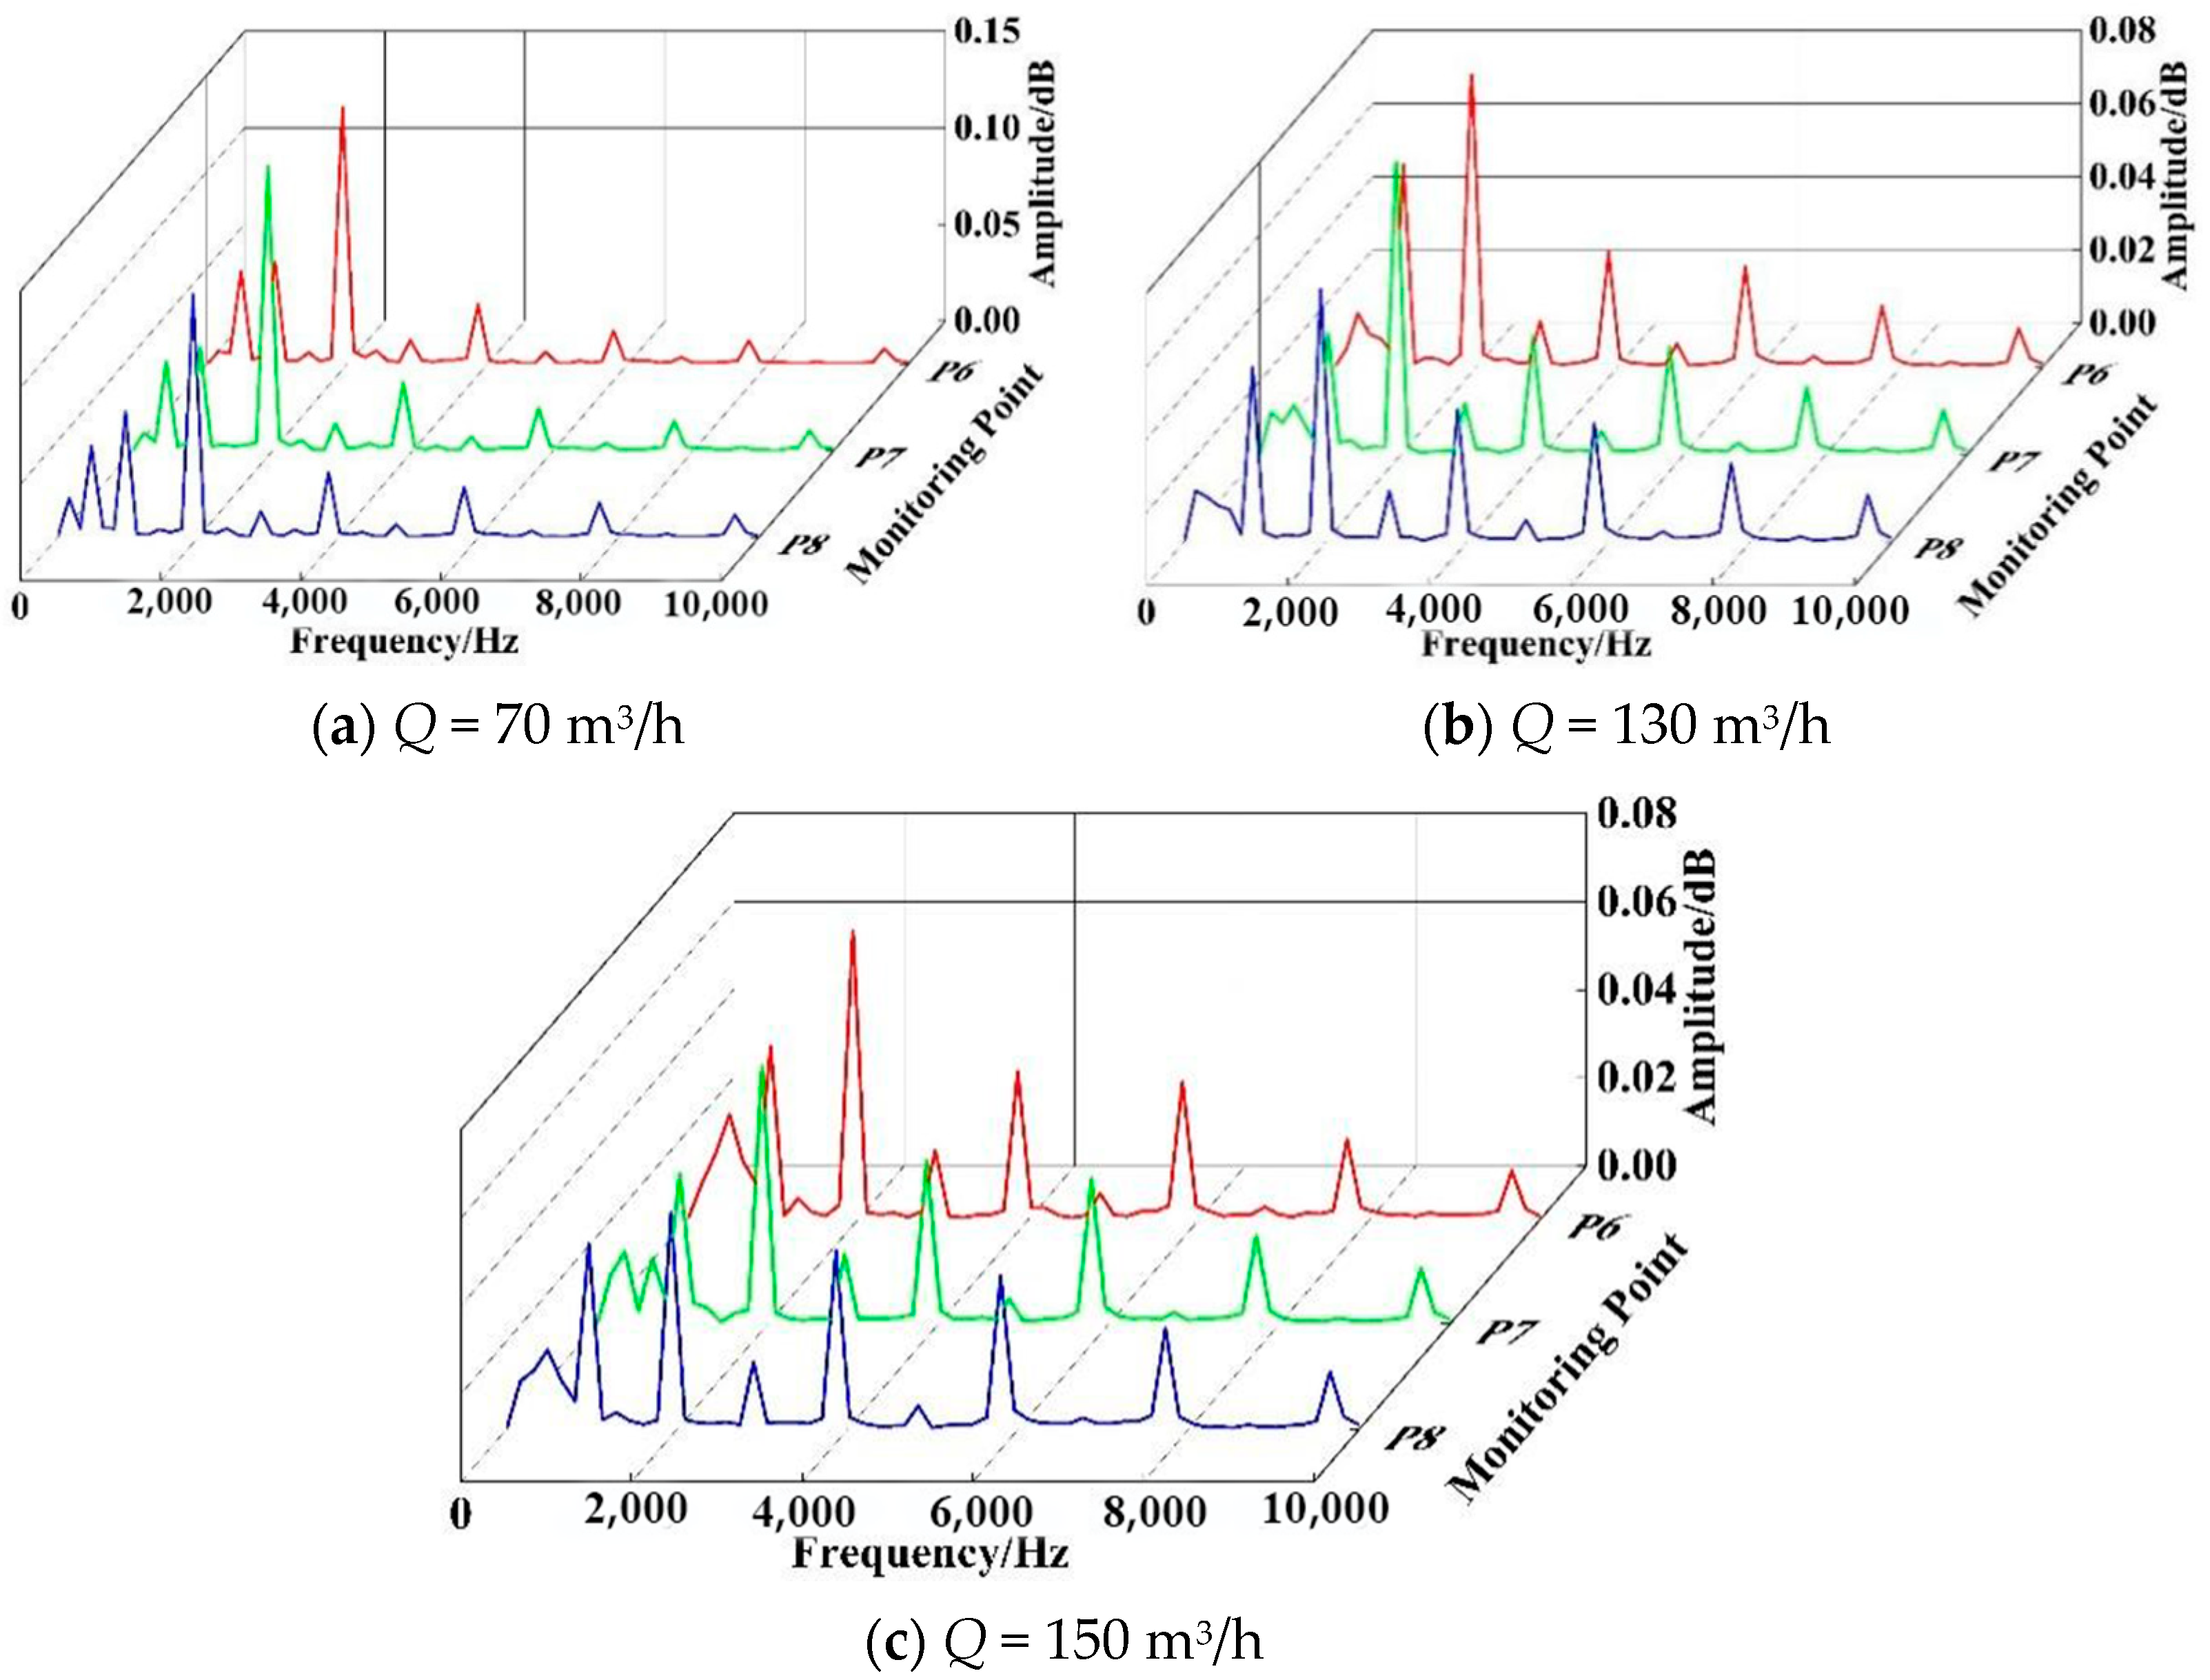
- The pressure fluctuations at the impeller outlet and the guide vane passage are closely related to the change in the vortex at the impeller outlet. The vortices at the impeller outlet are mainly caused by the separation of fluid, and the vortices change periodically. The farther away from the exit of impeller, the weaker the fluctuations’ periodicity. With an increase in the flow rate, the pressure fluctuations in the guide vane become periodic.
- (2)
- The shape of the vortex of a pump with an enlarged design does not change significantly at different times. At a low flow rate, the change of intensity is significant and the amplitude of pressure fluctuations is large. The variation of the vortex is not significant under design and at a large flow rate, and the amplitude of the pressure fluctuations at a large flow rate is smaller than that under design conditions.
- (3)
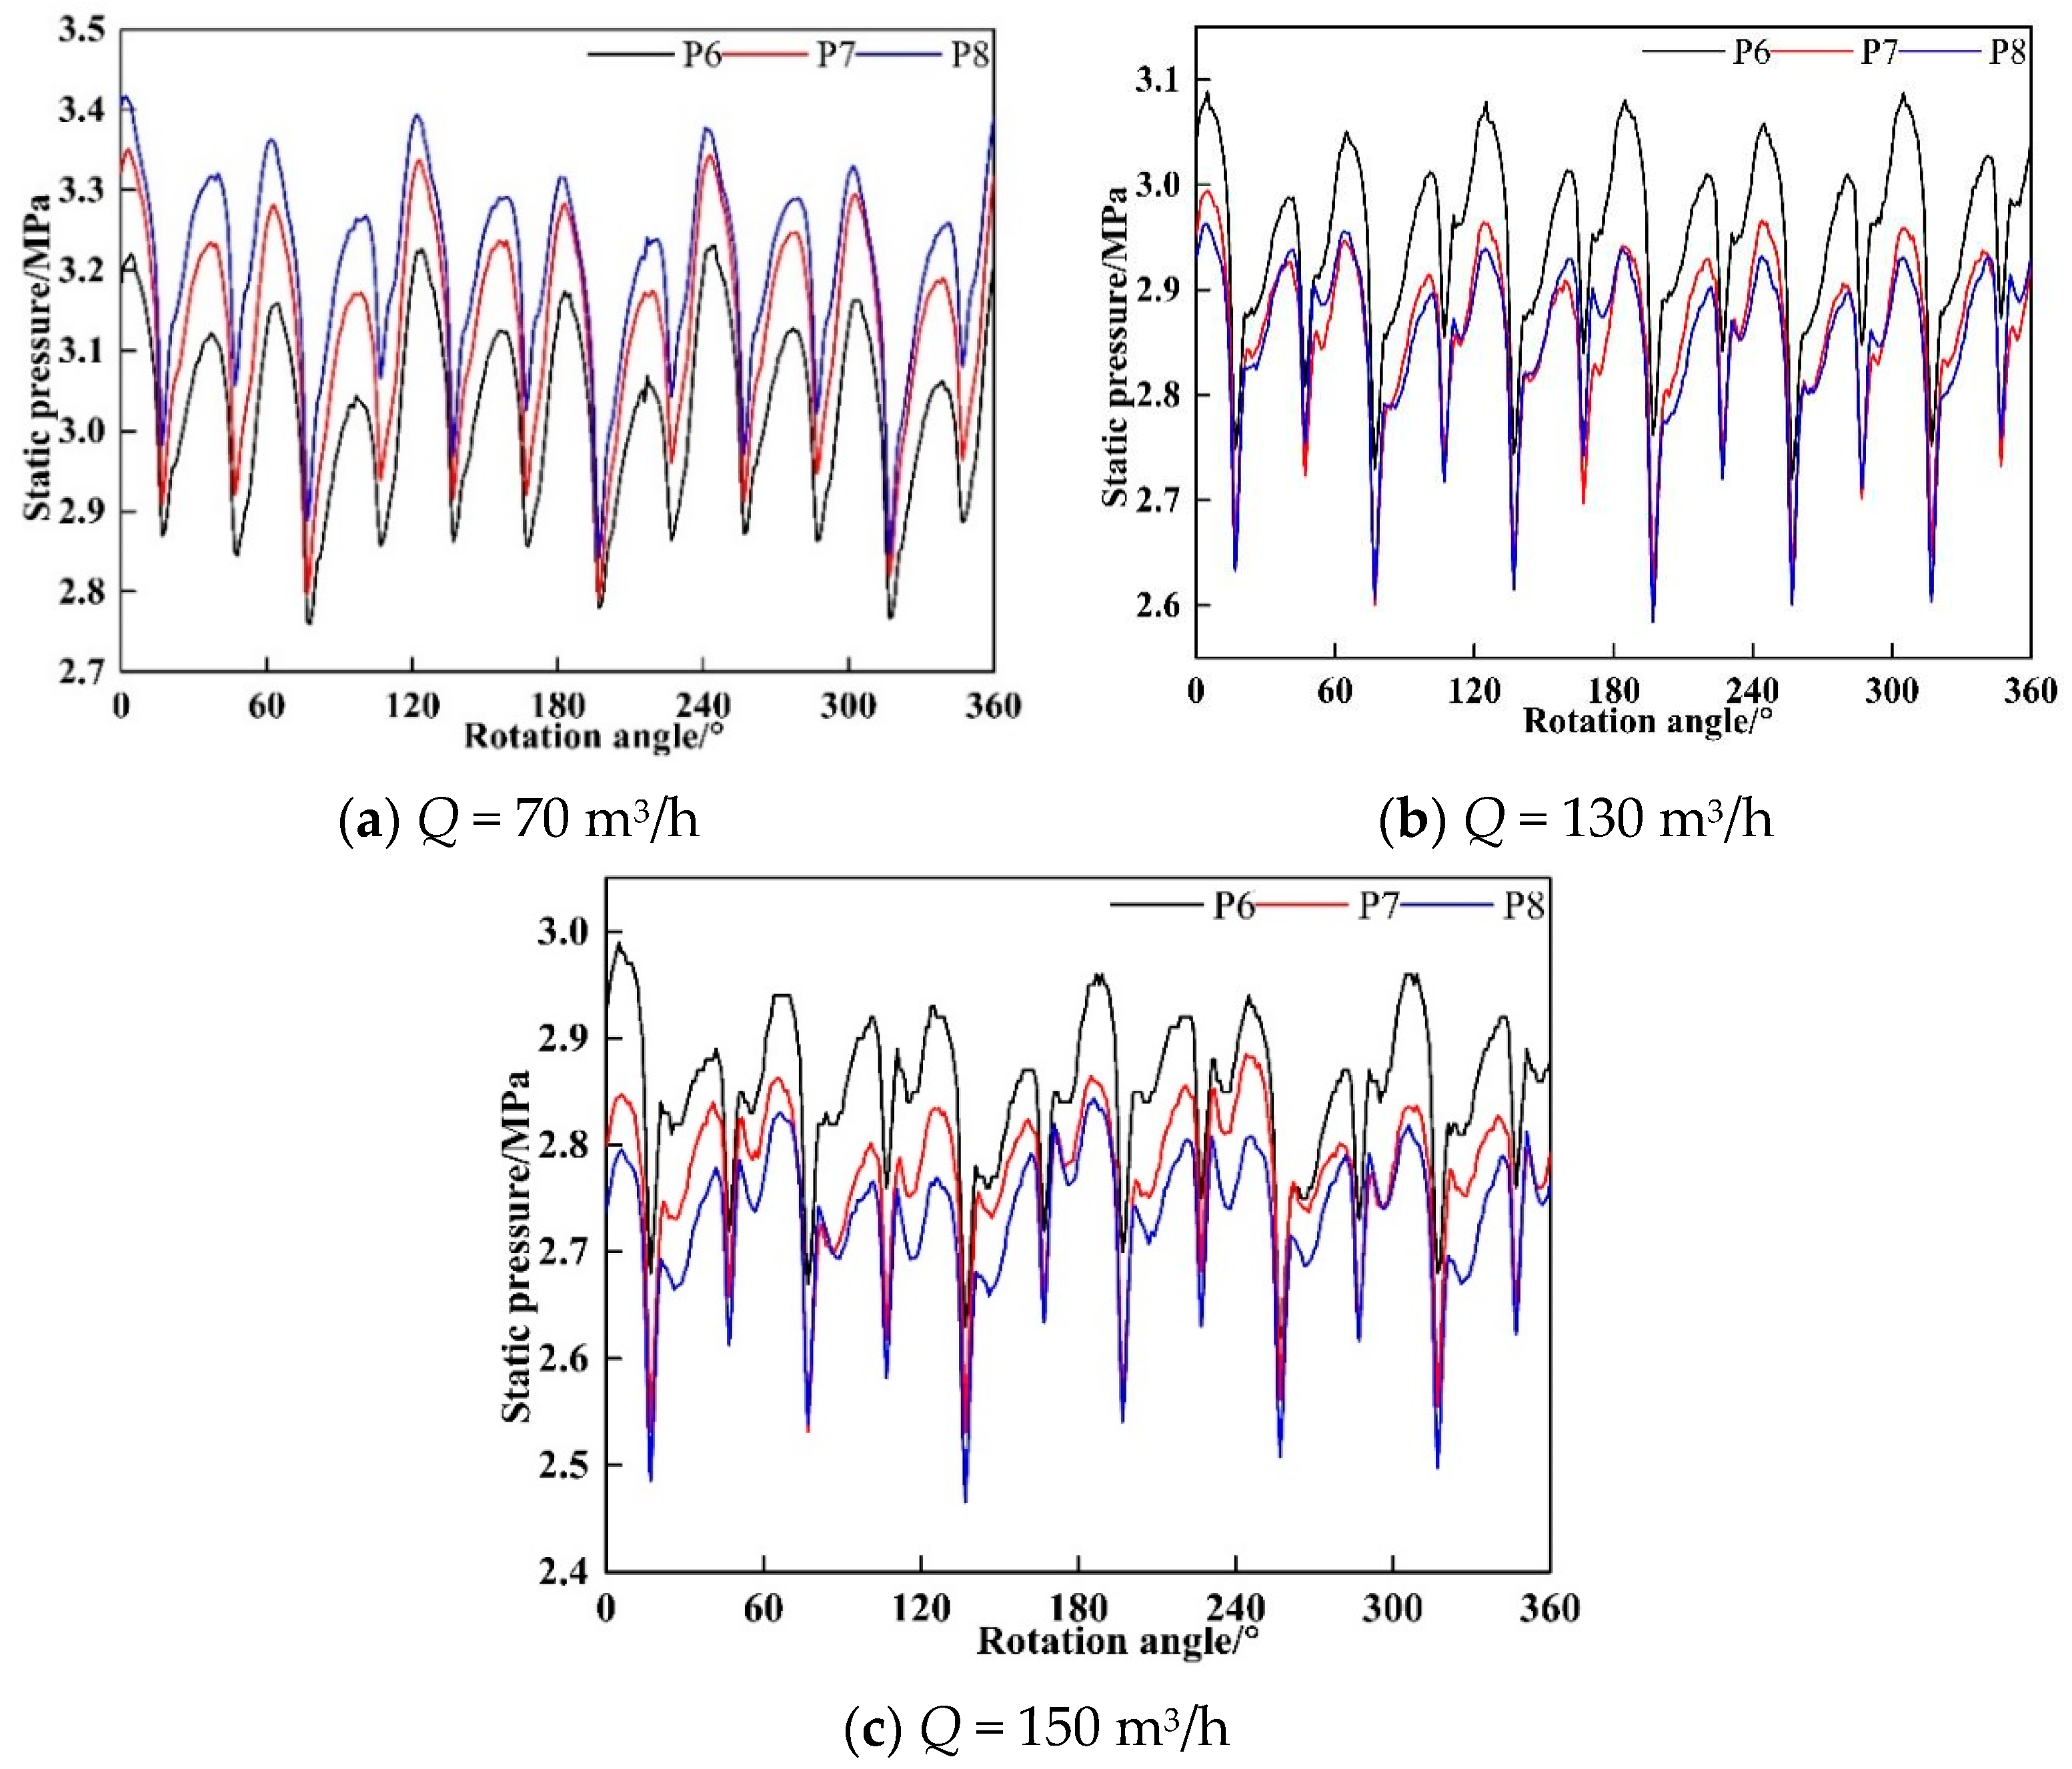
- The flow field in the guide vane is stable, and the vortex at the outlet of the guide vane is stable at different flow rates. Therefore, the pressure at the outlet of guide vane is stable, which indicates that the guide vane can be added to suppress the pulsation for a pump with an enlarged flow design.
- (4)
- The vibration amplitude and the efficiency at a large flow rate are smaller than that under the designed condition. The rated pump capacity can be enlarged to restrain the pressure pulsation when the pump is designed by the enlarged flow method.
Author Contributions
Funding
Institutional Review Board Statement
Informed Consent Statement
Data Availability Statement
Conflicts of Interest
References
- Berten, S.; Dupont, P.; Fabre, L.; Kayal, M.; Avellan, F.; Farhat, M. Experimental Investigation of Flow Instabilities and Rotating Stall in a High-Energy Centrifugal Pump Stage. In Proceedings of the ASME 2009 Fluids Engineering Division Summer Meeting, Vail, CL, USA, 2–6 August 2009. [Google Scholar] [CrossRef] [Green Version]
- Luo, X.; Song, W.; Shi, U.; Wan, L. Analysis of pressure fluctuation characteristics of high-speed centrifugal pump under different flow rate. J. Eng. Therm. Energy Power 2018, 33, 80–85. [Google Scholar] [CrossRef]
- Zhang, M.; Tsukamoto, H. Unsteady hydrodynamic forces due to rotor-stator interaction on a diffuser pump with identical number of vanes on the impeller and diffuser. J. Fluids Eng. 2005, 127, 743–751. [Google Scholar] [CrossRef]
- Si, Q.; Yu, Z.-S.; Yuan, S.-Q.; Yuan, J.-P. Numerical analysis for flow-induced vibration of a high speed centrifugal pump with inducer. J. Vib. Shock 2013, 32, 102–106. [Google Scholar] [CrossRef]
- Yuan, J.-P.; Shen, C.-D.; Liu, J.; Fu, Y.-X.; Zhou, B.-L. Internal flow characteristic of high-speed centrifugal pumps under whirling of their imp. J. Vib. Shock 2016, 35, 87–92. [Google Scholar] [CrossRef]
- Li, Y.; Yuan, S.; Lai, H. Numerical Study of Unsteady Flows with Cavitation in a High-Speed Micro Centrifugal Pump. J. Therm. Sci. 2017, 26, 18–24. [Google Scholar] [CrossRef]
- Liu, J.; Yuan, J.P.; Zhang, W.J. Fluid Mechanics Analysis and Effect of Splitter Blades on the Characteristics of High-Speed Centrifugal Pump. Adv. Mater. Res. 2013, 676, 124–129. [Google Scholar] [CrossRef]
- Yuan, Y.; Yuan, S.; Tang, L. Investigation on the effect of complex impeller on vibration characteristics for a high-speed centrifugal pump. Proc. Inst. Mech. Eng. Part A J. Power Energy 2019, 234, 611–624. [Google Scholar] [CrossRef]
- Zhu, X.; Jiang, W.; Li, G.; Liu, P. Numerical investigation into influence of installation location between diffuser vane and volute tongue on unsteady pressure fluctuations in centrifugal pump with vane diffuser. J. Drain. Irrig. Mach. Eng. 2015, 33, 829–834. [Google Scholar] [CrossRef]
- Moore, J.J.; Ransom, D.L.; Viana, F. Rotordynamic force prediction of centrifugal compressor impellers using computational fluid dynamics. J. Eng. Gas Turbines Power 2011, 133, 045501. [Google Scholar] [CrossRef]
- Wei, D.; Zhansheng, L. Effect of the hydrodynamic forces on the vibration of rotor in a centrifugal pump. Mech. Sci. Technol. Aerosp. Eng. 2013, 32, 977–982. [Google Scholar] [CrossRef]
- González, J.; Parrondo, J.; Santolaria, C.; Blanco, E. Steady and Unsteady Radial Forces for a Centrifugal Pump With Impeller to Tongue Gap Variation. J. Fluids Eng. 2006, 128, 455. [Google Scholar] [CrossRef]
- Yang, J.; Hu, Z.R. A method for calculating the enlarge coefficient of low specific speed centrifugal pump. Chin. J. Mech. Eng. 2005, 41, 203–205. [Google Scholar]
- ANASYS, Inc. Anasys Fluent Theory Guide; ANSYS, Inc.: Canonsburg, PA, USA, 2011. [Google Scholar]


| Parameter | Value | Parameter | Value |
|---|---|---|---|
| Design flow rate Q (m3/h) | 130 | Speed ns | 9685 |
| Head H (m) | 400 | Specific speed n (r/min) | 76 |
| Number of impeller blades Z1 | 6 | Inlet diameter of impeller D1 (mm) | 98 |
| Outer diameter of impeller D2 (mm) | 172 | Inlet width of impeller b1 (mm) | 28.56 |
| Outer width of impeller b2 (mm) | 10 | Blade inlet mounting angle β1 (°) | 19 |
| Blade outlet mounting angle β2 (°) | 37 | Initial diameter of short blade D (mm) | 120 |
| Number of inducer blades Z2 | 3 | Inducer lead Si (mm) | 52.5 |
| Tip diameter of inducer Dt (mm) | 100 | Axial length of inducer blade L (mm) | 70 |
| Leading edge angle θ1 (°) | 120 | Tip angle θ2 (°) | 360 |
Publisher’s Note: MDPI stays neutral with regard to jurisdictional claims in published maps and institutional affiliations. |
© 2021 by the authors. Licensee MDPI, Basel, Switzerland. This article is an open access article distributed under the terms and conditions of the Creative Commons Attribution (CC BY) license (https://creativecommons.org/licenses/by/4.0/).
Share and Cite
Zhang, J.; Yang, H.; Liu, H.; Xu, L.; Lv, Y. Pressure Fluctuation Characteristics of High-Speed Centrifugal Pump with Enlarged Flow Design. Processes 2021, 9, 2261. https://doi.org/10.3390/pr9122261
Zhang J, Yang H, Liu H, Xu L, Lv Y. Pressure Fluctuation Characteristics of High-Speed Centrifugal Pump with Enlarged Flow Design. Processes. 2021; 9(12):2261. https://doi.org/10.3390/pr9122261
Chicago/Turabian StyleZhang, Jianyi, Hao Yang, Haibing Liu, Liang Xu, and Yuwei Lv. 2021. "Pressure Fluctuation Characteristics of High-Speed Centrifugal Pump with Enlarged Flow Design" Processes 9, no. 12: 2261. https://doi.org/10.3390/pr9122261