Article

Testing the PTT Rheological Model for Extrusion of Virgin and Composite Materials in View of Enhanced Conductivity and Mechanical Recycling Potential

1
Laboratory for Chemical Technology (LCT), Department of Materials, Textiles and Chemical Engineering, Ghent University, Technologiepark, 125, Zwijnaarde 9052, 9000 Ghent, Belgium
2
Centre for Polymer and Material Technologies (CPMT), Department of Materials, Textiles and Chemical Engineering, Ghent University, Technologiepark, 130, Zwijnaarde 9052, 9000 Ghent, Belgium
3
Centre for Textiles Science and Engineering (CTSE), Department of Materials, Textiles and Chemical Engineering, Ghent University, Technologiepark, 70A, Zwijnaarde 9052, 9000 Ghent, Belgium
*
Authors to whom correspondence should be addressed.
Processes 2021, 9(11), 1969; https://doi.org/10.3390/pr9111969
Submission received: 6 October 2021 / Revised: 17 October 2021 / Accepted: 29 October 2021 / Published: 4 November 2021
(This article belongs to the Section Materials Processes)

Abstract

:
One of the challenges for the manufacturing processes of polymeric parts is the dedicated control of composite melt flow. In the present work, the predictive capability of the Phan-Thien-Tanner (PTT) viscoelastic model is evaluated in relation to the extrudate swell from slit dies at 200 °C, considering polypropylene and graphite filler, and applying ANSYS Polyflow software. It is shown that for sufficiently low filler amounts (below 10%; volumetric) the PTT accurately reflects the viscoelastic interactions, but at higher filler amounts too large swellings are predicted. One can although obtain insights on the swelling in the height direction and consider a broader range of swelling areas compared to virgin materials. Guidelines are also provided for future experiments and model development, including the omission of the no-slip process boundary condition.

1. Introduction

Extrusion, which is a material forming operation under melt conditions, is widely used in industrial sectors, including polymeric applications [1,2,3,4,5]. Plastic profiles and in general polymer materials are applied today on a large scale in several industrial fields, including the medical and construction sector [6,7,8,9,10]. More recently, there is also interest to use plastics for heat exchangers [11,12]. For example, polypropylene (PP), polyethylene (PE) and polyvinylidene (PVDF) are corrosion resistant, lightweight polymeric materials and therefore excellent substitutes for traditional materials, such as copper and alumina. However, the low thermal conductivity of (unmodified) virgin plastics (0.2–0.5 W m−1 K−1) cannot generally achieve the requirements of heat-conducting for heat exchangers [12]. The typical solution to address this issue is to add thermal conductive fillers, such as graphite [13,14], boron nitride [15,16] and carbon fibers [17], to the polymer matrix to increase the thermal conductivity. Similarly, in the field of mechanical recycling, it is often desired to deal with composite instead of virgin materials [18,19,20,21]. Mechanical recycling is only beneficial if degradation can be properly minimized and ideally high-quality products are delivered. Through the polymeric composite route, it is possible to widen the sustainability range, provided that the entropic complexity is sufficiently controlled [22].
Notably, the addition of filler influences the rheological and, in particular, the viscoelastic properties of polymer composite melts, which implies processing difficulties, as evidenced by unstable flow behavior with prominent examples being extrudate swell [23,24,25], sharkskin [3,26,27,28] and melt fracture [26,29]. Hence, studying how the filler influences the rheological properties and thereby the processing behavior of polymer composites is an important research topic, ultimately aiming at controlling the processing conditions to obtain the desired product profiles and macroscopic properties, including increased durability and improved mechanical recycling potential.
It has been put forward that the addition of fillers into a polymer matrix suppresses the swelling behavior [23,24,25,30,31,32]. Several filler characteristics also affect the swelling behavior, such as the filler size, the filler content and the interaction between filler and matrix thus the dispersion quality [24,31]. For example, Stabik [33] found that fillers with larger aspect ratios lead to smaller extrudate swell, while other factors such as the specific surface and mean diameter contribute less to the swelling of PE and polystyrene melts. Very dedicated combined experimental and modeling research is although very scarce. To fully understand the three-dimensional (3D) flow pattern of composite melts the starting point should be a dedicated understanding of the virgin 3D flow, which has only been achieved very recently. In this context, in our previous work [34,35,36], we have extensively studied the extrudate swell behavior of neat PP, high-density polyethylene (HDPE) and low-density polyethylene (LDPE) from a slit die at 200 °C, considering the finite element ANSYS Polyflow solver combined with the viscoelastic constitutive Phan-Thien-Tanner (PTT) constitutive model of which the parameters have been validated based on independent rheological data. Swelling is recorded in all directions with maximal increases up to 30% and even for the larger aspect ratios extrudate contraction, hence, negative swelling for the edge height. Overall, it could be concluded that anisotropic swelling of virgin polyolefins depends not only on the type of the polymer melt but also on the flow geometry characteristics, such as the aspect ratio of the die and the length/height ratio within an upstream contraction region in relation to the die dimensions.
In the present work, the influence of the addition of graphite fillers in PP melt on the rheological properties is studied at 200 °C. It is further explored how the parameters of the constitutive PTT model can become a function of the filler content and thus ANSYS Polyflow swelling predictions can be made more generic for both virgin and composite PP. In other words, it is tested how one of the most frequently employed viscoelastic models for rheological behavior can be adapted to support the design of sustainable lightweight composite materials. It is demonstrated that up to moderate filling contents this adaptation is possible. It is also shown that the prediction of the width direction is more complicated than the prediction of the height direction, further highlighting the relevance of three-dimensional flow simulations to unravel the complexity of polymer/composite melt stability.

2. Modeling Section

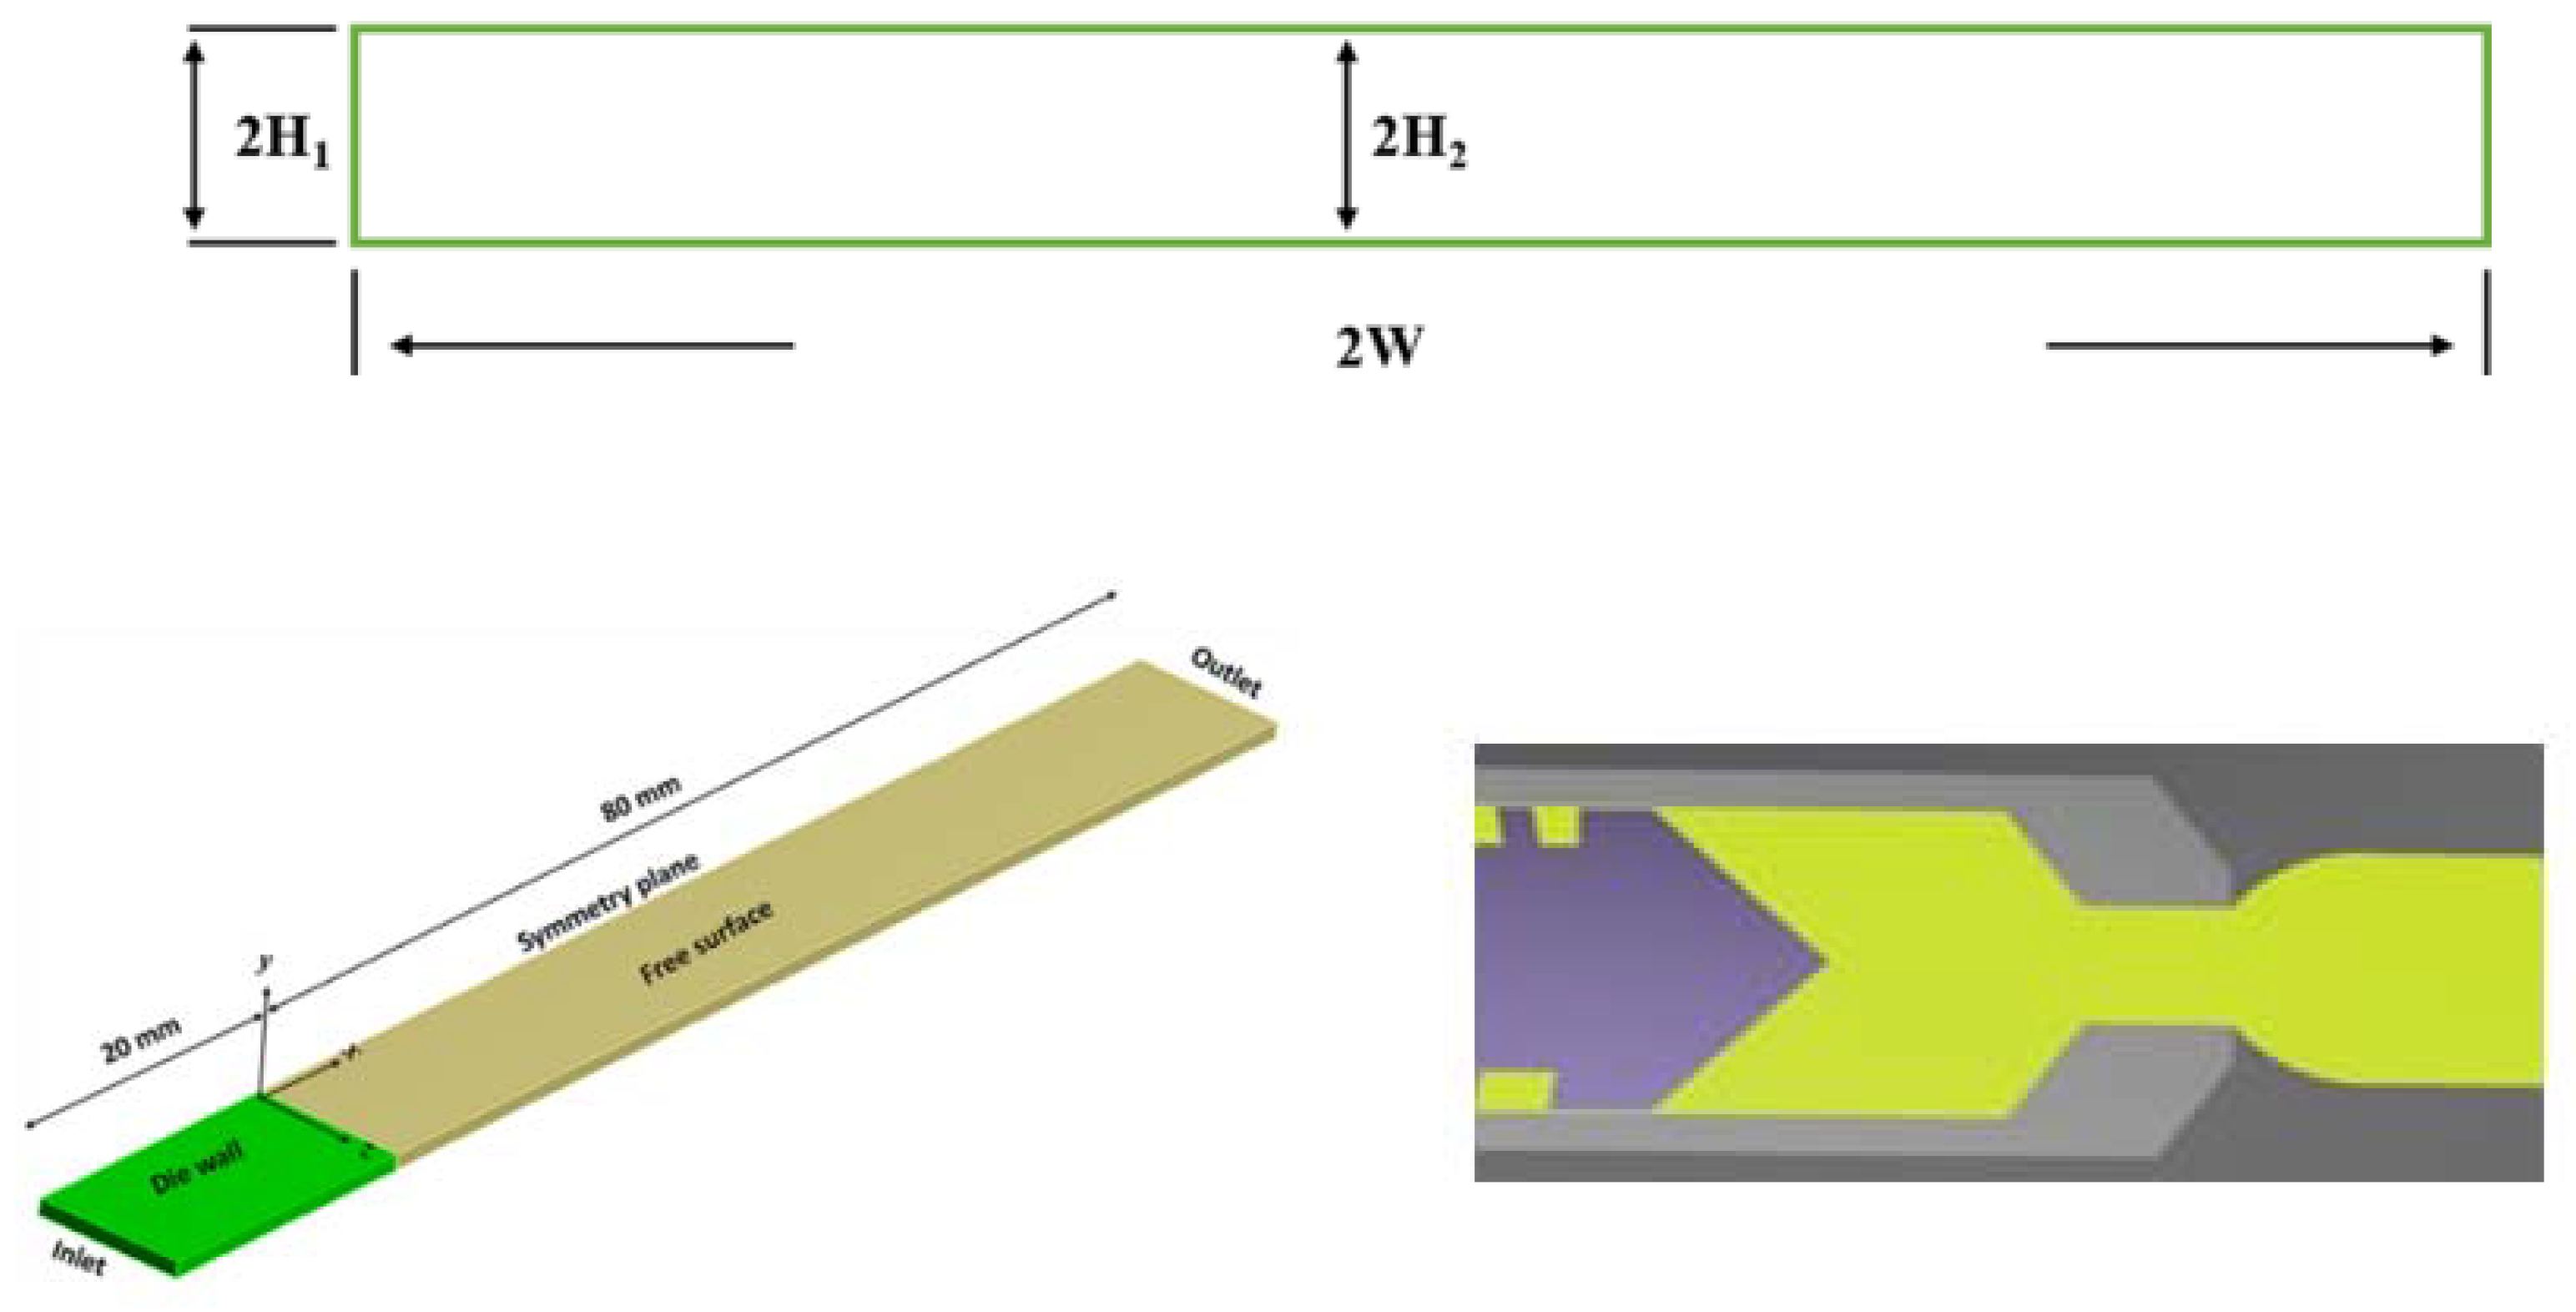
2.1. Geometric Parameters

Figure 1 (top) depicts the 2D diagram of the cross section of a slit die with an aspect ratio of 10. Several swell ratios can be defined, as the ratios between the dimensions of the extrudate at a given position and the slit die (one example given in Figure 1 (bottom right). To properly identify a possible anisotropic extrudate swell behavior, the swelling ratios B1, B2 and B3 are needed, denoting the swelling in the extrudate width, edge height and middle height direction [26]:
B 1 = W e x t r u d a t e W ,     B 2 = H 1 e x t r u d a t e H 1   and     B 3 = H 2 e x t r u d a t e H 2
Additionally, B 4 can be defined as the swell ratio of the area size (S) of the extrudate cross section and the slit die:
B 4 = S e x t r u d a t e S

2.2. PTT Constitutive Model

The PTT constitutive model is an interesting model for the description of viscoelastic variations in basic polymer melts. Its multimodal form allows to overcome issues of monomodal models thus it inherently allows tackling the spectrum of relaxation times.
For the differential viscoelastic constitutive model, the extra stress tensor τ can be divided into a purely viscous part τ N and a viscoelastic part τ p , which can be calculated with the standard viscoelastic constitutive equations. In comparison with a single9mode PTT model, a multi-mode PTT model (order N) with a relaxation time spectrum enables more accurate simulation results [37]. This model is expressed as:
τ p = i = 1 N τ p i      
e x p [ ε i   λ i η i t r ( τ p i ) ] τ p i + λ i [ ( 1 ξ i 2 ) τ p i ˇ + ξ i 2 τ p i ^   ] = 2 η i D  
in which λi and ηi are the relaxation time and shear viscosity, D represents the deformation tensor rate, the non-linear parameters ε i   and ξ i mainly control the extensional and shear behavior of polymer fluid, and   τ p i ˇ and τ p i ^ denote the upper and lower convected derivatives of τ p i , defined by:
  τ p i ˇ = D τ p i D t ( τ p i · v + ( v ) T · τ p i )  
  τ p i ^ = D τ p i D t + ( τ p i · v + ( v ) T · τ p i )  
with v and ( v ) T the velocity gradient and transpose of the velocity gradient.
To reduce the number of the PTT variables (see Table 1), the relaxation time λi is maintained constant for all polymer composites with a time range from 0.01 to 10 s. The dependence of the viscosity on the filler volumetric content (x) is denoted as ηi (x). Regarding ξ i and ε i it is assumed that these parameters are constant in each mode i to reduce the number of variables. The corresponding material functions are denoted as ξ ( x ) and ε ( x ) . As a consequence, a modified PTT constitutive model is written as:
e x p [ ε ( x ) λ i η i t r ( τ p i ) ] τ p i + λ i [ ( 1 ξ ( x ) 2 ) τ p i ˇ + ξ ( x ) 2 τ p i ^   ] = 2 η i D  
Note that upon the consideration of other temperatures the same tuning approach can be applied and the individual parameters can be made temperature-dependent. Here, one can start with Arrhenius-like equations but also use other fitting equations if more suited.

2.3. Boundary Conditions and Numerical Method

The 3D flow domain is given in Figure 1 (bottom left) with one quarter of the flow channel considered for all simulations to reduce the computational cost due to the symmetry planes. Briefly, at the inlet, a fully developed flow with a flow rate of 620 mm3 s−1 is considered. At the die walls, a no-slip condition for the velocity field is prescribed: vn = vt = 0 (mm s−1). A free surface flow developed outside the die exit is unknown a priori. The force conditions ft = fn = 0 (N) are set at the outlet of the flow domain, with the subscripts n and t indicating the normal and tangential component of the force and velocity.
The flow solver (POLYFLOW version 18, ANSYS, Canonsburg, PA, USA) is used based on the finite element method. The interpolation functions applied on the velocity and pressure are quadratic and linear, respectively. A discrete elastic viscous stress splitting (DEVSS) combined with the streamline upwind (SU) scheme is utilized to improve the calculation stability due to the exit singularity. In addition, an evolutionary scheme is employed for the volumetric flow rate to advance the solution to the viscoelastic flow with high non-linear rheological properties starting from almost purely Newtonian flow, in agreement with our previous work [35,36]. An example regarding meshing, selecting also other aspect ratios, is provided in Figure 2 [36].

3. Experimental Section

3.1. Materials

Polypropylene (PP, SABIC 575P, SABIC, Europe) and graphite fillers (GP, Asbury 3807, Asbury Carbons) were used in this study. For the pure polymer melts, pellets were directly available. The PP/graphite composite pellets containing various mass filler contents of 10%, 20% and 40%, corresponding to a volumetric filler content x of 4.3%, 9.2% and 21.1%, were in contrast made in-house employing twin-screw extrusion. This extrusion was conducted with a screw rotational rate of 90 rpm and a processing temperature window of 160–210 °C, while using a chopping machine. The polymer melts were all extruded from a single screw extruder (P. Brabender 19 with a screw diameter Ds of 19 mm, Ls/Ds of 25; Ls: screw length) combined with a slit die (die length: 220 mm, die height: 2 mm, and die width: 20 mm) at a screw speed of 60 rpm at 200 °C.

3.2. Rheological Measurements

An ARES-G2 (TA Instruments, Waters, New Castle, DE, USA) rheometer was used to perform the temperature-dependent rheological measurements of polymer melts at 200 °C. The dynamic small amplitude oscillatory measurements were performed with a frequency sweep in an angular velocity (ω) range of 0.1–500 rad s−1. The steady shear mode tests were carried out within a small shear rate range of 0.01–5 s−1 to avoid melt fracture. Disk samples with a diameter of 25 mm and a thickness of 2 mm were made using compression.
To enable an evaluation of conventional analysis tools for the first- and second-order normal stress (N1 and N2; e.g., N 1 = τ y y τ x x ) differences, focus has been on the determination of N 1 N 2 by a parallel plate geometry mode [38,39]. For polymers, it generally holds that N1 > 0 but N2 < 0, and | N 1 | 10 | N 2 | [38,40]. The | N 2 | / | N 1 | value for PP and PP with low filler content (4.3%) has been claimed to be 0.1 (200 °C) [41,42]. For composites, it has been pointed out that | N 2 | / | N 1 | increases further [43,44]. Consequently, the ratio is assessed as 0.2 and 0.3 for PP/9.2GP and PP/21.1GP, respectively.

3.3. Data Recording for Die Swell

The reader is referred to Tang et al. [35] for a detailed description of the data recording procedure for the die swell up to the equilibrium position.

4. Results and Discussion

In this section, it is first evaluated how the rheological properties of PP melts at 200 °C alter if a certain amount of filler is utilized. Then, the observed trends are described in basic mathematical formulas that can be linked to the constitutive PTT model to subsequently study the relation between filler content and extrudate swell, by considering a slit die.

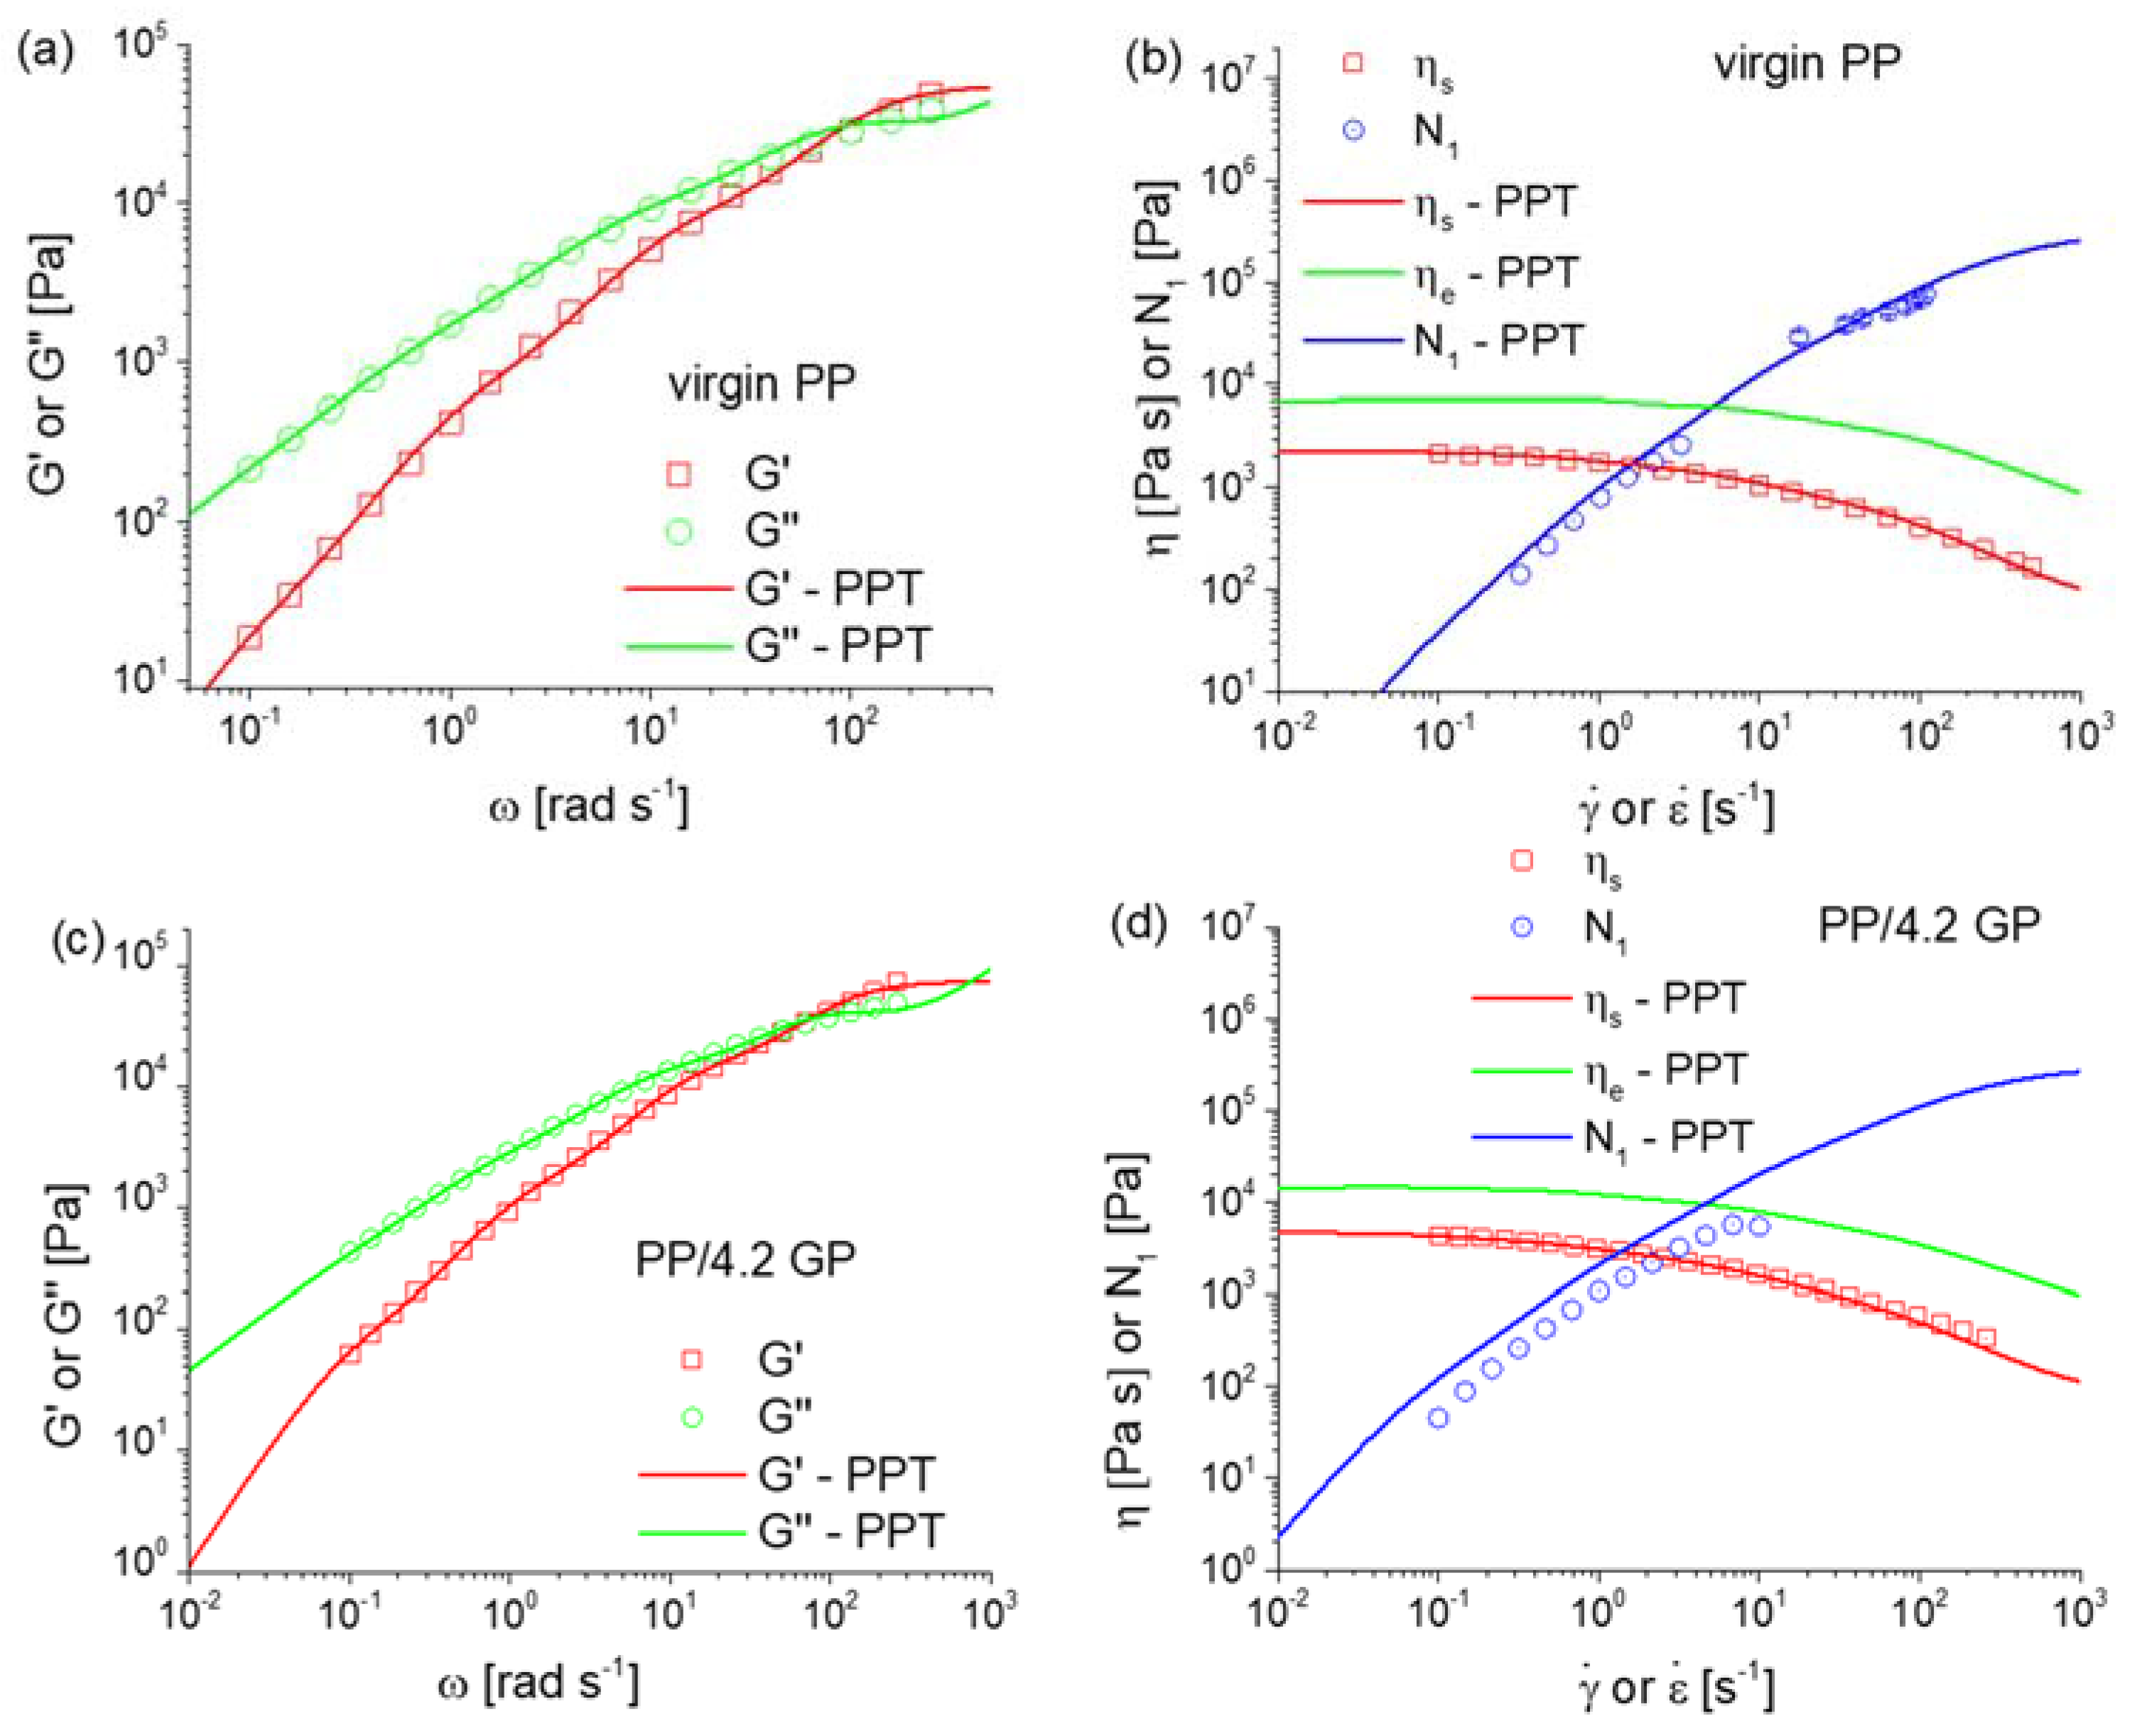
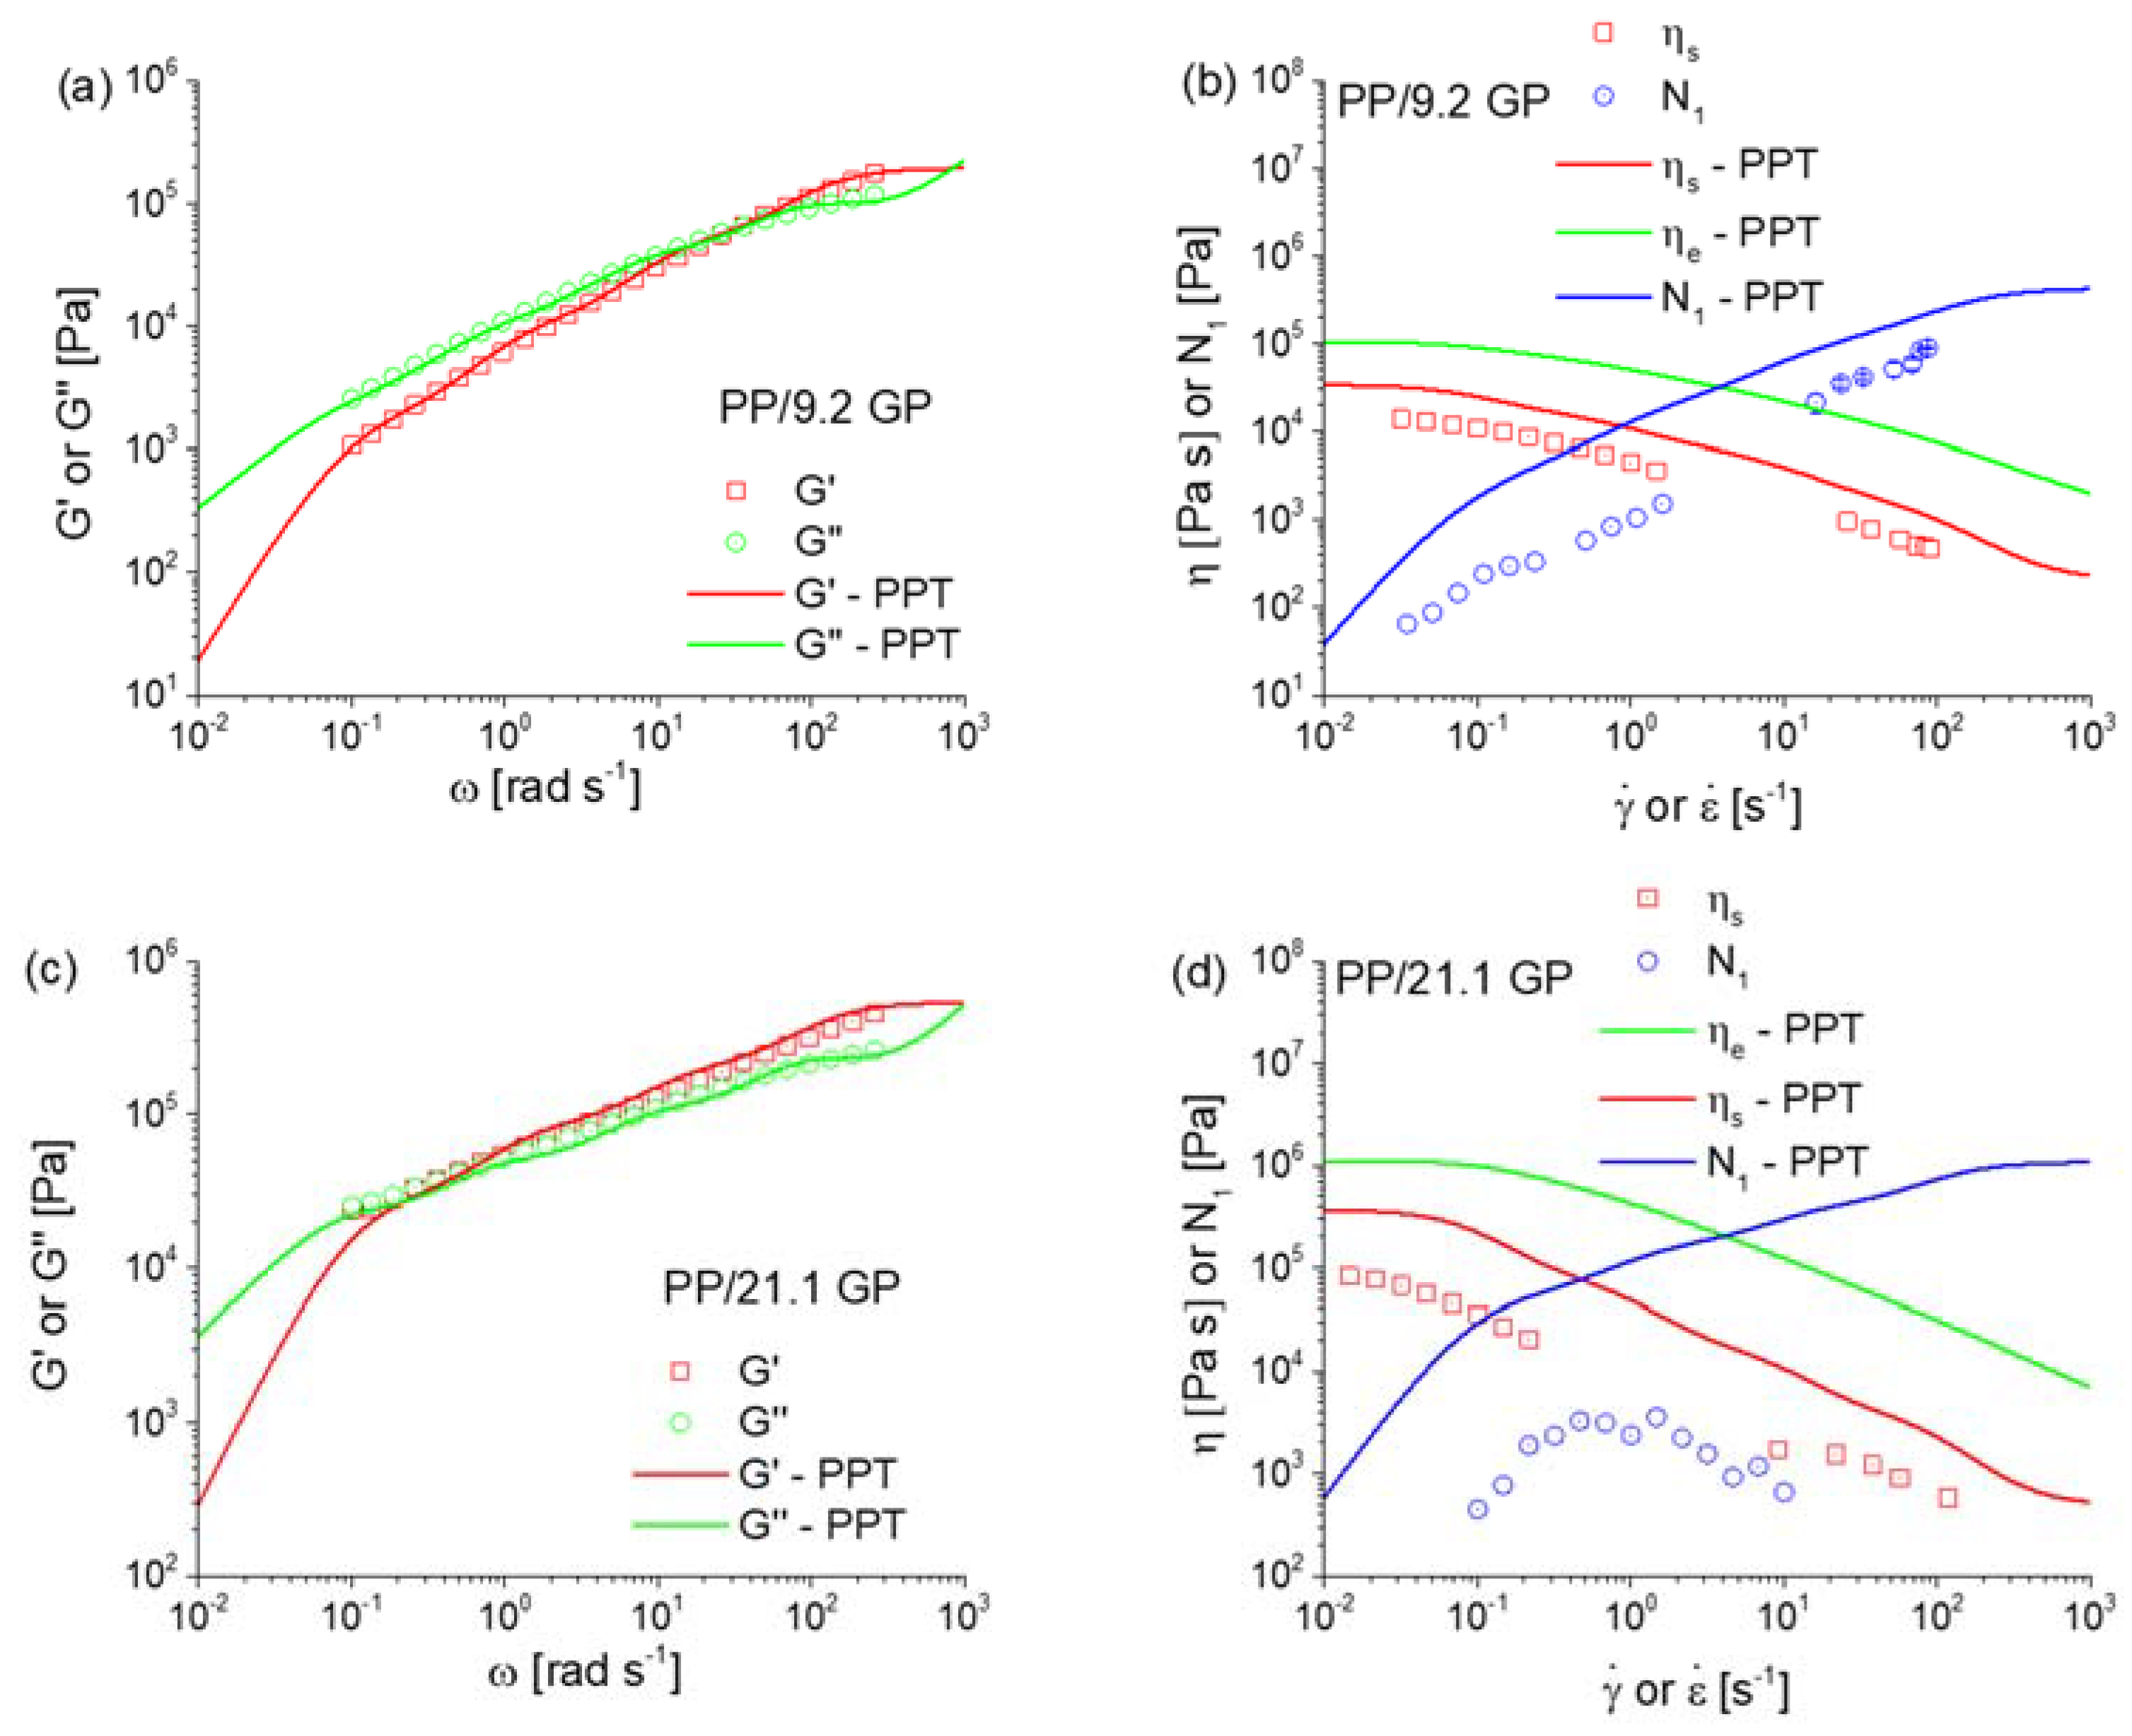
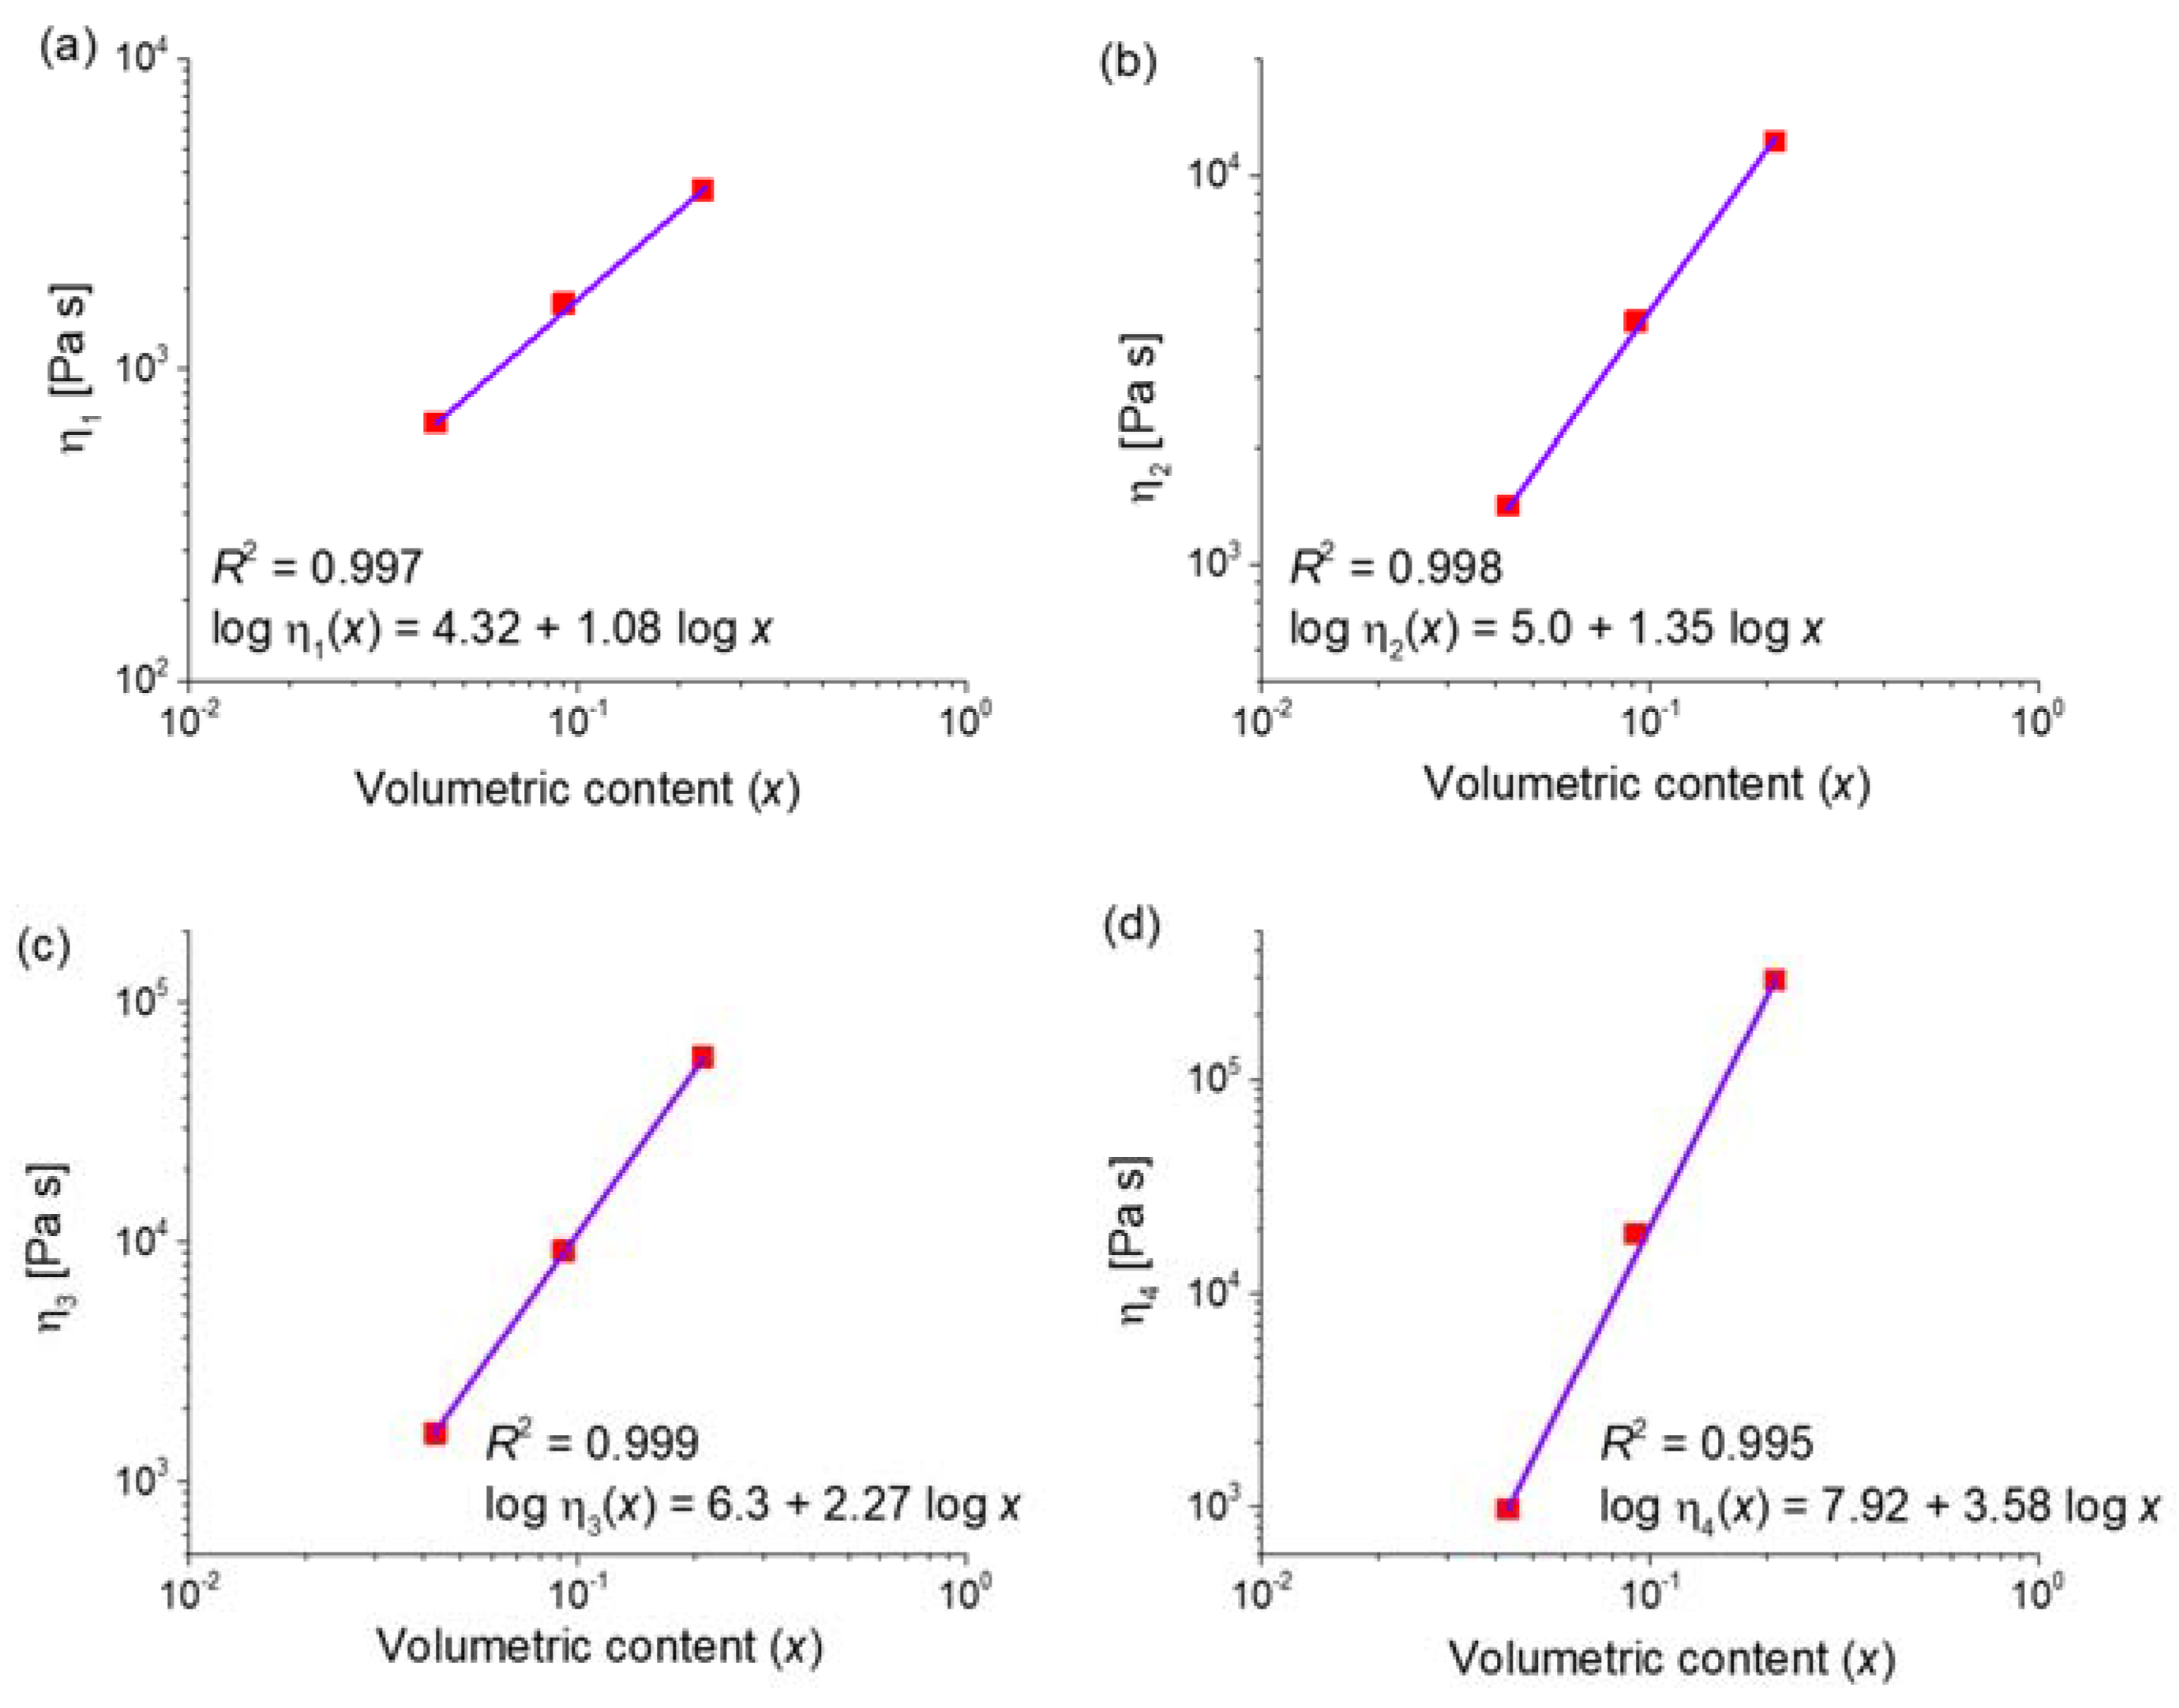
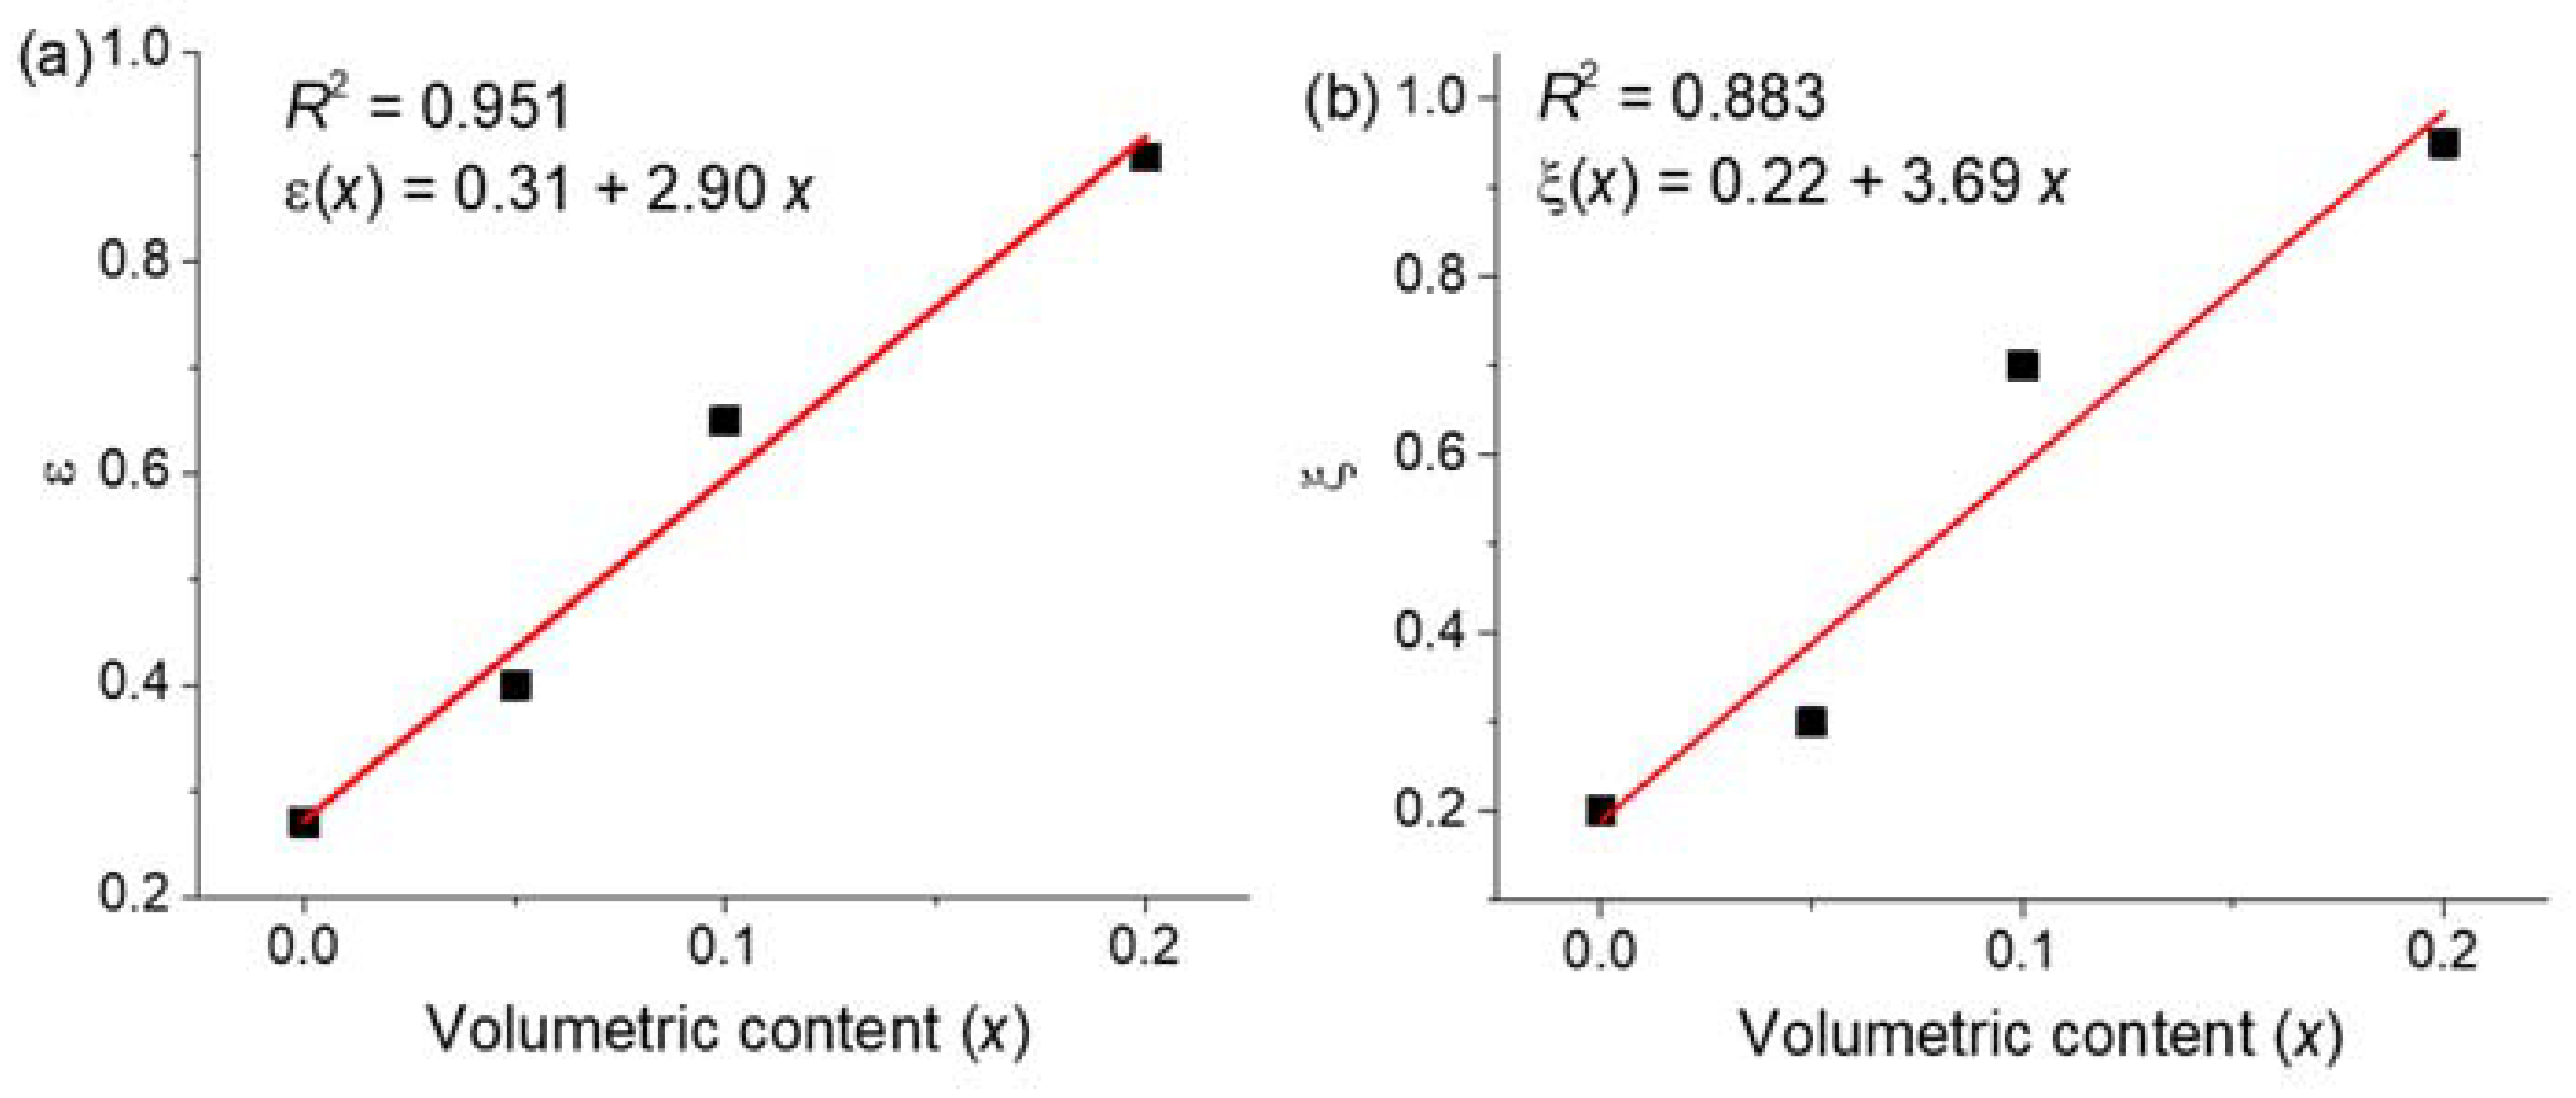
4.1. Rheological Analysis at Low and High Filler Contents

Figure 3 compares the experimental and modeled rheological data regarding the storage modulus G′, the loss modulus G″, the shear viscosity η s and the first normal stress difference N1 for virgin/neat PP (subplots a and b) and PP composite with a low graphite filler content of 4.3% (subplots c and d). For the PTT modeling, the “first” and “second” set of PTT parameters of Table 1 have been considered. It is seen that an excellent agreement between the experimental measurements and the PTT modeling results is observed for both polymer melts focusing first on G′ (red lines and symbols in subplots a and c) and G″ (green lines and symbols in subplots a and c). Note that with filler the crossing point of G′ and G″ slightly shifts to the left, indicating stronger elastic properties caused by the addition of graphite fillers [13,45]. This good match between experimental and modeled data also hold for N1 (blue lines and symbols in subplots b and d) and η s for the neat PP fluid (subplot b), while for the composite melt (subplot d) only   η s is well-described due to a slight overprediction of N1 for the composite case. The latter might be attributed to the use of only a ballpark value for | N 2   | | N 1 | for calculating the N 1 data, as explained above. In general, it can be still concluded that the PTT model is sufficiently accurate for the lower filler contents. Moreover, the model also provides the elongational viscosities η e (green lines in subplots b and d), being always higher than η s but displaying a similar rate dependence.
Figure 4 shows the varying trends of the rheological properties of PP/GP composites in case the filler volumetric content is further increased (now “third” and “fourth” set of PTT modeling parameters from Table 1), considering the same color coding as in Figure 2. As the filler volumetric content is increased from 9.2% up to 21.1%, it follows that the frequency at which G′ is equal to G″ (subplots a and c) is even lowered more compared to Figure 2, highlighting a stronger elastic response for higher filler amounts. In other words, adding filler into a polymer matrix facilitates a transition from a fluid-like material to a solid-like one at lower strain rates. In addition, the good prediction of G′ and G″ for PP/9.2GP and PP/21.1GP indicates again the predictive ability of the PTT model. For N1 and η s , as shown in subplots b and d, the situation is different. In contrast to the results in Figure 3, there is now a clear mismatch for both properties and this is even more as the filler content increases from 9.2% to 21.1% (subplots b to d), but at least for the 9.2% case an acceptable qualitative description. A closer inspection reveals that at the highest filler loading the experimental N1 even drops at the higher shear rates, indicating potential experimental limitations in this range.
In our previous work [34] it has been reported that the Cox-Merz rule is invalid if the graphite filler is equal to 20%, implying the deconstruction of the filler-matrix and filler-filler interactions upon applying larger strains. This interfacial factor is not accounted for by the conventional viscoelastic constitutive PTT model, explaining the inability of this model to reflect such dependencies. In addition, the significantly scattered N1 data by the rotational rheometer for PP/21.1GP indicate melt fracture during the experiments. Considering the results in both Figure 2 and Figure 3, the PTT model at least gives the correct order of magnitudes and is acceptable in absolute accuracy if the filler content is not increased to high values, in this work, kept below 10% on a volumetric basis. Hence, it can be expected that, within reasonable boundaries, the PTT model is also suited to describe extrudate swell, as explored in the next subsection.
Taking into account the modeling assumptions explained above, it follows from Table 1 that upon increasing the graphite filler content not only ηi increases but also ξ i and ε i . A molecular interpretation is here that the rigid filler particles inhibit the entanglements of polymer molecules so that the entangled polymer chains can be easily disentangled once applying a small strain, thus resulting in a larger strain-thinning behavior [46]. Furthermore, to capture the varying trend of the material parameters against the volumetric filler content, it is of significance to establish a workable mathematical function. As seen in Figure 5, the dependence of the mode-dependent viscosity parameter ηi on the filler content x is more evident by constructing a log-log plot, not including by default the data for x = 0, thus the neat PP case. A quasi-linearly increasing trend is observed as the filler content increases, which is accompanied by a value of the determination factor R2 as high as 0.995. The associated equation for η i in each mode is shown in the corresponding subplot. All equations can be rewritten and summarized as:
η i ( x ) = K i x a i   ( x   >   0 )
with the fitting parameters K i and α i listed in Table 2.
It follows that lower values for both parameters of the viscosity function are observed in the order of η 4 ( x ) , η 3 ( x ) , η 2 ( x ) and η 1 ( x ) . This indicates that the viscosity of polymer composites at the low shear rates corresponding to the higher relaxation time range is more sensitive to the addition of the graphite filler.
Figure 6 shows similar fittings for ε and ξ for PP composites with various filler content, also now including the zero filler case (x = 0), thus the neat reference case. In Figure 5a, a linear increase of ε is observed as the filler volumetric content increases, indicating a stronger elongational thinning behavior. In addition, a similar varying trend is noted for ξ although with a lower value of the determination factor R 2 . The associated equations are:
ε ( x ) = 0.31 + 2.90 x   and   ξ ( x ) = 0.22 + 3.69 x
In summary, Equations (10)–(13) define the modified PTT model (at 200 °C) to tackle the rheological behavior of PP composite (x > 0):
e x p [ ε i ( x )   λ i η i t r ( τ p i ) ] τ p i + λ i [ ( 1 ξ i ( x ) 2 ) τ p i ˇ + ξ i ( x ) 2 τ p i ^   ] = 2 η i ( x )   D
η i ( x ) = K i x a i   ( x   >   0 )
ε ( x ) = 0.31 + 2.90 x
ξ ( x ) = 0.22 + 3.69 x

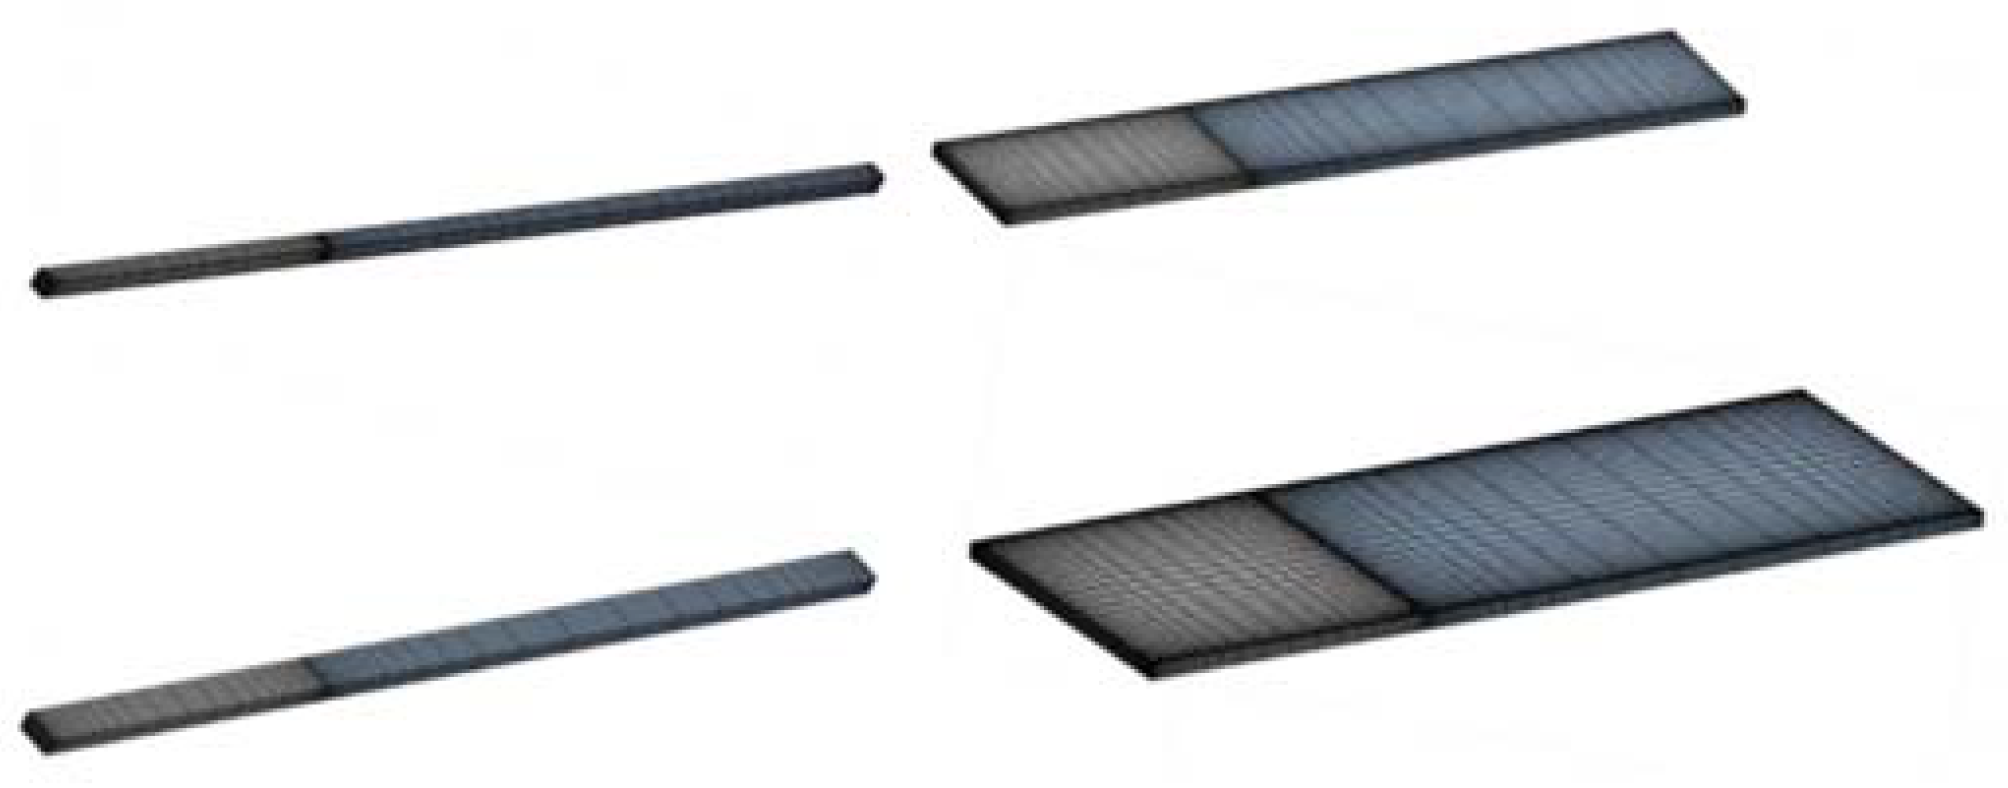
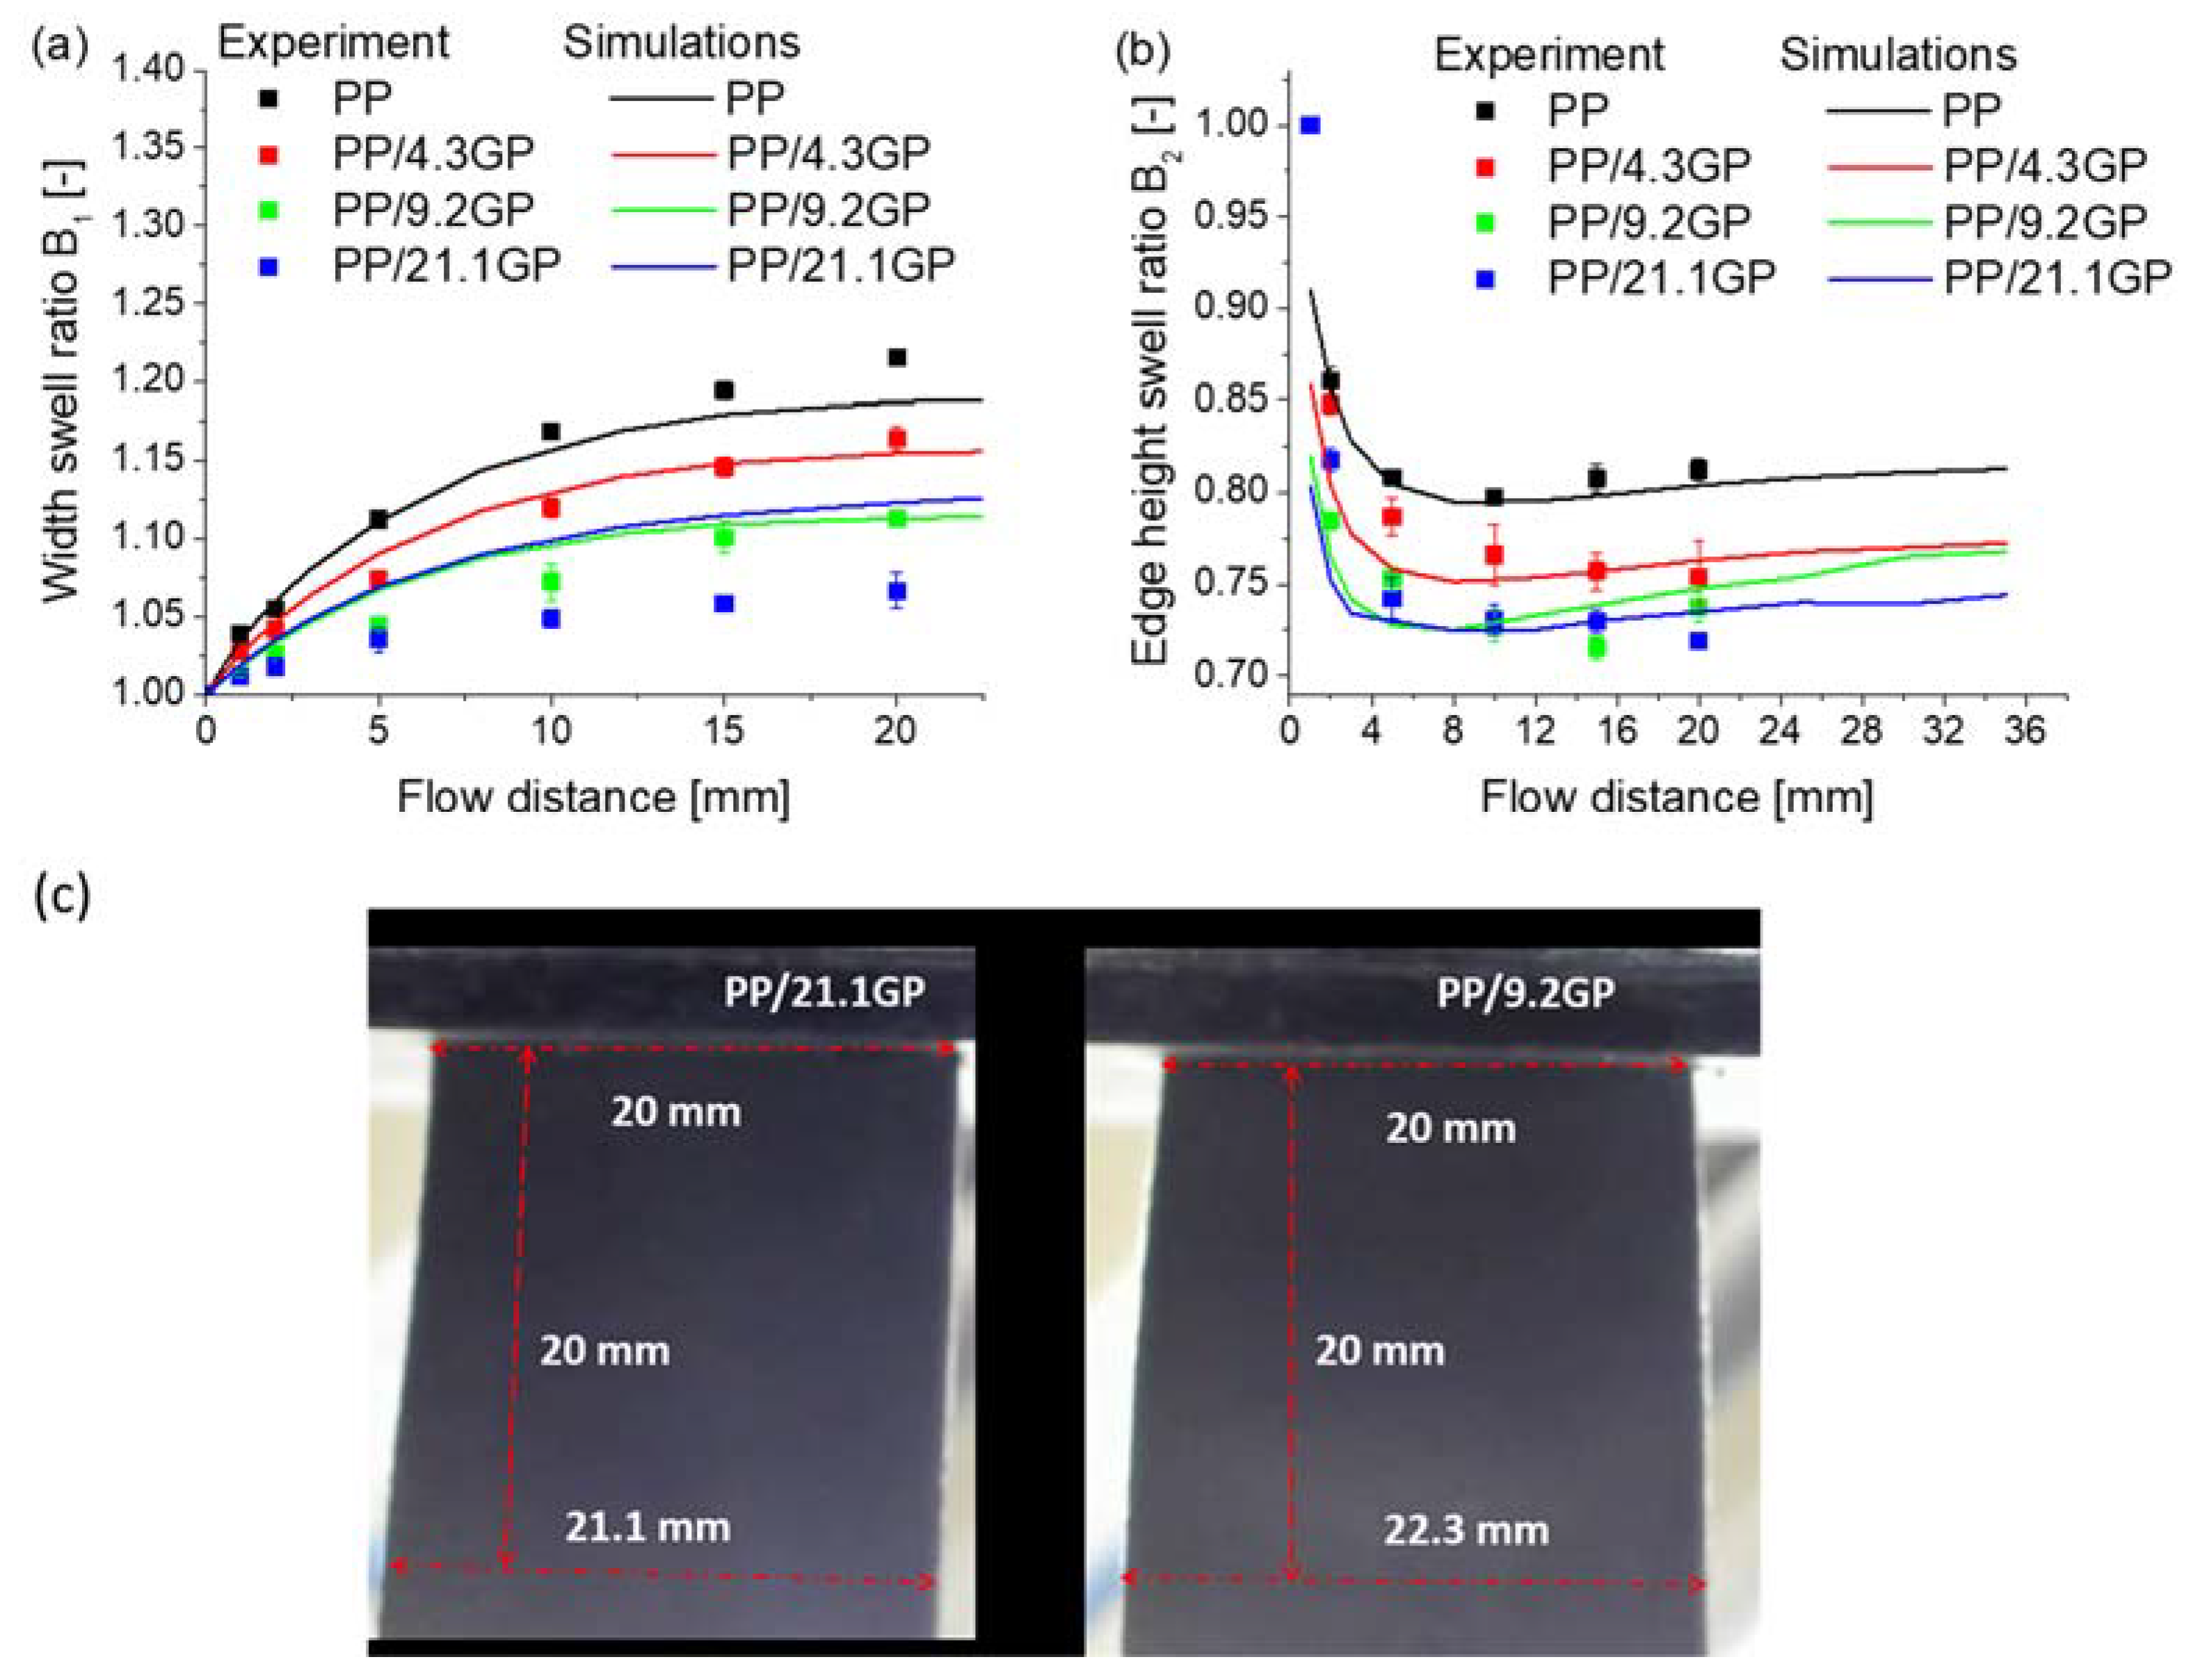
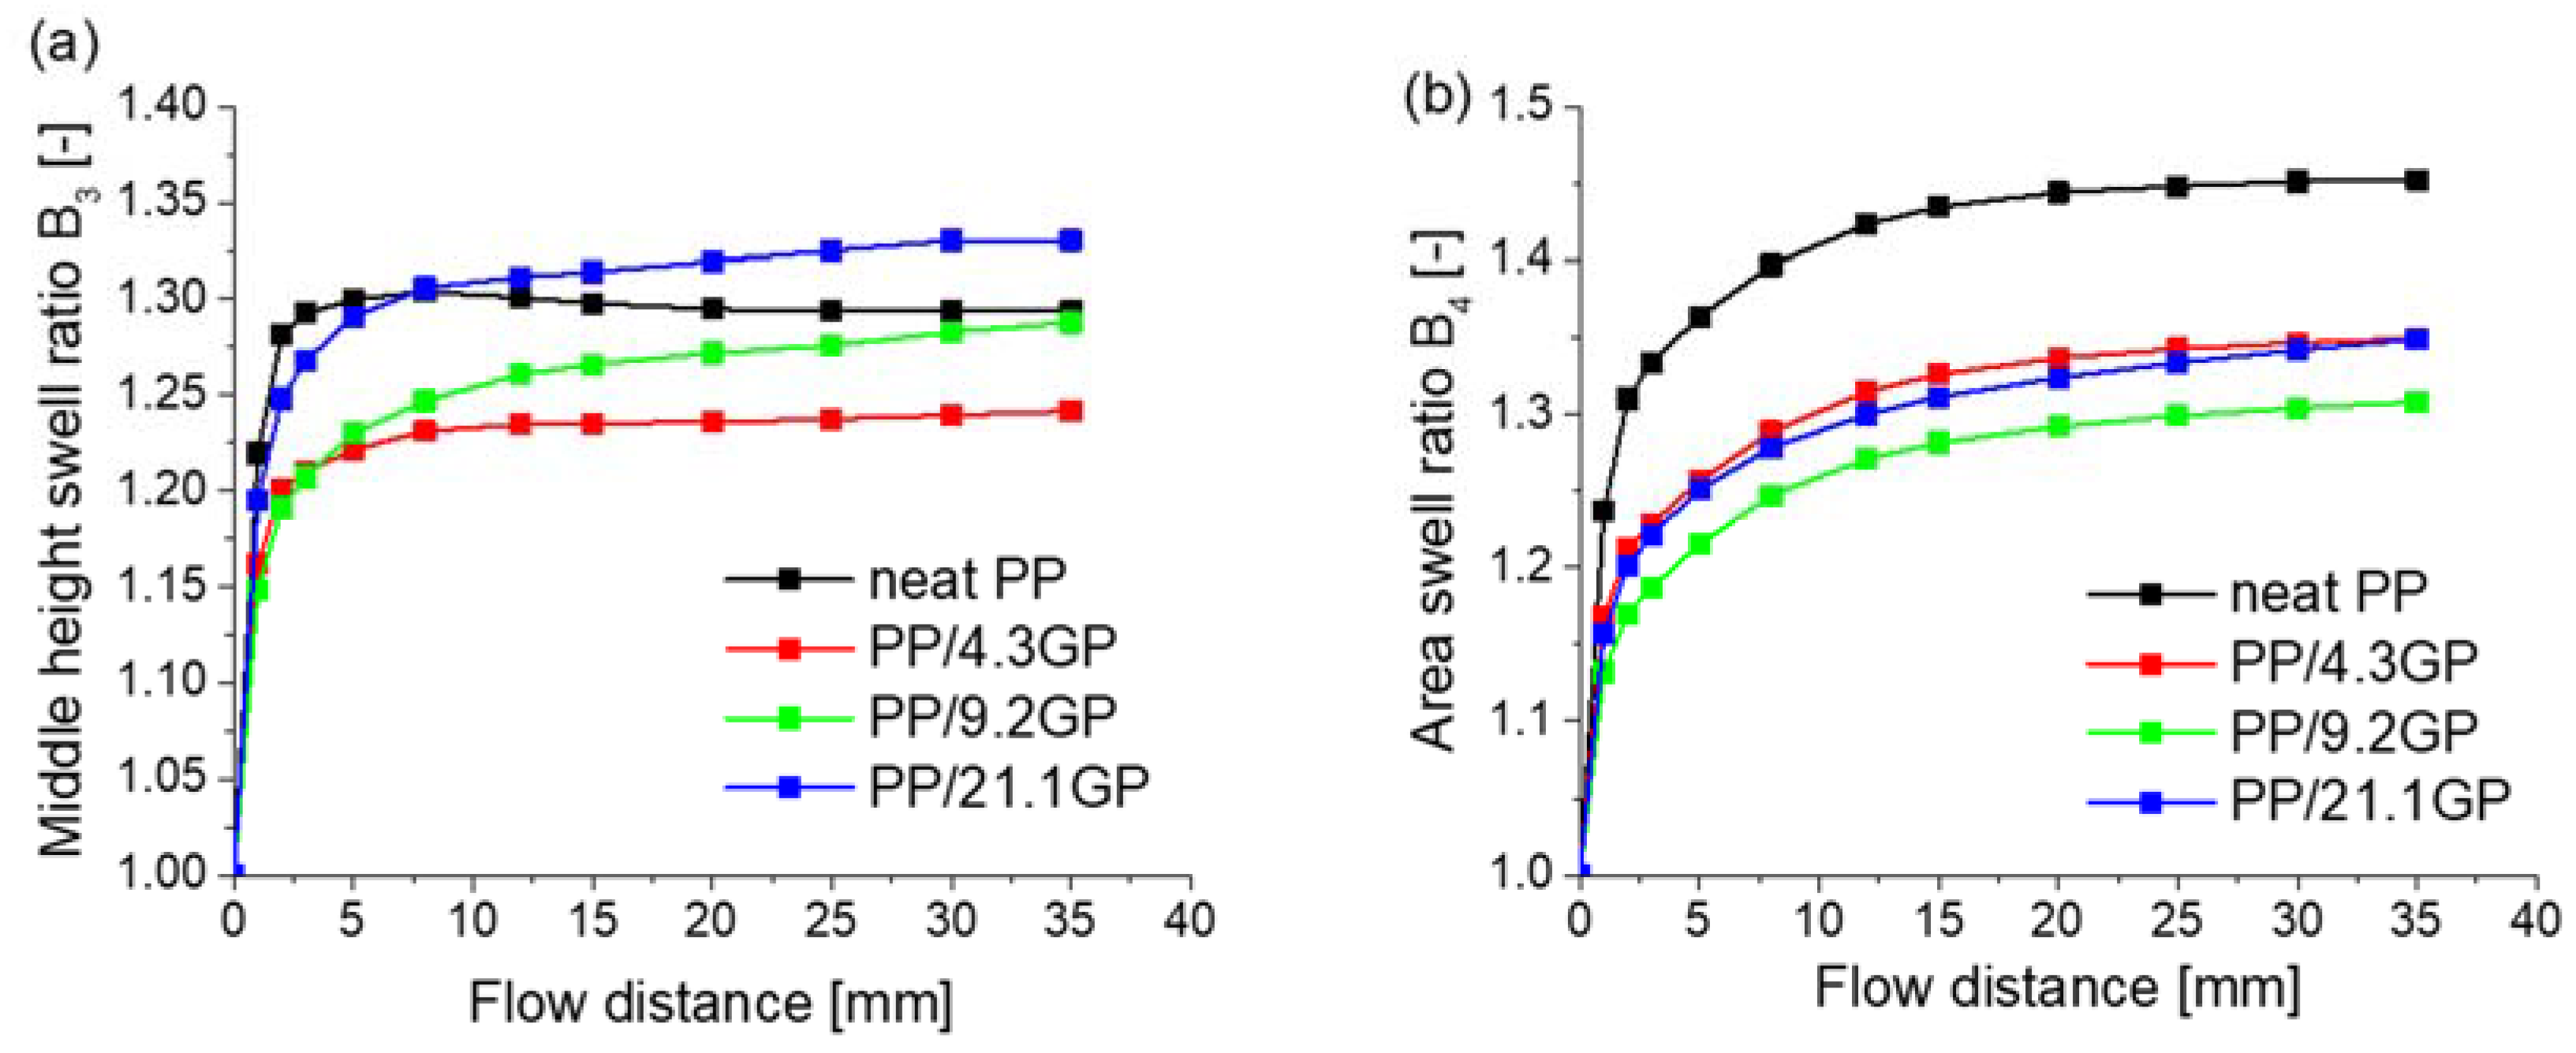
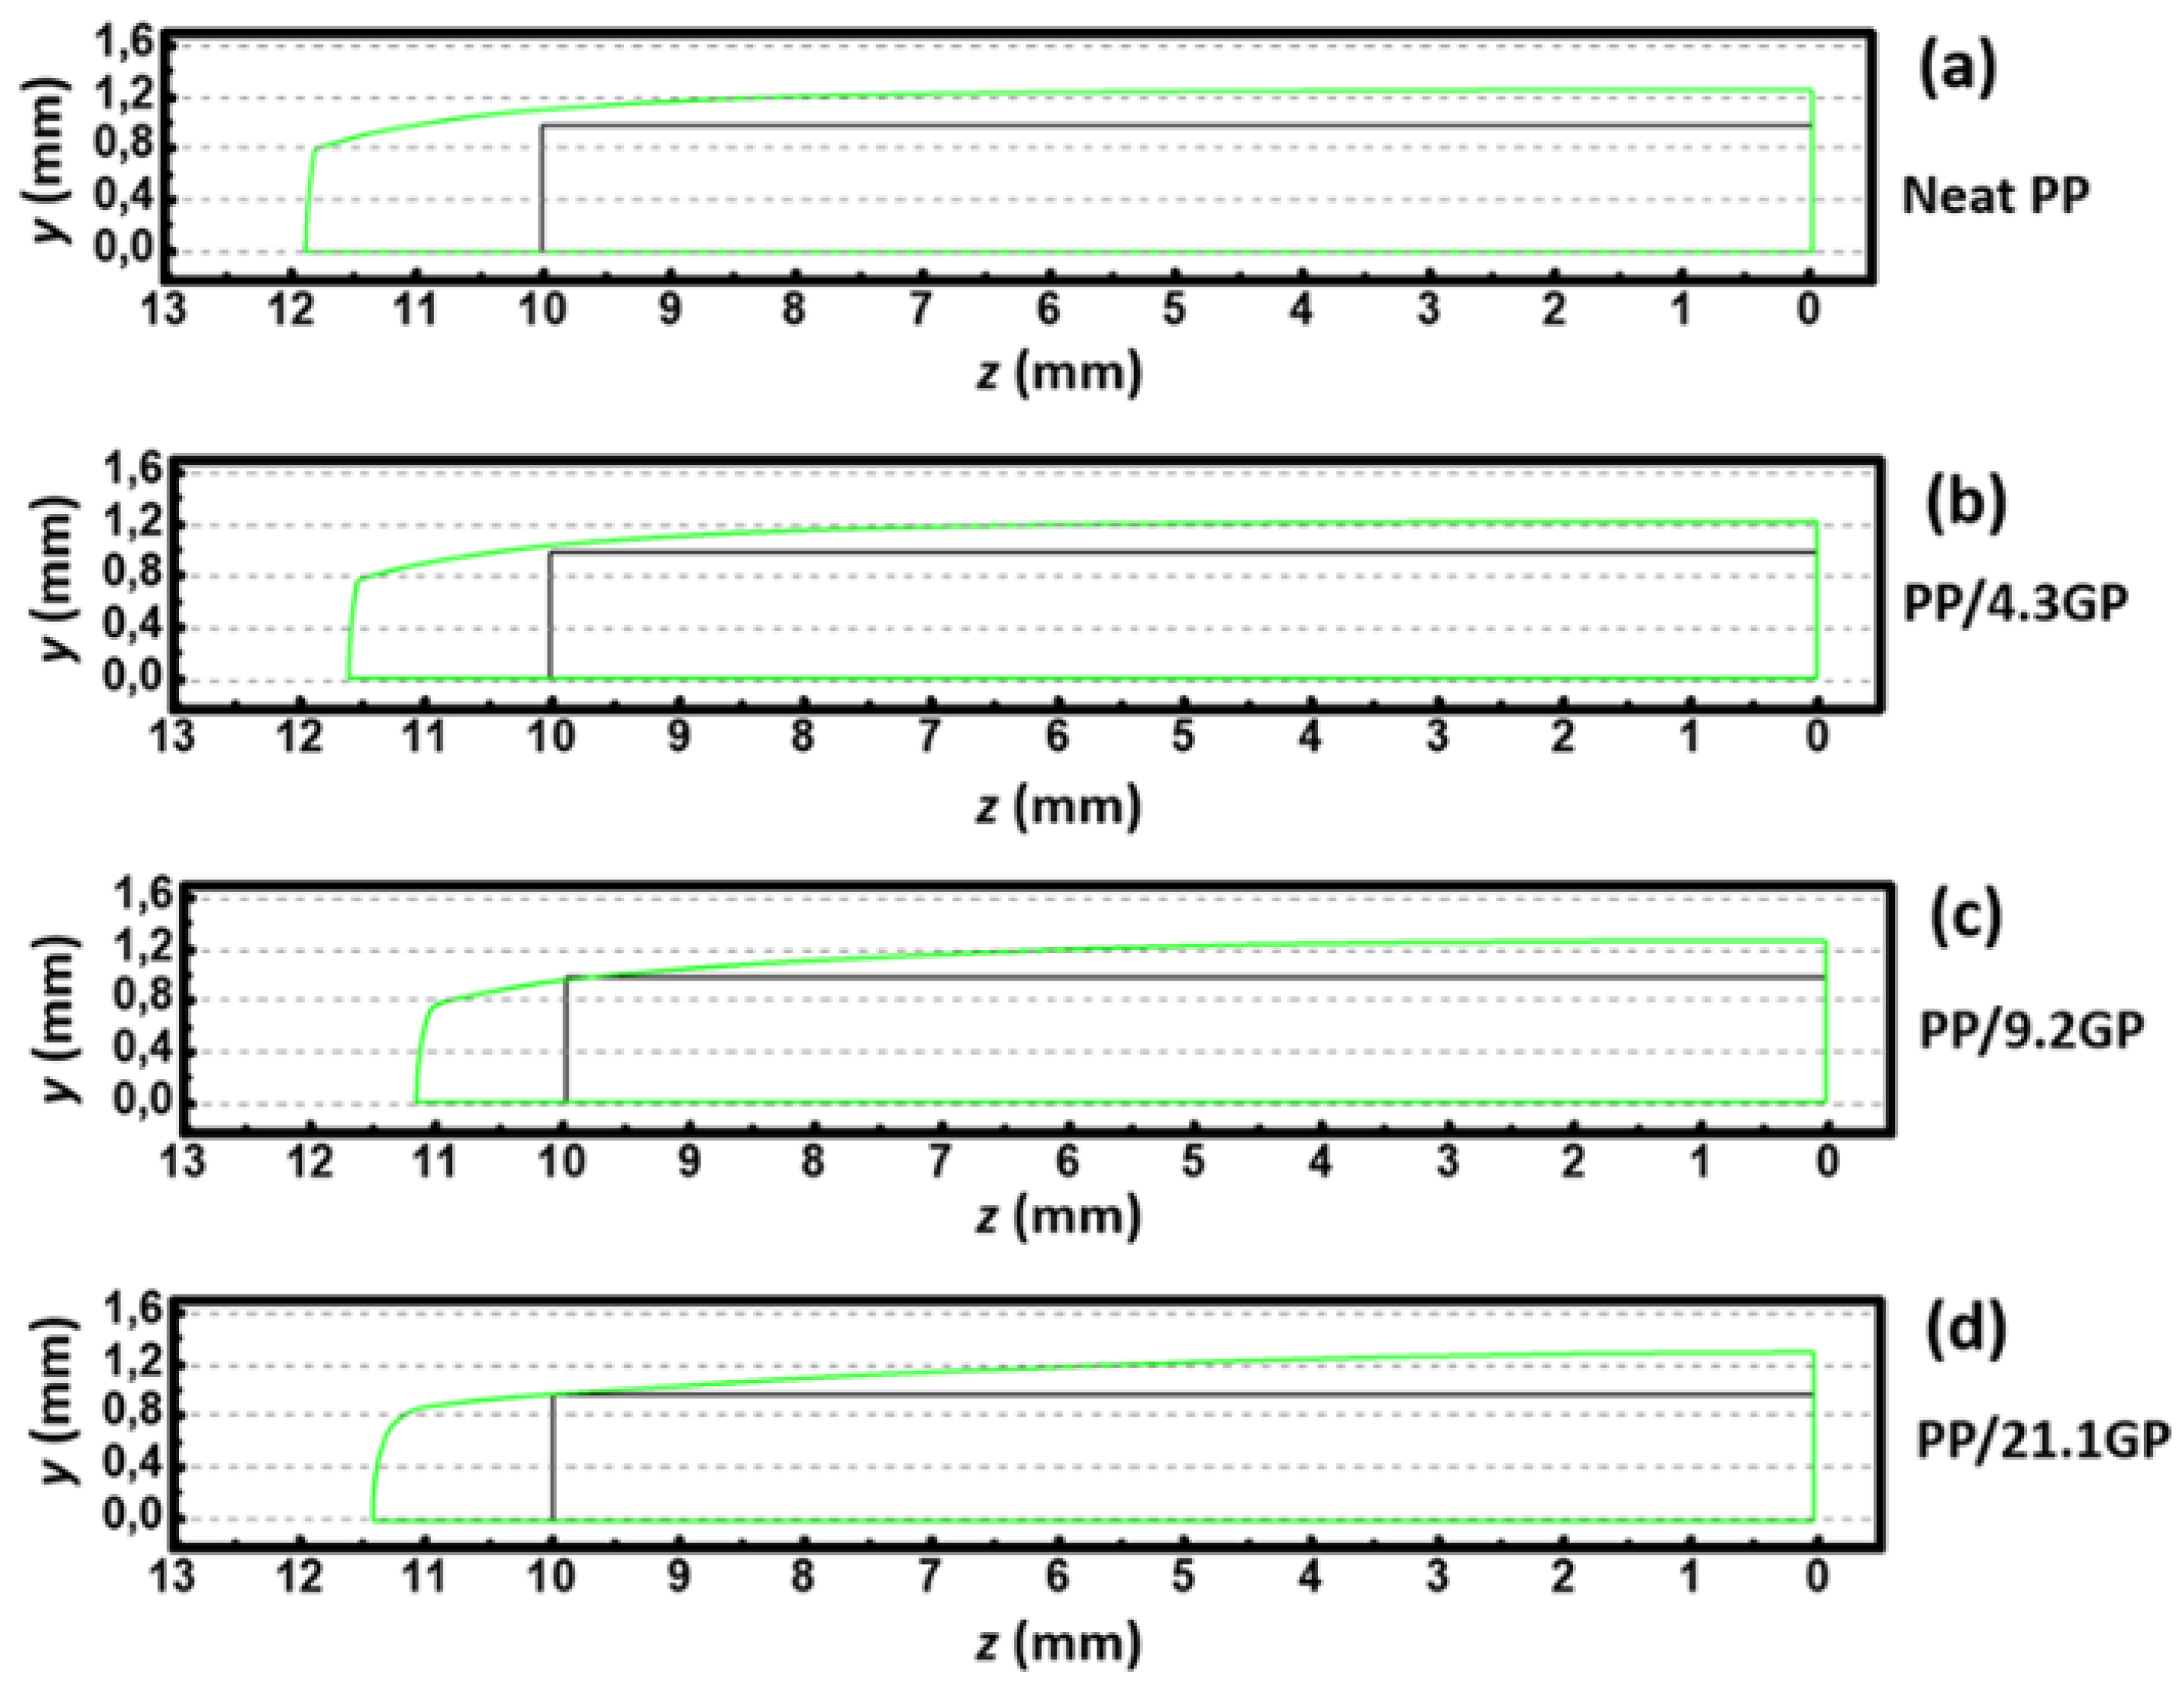
4.2. Impact of Filler Content on Extrudate Swell

With acceptable x-dependent PTT model parameters determined in the previous subsection a next logical step is to evaluate their impact on the actual swell behavior with a slit die, still considering a melt at 200 °C. The typical character of polymer extrudate swell behavior is a continuous, thus spatial and time-dependent evolution after emerging the die exit. Figure 7 shows the evolution profile of the predicted extrudate swell behavior in the width and edge height direction of PP melts with various volumetric graphite filler contents (B1 and B3 variations) and taking the flow rate at 620 mm3 s−1. For comparison, the experimentally measured extrudate swell ratio for various polymer melts are shown as well. It should be mentioned that the experimental measurements were carried out at a slightly different flow rate for each composite since the extrusion speed has been fixed at 60 rpm. Due to the different densities and pellet sizes resulting from the addition of graphite filler, a flow rate of 620 mm3 s−1 is observed for neat PP, whereas this rate becomes 552.63 mm3 s−1 for PP/4.3GP, 510 mm3 s−1 for PP/9.2GP composite, and 504.6 mm3 s−1 for PP/21.1GP.
It can be seen in Figure 7a that the experimental width swell ratio B1 (symbols in subplot a) increases with the flow distance first, but then reaches an equilibrium value upon further increasing the flow distance. This is in agreement with general reported trends [42,47,48]. Consistent with literature data [23], it is further confirmed that the experimentally measured extrudate swell ratio decreases with the addition of graphite fillers. For example, the experimental final width swell B1 for neat PP at a flow rate of 620 mm3 s−1 is 1.20, which drops sharply to 1.11 as the volumetric filler content increases to 9.2% and further falls to 1.05 for PP/21.1GP, as also evident from the extrudate profiles in subplot c. As explained above, the rigid fillers inhibit the elastic recovery of the deformed polymer molecules, thus decreasing the swelling behavior.
Similar trends are observed for the simulated swell behavior in Figure 7a (lines), as the filler content increases from zero to a medium value of 9.2%. However, a further simulated increase of the filler content to 21.1% results in a larger increase of the swell ratio B1, which is in contrast with the experimental results (green symbols in Figure 6a). This eventually leads to a significantly overpredicted final B1 for PP/21.1GP. Note that this mismatch cannot be attributed to a somewhat larger flow rate (620 mm3 s−1) compared to the experiment (504.6 mm3 s−1), based on another simulation case with exactly the same flow rate of 504.6 mm3 s−1 (not shown) Therefore, the PTT model appears to be unable to reproduce the swelling behavior of polymer composites with high volumetric contents, which is consistent with the earlier conclusion that the material functions cannot fully take into account the rheological changes caused by adding graphite fillers. As explained above, the reason might be the failure of the constitutive PTT model in addressing the deconstructions of the network constructed by filler and matrix. On the other hand, a high filler content might facilitate the occurring of slippage, resulting in a decreasing swell ratio [49], which is not accounted for in this study, as slip effects are beyond the scope of the current modeling work.
Figure 7b compares the swelling ratio of the extrudate height at the edge along the flow distance direction. As reported before in our previous work [35,36], a contraction flow behavior is noted also upon adding filler into the matrix. Increasing the filler content contributes to a smaller swell ratio B2 thus a larger contraction flow behavior. Upon comparing B2 experimental and modeling results it follows that the deviation between the predictions by the PTT model and experimental measurements is now for both low and high filler contents very small. Hence, the PTT model is sufficiently reliable for understanding edge-height differences. The PP/21.1GP results can thus be interpreted and a closer inspection reveals that they are non-trivial, with a crossing of the lines with lower filler content in Figure 6b.
This thus opens the potential for a large reliability of the simulation of the middle height swelling, as only accessible via the 3D modeling strategy considered in the present work. This is illustrated in Figure 8a presenting B3 data for the neat case and PP with three filler contents. It follows that the middle height swelling is far from trivial as the 4 simulation lines are characterized by a different shape. Specifically, a small increase in the filler content to 4.3% ultimately causes a decrease in B3. However, further increasing the filler content leads to an increase in B3 both for PP/9.2GP and PP/21.1GP. Furthermore, Figure 8b compares the simulated evolution profiles of the area swelling behavior (B4). Due to the general decrease of the swelling behavior in the height and width direction, B4 decreases upon adding filler. However, upon increasing the filler content from 9.2% to 21.1% a larger simulated B4 results, which could be an overprediction reminding the incorrectness of the B1 variation for the highest filler amount. Nevertheless, in the window of lower to intermediate filler contents, a variation in B4 can be put forward. This is different compared to the results in our previous work for neat PP [50], in which the area swell behavior is not affected so much if the upstream irregular contraction flow region is included since there is an opposite swelling behavior in the middle height and width direction. This difference in B4 thus indicates more options for adjusting and controlling the extrudate swell behavior for polymer melts with fillers.
Finally, Figure 9 displays the simulated extrudate profile for each polymer melt at a flow rate of 620 mm3/s and a flow distance of 40 mm downstream of the die exit. It follows that the width swell ratio decreases upon considering more filler, although there is a deviation for the (simplified) case with the higher filler content. A closer inspection also reveals a less sharp corner region with more filler content, which even disappears for the (simplified) case with the highest filler content. Interestingly, this disappearance of sharp edges with further addition of fillers has also been claimed by Spanjaards et al. [51]. It can thus be further postulated that the filler content is an important parameter in product stability.

5. Conclusions

It is found that the original PTT model has an excellent ability to predict G′ and loss G″ modulus for neat/virgin PP and all PP composites at a given temperature (200 °C). However, with sufficiently high filler content, an overprediction of the shear viscosity η s and the first normal stress difference N1 results. In any case, the PTT model delivers at least the correct order of magnitude. The PTT deviation at higher filler contents is likely related to the deconstruction of the interaction between filler-filler and filler-matrix once there is a large strain in the non-linear viscoelastic region applied to the polymer chains. The strong alternation of such interactions for higher filler contents is less captured by the inherent build-up of the PTT model combined with basic functions.
Interestingly, the adapted PTT model is useful to simulate the 3D swelling from slit dies up to intermediate filler contents at the same temperature. Here, focus has been on the predicted swelling of PP/graphite composites in the height at the edge and middle, and the width direction of the extrudate. It is found that with more filler, the extrudate swell behavior decreases in all dimensional directions, and by adding filler, a larger window of swelling areas is within achieved. Furthermore, even for the very high filler content, there is added value, although care should be taken upon interpreting swelling data involving die width variations. In this regard, future work should be devoted to investigating the no-slip boundary condition. Also tuning in a broader operating window is recommended, including temperature variations.
The current work further highlights the relevance of 3D simulations for extrudate swell predictions and demonstrates that composite materials have different stability regimes compared to virgin materials. Depending on the filler type, one can at the same time optimize specific macroscopic properties, such as strength and thermal conductivity, and design composite materials suitable for mechanical recycling.

Author Contributions

Conceptualization, M.E., L.C. and D.R.D.; methodology, M.E., D.T. and F.H.M.; software, M.E., F.H.M., T.V.W. and D.R.D.; resources, L.C. and D.R.D.; writing—original draft preparation, M.E. and D.T.; writing—review and editing, M.E., D.T., F.H.M., T.V.W., L.C. and D.R.D.; supervision, M.E., L.C. and D.R.D.; funding acquisition, L.C. and D.R.D. All authors have read and agreed to the published version of the manuscript.

Funding

D.T. appreciates funding from the China Scholarship Council (Grant No. 201606240114) for the Ph.D. study at Ghent University. D.R.D. and L.C. acknowledge financial support from the Vlaio ICON project Green Additive Manufacturing.

Institutional Review Board Statement

Not applicable.

Informed Consent Statement

Not applicable.

Data Availability Statement

Raw data are available upon reasonable request.

Acknowledgments

The authors thank Zhongguo Zhao from the College of Polymer Science and Engineering, Sichuan University, China, for assistance with the rheological measurements.

Conflicts of Interest

The authors declare no conflict of interest.

References

  1. Wieme, T.; Tang, D.; Delva, L.; D’hooge, D.R.; Cardon, L. The relevance of material and processing parameters on the thermal conductivity of thermoplastic composites. Polym. Eng. Sci. 2018, 58, 466–474. [Google Scholar] [CrossRef] [Green Version]
  2. Velayudhan, S.; Ramesh, P.; Sunny, M.; Varma, H. Extrusion of hydroxyapatite to clinically significant shapes. Mater. Lett. 2000, 46, 142–146. [Google Scholar] [CrossRef]
  3. Miller, E.; Rothstein, J.P. Control of the sharkskin instability in the extrusion of polymer melts using induced temperature gradients. Rheol. Acta 2004, 44, 160–173. [Google Scholar] [CrossRef]
  4. Ebrahimi, M.; Tomkovic, T.; Liu, G.; Doufas, A.A.; Hatzikiriakos, S.G. Melt fracture of linear low-density polyethylenes: Die geometry and molecular weight characteristics. Phys. Fluids 2018, 30, 053103. [Google Scholar] [CrossRef]
  5. Tian, H.; Zhao, D.; Wang, M.; Jin, G.; Jin, Y. Study on extrudate swell of polypropylene in double-lumen micro profile extrusion. J. Mater. Process. Technol. 2015, 225, 357–368. [Google Scholar] [CrossRef]
  6. De Keer, L.; Kilic, K.I.; Van Steenberge, P.H.; Daelemans, L.; Kodura, D.; Frisch, H.; De Clerck, K.; Reyniers, M.-F.; Barner-Kowollik, C.; Dauskardt, R.H. Computational prediction of the molecular configuration of three-dimensional network polymers. Nat. Mater. 2021, 20, 1422–1430. [Google Scholar] [CrossRef]
  7. Gilbert, M. Plastics materials: Introduction and historical development. In Brydson’s Plastics Materials; Elsevier: Amsterdam, The Netherlands, 2017; pp. 1–18. [Google Scholar]
  8. Teoh, S.; Tang, Z.; Hastings, G.W. Thermoplastic polymers in biomedical applications: Structures, properties and processing. In Handbook of Biomaterial Properties; Springer: Berlin/Heidelberg, Germany, 1998; pp. 270–301. [Google Scholar]
  9. Amangeldi, M.; Wei, D.; Perveen, A.; Zhang, D. Numerical Modeling of Thermal Flows in Entrance Channels for Polymer Extrusion: A Parametric Study. Processes 2020, 8, 1256. [Google Scholar] [CrossRef]
  10. Trucillo, P. Drug Carriers: Classification, Administration, Release Profiles, and Industrial Approach. Processes 2021, 9, 470. [Google Scholar] [CrossRef]
  11. T’Joen, C.; Park, Y.; Wang, Q.; Sommers, A.; Han, X.; Jacobi, A. A review on polymer heat exchangers for HVAC&R applications. Int. J. Refrig. 2009, 32, 763–779. [Google Scholar]
  12. Chen, X.; Su, Y.; Reay, D.; Riffat, S. Recent research developments in polymer heat exchangers—A review. Renew. Sustain. Energy Rev. 2016, 60, 1367–1386. [Google Scholar] [CrossRef]
  13. Luo, W.; Cheng, C.; Zhou, S.; Zou, H.; Liang, M. Thermal, electrical and rheological behavior of high-density polyethylene/graphite composites. Iran. Polym. J. 2015, 24, 573–581. [Google Scholar] [CrossRef]
  14. Tu, H.; Ye, L. Thermal conductive PS/graphite composites. Polym. Adv. Technol. 2009, 20, 21–27. [Google Scholar] [CrossRef]
  15. Muratov, D.; Kuznetsov, D.; Il’Inykh, I.; Mazov, I.; Stepashkin, A.; Tcherdyntsev, V. Thermal conductivity of polypropylene filled with inorganic particles. J. Alloys Compd. 2014, 586, S451–S454. [Google Scholar] [CrossRef]
  16. Zhou, W.; Qi, S.; Li, H.; Shao, S. Study on insulating thermal conductive BN/HDPE composites. Thermochim. Acta 2007, 452, 36–42. [Google Scholar] [CrossRef]
  17. Ma, A.; Wu, Y.; Chen, W.; Wu, X. Preparation and properties of multi-walled carbon nanotubes/carbon fiber/epoxy composites. Polym. Compos. 2014, 35, 2150–2153. [Google Scholar] [CrossRef]
  18. Fiorio, R.; Villanueva Díez, S.; Sánchez, A.; D’hooge, D.R.; Cardon, L. Influence of different stabilization systems and multiple ultraviolet A (UVA) aging/recycling steps on physicochemical, mechanical, colorimetric, and thermal-oxidative properties of ABS. Materials 2020, 13, 212. [Google Scholar] [CrossRef] [PubMed] [Green Version]
  19. Vollmer, I.; Jenks, M.J.; Roelands, M.C.; White, R.J.; van Harmelen, T.; de Wild, P.; van Der Laan, G.P.; Meirer, F.; Keurentjes, J.T.; Weckhuysen, B.M. Beyond mechanical recycling: Giving new life to plastic waste. Angew. Chem. Int. Ed. 2020, 59, 15402–15423. [Google Scholar] [CrossRef] [PubMed] [Green Version]
  20. Sunaga, Y.; Ogoe, S.; Aoki, K.; Ito, H.; Teramoto, Y. Profitable mass-production of acid-modified recovered resins for value-added mechanical recycling as a compatibilizer for composites. ACS Sustain. Chem. Eng. 2018, 6, 12110–12118. [Google Scholar] [CrossRef]
  21. Ferreira, C.T.; Perez, C.A.; Hirayama, D.; Saron, C. Recycling of polyamide (PA) from scrap tires as composites and blends. J. Environ. Chem. Eng. 2013, 1, 762–767. [Google Scholar] [CrossRef]
  22. Nimmegeers, P.; Parchomenko, A.; De Meulenaere, P.; D’hooge, D.R.; Van Steenberge, P.H.; Rechberger, H.; Billen, P. Extending multilevel statistical entropy analysis towards plastic recyclability prediction. Sustainability 2021, 13, 3553. [Google Scholar] [CrossRef]
  23. Liang, J.; Chen, C.; Zhou, T.; Zou, S.; Huang, W.; Tsui, C.; Tang, C.; Mišković-Stanković, V. Melt extrudate swell behavior of multi-walled carbon nanotubes filled-polypropylene composites. Polym. Compos. 2015, 38, 2433–2439. [Google Scholar] [CrossRef]
  24. Liang, J.-Z. Effects of particle size on melt viscoelastic properties during capillary extrusion of glass bead-filled LDPE composites. J. Thermoplast. Compos. Mater. 2006, 19, 703–713. [Google Scholar] [CrossRef]
  25. Liang, J.-Z.; Yang, J.; Tang, C.-Y. Die-swell behavior of PP/Al(OH)3/Mg(OH)2 flame retardant composite melts. Polym. Test. 2010, 29, 624–628. [Google Scholar] [CrossRef]
  26. Sentmanat, M.; Hatzikiriakos, S.G. Mechanism of gross melt fracture elimination in the extrusion of polyethylenes in the presence of boron nitride. Rheol. Acta 2004, 43, 624–633. [Google Scholar] [CrossRef]
  27. Allal, A.; Vergnes, B. Molecular design to eliminate sharkskin defect for linear polymers. J. Non-Newton. Fluid Mech. 2007, 146, 45–50. [Google Scholar] [CrossRef]
  28. Allal, A.; Lavernhe, A.; Vergnes, B.; Marin, G. Relationships between molecular structure and sharkskin defect for linear polymers. J. Non-Newton. Fluid Mech. 2006, 134, 127–135. [Google Scholar] [CrossRef]
  29. Ariffin, A.; Ariff, Z.; Jikan, S. Evaluation on extrudate swell and melt fracture of polypropylene/kaolin composites at high shear stress. J. Reinf. Plast. Compos. 2011, 30, 609–619. [Google Scholar] [CrossRef]
  30. Liang, J.Z.; Feng, J.Q.; Tsui, C.P.; Tang, C.Y. Extrudate swell behavior of polypropylene composites filled with microencapsulated red phosphorus. J. Appl. Polym. Sci. 2013, 129, 3497–3501. [Google Scholar] [CrossRef]
  31. Dangtungee, R.; Supaphol, P. Melt rheology and extrudate swell of titanium (IV) oxide nanoparticle-filled isotactic polypropylene: Effects of content and surface characteristics. Polym. Test. 2008, 27, 951–956. [Google Scholar] [CrossRef]
  32. Aral, B.K.; Kalyon, D.M. Viscoelastic material functions of noncolloidal suspensions with spherical particles. J. Rheol. 1997, 41, 599–620. [Google Scholar] [CrossRef]
  33. Stabik, J. Influence of filler particle geometry on die swell. Int. Polym. Process. 2004, 19, 350–355. [Google Scholar] [CrossRef]
  34. Tang, D.; Marchesini, F.H.; Cardon, L.; D’hooge, D.R. Evaluating the exit pressure method for measurements of normal stress difference at high shear rates. J. Rheol. 2020, 64, 739–750. [Google Scholar] [CrossRef]
  35. Tang, D.; Marchesini, F.H.; D’hooge, D.R.; Cardon, L. Isothermal flow of neat polypropylene through a slit die and its die swell: Bridging experiments and 3D numerical simulations. J. Non-Newton. Fluid Mech. 2019, 266, 33–45. [Google Scholar] [CrossRef]
  36. Tang, D.; Marchesini, F.H.; Cardon, L.; D’hooge, D.R. Three-dimensional flow simulations for polymer extrudate swell out of slit dies from low to high aspect ratios. Phys. Fluids 2019, 31, 093103. [Google Scholar] [CrossRef]
  37. Kiriakidis, D.; Mitsoulis, E. Viscoelastic simulations of extrudate swell for an HDPE melt through slit and capillary dies. Adv. Polym. Technol. 1993, 12, 107–117. [Google Scholar] [CrossRef]
  38. Kádár, R.; Naue, I.F.; Wilhelm, M. First normal stress difference and in-situ spectral dynamics in a high sensitivity extrusion die for capillary rheometry via the ‘hole effect’. Polymer 2016, 104, 193–203. [Google Scholar] [CrossRef]
  39. Macosko, C.W.; Larson, R.G. Rheology: Principles, Measurements, and Applications; Wiley: New York, NY, USA, 1994; pp. 1–550. [Google Scholar]
  40. Meissner, J.; Garbella, R.; Hostettler, J. Measuring normal stress differences in polymer melt shear flow. J. Rheol. 1989, 33, 843–864. [Google Scholar] [CrossRef]
  41. Mitsoulis, E.; Luger, H.-J.; Miethlinger, J.; Friesenbichler, W. Flow Behavior of a Polypropylene Melt in Capillary Dies. Int. Polym. Process. 2018, 33, 642–651. [Google Scholar] [CrossRef]
  42. Konaganti, V.; Behzadfar, E.; Ansari, M.; Mitsoulis, E.; Hatzikiriakos, S. Extrudate swell of high density polyethylenes in slit (flat) dies. Int. Polym. Process. 2016, 31, 262–272. [Google Scholar] [CrossRef]
  43. Barnes, H.A. A review of the rheology of filled viscoelastic systems. Rheol. Rev. 2003, 1–36. [Google Scholar]
  44. Ohl, N.; Gleissle, W. The second normal stress difference for pure and highly filled viscoelastic fluids. Rheol. Acta 1992, 31, 294–305. [Google Scholar] [CrossRef]
  45. Prashantha, K.; Soulestin, J.; Lacrampe, M.; Krawczak, P.; Dupin, G.; Claes, M. Masterbatch-based multi-walled carbon nanotube filled polypropylene nanocomposites: Assessment of rheological and mechanical properties. Compos. Sci. Technol. 2009, 69, 1756–1763. [Google Scholar] [CrossRef]
  46. Hristov, V.; Takacs, E.; Vlachopoulos, J. Surface tearing and wall slip phenomena in extrusion of highly filled HDPE/wood flour composites. Polym. Eng. Sci. 2006, 46, 1204–1214. [Google Scholar] [CrossRef]
  47. Konaganti, V.K.; Ansari, M.; Mitsoulis, E.; Hatzikiriakos, S.G. Extrudate swell of a high-density polyethylene melt: II. Modeling using integral and differential constitutive equations. J. Non-Newton. Fluid Mech. 2015, 225, 94–105. [Google Scholar] [CrossRef]
  48. Normandin, M.; Clermont, J.-R.; Guillet, J.; Raveyre, C. Three-dimensional extrudate swell experimental and numerical study of a polyethylene melt obeying a memory-integral equation. J. Non-Newton. Fluid Mech. 1999, 87, 1–25. [Google Scholar] [CrossRef]
  49. Yang, C.; Li, Z. A study of wall slip in the capillary flow of a filled rubber compound. Polym. Test. 2014, 37, 45–50. [Google Scholar] [CrossRef]
  50. Tang, D.; Marchesini, F.H.; Cardon, L.; D’hooge, R.D. The impact of upstream contraction flow on three-dimensional polymer extrudate swell from slit dies. J. Non-Newton. Fluid Mech. 2020, 282, 104337. [Google Scholar] [CrossRef]
  51. Spanjaards, M.; Hulsen, M.; Anderson, P. Transient 3D finite element method for predicting extrudate swell of domains containing sharp edges. J. Non-Newton. Fluid Mech. 2019, 270, 79–95. [Google Scholar] [CrossRef]
Figure 1. Top: the cross section of a slit die, considering the case of an aspect ratio of 10. Four swell ratios are defined, as mathematically represented by Equations (1) and (2) They relate to swelling for the width direction, the edge height direction, the middle height direction, and the area swelling; Bottom left: 3D flow domain of a slit die profile for the isothermal (200 °C) flow simulations; one quarter of the geometry is considered; Bottom right: conceptual visualization of die swell; focus on one direction only.
Processes 09 01969 g001
Figure 2. Examples of meshes for 3D geometries with aspect ratios: (top left): 1:1; (bottom left) 2:1; (top right) 10:1; (bottom right) 20:1; In the present work top right.
Processes 09 01969 g002
Figure 3. Experimental rheological data including the storage modulus G′, the loss modulus G″, the shear viscosity η s and the first normal stress difference N1. (a) G′ and G″ for PP, (b) η s and N1 for PP, (c) G′ and G″ for PP PP composite; (d) η s and N1 for PP composite; composite with a graphite filler content of 4.3% (PP/4.3GP). The curves indicate rheological data via PTT model (parameters in Table 1, also including the elongational viscosity η e . For the PP/9.3GP composite, the N1 data at the high shear rate range are measured by means of the exit pressure method from Tang et al. [34].
Processes 09 01969 g003
Figure 4. Update of Figure 3 in case the filler content is 9.2 and 21.1%; (a) G′ and G″ for PP composite with a graphite filler content of 9.2% (PP/9.2GP); (b) η s and N1 for PP/9.2GP; (c) G′ and G″ for PP composite with a graphite filler content of 21.1% (PP/21.1GP); (d) η s and N1 for PP composite with a graphite filler content of 21.1% (PP/21.1GP).
Processes 09 01969 g004
Figure 5. A comparison of the (Newtonian) viscosity parameter η i (x) in each mode against the filler volumetric content x (4.3%, 9.2% and 21.1%). Lines fitting based on Equation (8) (PTT model parameters in Table 1) with x > 0. (a) mode 1; (b) mode 2; (c) mode 3; (d) mode 4.
Processes 09 01969 g005
Figure 6. The dependence of ε (a) and ξ (b) on the filler volumetric content x. The red lines are fitted based on the PTT model (Table 1). The associated equations are presented in each subplot.
Processes 09 01969 g006
Figure 7. Comparison between the evolution of the simulated (lines) and experimental (symbols) swelling data for PP melts with various filler content, distinguishing in between the width swelling ratio B1 (a) and the edge height swelling ratio B2 (b). Note that experimental measurements were carried out at different flows rates since the extrusion speed has been fixed at 60 rpm: 620 mm3/s for neat PP, 552.63 mm3/s for PP/4.3GP composite, 510 mm3/s for PP/9.2GP composite, and 504.6 mm3/s for PP/21.1GP composite. Simulations always at 620 mm3/s. In addition in subfigure (c), images of the extrudate profiles of PP/21.1GP and PP/9.2GP.
Processes 09 01969 g007
Figure 8. Comparison between the evolution of the simulated middle height swell ratio B3 (a) and area swell ratio B4 (b) for PP melt with various filler contents at a flow rate of 620 mm3 s−1.
Processes 09 01969 g008
Figure 9. Profiles of the extrudate at a flow rate of 620 mm3 s−1 of PP melt with various filler contents at the flow distance of 40 mm after the die exit: (a) neat PP, (b) PP/4.3GP, (c) PP/9.2GP, (d) PP/21.1GP. Black curves indicate the shape of the slit die while the green curves represent the equilibrated extrudate profiles (one fourth shown due to symmetry).
Processes 09 01969 g009
Table 1. Tuned material parameters for neat PP and PP composites with various graphite filler (GP) content; a based on Tang et al. [35].
PTT Model
Modeλi ηi εi ξi
Neat PP a1λ10.01η1536ε10.3ξ10.2
2λ20.1η2816ε20.3ξ20.2
3λ31η3707ε30.3ξ30.2
4λ410η4220ε40.3ξ40.2
PP/4.3GP1λ10.01η1670ε10.4ξ10.3
2λ20.1η21417ε20.4ξ20.3
3λ31η31590ε30.4ξ30.3
4λ410η4970ε40.4ξ40.3
PP/9.2GP1λ10.01η11620ε10.65ξ10.7
2λ20.1η24192ε20.65ξ20.7
3λ31η39183ε30.65ξ30.7
4λ410η418,818ε40.65ξ40.7
PP/21.1GP1λ10.01η13766ε10.9ξ10.95
2λ20.1η212,232ε20.9ξ20.95
3λ31η358,956ε30.9ξ30.95
4λ410η4292,851ε40.9ξ40.95
Table 2. The associated parameters for the equation of viscosity functions against the filler volumetric content x for each mode of PTT model; raw data in Figure 4.
(Pa s) K i   ( Pa   s ) α i
η 1 ( x ) 10 4.3 1.08
η 2 ( x ) 10 5 1.35
η 3 ( x ) 10 6.3 2.27
η 4 ( x ) 10 7.9 3.58
Publisher’s Note: MDPI stays neutral with regard to jurisdictional claims in published maps and institutional affiliations.

