Article

Particle Image Velocimetry Test for the Inter-Blade Vortex in a Francis Turbine

1
Key Laboratory of Fluid and Power Machinery, Ministry of Education, Xihua University, Chengdu 610039, China
2
Tianjin Port and Channel Engineering Co., Ltd., Tianjin 300450, China
3
Research & Testing Center of Dongfang Electric Machinery, Deyang 618000, China
*
Authors to whom correspondence should be addressed.
Processes 2021, 9(11), 1968; https://doi.org/10.3390/pr9111968
Submission received: 4 October 2021 / Revised: 30 October 2021 / Accepted: 2 November 2021 / Published: 4 November 2021
(This article belongs to the Topic Sustainable Energy Technology)

Abstract

:
Hydropower units are usually operated in non-design conditions because of power grid requirements. In a partial-load condition, an inter-blade vortex phenomenon occurs between the runner blades of a Francis turbine, causing pressure pulsation and unit vibration, which hinder the safe and stable operation of power stations. However, the mechanism through which the inter-blade vortex generation occurs is not entirely clear. In this study, a specific model of the Francis turbine was used to investigate and visually observe the generation of the blade vortex in Francis turbines in both the initial inter-blade and vortex development zones. Particle image velocimetry was used for this purpose. In addition, we determined the variation law of the inter-blade vortex in the Francis turbine. We found that the size and strength of the inter-blade vortex depend on the unit speed of the turbine. The higher the unit speed is, the stronger the inter-blade vortex becomes. We concluded that the inter-blade vortex of such turbines originates from the pressure surface or secondary flow and stall of the blade at the inlet side of the runner at high unit speeds, and also from the backflow zone of the suction surface of the blade at low unit speeds.

1. Introduction

When the Francis turbine operates in partial-load conditions, a special vortex phenomenon will be induced between the two adjacent blades of the turbine’s runner, which is commonly referred to as the inter-blade vortex [1,2]. The spatiotemporal evolution of the vortex structure partially affects the safe and stable operation of the turbine [3,4].
Since the failure of turbines No. 11–14 at the Tabera Hydropower Station in Pakistan occurred due to inter-blade vortices, the inter-blade vortex phenomenon has attracted considerable attention among researchers [5]. At the same time, owing to the increase in the proportion of intermittent renewable energy in the power grid in recent years, the turbine operates more frequently in partial-load conditions to balance the power grid parameters. Consequently, the inter-blade vortex phenomenon has become a serious problem researchers face [6]. To study the time–frequency characteristics of the blade’s vortex and its influence on the hydraulic performance, the Swiss Federal Institute of Technology Lausanne (EPFL) demonstrated the full development of the inter-blade vortex in the runner based on the analysis of data from the pressure sensor. The EPFL thus showed that the amplitude of the pressure fluctuation on the blade’s suction surface was enhanced significantly [7]. Voith Hydroelectric in Germany and General Electric in France also confirmed experimentally that the development of the inter-blade vortex imposes an enhancement effect on the amplitude of the pressure fluctuation on the suction surface of the runner blade [8,9]. The numerical study of Xiao et al. [10,11] showed that the frequency of pressure pulsation induced by the inter-blade vortex was 0.2–3.0 times higher than that induced by rotational frequencies. Zuo et al. [12] inferred, based on a numerical study, that the pressure pulsation frequency at the initial condition of the inter-blade vortex was 0.84 times higher than that of the rotational frequency. The authors also inferred that the pressure pulsation frequency at the development condition was the same as that at the rotational frequency. Furthermore, researchers have found that the water head had a great influence on the development of the inter-blade vortex [13], and the pulsation frequency of the cavity volume characterizing the inter-blade vortex was close to that of the runner [14]. Regarding the causes and mechanism of the inter-blade vortex, it was agreed that the stall at the inlet edge of the turbine runner blade is an important reason for generating the inter-blade vortex [1]. However, different views have been proposed by other researchers. Yamamoto et al. [15] inferred, based on the numerical calculation of two-phase flow, that the velocity distribution near the runner crown was extremely uneven and the high-vorticity region caused by the interaction between the high-speed region and the separation region was the cause of the inter-blade vortex. Based on experimental observations and calculations, Zhou et al. [16] argued that the backflow of the draft tube at partial loads was the reason for the generation of the inter-blade vortex. Based on high-speed photography technology, Liu et al. [3] claimed that the main reason for the generation of the inter-blade vortex was the influence of the large impact angle at the blade’s inlet. Li et al. [1] argued that the reason for the generation of the inter-blade vortex was the fact that the flow had a rotational velocity component around the mainstream direction in the blade’s passage.
Given that the generation mechanism of the vortex of the blade’s passage is not clear, the visualization of the inter-blade vortex is of great significance. Particle image velocimetry (PIV) is a visualization method used extensively in hydraulic machinery and in the internal flow field tests of this type of machinery. Yamamoto [7,15,17] et al. applied visualization technology to the case study of the development of the inter-blade vortex in the off-design conditions of the Francis turbine. The experimental results showed that the introduced visualization method successfully captured the inter-blade vortex, thus confirming that the cavitation vortex between the blades is attached to the hub and then forms a trailing edge. Hence, further research can accurately measure its mechanism and dynamic characteristics. Liu et al. [18] photographed the vortex morphology in the vaneless space of the pump turbine by using PIV technology. The authors proved that PIV technology made photographing the internal vortex of hydraulic machinery feasible. Sagmo et al. [19] obtained the periodic variation of the wake of the guide vane of a Francis turbine through the PIV test.
Based on the above research, this study used the PIV test method to test the flow pattern of the Francis turbine inside the runner and analyzed the streamline diagrams of the initial and development conditions of the inter-blade vortex. It also examined the flow pattern of the Francis turbine inter-blade vortex, flow characteristics, and effects.

2. Materials and Methods

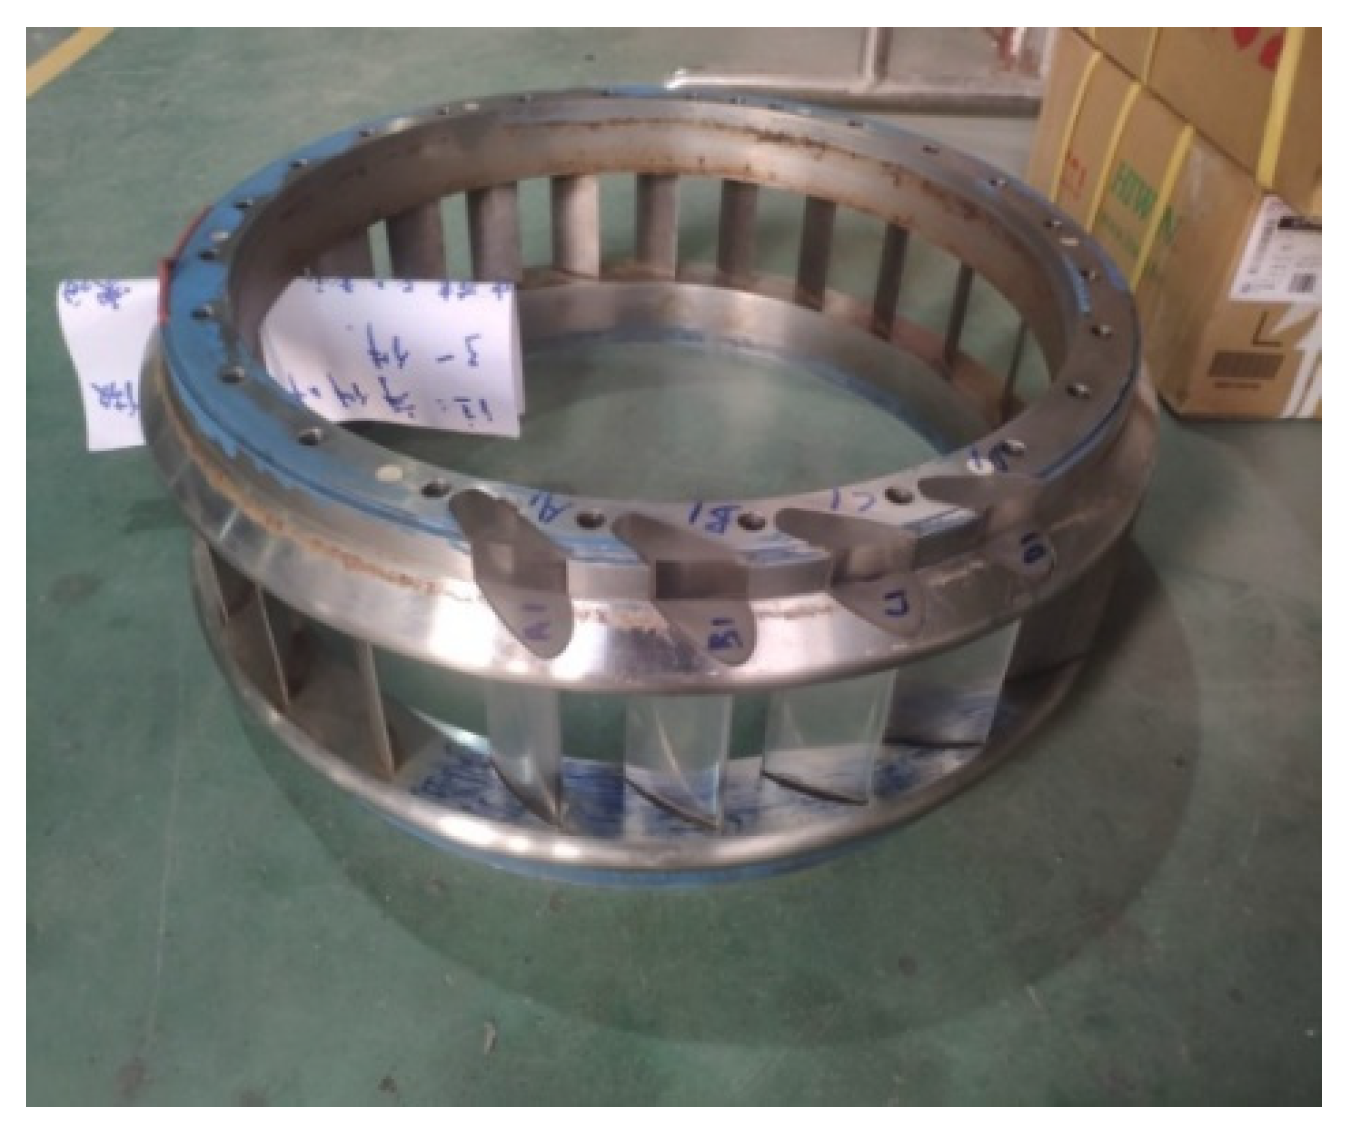
2.1. PIV System and Model Turbine Parameters

The main technical indicators of the PIV test system are listed in Table 1, while the basic parameters of the model pump turbine are listed in Table 2.

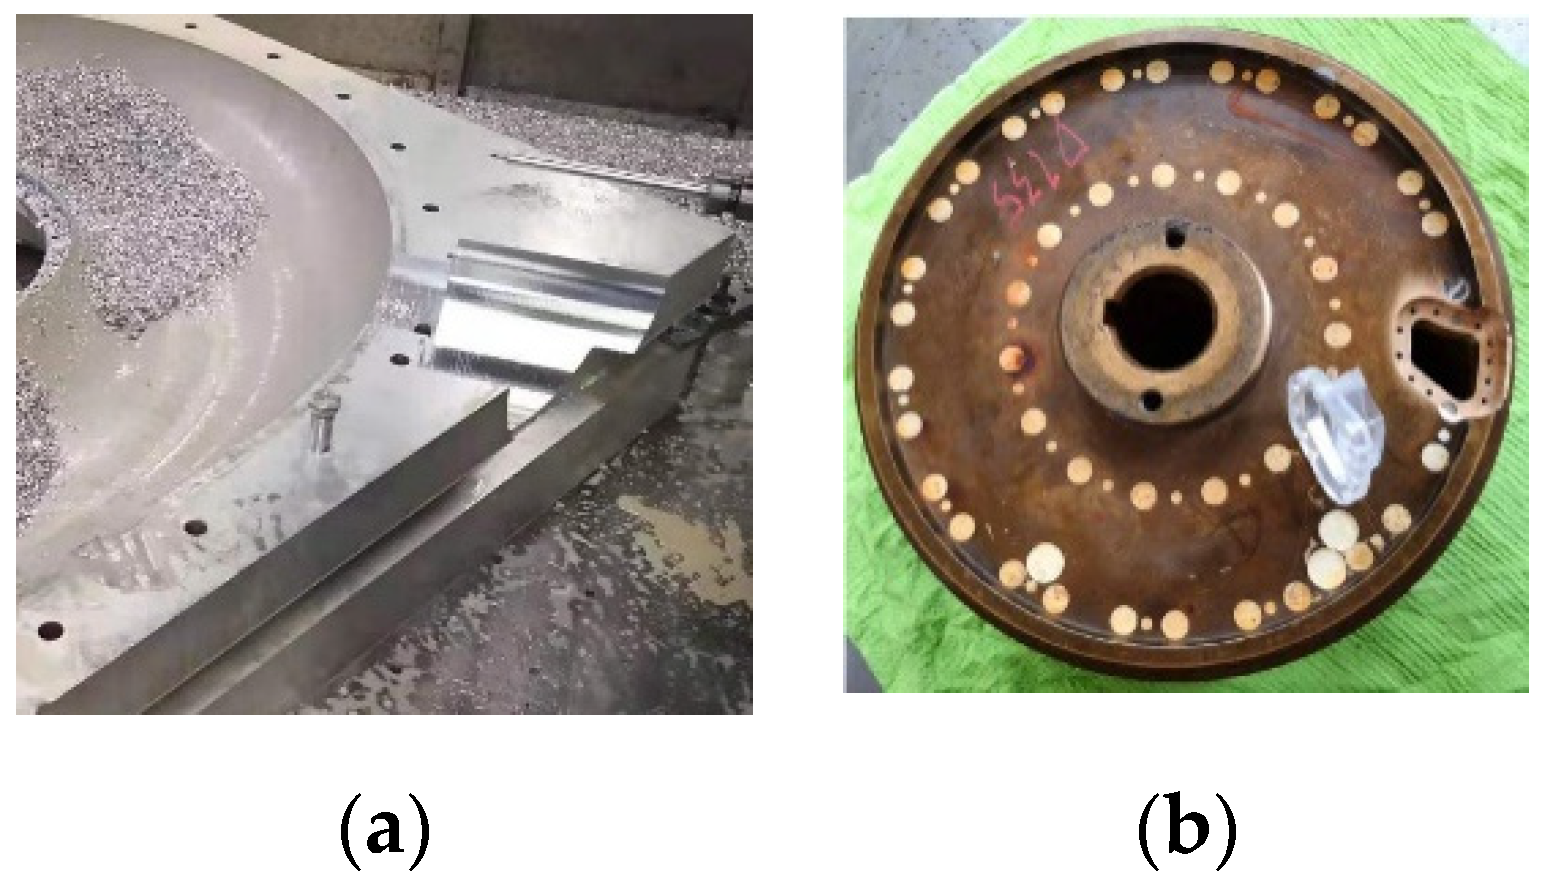
2.2. PIV Test System Transparency Solution

To realize the shooting of the flow state in the runner of the Francis turbine, the volute of the model turbine and the top cover of the runner were opened to set up a transparent window. According to the onsite conditions of the test bench, a circular observation window with a size of R = 200 mm was opened at a suitable position on the side of the volute, which is suitable for the closed window of acrylic material, as shown in Figure 1. At the same time, to facilitate laser injection from the volute into the runner, the four fixed guide vanes and four movable guide vanes, which corresponded to the position of the circular observation window of the volute, were processed in transparent acrylic materials, as shown in Figure 2. Based on the aforementioned special treatment, the light beam radially emitted by the laser passed through the volute and the guide vanes, and it smoothly entered the runner blade channel. The laser’s light path is shown in Figure 3. To clearly observe the inner flow channel of the runner irradiated by the laser, the axial observation was adopted in this experiment. In other words, a shuttle-shaped window was opened on the upper crown and top cover of the runner.

2.3. Selection of Tracer Particles

The results of many PIV experiments with different tracer particles showed that the sizes and densities of the silica material tracer particles were too large. The particles of titanium dioxide material can meet the PIV test requirements, but the agglomeration of some particles make them unable to meet the PIV test requirements. The density of sphere glass is the same as that of water (1.0081 kg/m3), and it can meet the test requirements. Hence, the particles of sphere glass were used as the tracer particles in this experiment.

3. Test Bench Layout
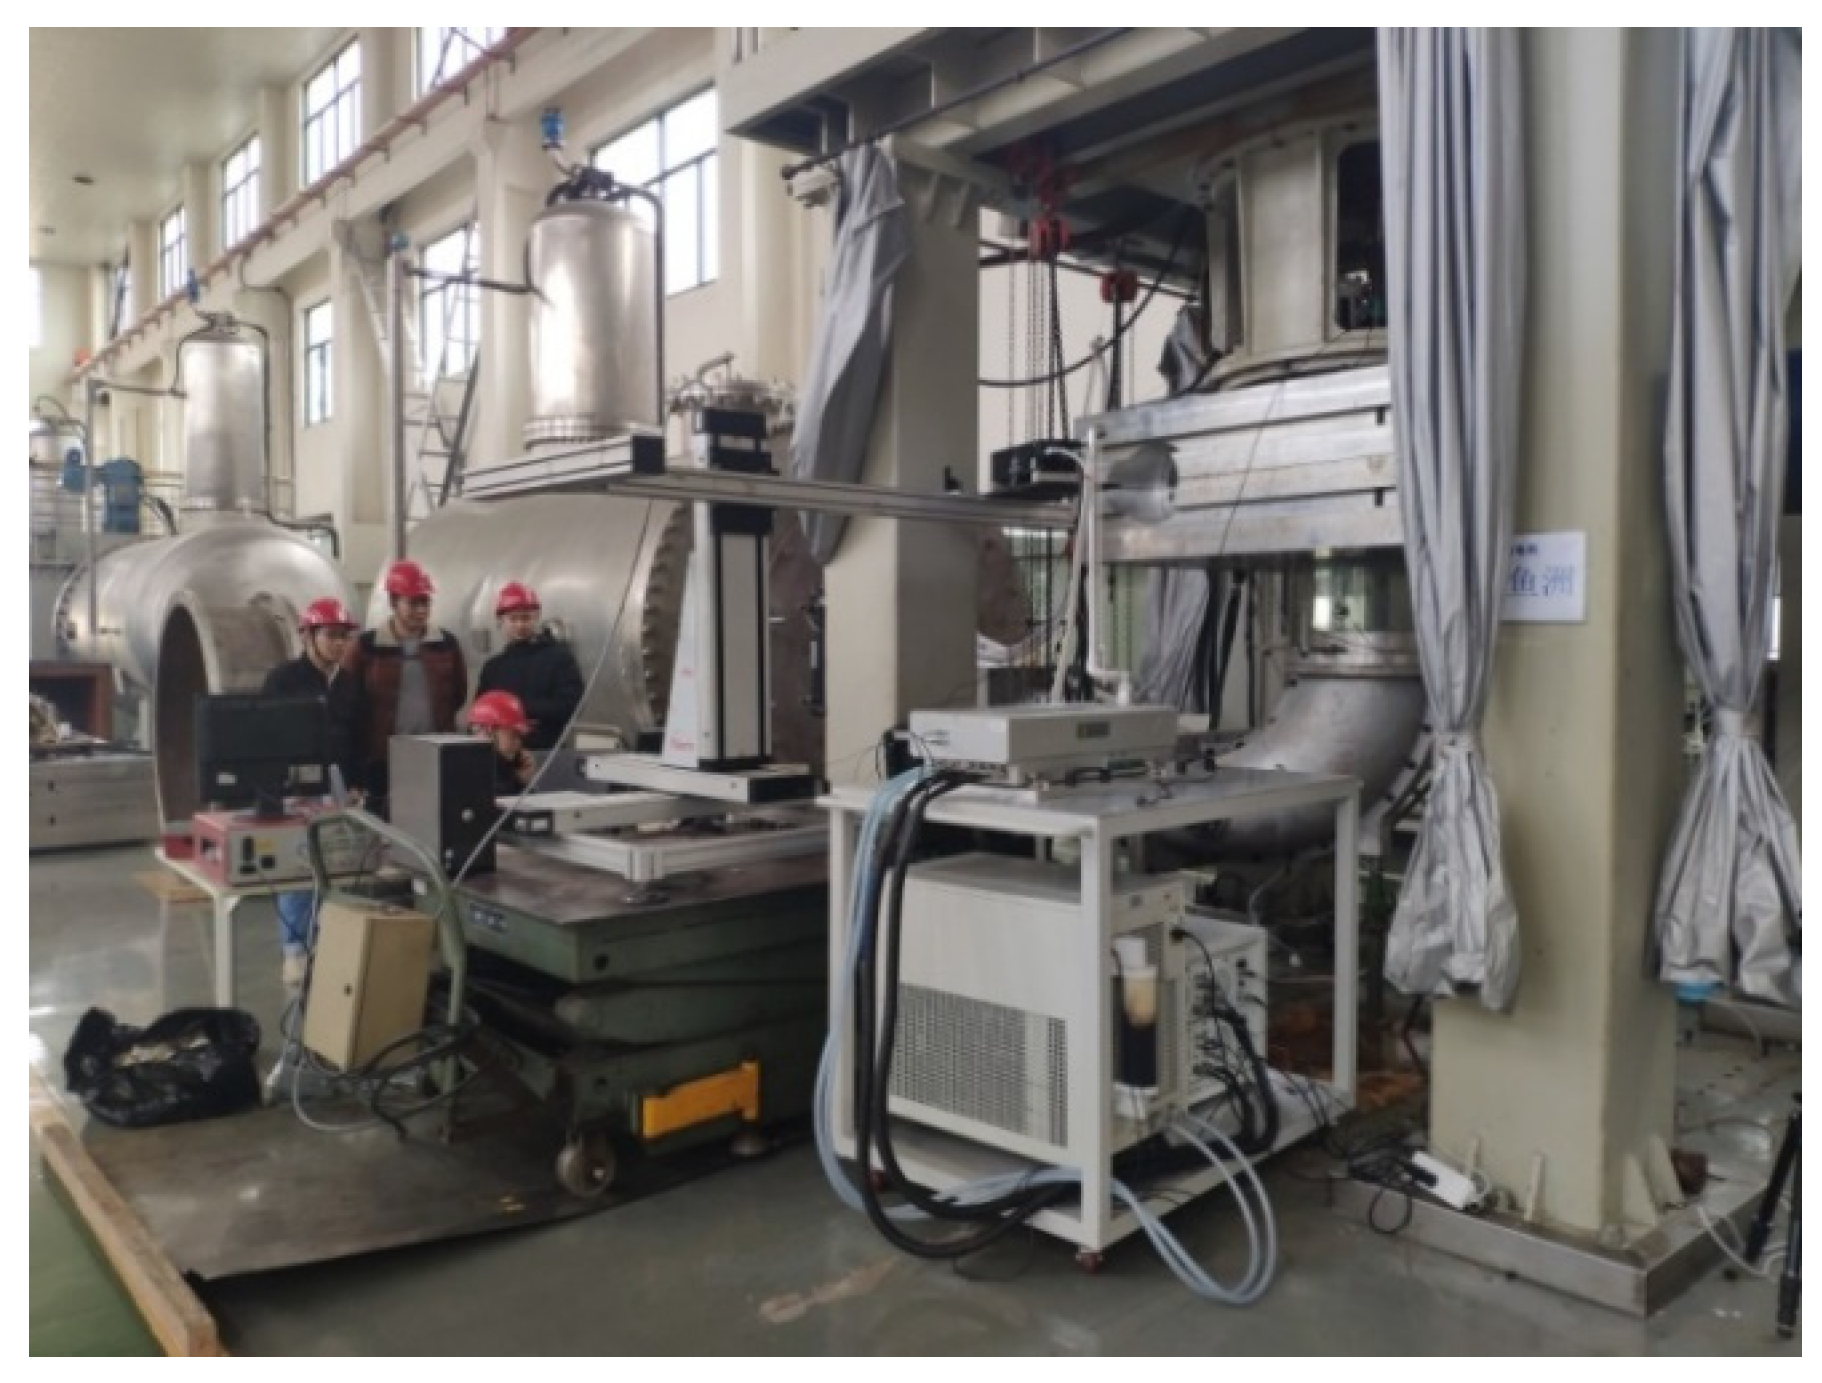
3.1. Site Layout

The general test bench of the DF-150 hydraulic machinery was used. Based on the test site and the test conditions used by the PIV, a platform and support were built on the hydraulic turbine test bench to fix the PIV system’s lasers, the group of lenses of the sheet light source, and other test equipment. The generated laser beam radially passed through the volute window, fixed guide vane, and movable guide vane of the water turbine through the scattering effect of the group of lenses from the sheet light source. The laser beam was incident in the channel of the runner blade. A charge-coupled device (CCD) camera (perpendicular to the direction of the light source) was installed above the observation window on the top cover of the turbine to fully capture the test conditions of the measured area. The CCD camera was connected to the camera bracket, and the camera bracket was installed on the stationary housing of the model unit. We chose to install a thin piece of steel at a suitable position on the turbine’s shaft. We installed the rotating flow field pulse trigger probe (photoelectric sensor) at the same level and at a specific distance from the shaft. The steel piece rotated with the shaft. When the opening of the upper crown of the runner was consistent with the opening of the top cover, the sheet rotated to the position of the rotating flow field pulse trigger probe. The trigger synchronizer and camera work at the same time to achieve synchronization. The trigger device and the test site are shown in Figure 4 and Figure 5, respectively.

3.2. Experimental Procedure

(1)
First, turn on the main power supply and operate the turbine’s test bench to fill the water tank with water. Before preparing for the test, check the accuracy of the measurement and control system of the test bench, and assess whether the parameter settings of the equipment of the PIV test system meet the requirements. Start the experiment when everything is ready.
(2)
Use an appropriate amount of tracer particles. This experiment made use of hollow glass beads. First, estimate how many tracer particles ought to be used, and then observe the test effect in the flow field area. If the test effect is not good, continue to use half of the previous tracer particles until the measurement effect of the flow field area meets the test requirements.
(3)
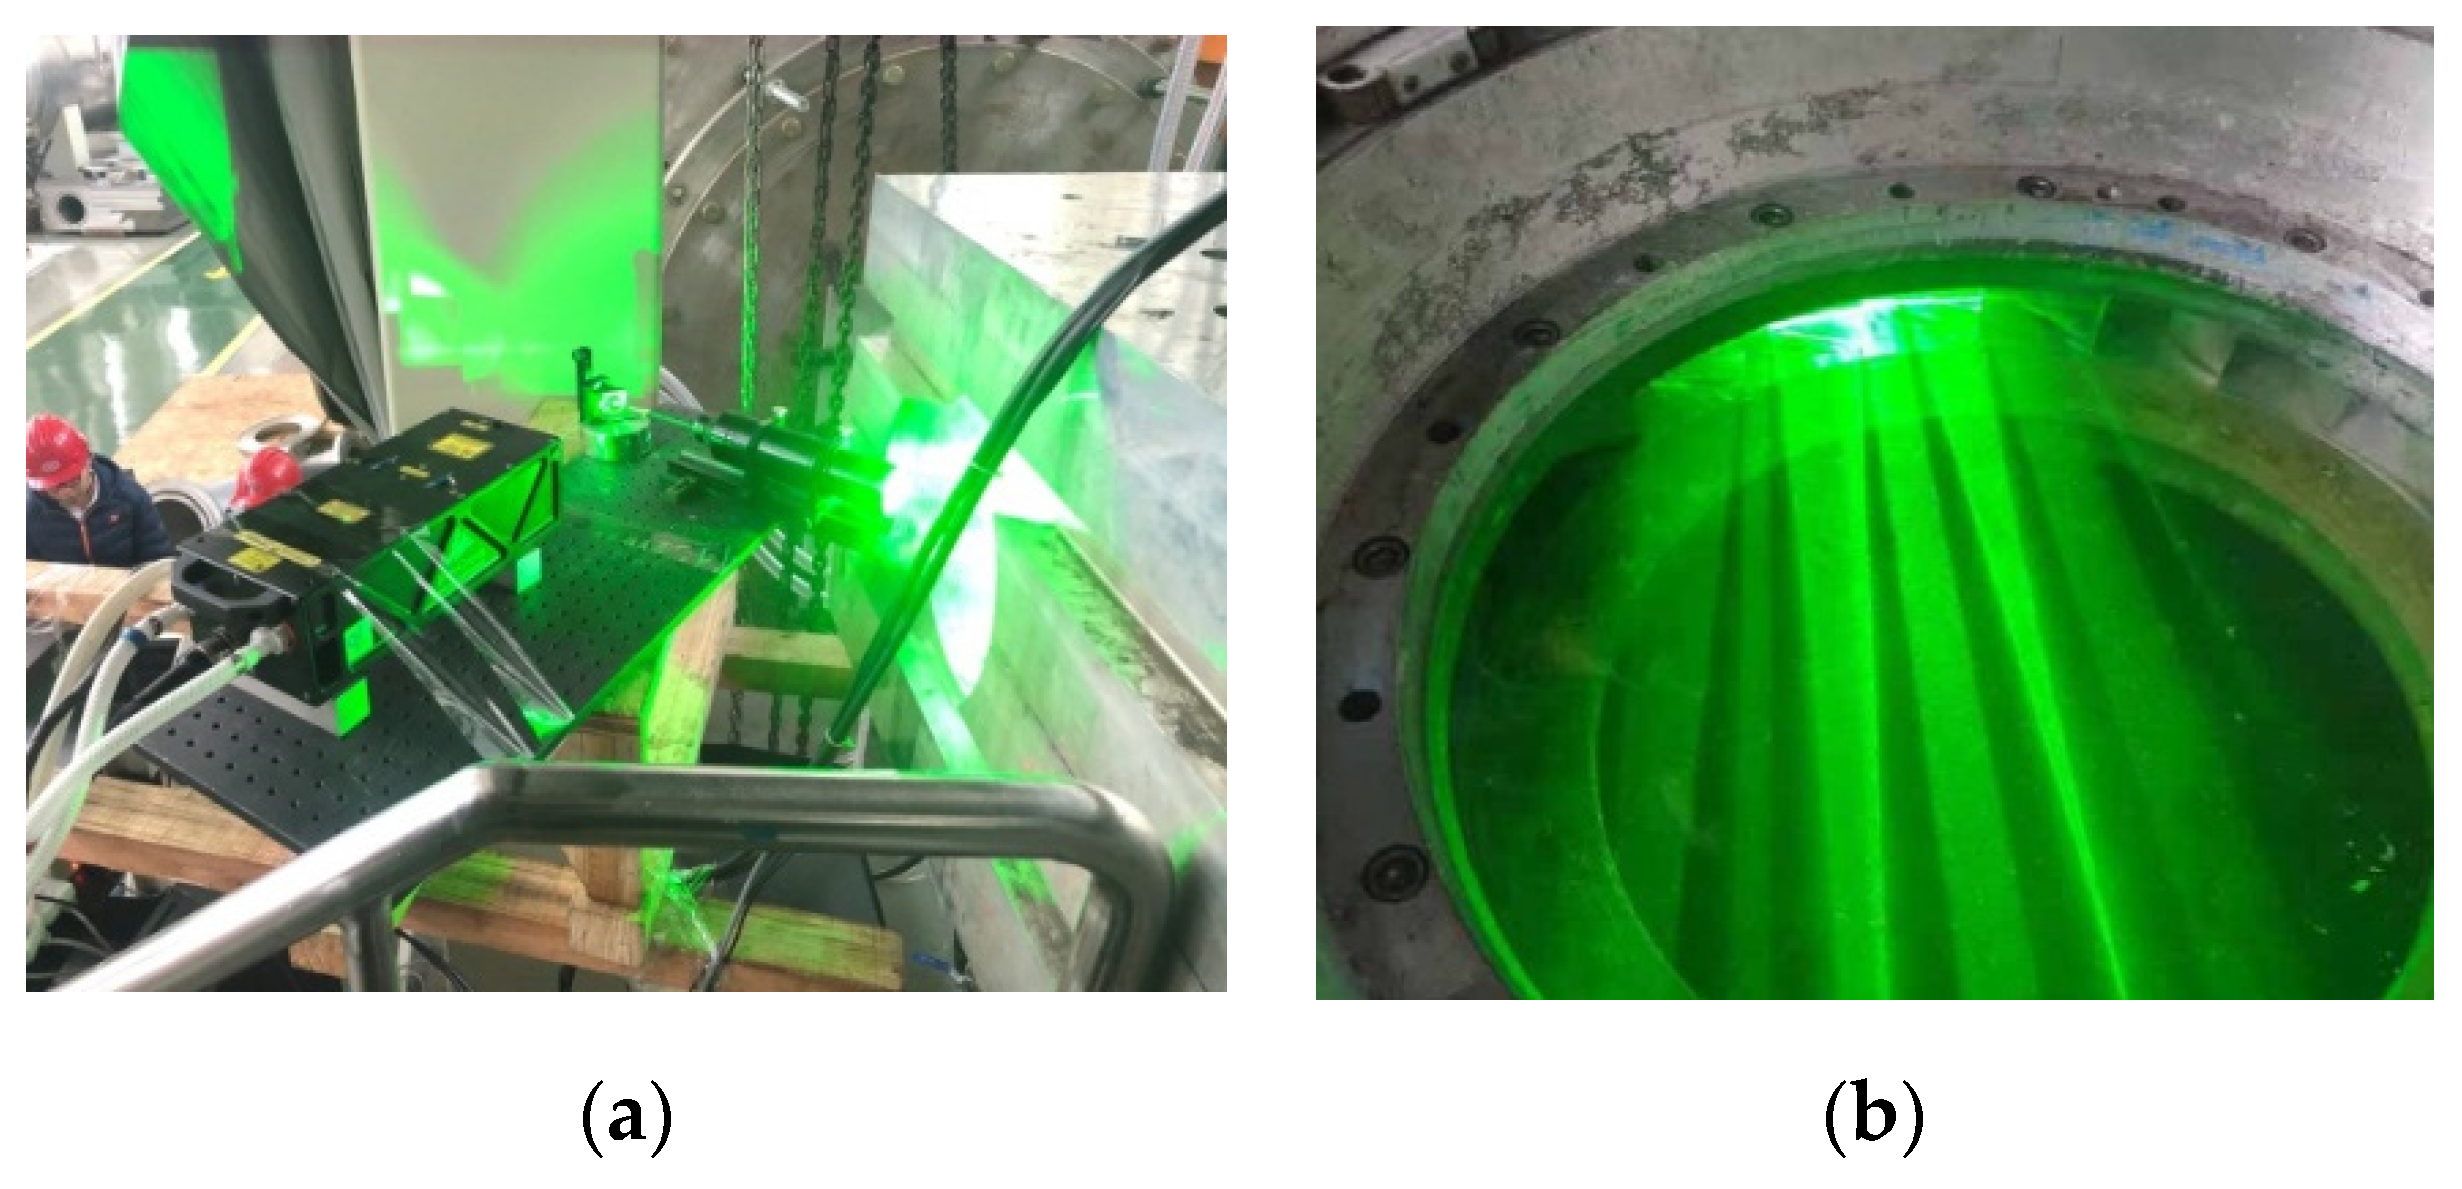
Remove the CCD camera lens cover and then turn on the laser. Adjust the incident angle and height of the lens group of the light source to ensure that the laser hits 50% of the height of the runner blade. Due to the runner being curved in a downward direction, the laser cannot hit the position of the lower ring of the runner. Adjust the CCD. The focal length of the camera ensures that a clear image of the runner is presented in the computer.
(4)
Next, turn on the turbine through the measurement and control system of the hydraulic test bench, adjust the opening of the guide vane, and ensure that the unit speed meets the test requirements. Adjust the guide vane opening (GVO) or unit speed according to the comprehensive characteristic curve to change the operating point and test the required operating point in turn. Each time the operating point is adjusted, the operating conditions must be stabilized before the next PIV test can be performed.
(5)
After testing all the working conditions, install the lens cover on the CCD camera lens. Save the original image acquired by the CCD camera in the computer, and turn off the main power supply.

4. Test Results and Analysis

4.1. Operating Point Selection

A total of nine operating points were selected for testing. The test operating points are shown in Table 3 and Figure 6. The unit flow rate and unit speed are defined as follows:
n 11 = n D H
Q 11 = Q D 2 H
where n11 is the unit speed (rev/min), Q11 is the unit flow (L/s), n is the speed (rev/min), Q is the flow (m3/h), H is the working head (m), and D is the nominal diameter of the runner (m).
Four operating conditions were selected at the initial and developed conditions of the inter-blade vortex, and an optimal operating point was selected for comparison.

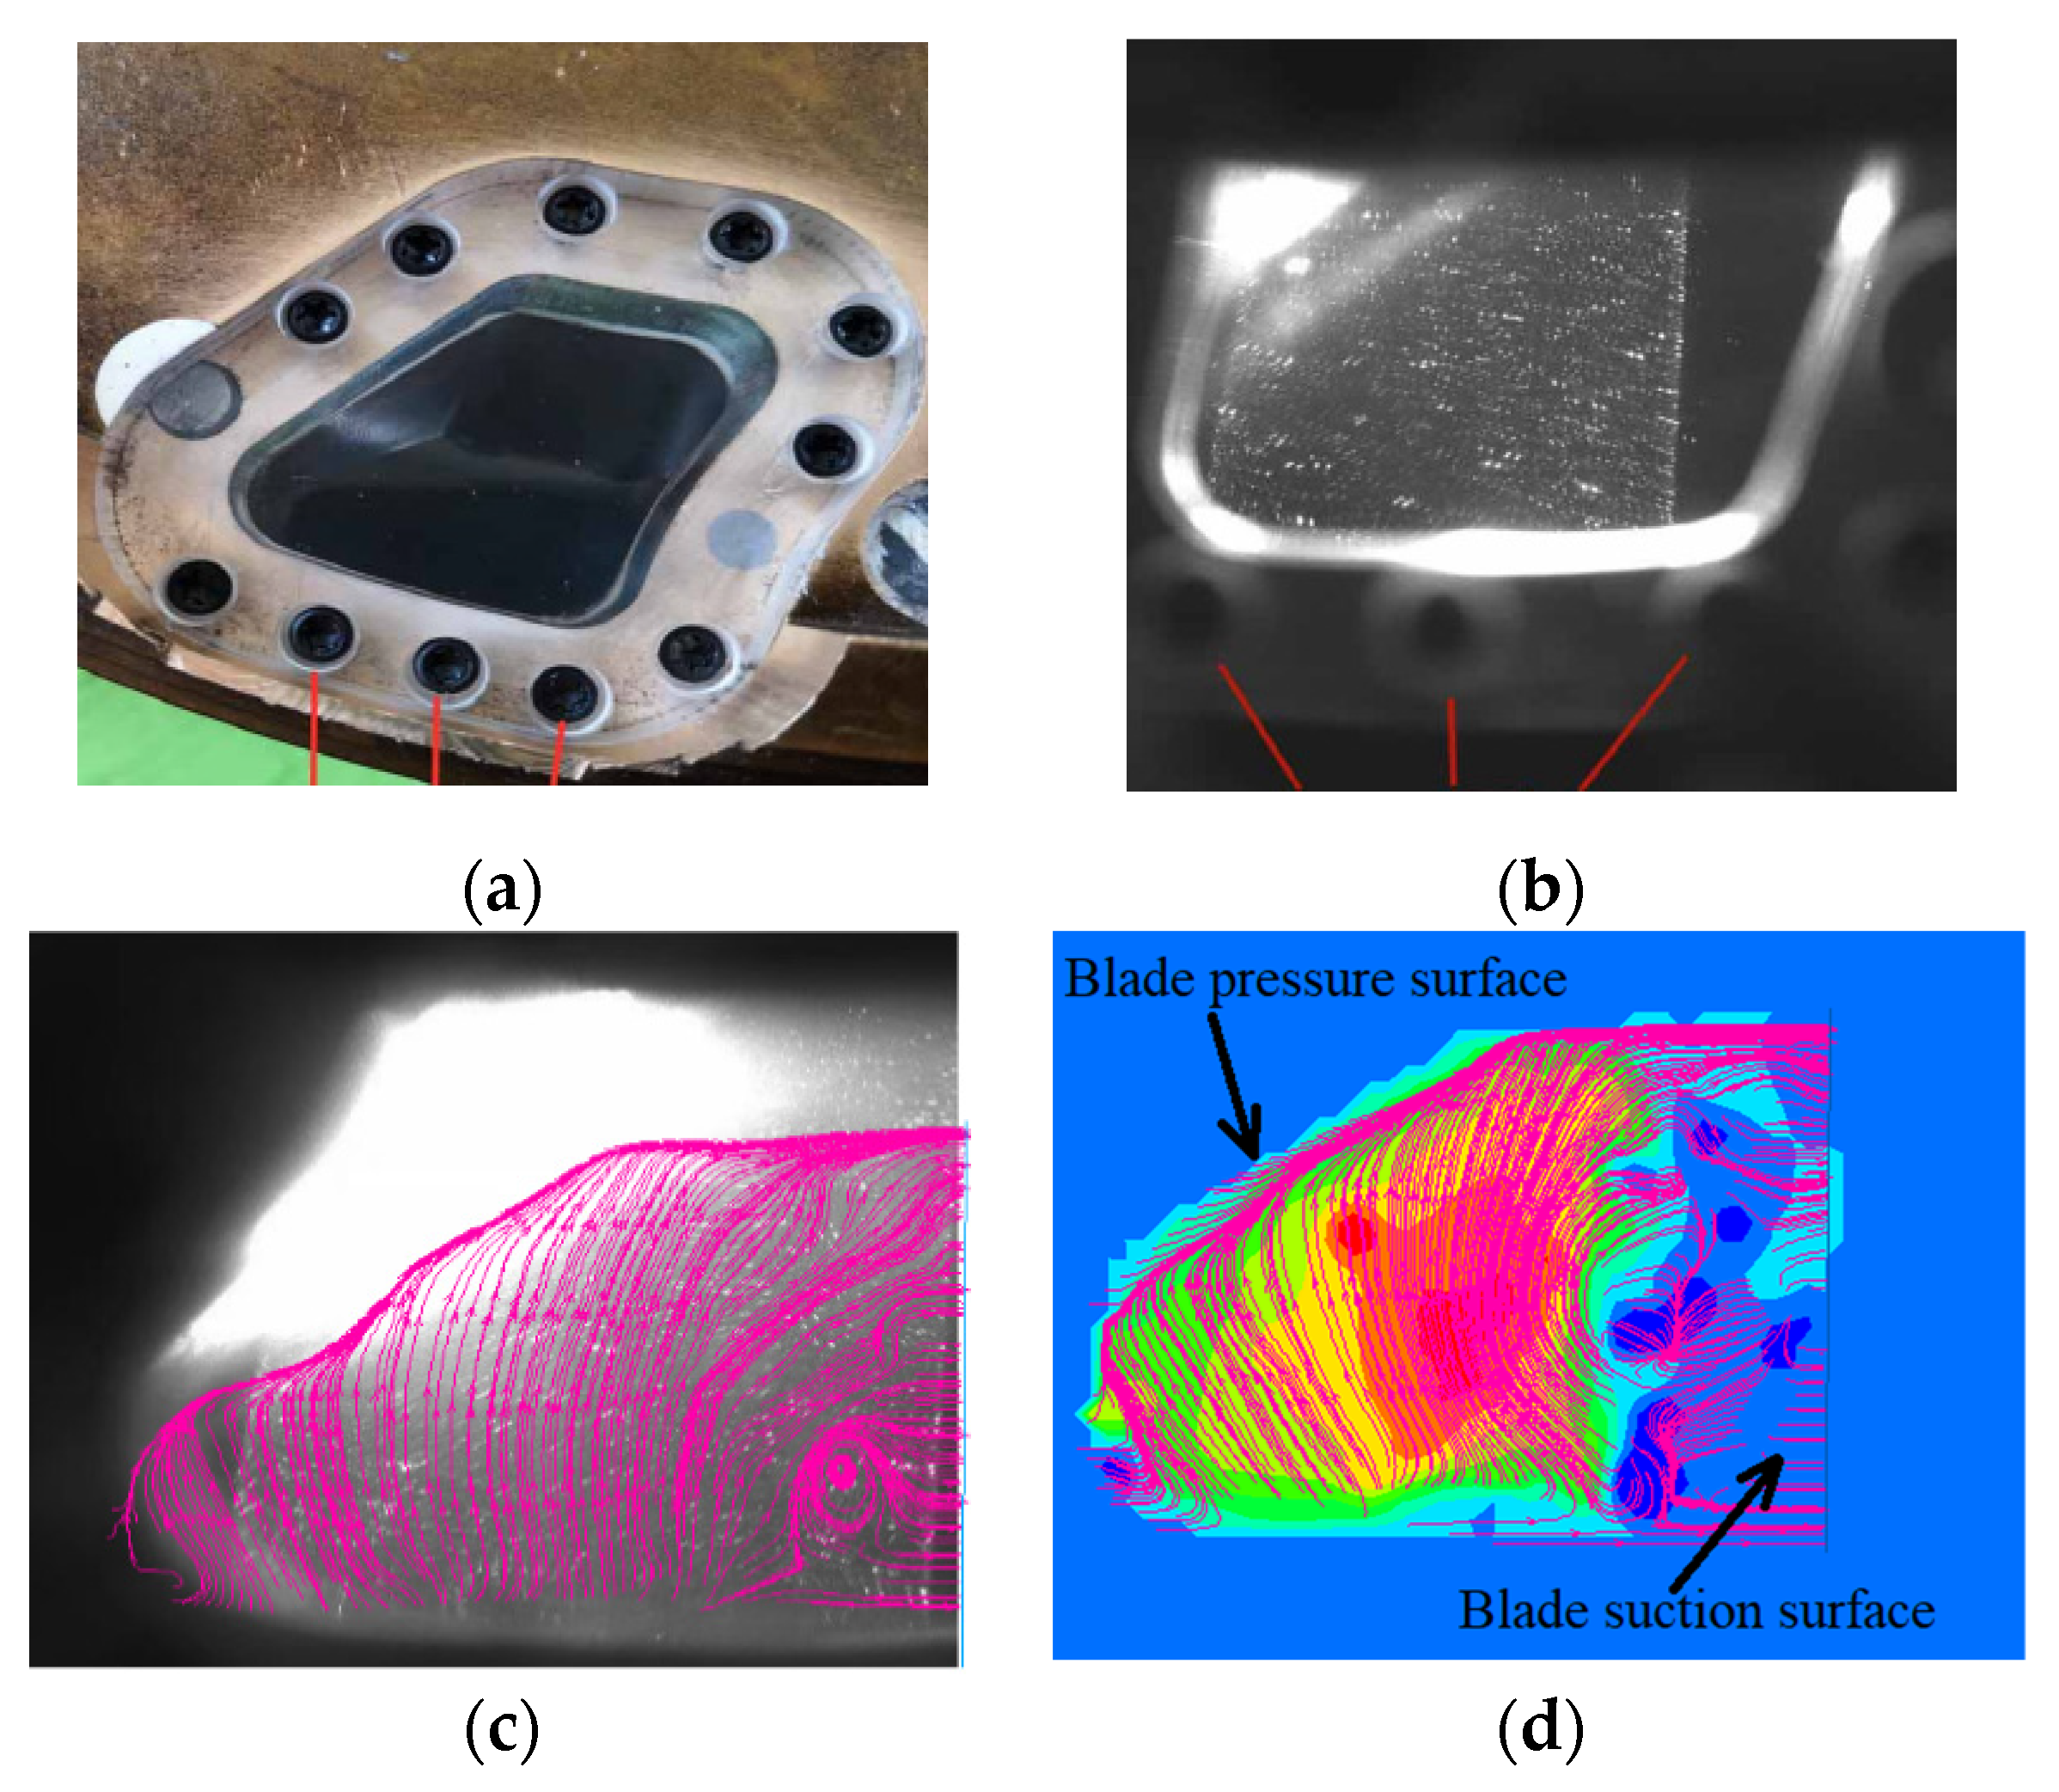
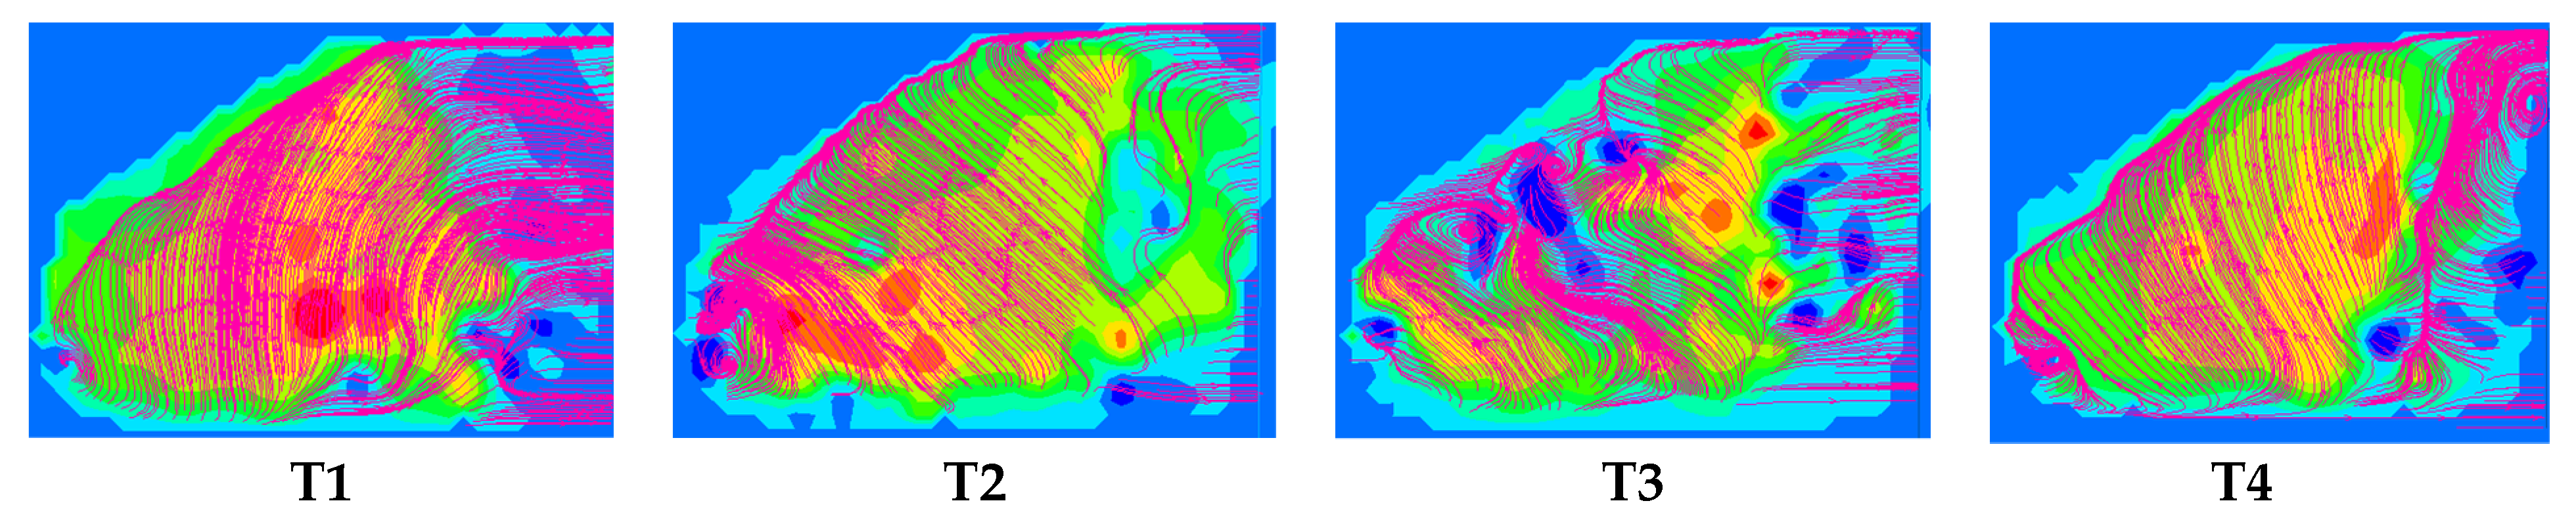
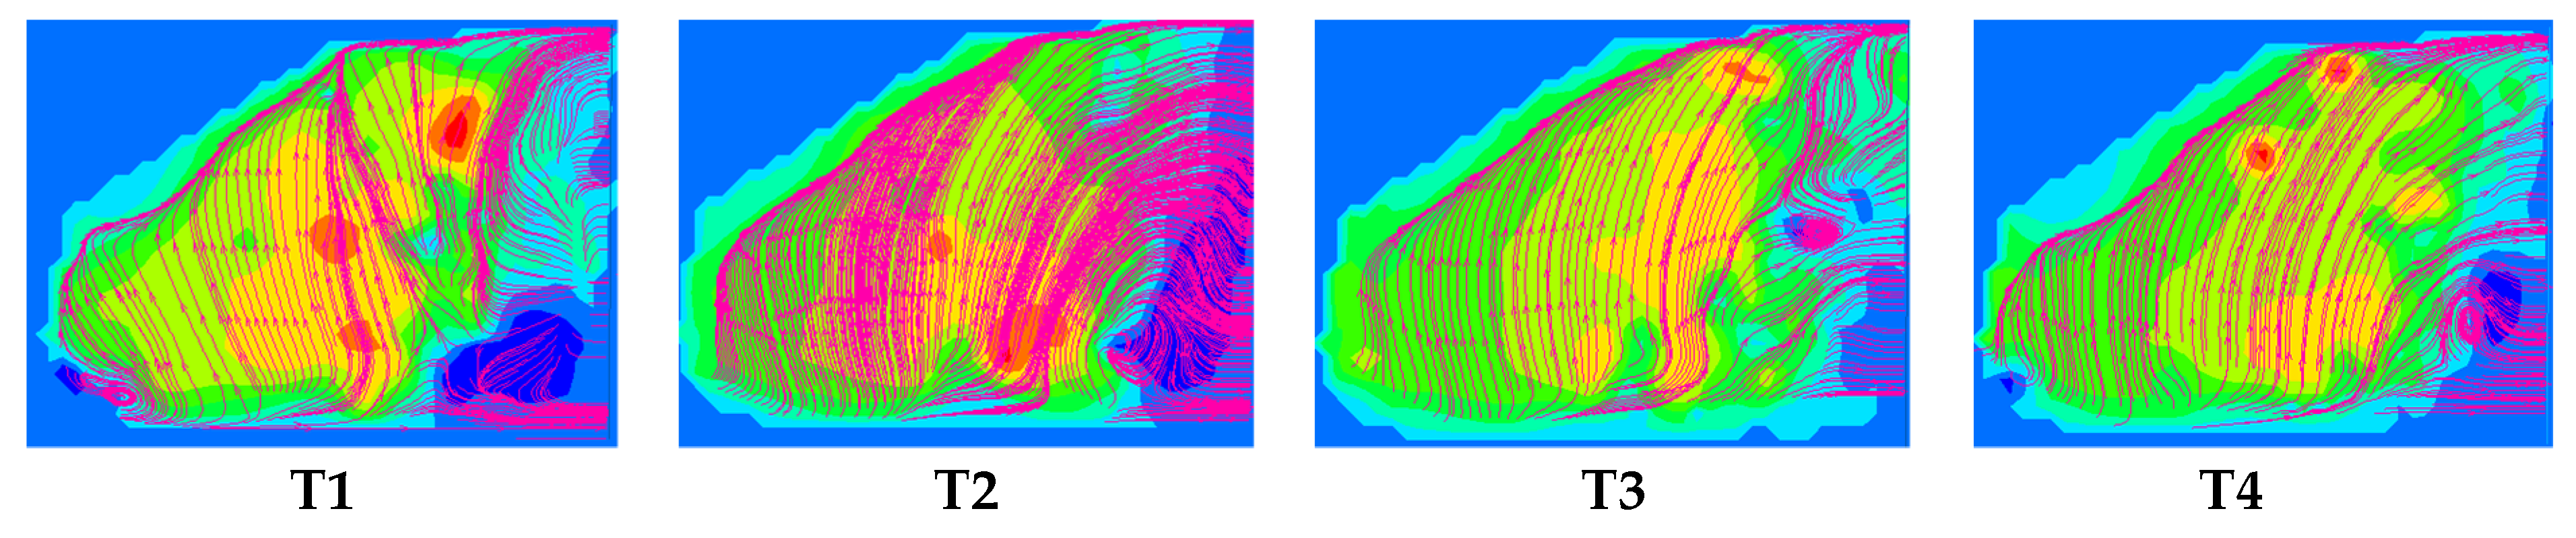
4.2. Test Results of the Middle Section

Figure 7 is a map corresponding to the position of the test image. The test images of each operating point are displayed, as shown in Figure 8. The figure shows the streamline diagram and velocity distribution of the shooting area. Figure 9 and Figure 10 are the transient vortex change images of the inter-blade vortex at the initial condition. Figure 11 and Figure 12 are the transient vortex change diagrams of the inter-blade vortex in the development condition.
As shown in Figure 8, when the turbine is operating at the optimal operating condition O1, the internal flow lines of the runner are smooth and the water flow passes through the runner unimpeded. When the turbine runs in the condition of the inter-blade vortex, the flow pattern inside the runner is relatively turbulent.
In the initial condition I1–I2 of the inter-blade vortex, the pressure surface of the runner blade contains a secondary flow and stall. The water entering the runner collides with the secondary flow and stall to produce a vortex. At this time, the vortices are mainly distributed within the pressure surface of the blade. It can be observed from Figure 9 that the vortex first appears at the inlet of the pressure surface of the runner blade at time T1. The vortex then moves along the pressure surface inside the runner. At time T2, the vortex increases. At time T3, the vortex moves along the blade’s pressure surface inside the runner and finally flows out of the visible area at time T4. At the same time (i.e., at time T4), a new vortex appears at the blade’s inlet. At I3–I4, the suction surface of the blade has a backflow zone because of the decrease in the unit speed, and the position of the vortex occurs at the position of the suction surface of the blade. It can be observed from Figure 10 that at low unit speeds, the pressure surface of the blade has a backflow zone at time T1, a vortex is generated at time T2, and the vortex moves along the suction surface inside the channel of the runner. At time T3, the backflow zone at the inlet of the suction surface of the blade under the vortex causes the formation of the suction surface vortex at time T4. It can also be observed that at time T4, the first vortex has disappeared in the visible area. These continuous vortices have periodic effects on the flow field inside the runner, thereby causing the unit to produce noise and vibration.
In the inter-blade vortex developed conditions D1–D2, the vortex mainly appears in the middle of the flow passage. It can be observed from Figure 11 that the vortex at time T1 also originates from the secondary flow and stall of the blade’s pressure surface. Unlike during the initial condition, the vortex moves away from the blade’s pressure surface in the middle of the flow channel. At time T2, the detached vortex first spreads and the other vortex also detaches from the pressure surface of the blade. At time T3, both eddies spread and move in the channel of the runner. At time T4, the vortex disappears in the visible area. In the developed condition of the inter-blade vortex, the vortex scale is larger. As the vortex moves, the vortex gradually spreads until it disappears. In D3–D4, when the unit speed is low, the backflow of the suction surface of the blade becomes the main cause of the vortex. As shown in Figure 12, the suction surface of the blade has a large-scale recirculation at time T1, and a large-scale vortex is generated at time T2. The vortex moves along the suction surface inside the runner’s channel and disappears in the visible area at time T4. At the same time, a new vortex is generated in the recirculation zone at time T4.
The inter-blade vortex is constantly changing and developing in the runner. At different times, the position and intensity of the inter-blade vortex changes, which is unstable. The unit speed and flow rate of the hydraulic turbine has an impact on the generation of the inter-blade vortices. At a high unit speed, the inter-blade vortex is relatively strong, and when the unit speed is low, the inter-blade vortex is relatively weak; thus, the inter-blade vortex exhibits periodic changes.

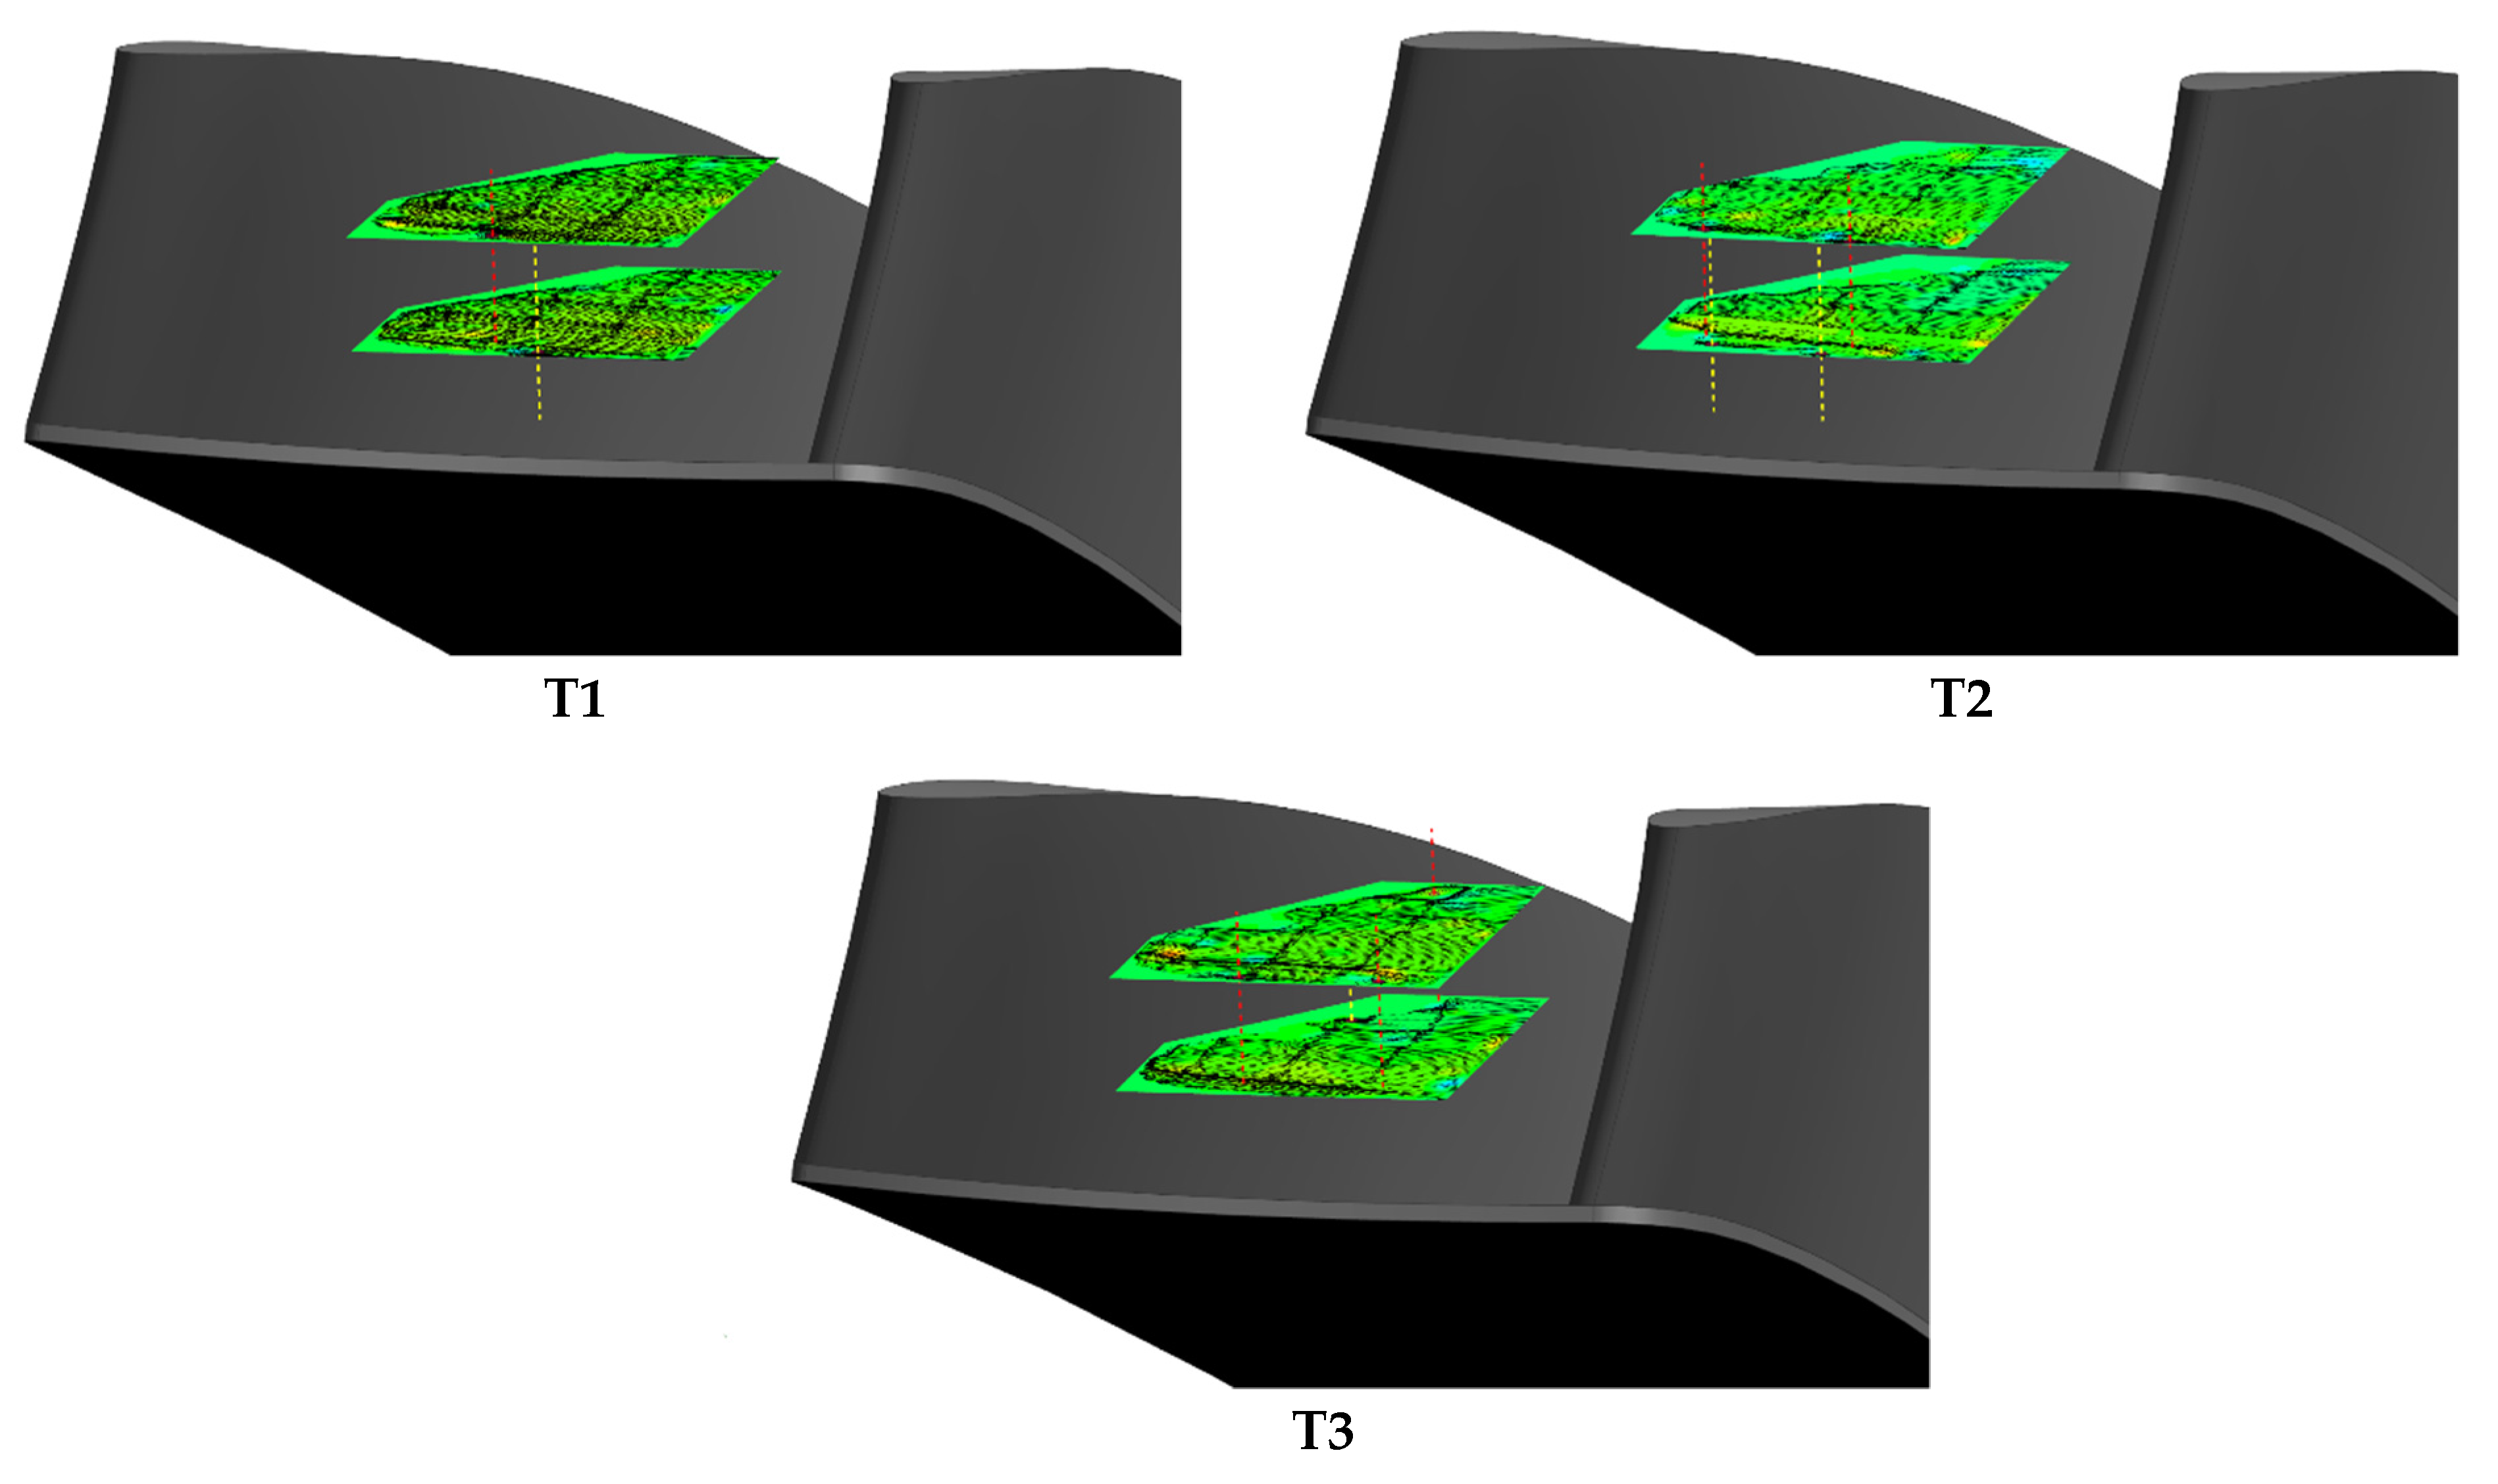
4.3. Test Results of Different Sections

The above part only shows the vortex characteristics in the middle section of the flow channel. As the inter-blade vortex is a spatial vortex, the layered photography of its evolution is also crucial. Figure 13 is a schematic of the shooting location.
Figure 14 and Figure 15 illustrate the layered shooting results of the inter-blade vortex’s initial generation condition and the inter-blade vortex’s developed condition at a high unit speed. In the figure, it can be seen that the vortex structure of different layers has the same trend of movement, but the position differs. This is because the position of the inter-blade vortex’s belt at different heights of the blade is different. The closer it is to the upper crown position, the closer the vortex structure is to the runner inlet. The same phenomenon was found in related experiments [20] and CFD simulations [21,22,23].

4.4. Discussion

From the above results, we can deduce that the main reason for the inter-blade vortex is that the water flow entering the blade’s channel has a rotational velocity component relative to the main flow direction. The sources of these rotational speed components are primarily the secondary flow caused by the blade’s angle of attack and the stall and backflow of the suction surface of the blade. When the unit rotation speed is low, the drain and backflow of the suction surface mainly cause the vortex phenomenon of the blade’s path. At the same time, the centrifugal force caused by the rotation of the runner causes the water flow to deviate in the downward loop direction. This also generates the rotation speed component and changes the vortex position at different heights of the blade.

5. Conclusions

In this study, the PIV test method was adopted to visually analyze the vortex phenomenon of the blade’s path in a Francis turbine. The following conclusions were drawn based on the findings:
(1)
The inter-blade vortex is an unsteady vortex, and its intensity and position change at different times. Furthermore, its size and strength are affected by the unit speed of the turbine. The higher the unit speed is, the stronger the inter-blade vortex becomes.
(2)
In the initial condition of the inter-blade vortex, when the unit speed is high, the inter-blade vortex mainly originates from the secondary flow of the pressure surface of the runner blade and the backflow of the pressure surface. When the unit speed is low, the vortex originates from the backflow of the suction surface of the blade. The continuous vortex moves along the blade’s pressure surface inside the runner flow channel, thus forming an inter-blade vortex phenomenon.
(3)
In the developed condition of the inter-blade vortex, when the unit speed is high, the inter-blade vortex also originates from the pressure surface of the blade. The vortex moves away from the pressure to the middle of the runner’s flow passage. It then moves in the middle of the flow passage to the inside of the runner and spreads inside the flow passage until it disappears. When the unit speed is low, the vortex also originates from the recirculation zone of the suction surface of the runner blade.

Author Contributions

Conceptualization, D.L. and W.D.; methodology, X.L.; software, L.X.; validation, L.X., Z.L. and X.J.; formal analysis, L.X.; investigation, L.X.; resources, D.L.; data curation, W.D.; writing—original draft preparation, L.X.; writing—review and editing, X.L.; visualization, L.X.; supervision, X.L.; project administration, W.D.; funding acquisition, X.L. All authors have read and agreed to the published version of the manuscript.

Funding

This research was funded by the Ministry of Science and Technology of the People´s Republic of China [Grant No.: 2018YFB0905200] and the National Natural Science Foundation of China [Grant No.: 51279172].

Institutional Review Board Statement

Not applicable.

Informed Consent Statement

Not applicable.

Data Availability Statement

Not applicable.

Acknowledgments

The authors would like to thank the Key Laboratory of Fluid and Power Machinery, Ministry of Education, Sichuan Key Laboratory of Fluid Machinery and Engineering, Sichuan Hydroelectric Power Equipment Technology Engineering Research Center, and Dongfang Electric Machinery Co., Ltd. The authors would also like to thank J.I.Lei, Key Laboratory of Fluid and Power Machinery, Ministry of Education, for providing support in data processing.

Conflicts of Interest

The authors declare no conflict of interest.

References

  1. Li, Q.Z. Research on Hydraulic Stability of Francis Turbine; Water & Power Press: Beijing, China, 2014. (In Chinese) [Google Scholar]
  2. Luo, X.W.; Ji, B.; Tsujimoto, Y. A review of cavitation in hydraulic machinery. J. Hydrodyn. 2016, 28, 335–358. [Google Scholar] [CrossRef]
  3. Liu, D.; Liu, X.; Zhao, Y. Experimental Investigation of inter-blade vortices in a model Francis turbine. Chin. J. Mech. Eng. 2017, 30, 854–865. [Google Scholar] [CrossRef]
  4. Ruan, H.; Liao, W.L.; Gong, H.P.; Zhao, Y.; Luo, X. Dynamic analysis of high-specific-speed Francis turbine runner in channel vortices condition. J. Hydroelectr. Eng. 2015, 34, 25–31. (In Chinese) [Google Scholar]
  5. Grein, H.; Goede, E. Site experience with Francis turbines operating under very large head variations. In Proceedings of the 17th IAHR Symposium, Beijing, China, 15–19 September 1994. [Google Scholar]
  6. Li, D.; Fu, X.; Zuo, Z.; Wang, H.; Li, Z.; Liu, S.; Wei, X. Investigation methods for analysis of transient phenomena concerning design and operation of hydraulic-machine systems: A review. Renew. Sustain. Energy Rev. 2019, 101, 26–46. [Google Scholar] [CrossRef]
  7. Yamamoto, K.; Müller, A.; Favrel, A.; Avellan, F. Experimental evidence of inter-blade cavitation vortex development in Francis turbines at deep part load condition. Exp. Fluids 2017, 58, 142. [Google Scholar] [CrossRef]
  8. Magnoli, M.V.; Maiwald, M. Influence of hydraulic design on stability and on pressure pulsations in Francis turbines at overload, part load and deep part load based on numerical simulations and experimental model test results. IOP Conf. Ser. Earth Environ. Sci. 2014, 22, 032013. [Google Scholar] [CrossRef]
  9. Doussot, F.; Balarac, G.; Brammer, J.; Métais, O.; Ségoufin, C. Numerical simulation and analysis at partial load in Francis turbines: Three-dimensional topology and frequency signature of inter-blade vortices. IOP Conf. Ser. Earth Environ. Sci. 2019, 240, 022045. [Google Scholar] [CrossRef]
  10. Xiao, Y.X.; Wang, Z.W.; Ang, Z.W.; Yan, Z.G. Experimental and numerical analysis of blade channel vortices in a Francis turbine runner. Eng. Comput. 2011, 28, 154–171. [Google Scholar]
  11. Xiao, Y.; Wang, Z.; Zhang, J.; Peng, G.; Liu, D.; Ma, X.; Xiao, M. Numerical analysis of blade channel vortex in Francis turbine at part load of middle-low head. In Proceedings of the ASME Fluids Engineering Division Summer Meeting, Vail, CO, USA, 2–6 August 2009; pp. 1623–1628. [Google Scholar]
  12. Zuo, Z.G.; Liu, S.H.; Liu, D.M.; Qin, D.; Wu, Y. Numerical analyses of pressure fluctuations induced by inter-blade vortices in a model Francis turbine. J. Hydrodyn. 2015, 27, 513–521. [Google Scholar] [CrossRef]
  13. Guo, P.C.; Wang, Z.N.; Sun, L.G.; Luo, X. Characteristic analysis of the efficiency hill chart of Francis turbine for different water heads. Adv. Mech. Eng. 2017, 9, 1687814017690071. [Google Scholar] [CrossRef]
  14. Sun, L.; Guo, P.; Luo, X. Numerical investigation on inter blade cavitation vortex in a Francis turbine. Renew. Energy 2020, 158, 64–74. [Google Scholar] [CrossRef]
  15. Yamamoto, K.; Müller, A.; Favrel, A.; Landry, C.; Avellan, F. Numerical and experimental evidence of the inter-blade cavitation vortex development at deep part load operation of a Francis turbine. IOP Conf. Ser. Earth Environ. Sci. 2016, 49, 082005. [Google Scholar] [CrossRef]
  16. Liu, M.; Zhou, L.J.; Wang, Z.W.; Liu, D.M.; Zhao, Y.Z. Investigation of channel vortices in Francis turbines. IOP Conf. Ser. Earth Environ. Sci. 2016, 49, 082003. [Google Scholar] [CrossRef] [Green Version]
  17. Yamamoto, K.; Müller, A.; Favrel, A.; Landry, C.; Avellan, F. Guide vanes embedded visualization technique for investigating Francis runner inter-blade vortices at deep part load operation. In Proceedings of the 6th IAHR International Meeting of the Workgroup on Cavitation and Dynamic Problems in Hydraulic Machinery and Systems, Ljubljana, Slovenia, 9–11 September 2015. [Google Scholar]
  18. Liu, D.M.; Ma, L.B.; Li, N.; Zhao, Y.Z.; Cheng, H. Experimental research on flow field of high head pump turbine based on PIV test. IOP Conf. Ser. Earth Environ. Sci. 2021, 627, 012016. [Google Scholar] [CrossRef]
  19. Sagmo, K.F.; Mærlie, A.; Storli, P.T. Particle image velocimetry measurements in the vaneless space of a model Francis turbine under steady state operation. IOP Conf. Ser. Earth Environ Sci. 2021, 774, 012026. [Google Scholar] [CrossRef]
  20. Bouajila, S.; Brammer, J.; Flores, E.; Ségoufin, C.; Maître, T. Modelisation and simulation of Francis turbine inter-blade vortices in partial load conditions. In Proceedings of the Congrès SHF: “SIMHYDRO2017”, Nice, France, 14–16 June 2017. [Google Scholar]
  21. Yu, Y.; Wang, S.; Zhou, D.Q. Vortex evolution and energy production in the blade channel of a Francis turbine operating at deep part load conditions. J. Appl. Fluid Mech. 2021, 14, 1669–1678. [Google Scholar]
  22. Conrad, P.; Weber, W.; Jung, A. Deep part load flow analysis in a Francis model turbine by means of two-phase unsteady flow simulations. IOP Conf. Ser. J. Phys. Conf. Ser. 2017, 813, 012027. [Google Scholar] [CrossRef] [Green Version]
  23. Doussot, F.; Balarac, G.; Brammer, J.; Laurant, Y.; Métais, O. RANS and LES simulations at partial load in Francis turbines: Three-dimensional topology and dynamic behaviour of inter-blade vortices. Int. J. Fluid Mach. Syst. 2019, 13, 12. [Google Scholar] [CrossRef]
Figure 1. Observation window: (a) spiral casing; (b) runner.
Processes 09 01968 g001
Figure 2. Transparent vane.
Processes 09 01968 g002
Figure 3. Light path: (a) incident laser; (b) internal effect.
Processes 09 01968 g003
Figure 4. Shooting trigger device: (a) optocoupler phase lock trigger; (b) optocoupler; (c) trigger controller.
Processes 09 01968 g004
Figure 5. Test site.
Processes 09 01968 g005
Figure 6. Distribution of operating points. D1–D4, I1–I4 and O1 is operating points in Table 3.
Processes 09 01968 g006
Figure 7. Test image location map: (a) model position (screw); (b) shooting position (screw); (c) streaming position; (d) schematic of processing results.
Processes 09 01968 g007
Figure 8. Vortex distributions. D1–D4, I1–I4 and O1 is operating points in Table 3.
Processes 09 01968 g008
Figure 9. Incipient vortex conditions at high unit speeds.T1–T4 is the moment of shooting.
Processes 09 01968 g009
Figure 10. Incipient vortex conditions at low unit speeds. T1–T4 is the moment of shooting.
Processes 09 01968 g010
Figure 11. Developed vortex conditions at high unit speeds. T1–T4 is the moment of shooting.
Processes 09 01968 g011
Figure 12. Developed vortex conditions at low unit speeds. T1–T4 is the moment of shooting.
Processes 09 01968 g012
Figure 13. Schematic of the shooting location.
Processes 09 01968 g013
Figure 14. Incipient vortex conditions at high unit speeds. T1–T3 is the moment of shooting.
Processes 09 01968 g014
Figure 15. Developed vortex conditions at high unit speeds. T1–T3 is the moment of shooting.
Processes 09 01968 g015
Table 1. Technical indices of the particle image velocimetry (PIV) test system.
ParameterValue
Speed measurement range (m/s)0–1000
Speed measurement accuracy (%)≤1
Measured area (mm2)≥900 × 1000
Overall operating frequency (Hz)≤15
Bits16
Table 2. Basic geometric parameters of the model turbine.
ParameterValue
Maximum flow (m3/s)1.5
Maximum head (m)150
Maximum speed (r/min)250
Model runner diameter (mm)400
Number of stay vanes22
Number of guide vanes24
Number of runner blades15
Table 3. Operating point listings.
Operating PointGVOUnit Flow (L/s)Unit Speed (rev/min)Head (m)
Optimal conditionsO120640.0060.5027.9
Inter-blade vortex initial conditionI116476.7668.5826.68
I216477.7965.2626.96
I316479.0561.8227.1
I416479.0559.2927.29
Inter-blade vortex developed conditionD114428.2969.2327.53
D214438.0765.8727.69
D314443.4863.3827.8
D414455.3460.3527.9
Publisher’s Note: MDPI stays neutral with regard to jurisdictional claims in published maps and institutional affiliations.

