Article

Modeling CO2, H2S, COS, and CH3SH Simultaneous Removal Using Aqueous Sulfolane–MDEA Solution

1
Research Institute of Natural Gas Technology, PetroChina Southwest Oil & Gasfield Company, Chengdu 610213, China
2
National Energy R&D Center of High-Sulfur Gas Exploitation, Chengdu 610213, China
*
Author to whom correspondence should be addressed.
Processes 2021, 9(11), 1954; https://doi.org/10.3390/pr9111954
Submission received: 20 October 2021 / Accepted: 29 October 2021 / Published: 31 October 2021

Abstract

:
In this study, a rate-based absorption model coupled with an improved thermodynamic model was developed to characterize the removal of acid components (CO2 and H2S) and organic sulfur (COS and CH3SH) from natural gas with an aqueous sulfolane–MDEA solution. First, the accuracy of the thermodynamic model was validated by comparing the calculated partial pressure of CO2, H2S, and CH3SH with those of the experimental data reported in the literature. Then, the industrial test data were employed to validate the absorption model and the simulation results agreed well with the experimental data. The average relative errors of the removal rates of CO2, COS, and CH3SH are 3.3%, 3.0%, 4.1%, respectively. Based on the validated coupled model, the total mass transfer coefficient and mass transfer resistance of each solute component at different column positions were analyzed. The effects of the gas–liquid ratio, overflow weir height, and absorption pressure on the absorption performance of each component were studied, and the influence of the acid component concentration in the feed gas on the removal efficiency of methyl mercaptan (CH3SH) was also discussed. It is found that the improved absorption model can better characterize the absorption performance and be conducive to the optimal design of the absorber column.

1. Introduction

With the development of society, natural gas is increasingly used in industry and daily life due to its economic and environmental advantages [1,2,3]. Since mined natural gas contains acid components (CO2 and H2S) and organic sulfur (COS and CH3SH), it needs further treatment before it can be used [4,5,6,7]. Conventional gas processing includes distillation, adsorption, membrane separation, and absorption [8]. Among these purification techniques, chemical absorption is the most commonly used method for acid-gas removal in the natural gas industries with its high efficiency and simultaneous strip of multiple acid gases [9].
In the industry, aqueous amine solutions are often used to remove acid components from natural gas [10,11,12]. To overcome the limited capacity of organic sulfur components with amine solution, a mixed solvent containing sulfone is used because of the high gas loading for simultaneous absorption of high CO2 and H2S content in raw gas. A common sulfone–amine solution is composed of N-methyl diethanolamine (MDEA), sulfolane, and water, which has an advantage in treating natural gas with high organic sulfur content [8,13]. Macgregor and Mather [14] reported the absorption of H2S and CO2 with a mixed solvent consisting of MDEA (20.9 wt.%) + sulfolane (30.5 wt.%). Jou et al. [15] investigated acid-gas absorption with MDEA, methanethiol, and ethanethiol at 40 and 70 ℃ at thiol partial pressure within 0.1–15.8 kPa. Haghtalab et al. [16] measured the absorption of acid-gas in different mix solvents at 343 K and a total pressure of 0.1–0.21 kPa and reported variation in the solubility of CO2 and H2S in different operating conditions and solvent compositions. However, although absorption with various mixed solvents has been reported, reliable thermodynamic modeling of the absorption process remains a big challenge for simulating and optimization of the acid-gas capture processes [17].
In order to accurately simulate and design the absorption process of the acid component and organic sulfur in natural gas using an aqueous sulfolane–MDEA solution, it is necessary to establish a reliable and robust absorption model, which involves the gas–liquid equilibrium, chemical reaction equilibrium, material and heat balance, and transfer properties of each component in the system [18,19,20]. Afkhamipour and Mofarahi [21] compared the rate-based and equilibrium-stage models by simulating post-combustion CO2 capture using a 2-amino-2-methyl-1-propanol (AMP) solution in a packed column. The simulation results of the absorber show that the rate-based model can better predict temperature and concentration curves than the equilibrium phase model. Al-Baghli et al. [22] simulated the process of removing CO2 and H2S by MEA and DEA aqueous solutions using rate-based gas absorber model and obtained reliable simulation results. Pacheco and Rochelle [23] developed a framework to perform selective absorption of H2S using MDEA solution from a gas stream containing CO2. The Maxwell–Stefan and enhancement factor theories are used in the model. Mandal and Bandyopadhyay [24] conducted theoretical and experimental research on the simultaneous absorption of CO2 and H2S into solutions containing MDEA and DEA. Moioli et al. [25] used the Eddy diffusivity theory in Aspen Plus and used an external subroutine to simulate the absorption of CO2 and H2S from gas streams. In addition, they modified the parameters for vapor–liquid equilibrium (VLE) calculations and verified the simulation using data in the literature. Yang et al. [26] used an aqueous sulfone–MDEA solution to remove organic sulfur in natural gas and studied the factors that affect organic sulfur removal in natural gas purification devices. However, the process of the simultaneous removal of multiple impurities (i.e., CO2, H2S, COS, and CH3SH) is usually very complicated, and the influence of acidic gas on the absorption performance of organic sulfur during the removal process is still unclear.
In this study, we developed a rate-based absorption model coupled with an improved thermodynamic model to characterize the removal of acid components (CO2 and H2S) and organic sulfur (COS and CH3SH) from natural gas with an aqueous sulfolane–MDEA solution. An improved thermodynamic model was used considering the influence of acid component concentration on the removal efficiency of methyl mercaptan (CH3SH). The mass transfer characteristics at different column positions were analyzed. The influence of the gas–liquid ratio, overflow weir height, and absorption pressure on the removal rate of each component and the influence of acid component content on the removal rate of methyl mercaptan (CH3SH) were studied. Furthermore, with the modified rate-based absorption model, we successfully simulated the adsorption process for a wide range of feed gas compositions and operating conditions. This study is expected to further facilitate optimization of the operating conditions and device structure.

2. Model Theory

2.1. Thermodynamic Framework

The detailed thermodynamic model consists of the gas–liquid equilibrium and chemical reaction equilibrium of each component in the solvent.

2.1.1. Gas–Liquid Equilibrium

The gas–liquid equilibrium of the acid component (CO2 and H2S) and organic sulfur (COS and CH3SH) in the aqueous sulfolane–MDEA solution is calculated by Henry’s law:
P y i φ i = H i x i γ i *
where P is the system pressure, Pa. Hi is Henry’s law constant of component i in the mixed solvent of water, sulfolane, and MDEA, Pa. y i is the mole fraction of component i in the vapor phase, and x i is the equilibrium mole fraction of component i in the liquid phase. φ i is the fugacity coefficient of component i in the vapor phase, which is calculated using the Peng–Robinson equation of state (EOS) [27]. γ i * is the unsymmetric activity coefficient of component i in the mixed solvent solution of water, sulfolane, and MDEA. γ i * is normalized to the mixed solvent infinite dilution reference state.
In the mixed solvent, Henry’s law constant can be calculated from those in the pure solvents, as shown in Equation (2) [28].
ln ( H i γ i * ) = A w A · ln ( H i A γ i A )
where ωA is the weighting factor, which can be calculated according to the method in the literature [13]. γ i A is the infinite dilution activity coefficient of component i in pure solvent A, H i A is Henry’s constant of component i in pure solvent A, and the values of H i A of solute i (CO2, H2S and CH4) can be obtained directly from the literature [10,11,12,13]. Some H i A values of CH4, CH3SH, and COS regressed according to the experimental data [29,30,31], which are summarized in Table 1.
During the absorption process, MDEA reacted with acidic components and the amount of reaction affected the absorption of organic sulfur in the aqueous sulfolane–MDEA solution. Thus, the unreacted ratio of MDEA is introduced to modify Henry’s coefficient of methyl mercaptan (CH3SH) in the aqueous sulfolane–MDEA solution [26]. Equation (3) is used to quantitatively describe the influence of the acid component content on Henry’s constant for CH3SH.
H C H 3 S H = H C H 3 S H f C
where f is the unreacted ratio of MDEA, which is the ratio between unreacted MDEA and the total amount of MDEA and MDEAH+ in aqueous solutions. C is the effect factor, symbolizing the influence of the acid component on Henry’s law constant. H C H 3 S H and H C H 3 S H are Henry’s constants of CH3SH in the mixed solvent when the influence of acid component is not taken into account and is taken into consideration, respectively.
The electrolyte-nonrandom two-liquid (e-NRTL) model is used to calculate the activity coefficients [33]. The molecule–molecule, electrolyte–electrolyte, and molecule–electrolyte binary parameters are mainly obtained from the literature [10,13]. Some binary parameters that are not mentioned in the literature are defaulted to (8, –4), and the non-randomness factor is fixed at 0.2 [34].

2.1.2. Aqueous Phase Chemical Equilibrium

In aqueous solutions, the acid components H2S and CO2 react with MDEA, and the ionic equilibrium reactions are expressed as Equations (4)–(9) [35].
CO 2 + 2 H 2 O H 3 O + + HCO 3
H 2 S + H 2 O H 3 O + + HS
H 2 O + MDEAH + H 3 O + + MDEA
HS + H 2 O S 2 + H 3 O +
HCO 3 + 2 H 2 O CO 3 2 + H 3 O +
2 H 2 O H 3 O + + OH
The liquid phase compositions must satisfy the chemical equilibrium relationships [11]:
K i = i ( x i γ i ) v i i ( x i γ i ) v i
where K j is the chemical equilibrium constant of reaction j, xi is the mole fraction of reactant component i in reaction j, x i is the mole fraction of product component i in reaction j, and γ i and γ i are the unsymmetric activity coefficients of reactant component i and product component i in the aqueous solution. The unsymmetric activity coefficients are normalized to the aqueous phase infinite dilution reference state. v i and v i represent the stoichiometric coefficients of reactants and products, respectively.
The chemical equilibrium constant Kj of reaction j can be calculated by Equation (11) [11,35].
ln ( K j ) = A + B T + C ln ( T ) + D T
where the constants A, B, C and D are summarized in Table 2.

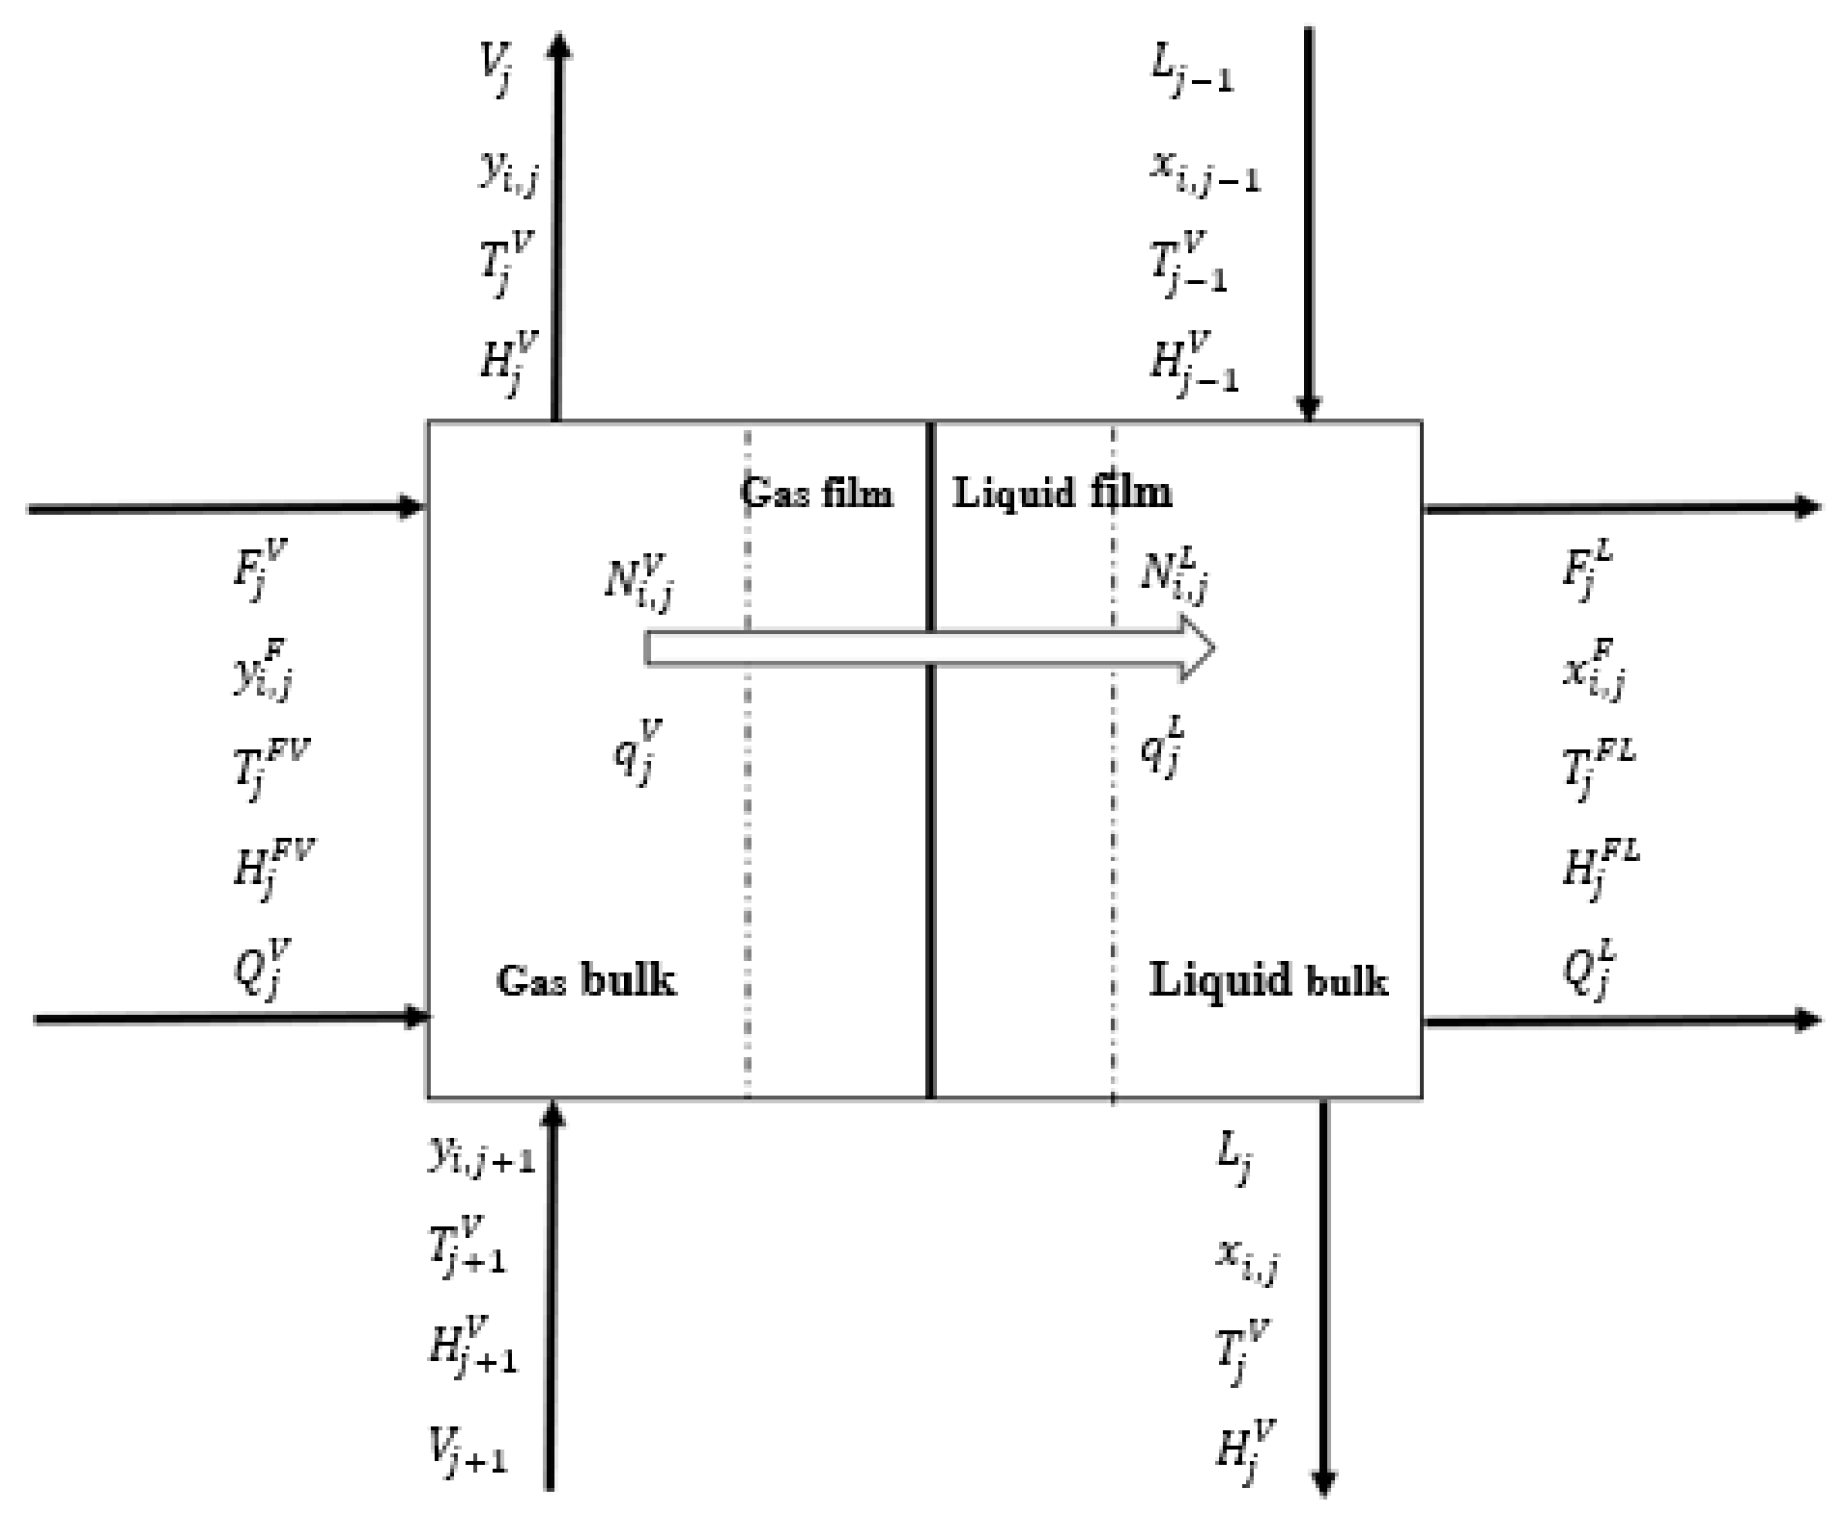
2.2. Rate-Based Model Assumptions

In order to simulate the absorption process of removing the acid component (H2S and CO2) and organic sulfur (COS and CH3SH) from natural gas utilizing a tray column, a mathematical model was established using the two-film theory [37]. The basic assumptions are as follows:
(1) Consider both physical absorption and chemical absorption, and the reaction only occurs in the liquid phase.
(2) The absorption column is adiabatic.
(3) The heat transfer resistance of the liquid phase is neglected, and the interface temperature is equal to the bulk temperature.
(4) Flow is one-dimensional in the axial direction, and the radial temperature and concentration variation can be neglected.

2.3. Material and Energy Balance

The tray column is composed of many stages, where vapor and liquid streams from adjacent stages contact each other and exchange mass and energy at their common interface [18,21].
Figure 1. Presents a stage j in the tray column, and i represents the components. The main mass and energy balance equations are listed below [38].
Material balance for liquid phase:
F j L x i , j F + L j 1 x i , j 1 + N i , j L + r i , j L L j x i , j = 0
Material balance for vapor phase:
F j V y i , j F + V j + 1 y i , j 1 + N i , j V V i y i , j = 0
Energy balance for liquid phase:
F j L H j F L + L j 1 H j 1 L + Q j L + q j L L j H j L = 0
Energy balance for vapor phase:
F j V H j F V + V j + 1 H j 1 V + Q j V + q j V V j H j V = 0
where F is the mole flow rate of feed, kmol s−1. L and V represent the mole flow rates of liquid and vapor, respectively, kmol s−1. N is the mole transfer rate, kmol s−1. r is the reaction rate, which can be calculated from the component concentration. x i and y i are the mole fractions of component i in the liquid and vapor phases, respectively. Q is the heat input to a stage, J s−1; q is the heat transfer rate, J s−1; H F L and H F V are the enthalpies of the inflow liquid and inflow vapor, J kmol−1; and the thermodynamic properties including enthalpy and heat capacity utilized in heat transfer calculations can be obtained directly from the literature [10,11,12,13].

2.4. Mass Transfer and Enhancement Factor

The mass transfer flux between the gas phase and the liquid phase is shown in Equation (16) [39].
N i = K G , i ( P i P i * ) a p A c
where K G , i is the overall mass transfer coefficient for component i; a p is the effective mass transfer area per unit area of the tray, m2m−2; A c is the cross-sectional area of the column, m2; P i is the partial pressure of component i in the gas bulk; and P i * is the partial pressure of component i in equilibrium with the liquid phase. The partial pressure of each component can be calculated by the established thermodynamic model.
Using the two-film model, the overall mass transfer coefficients incorporating gas and liquid transfer resistance for component i is expressed as Equation (17).
1 K G , i = 1 k G , i + H i k L , i E i
Where Hi is Henry’s law constant of component i; K G , i is the overall mass transfer of component i in gas phase; and k G , i and k L , i are the mass transfer coefficient of component i without reaction in the gas phase and the liquid phase, which are calculated according to the method used by Simon et al. [18] and Saimpert et al. [40]. The density, viscosity, and surface tension required for the calculation can be obtained directly from the Aspen database. E i is the enhancement factor of component i due to chemical reactions, which is the ratio of the mass transfer enhanced by a reaction over the mass transfer without the reaction [21]. The calculation of the enhancement factor in this work uses the formula developed by Danckwerts [41].
For large values of enhancement factor for infinite fast reaction ( E ) and Hatta numbers lower than 2, the enhancement factor is calculated using a simplified Equation (18) [42].
E i = H a tanh ( H a )
For infinite fast reaction ( E ) values lower than 100 and Hatta numbers larger than 2, the enhancement factor is calculated using a simplified Equation (19) [1].
E i = ( E 1 H a 3 / 2 + 1 E 3 / 2 ) 2 / 3
where the Hatta number and enhancement factor for the infinite fast reaction are expressed as Equations (20) and (21) [42].
H a = k 2 t , i · D i , L · C M D E A B u l k k L , i
E = 1 + D M D E A , L D i , L × C M D E A B u l k C i I n
where D i , L refers to the diffusivity of absorption component i in an aqueous sulfolane-MDEA solution, DMDEAL is the diffusivity of the MDEA in the liquid phase. C i I n is the concentration of absorption component i at the gas-liquid interface, and C M D E A B u l k represents the concentration of MDEA in the bulk liquid. Pacheco and Rochelle [23] and Al-Ghawas et al. [32] measured the rate constants of reaction between CO2 and MDEA and between COS and MDEA in the mixed solvent, respectively, as shown in Equations (22) and (23).
k 2 t , C O 2 = 2.576 × 10 9 exp ( 6024 / T )
k 2 t . C O S = 4198.74 exp ( 4575.80 / T )
For CO2 and COS, the enhancement factor is needed for the mass transfer rate calculations, which are calculated using Equation (18). As the reaction between H2S and MDEA is very fast, the enhancement factor can be calculated using the infinite fast reaction rate, as shown in Equation (19). In contrast, the absorption of CH3SH is mainly a physical effect, so there is also no need to consider the influence of chemical reactions.

2.5. Computational Implementation

The model calculation was performed by writing Fortran programs. The solution of the absorption model adopts the stepwise calculation method, and the steps are as follows:
(1) The concentration of the absorbed components in the gas and liquid feed, and the gas-liquid ratio are known. By assuming the total removal rate of each component, the concentration of each absorbed component in the liquid at the last plate can be calculated.
(2) Since the concentration of gas feed and liquid discharge of the last plate is known, the concentration of liquid feed and gas discharge of this plate, that is, the concentration of gas feed and liquid discharge of the upper plate can be calculated.
(3) It is calculated upward until the gas discharge concentration of the top plate is obtained, then the removal rate of the whole column of each component can be calculated.
(4) Compare the removal rate of the whole tower between the hypothesis and the calculated one. If the error is greater than 0.0001, change the hypothesis and continue the iterative calculation until the error requirement is met.

3. Modeling Results

As mentioned above, a rate-based absorption model coupled with the thermodynamic model was developed for the removal of acid components (CO2 and H2S) and organic sulfur (COS and CH3SH) from natural gas with an aqueous sulfolane–MDEA solution.
In this section, the accuracies of the thermodynamic model and absorption model are first validated. Then, the effects of the gas–liquid ratio, overflow weir height, and absorption pressure on the absorption performance of each component are investigated, and finally, the influence of acid component concentration in the feed gas on the removal efficiency of methyl mercaptan (CH3SH) is also discussed.

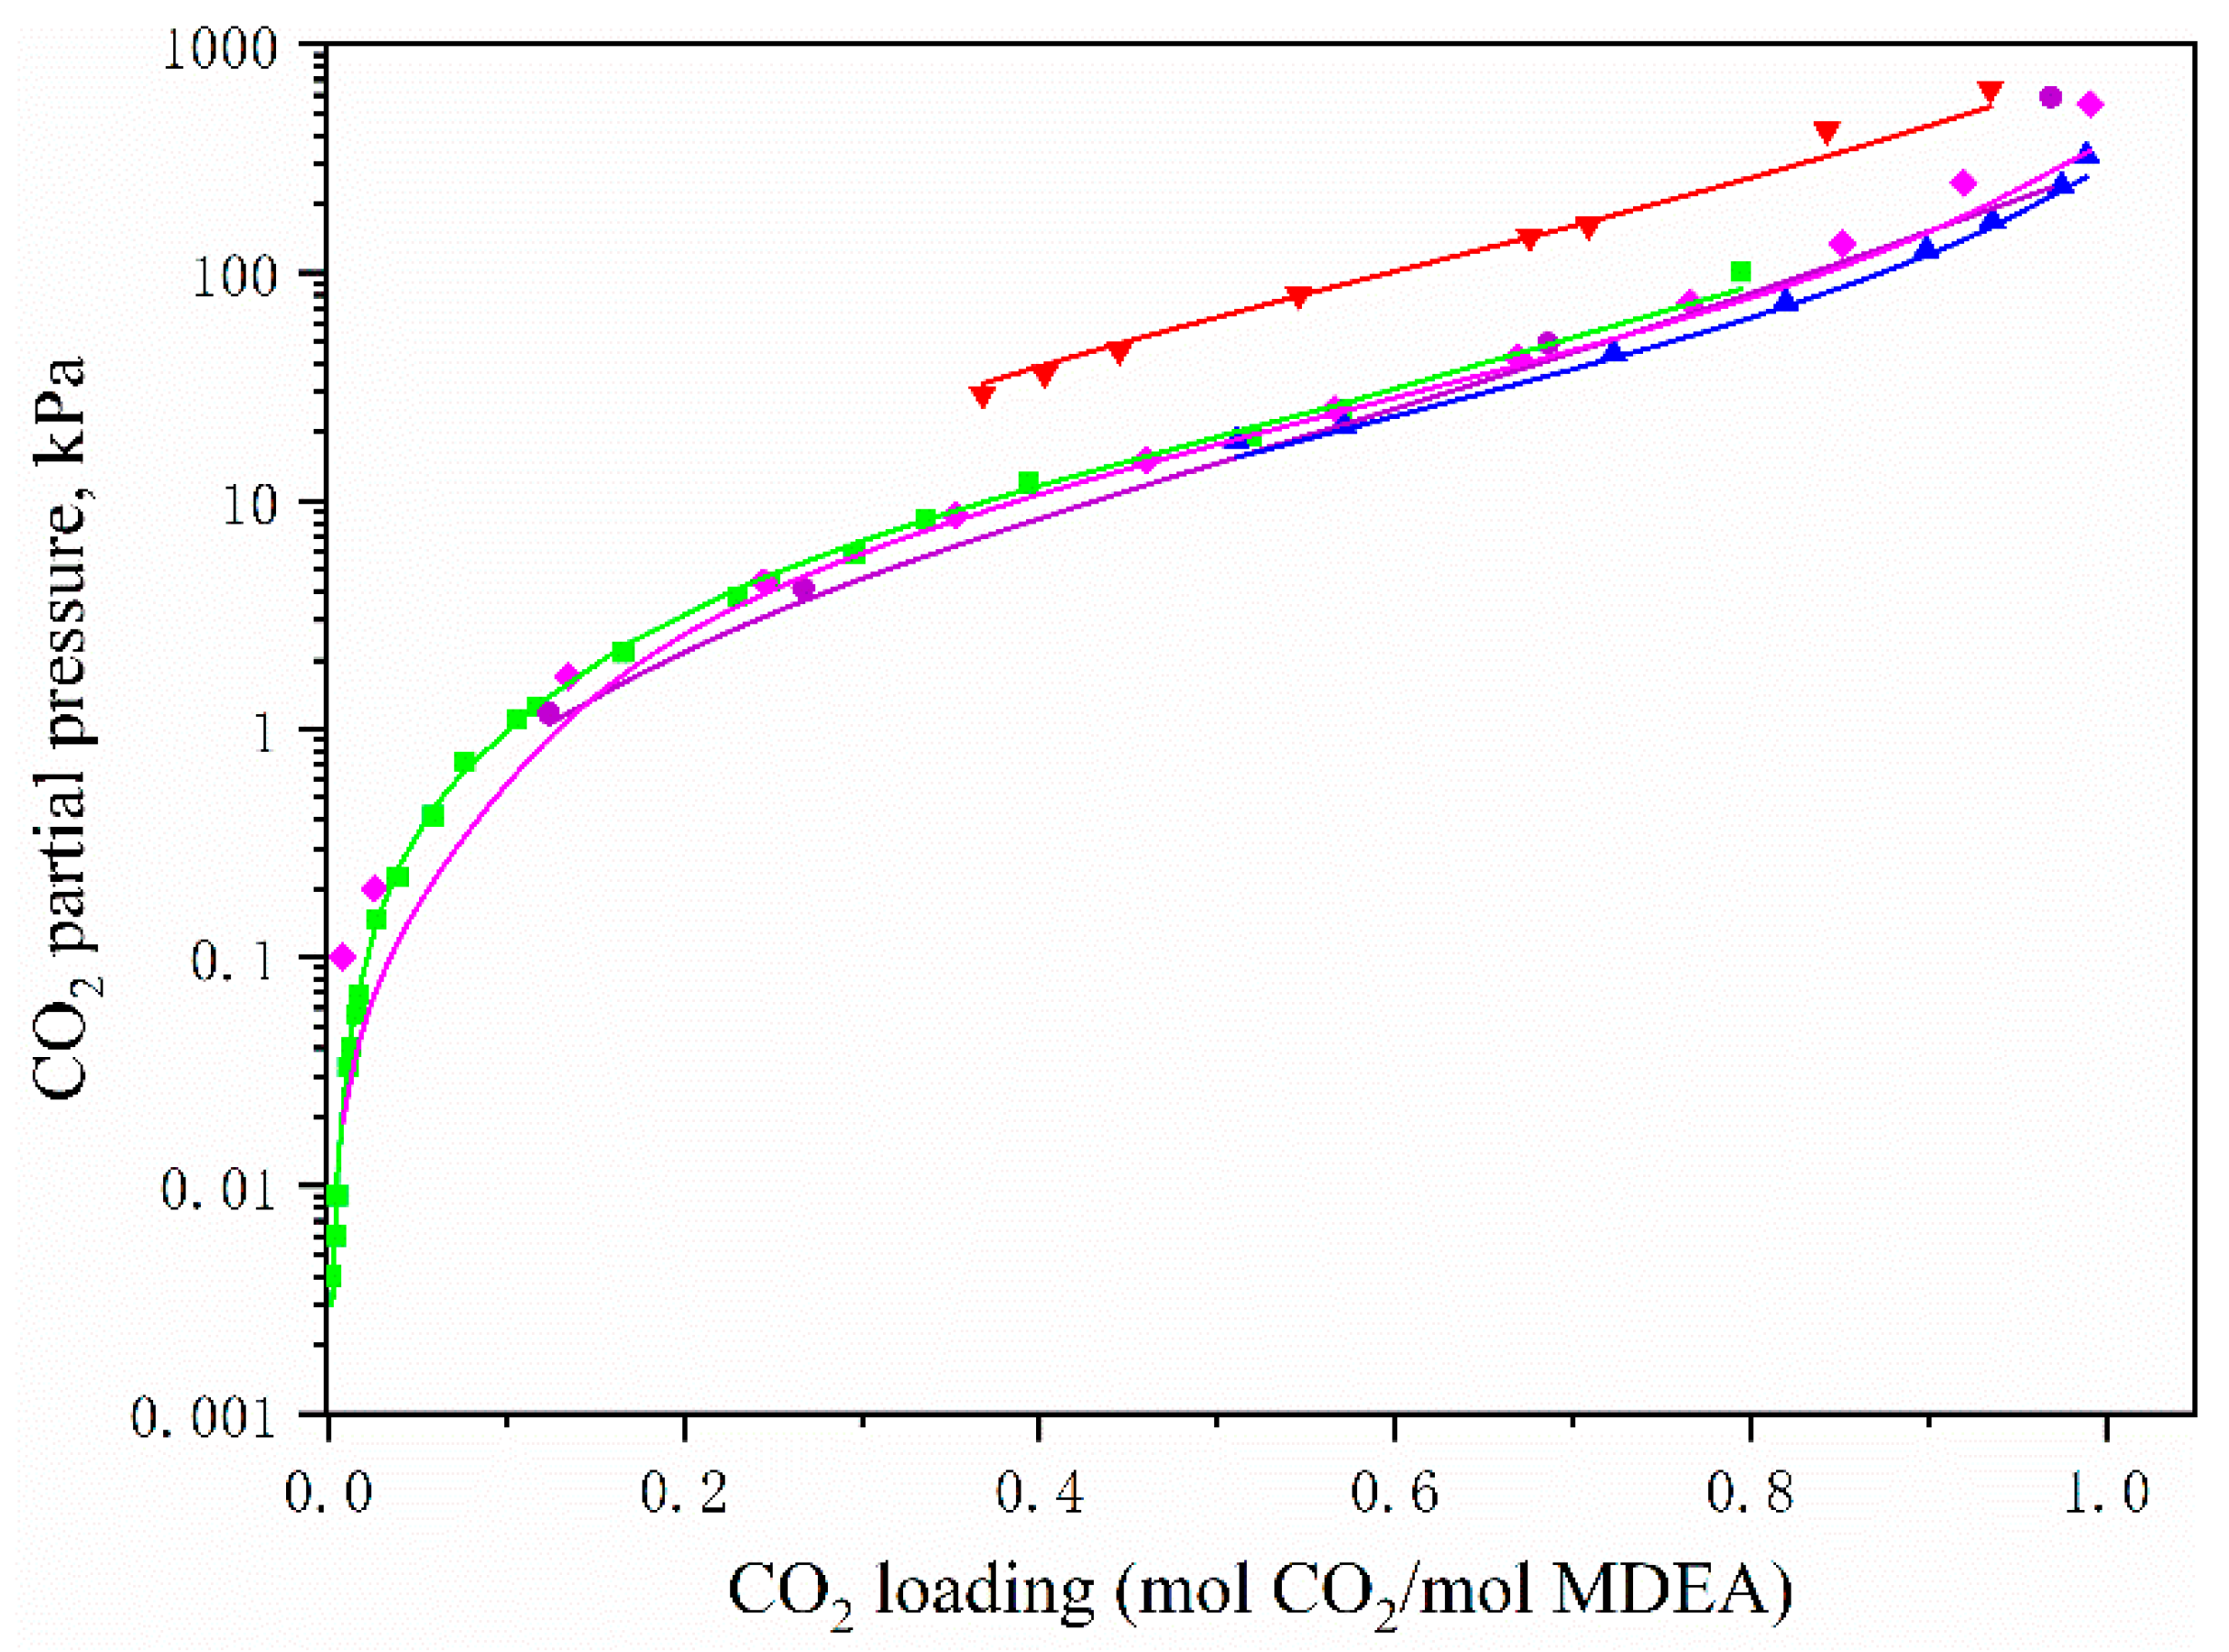
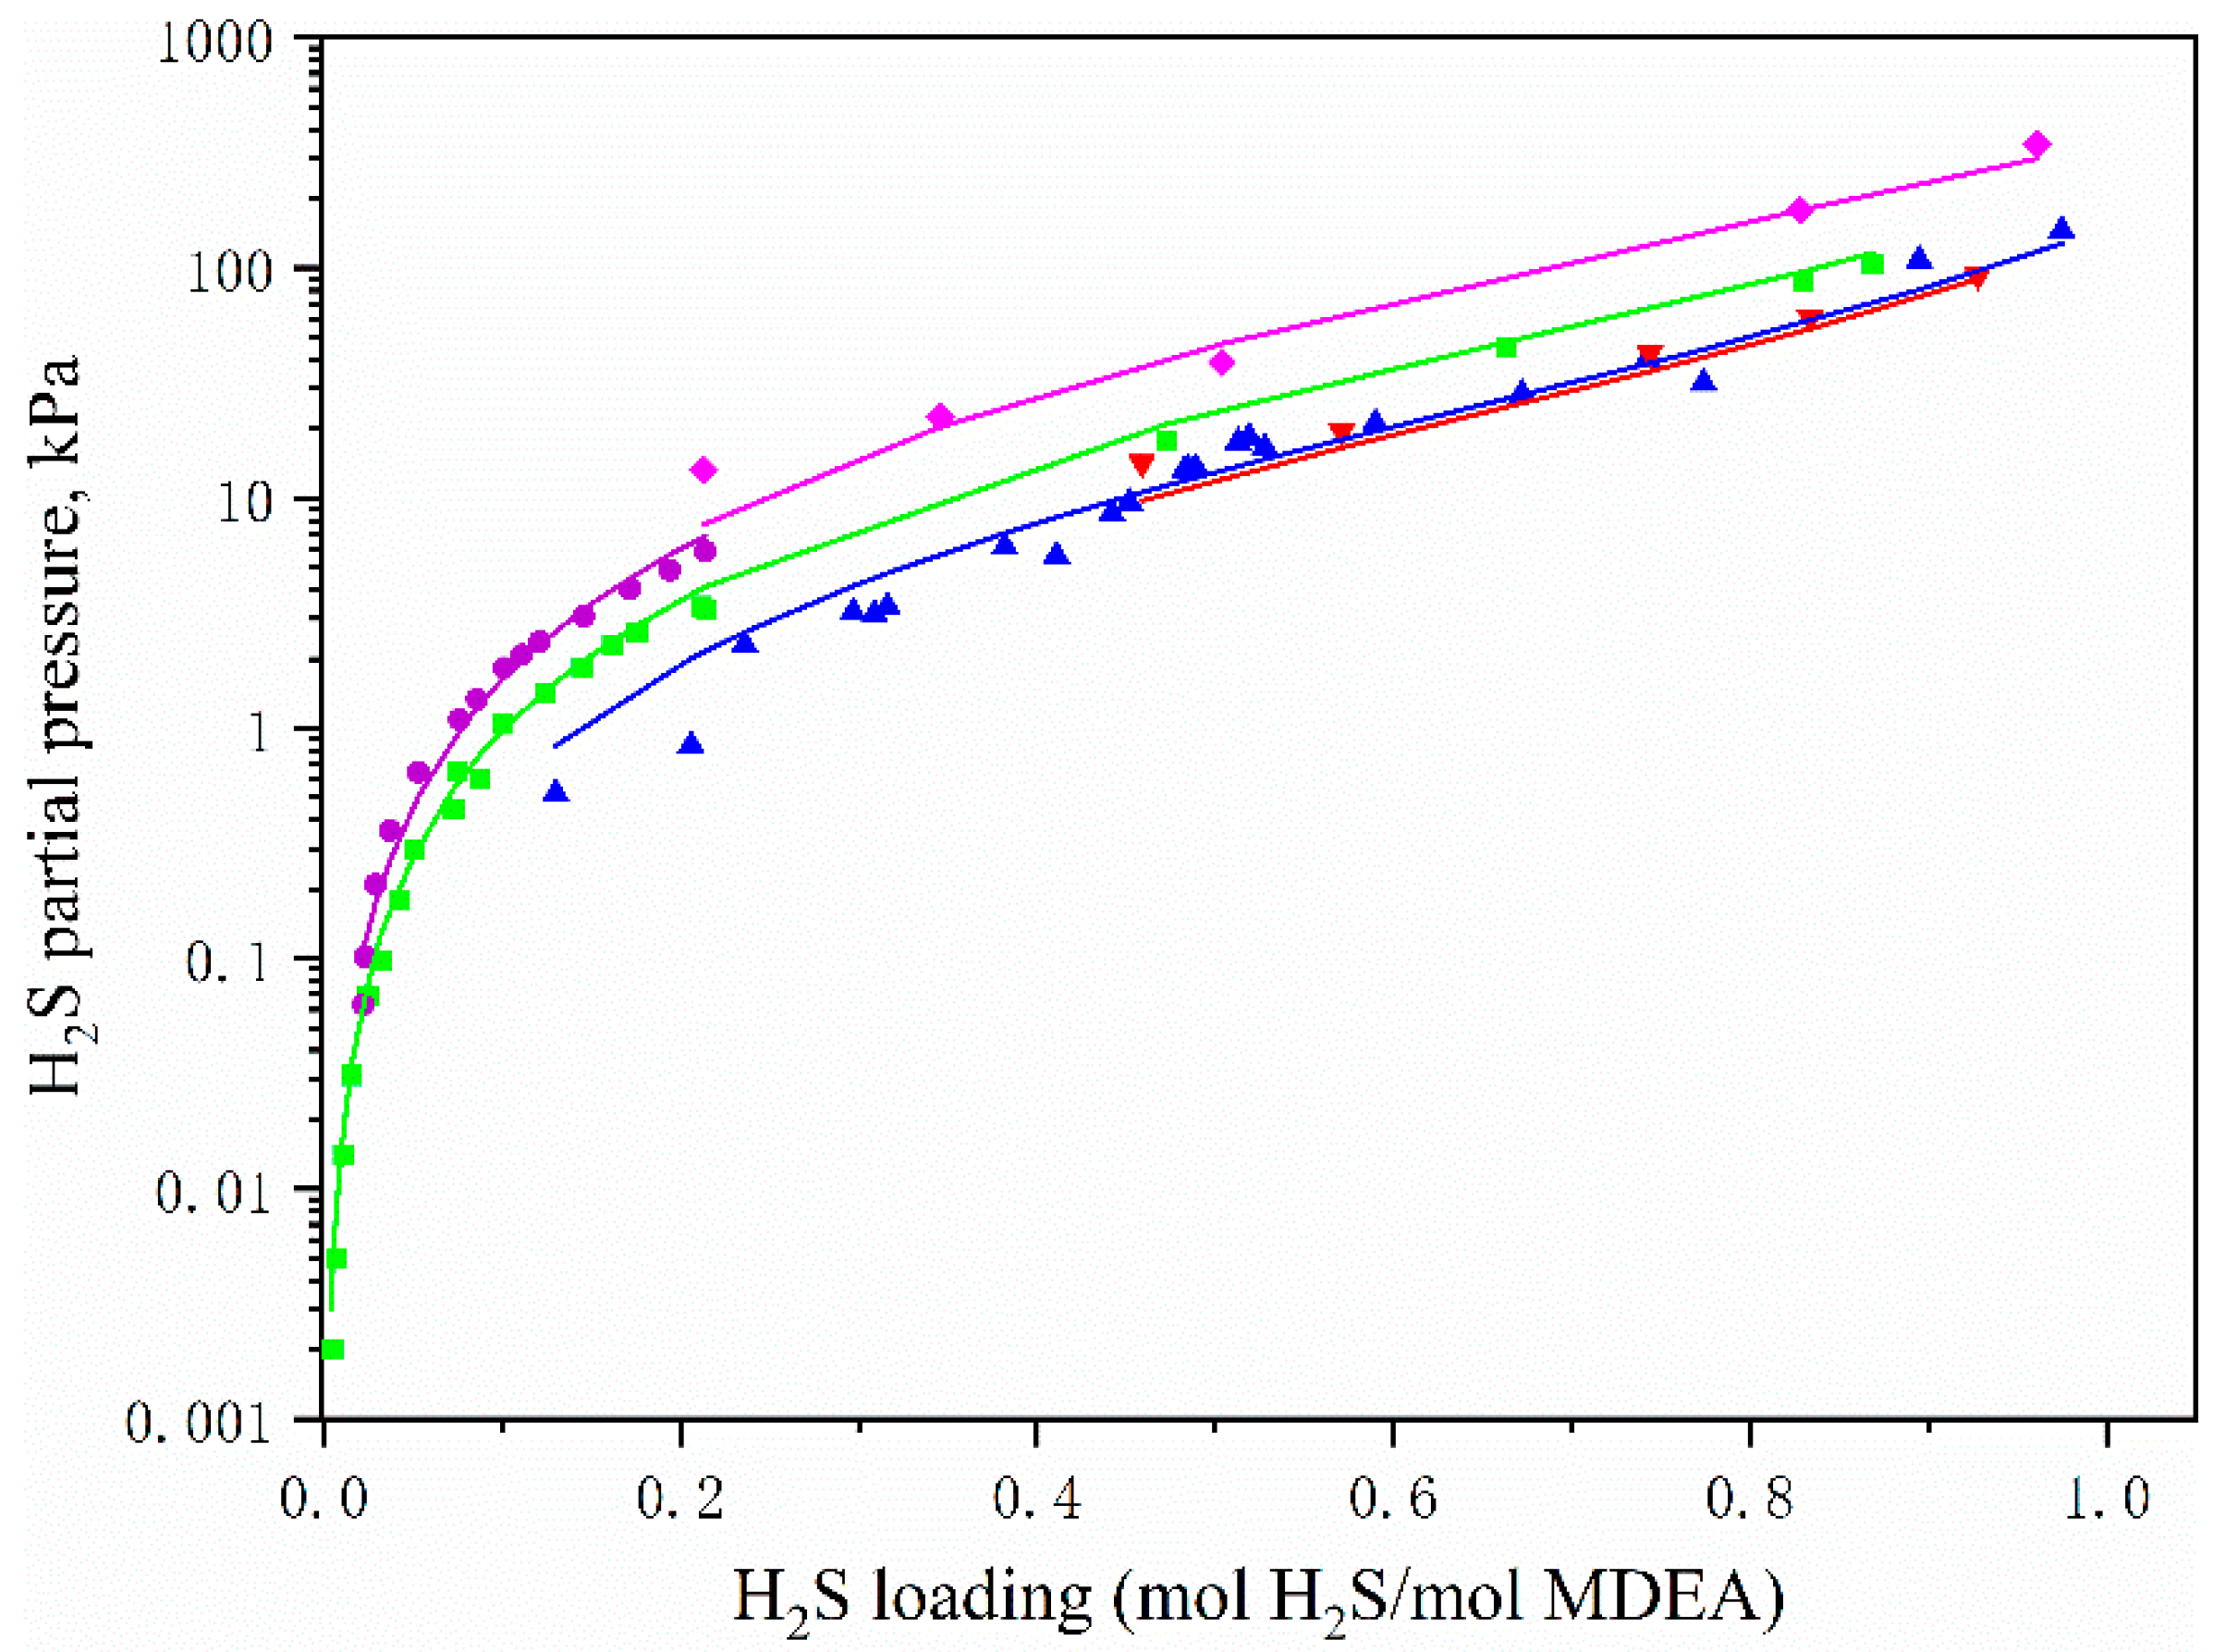
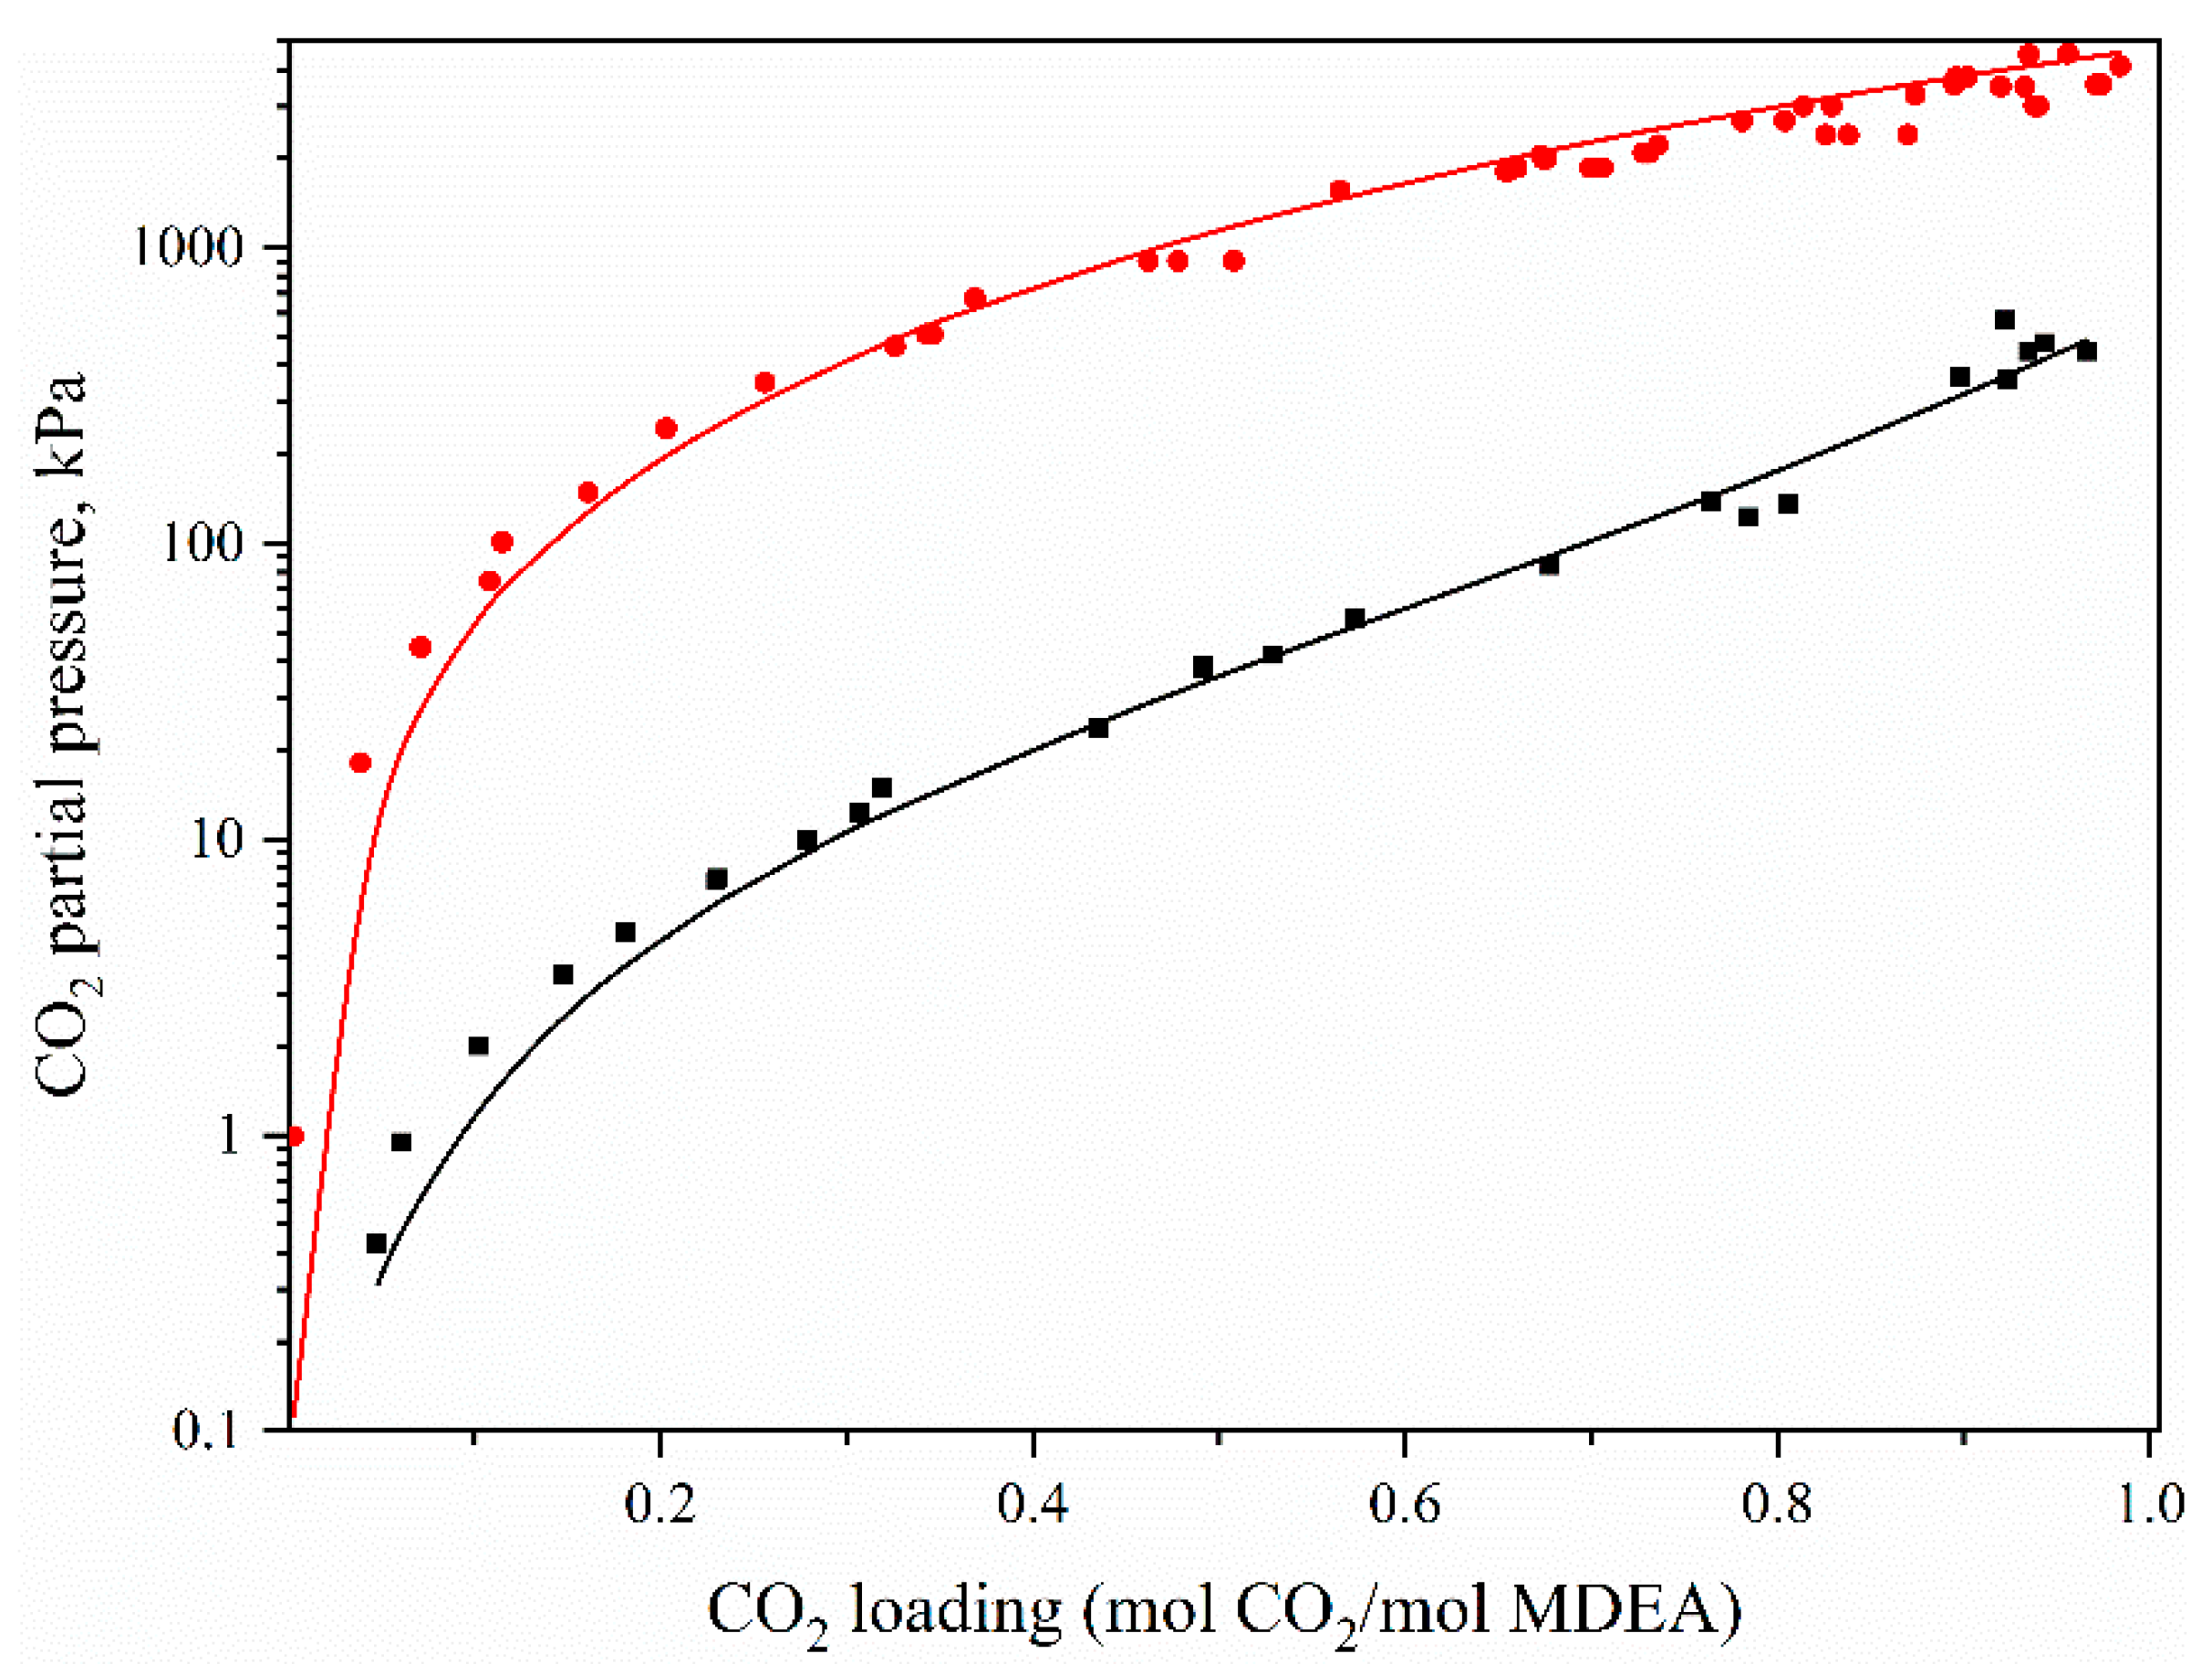
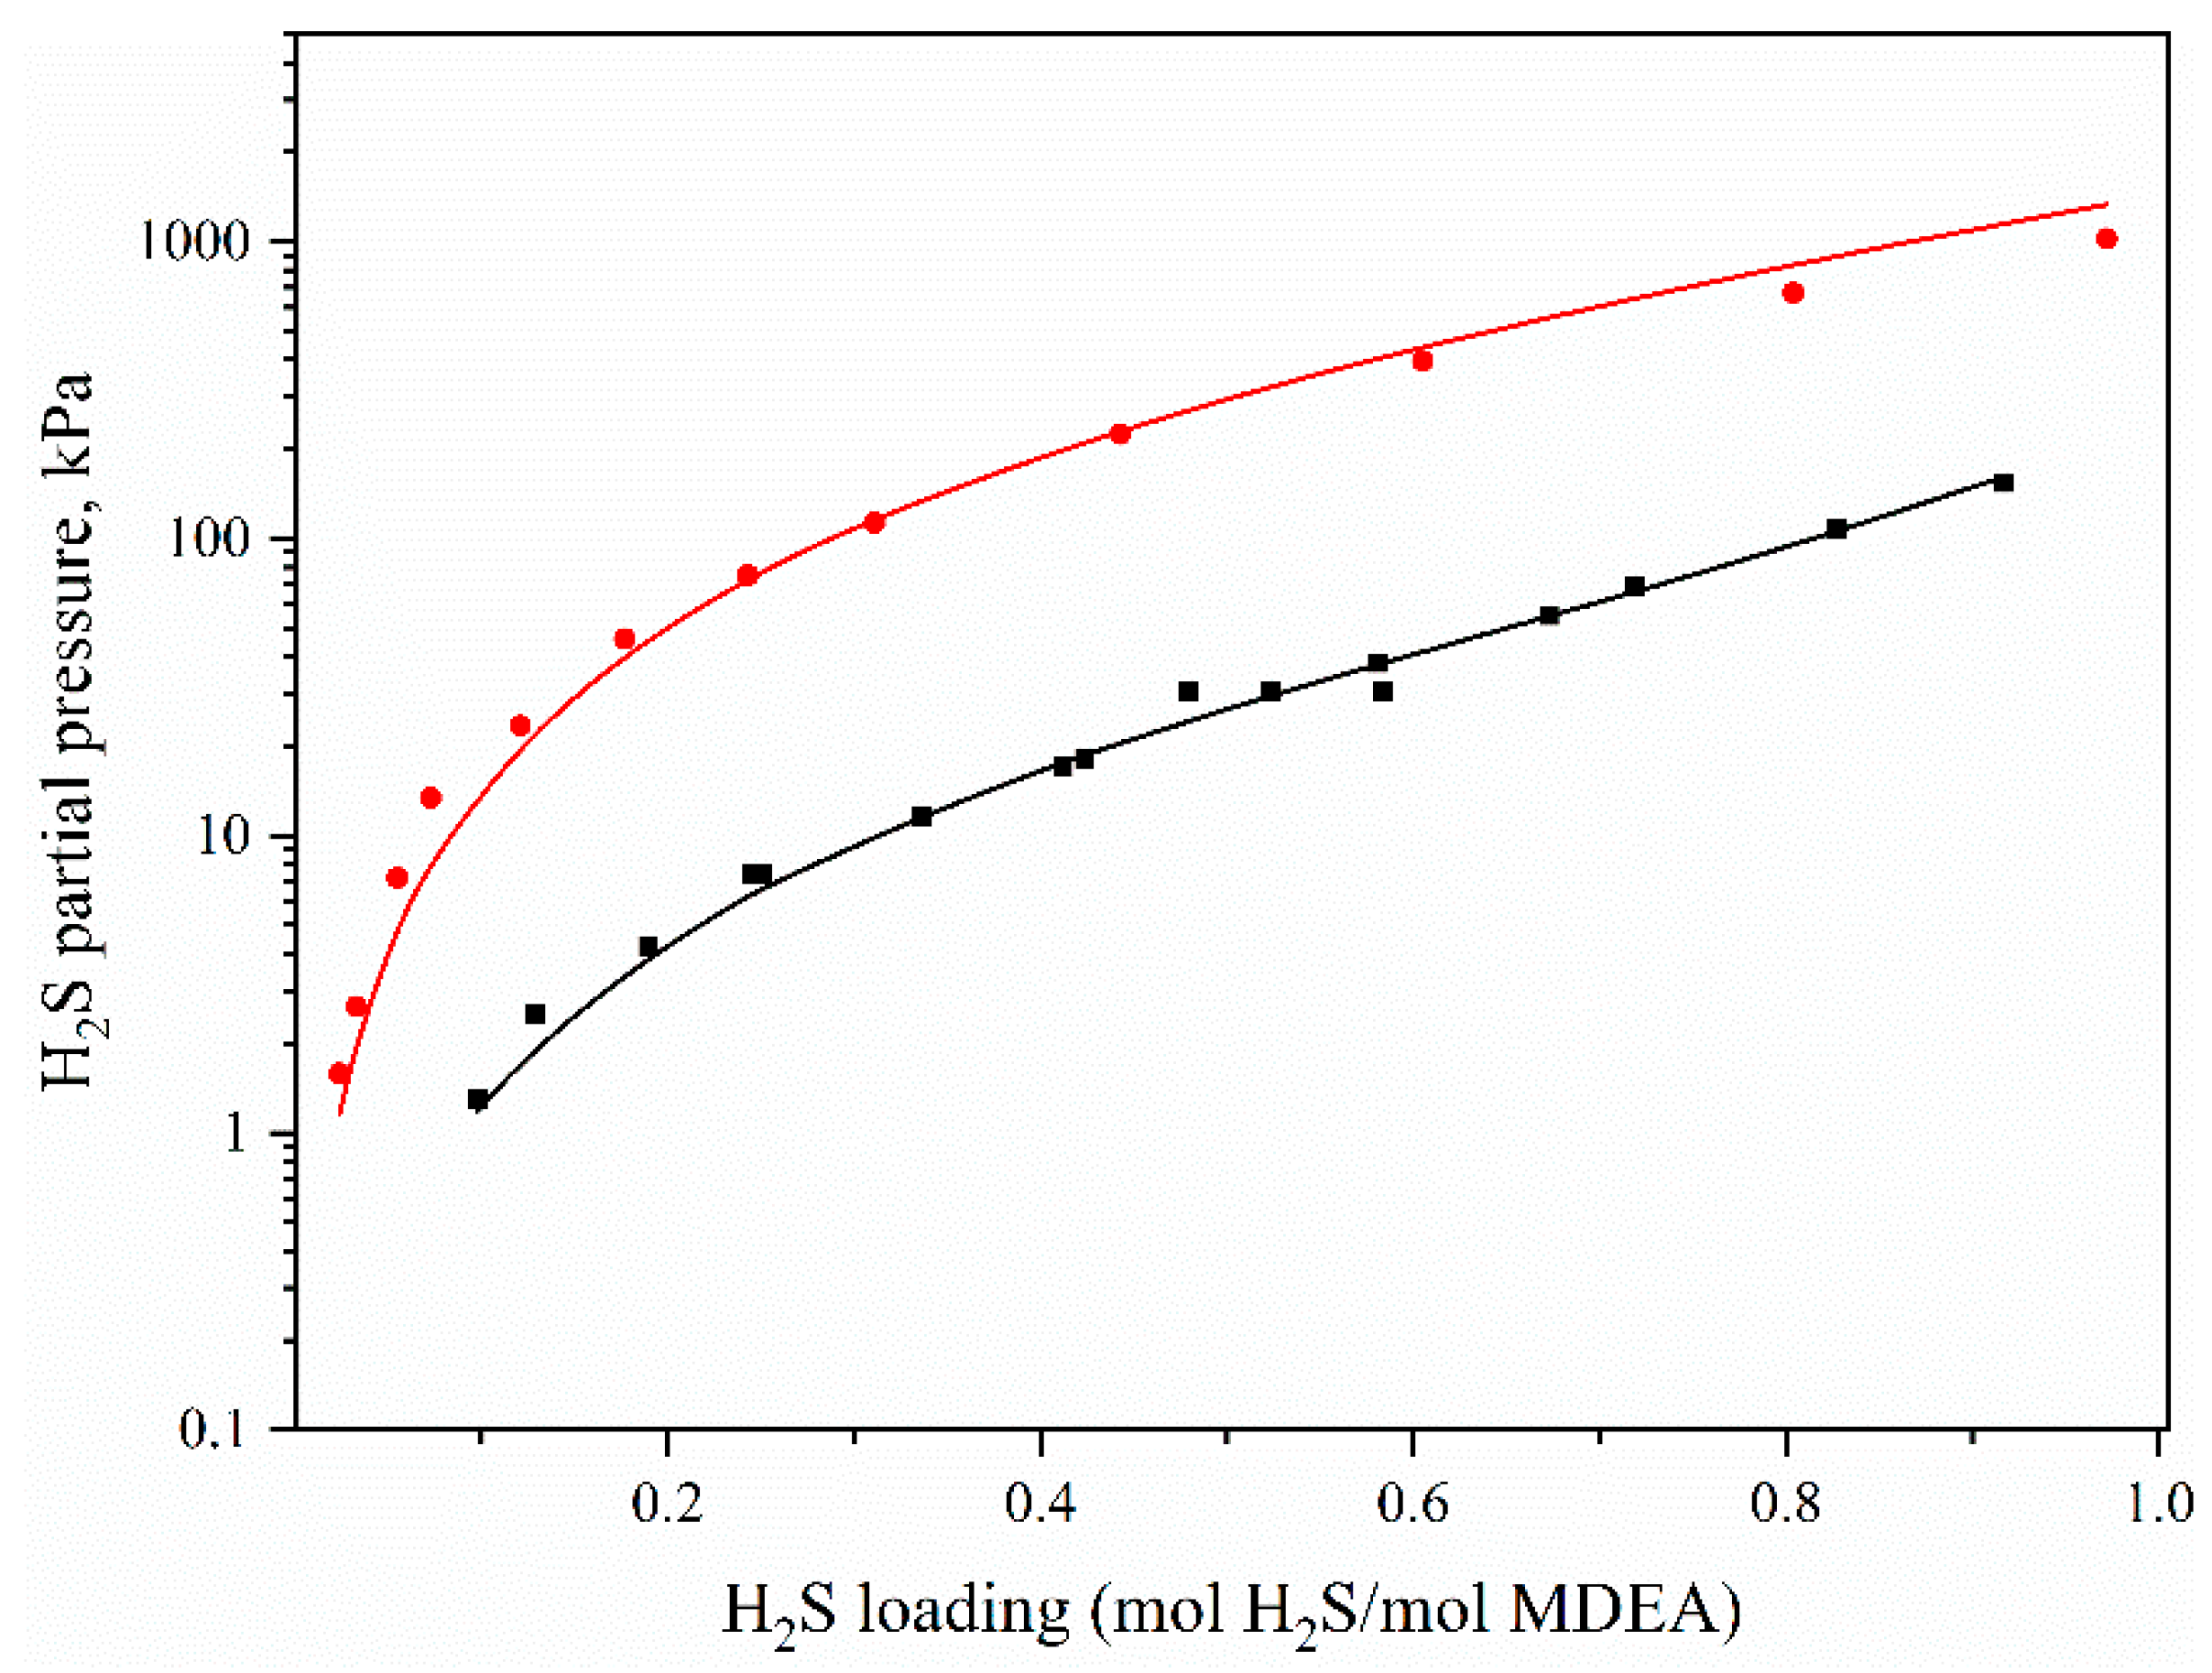
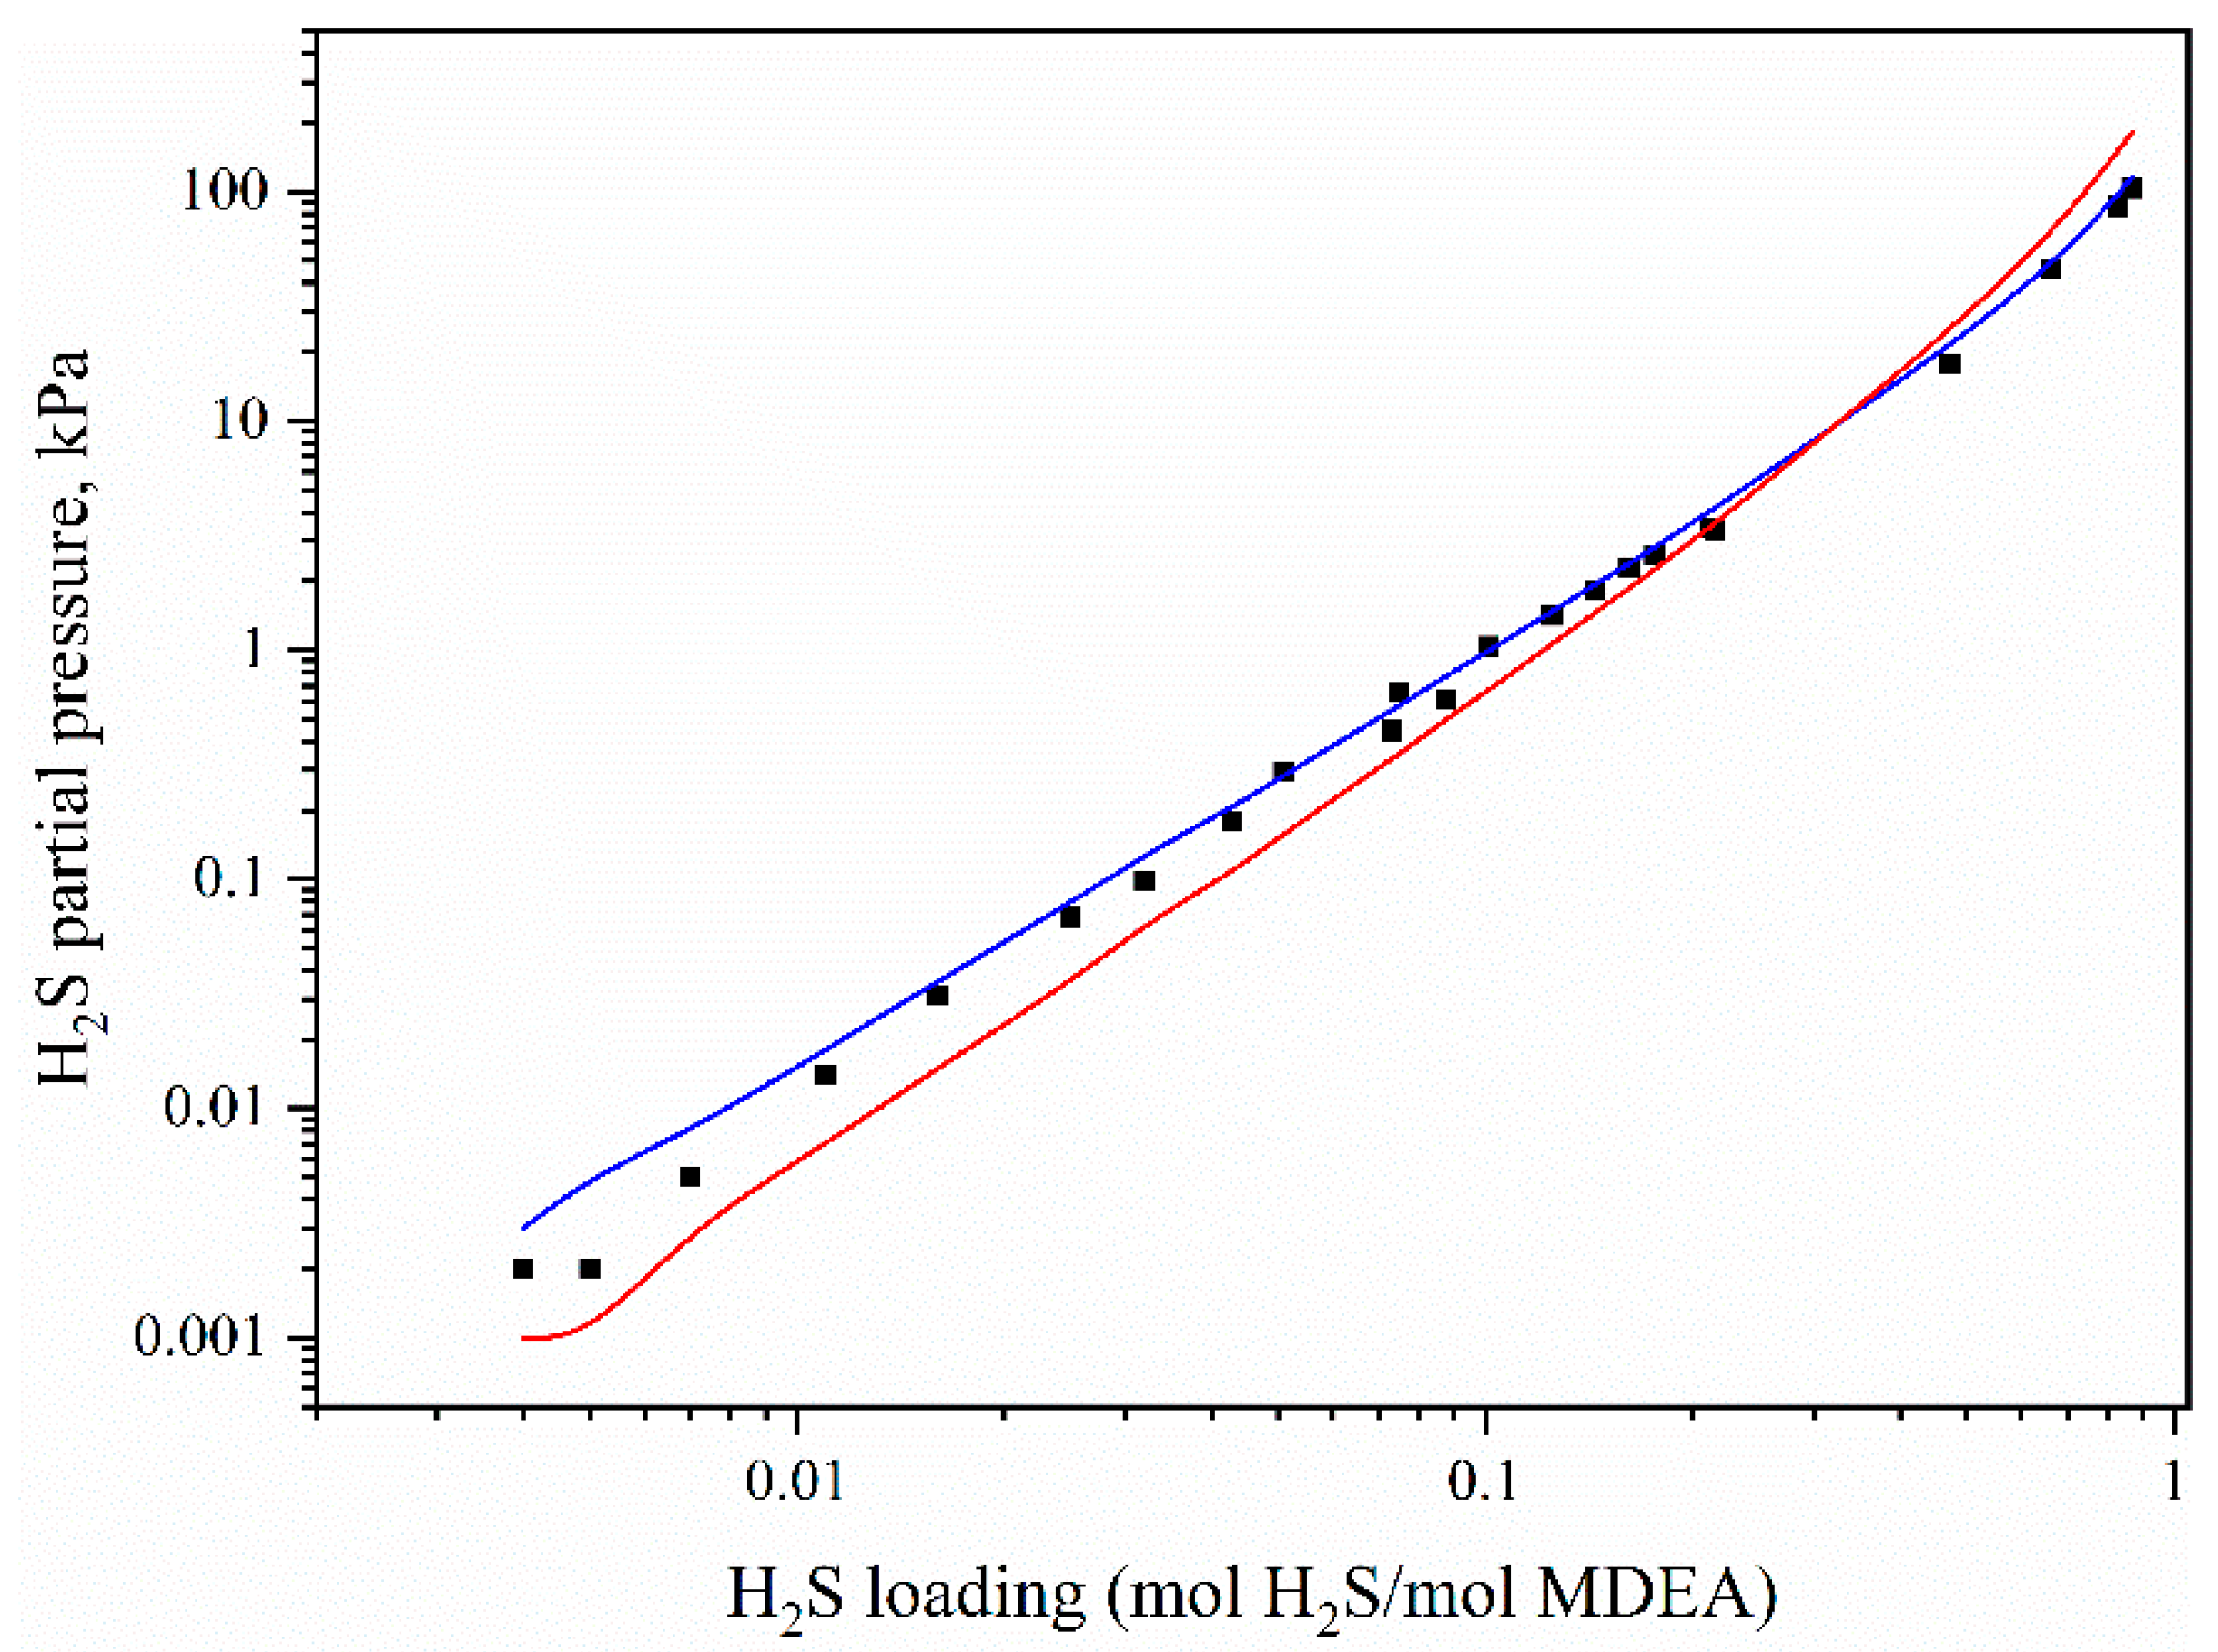
3.1. Thermodynamics Model Validation

An improved thermodynamic model was employed to calculate the solubility and partial pressure of acid components and organic sulfur in the aqueous sulfone-MDEA solution. The experimental data of several systems are employed to verify the accuracy of the thermodynamic model.
Figure 2 and Figure 3 display the experimental and calculated CO2 partial pressure data for the CO2–H2O–MDEA system and H2S partial pressure data for the H2S–H2O–MDEA system at different compositions and different temperatures. As shown, the calculated CO2/H2S partial pressure values are in good agreement with the experimental data reported by the literature [14,43,44,45], thus validating the proposed thermodynamic model. From Figure 2, it is found that the CO2 partial pressure is more sensitive to temperature. With the temperature increasing from 313.15 K to 338.75 K, the CO2 partial pressure experiences a significant increase. However, the MDEA mass fraction seems to have little effect on the CO2 partial pressure when the temperature is 313.15 K. Figure 3 shows the comparison of experimental data and calculated data in terms of H2S partial pressure for the H2S–H2O–MDEA system. As shown, the proposed thermodynamic model is also effective and robust. This means that the improved thermodynamic model has good applicability.
When compared with an aqueous amine solution, an aqueous sulfone–amine solution is more effective, especially for raw gas with high organic sulfur content. A common sulfone–amine solution is composed of MDEA, sulfolane, and water. Herein, two systems, namely the CO2–H2O–sulfolane–MDEA system and the H2S–H2O–sulfolane–MDEA system, are used to validate the thermodynamic model. The comparison results of the calculated values and experimental data in terms of CO2/H2S partial pressure are given in Figure 4 and Figure 5. As shown, the calculated results agree well with the experimental data in terms of CO2/H2S partial pressure. Generally, the addition of sulfolane is beneficial to enhancing the absorption of acidic gases, and therefore, high acidic gas loading is observed at low partial pressure. When compared with Figure 4 and Figure 5, it can be found that H2S has a higher solubility than CO2 in the H2O–sulfolane–MDEA solution.
In order to further verify the reliability of the thermodynamic model, some CO2 and H2S partial pressure data calculated in this paper are compared with the values calculated with reaction parameters proposed by Austgen et al. [36]. The average relative deviations of the partial pressure data of CO2 and H2S calculated in this paper are 10.7% and 24.4%, respectively, while the average relative deviations of the partial pressure data calculated with reaction parameters proposed by Austgen et al. [36] are 38.1% and 36.8%, respectively. The calculated results using the improved thermodynamic model are not only in good agreement with the experimental data but also better than the calculated values of the existing models in the literature (see Figure 6 and Figure 7). This is because we refitted the exponents of the equilibrium equations of reactions (4) and (5) and calculated the reaction equilibrium constants with the new parameters in Table 2.
To verify the prediction performance of the improved thermodynamic model on the partial pressure data of CH3SH in the system, the calculated value of the model is compared with the value measured by Jou et al. [15] in Figure 8. It can be seen that the predicted CH3SH partial pressure data are in good agreement with the experimental value. This shows that the improved thermodynamic model not only has higher prediction accuracy but also has a larger application range.
In short, the proposed thermodynamic model has strong applicability, and its accuracy has been verified by various experimental data. In this study, the thermodynamic model is employed to calculate the solubility and partial pressure of acid components and organic sulfur in the aqueous sulfone–MDEA solution.

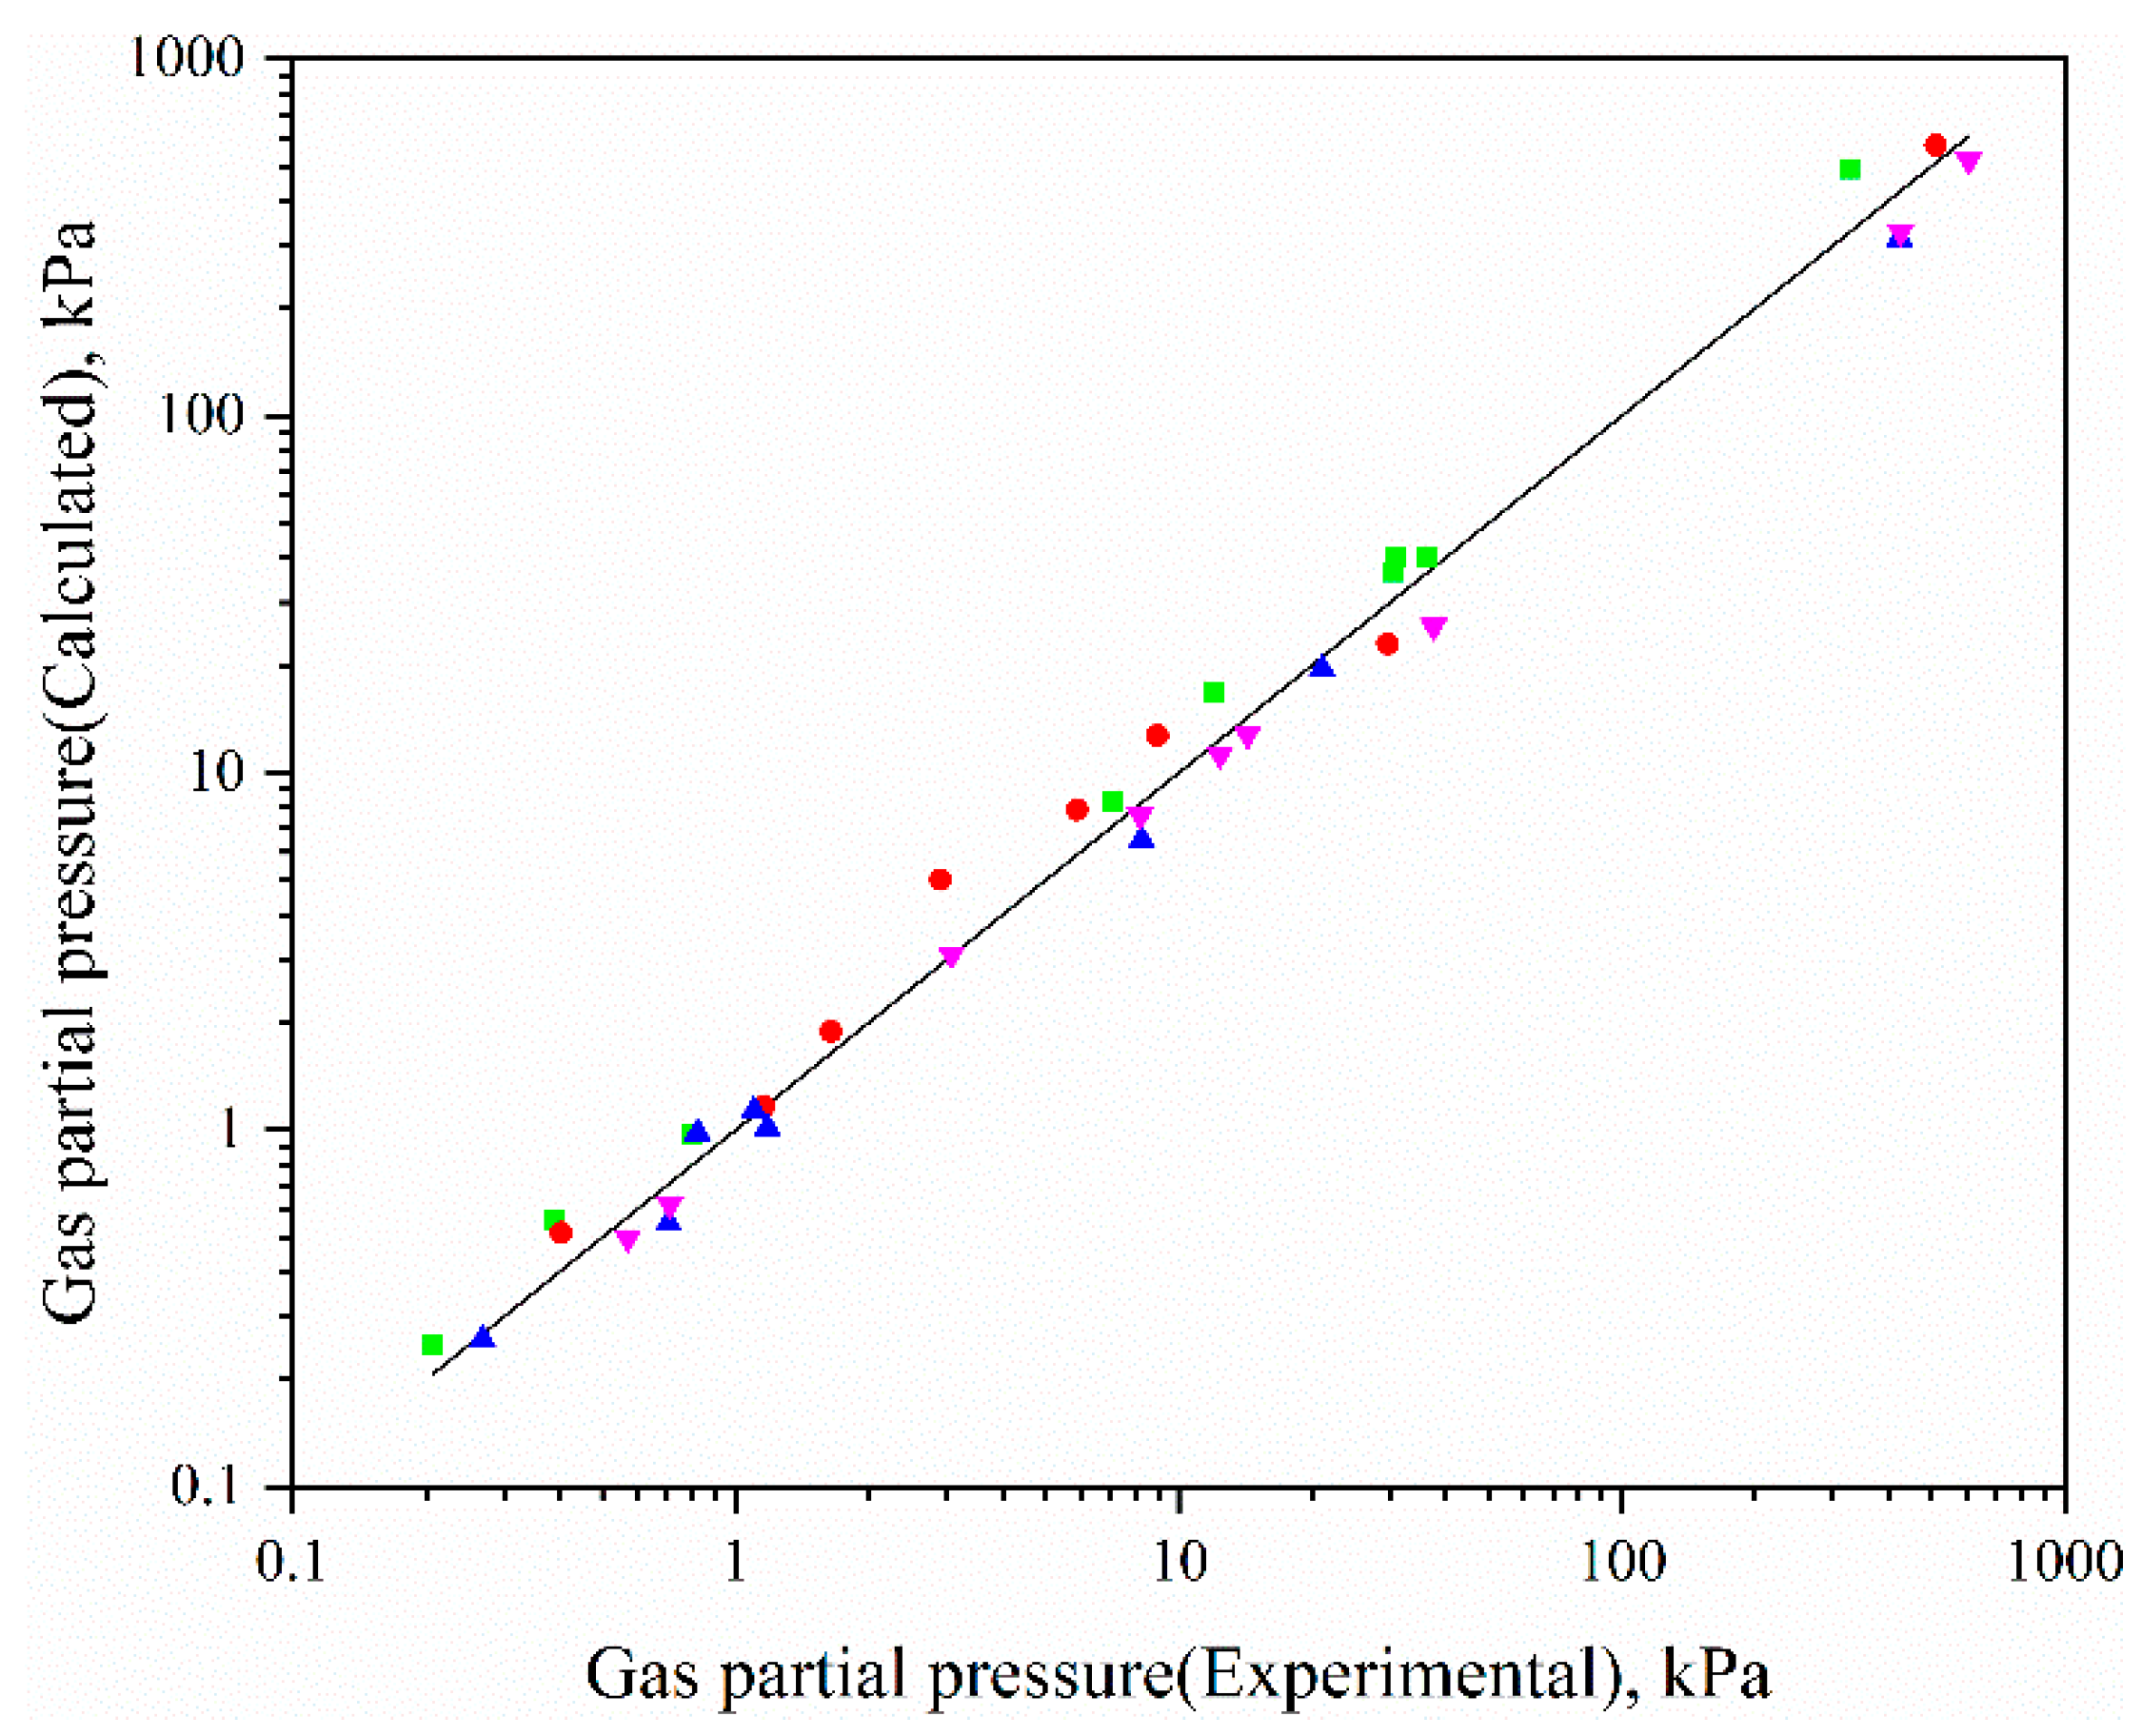
3.2. Rate-Based Absorption Model Validation

Before the rate-based model is applied to investigate the absorption process, its accuracy must be verified. The data were collected on an industrial sieve plate tower of 3.4 m in diameter with a mixed solvent comprising 20 wt% H2O, 40 wt% sulfolane, and 40 wt% MDEA. The tower was operated under a different number of plates (22, 26, and 30) and overflow weir heights (0.1 and 0.15 m). The Inlet gas–liquid ratio (vol./vol.) was adjusted from 490.2 to 720.0. CO2 and H2S loading were varied from 4.11vol% to 4.73 vol% and 1.34 vol% to 1.57 vol%, respectively. The concentration of CH3HS and COS were changed from 14.12 to 25.41 mg/m3 and 11.18 to 34.58 mg/m3, respectively. As shown in Table 3, the simulation results of removal efficiency for absorption components are in good agreement with the data from the industrial absorber. For CO2, COS, and CH3SH, the average relative errors are only 3.3%, 3.0%, and 4.1%, respectively. Therefore, the rationality of the absorption model can be confirmed.

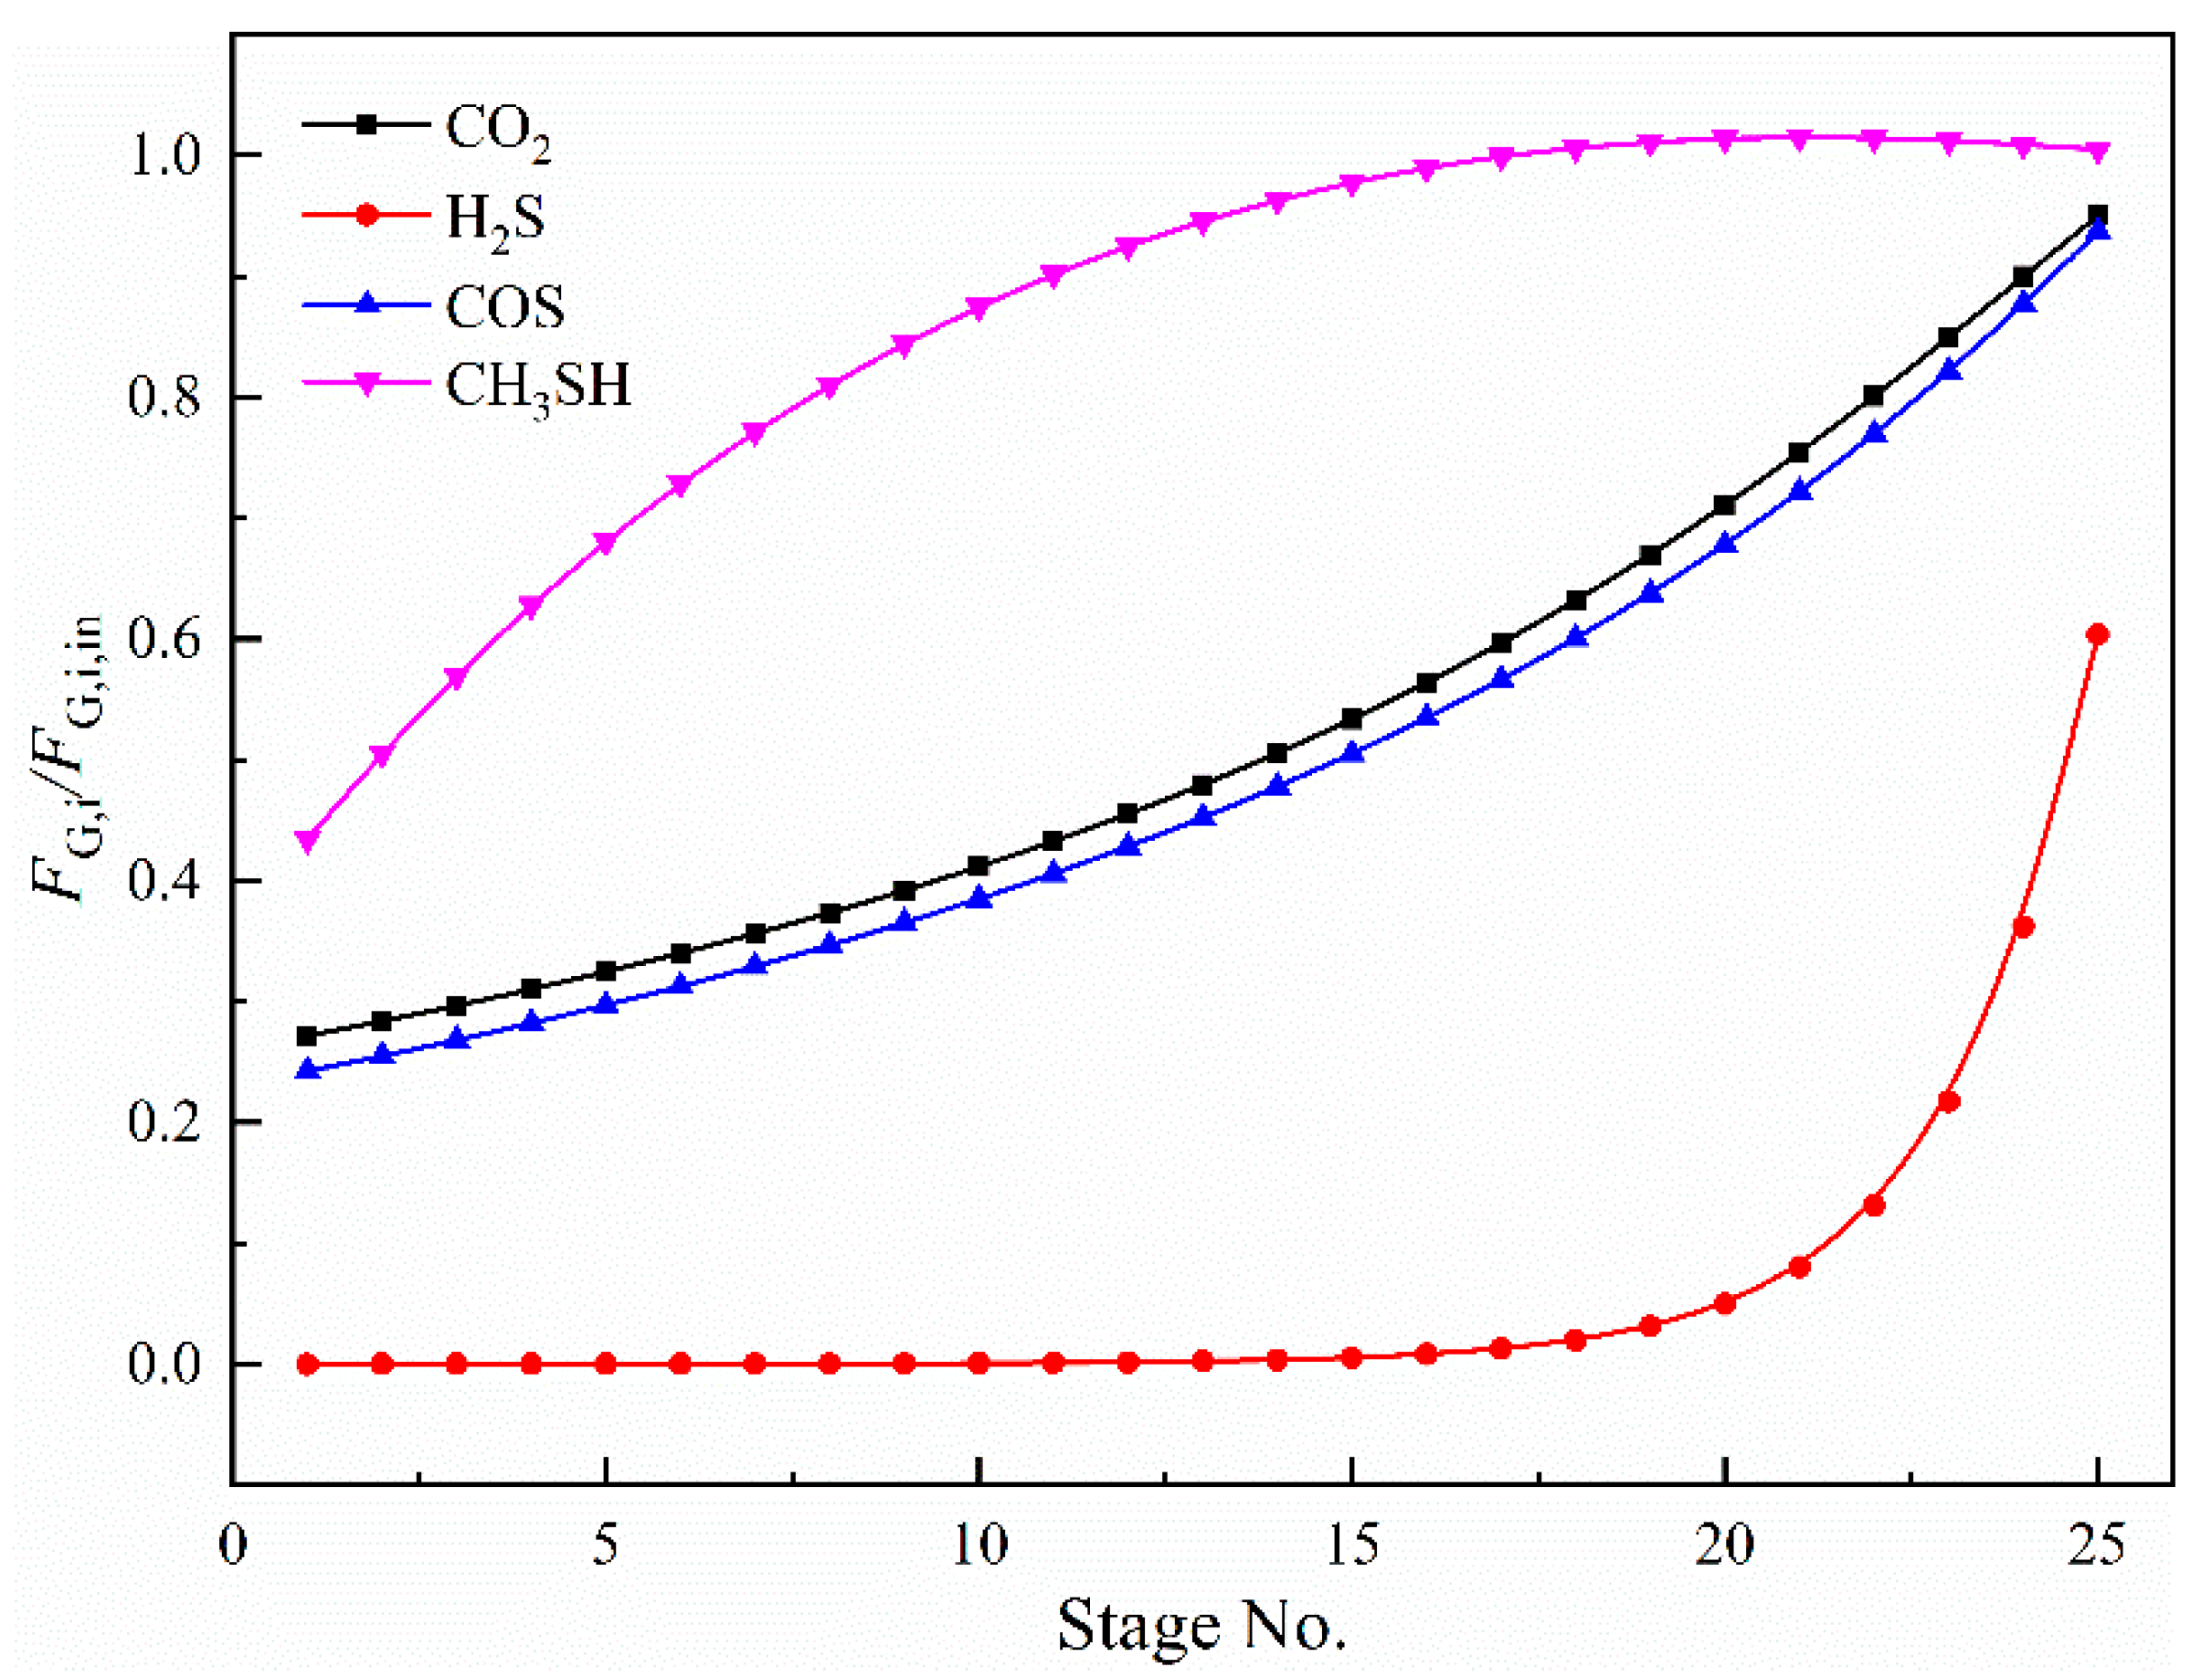
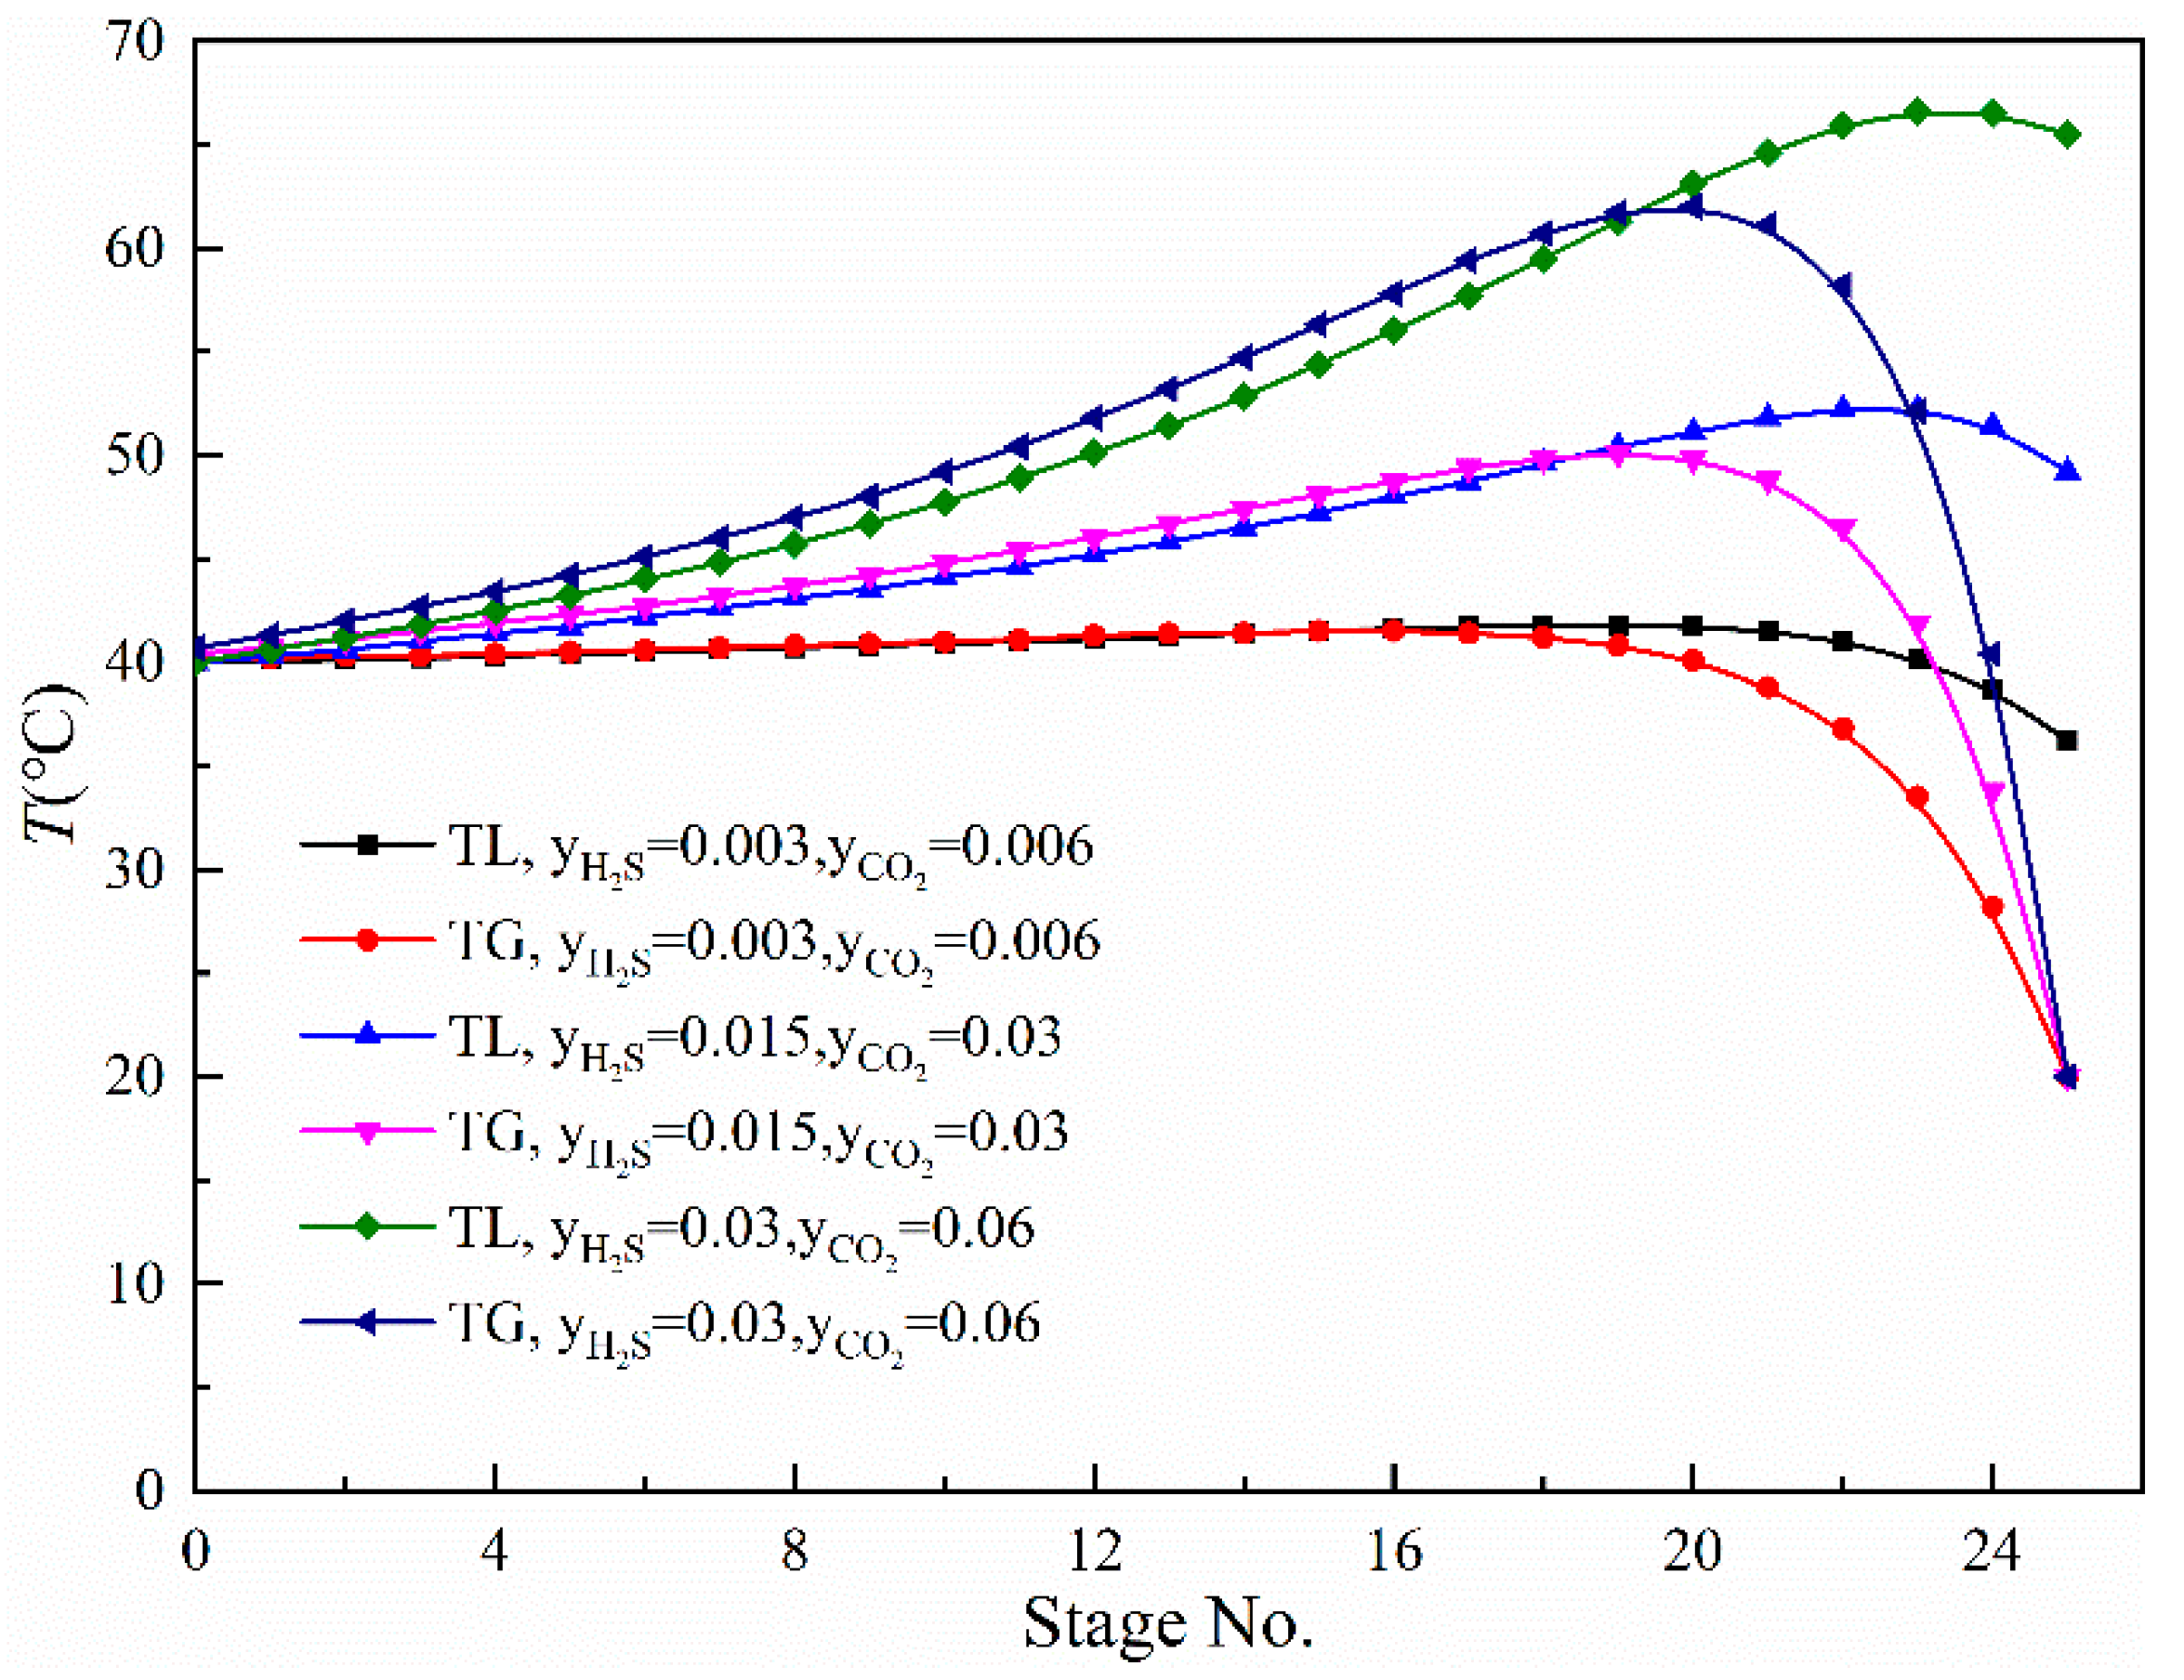
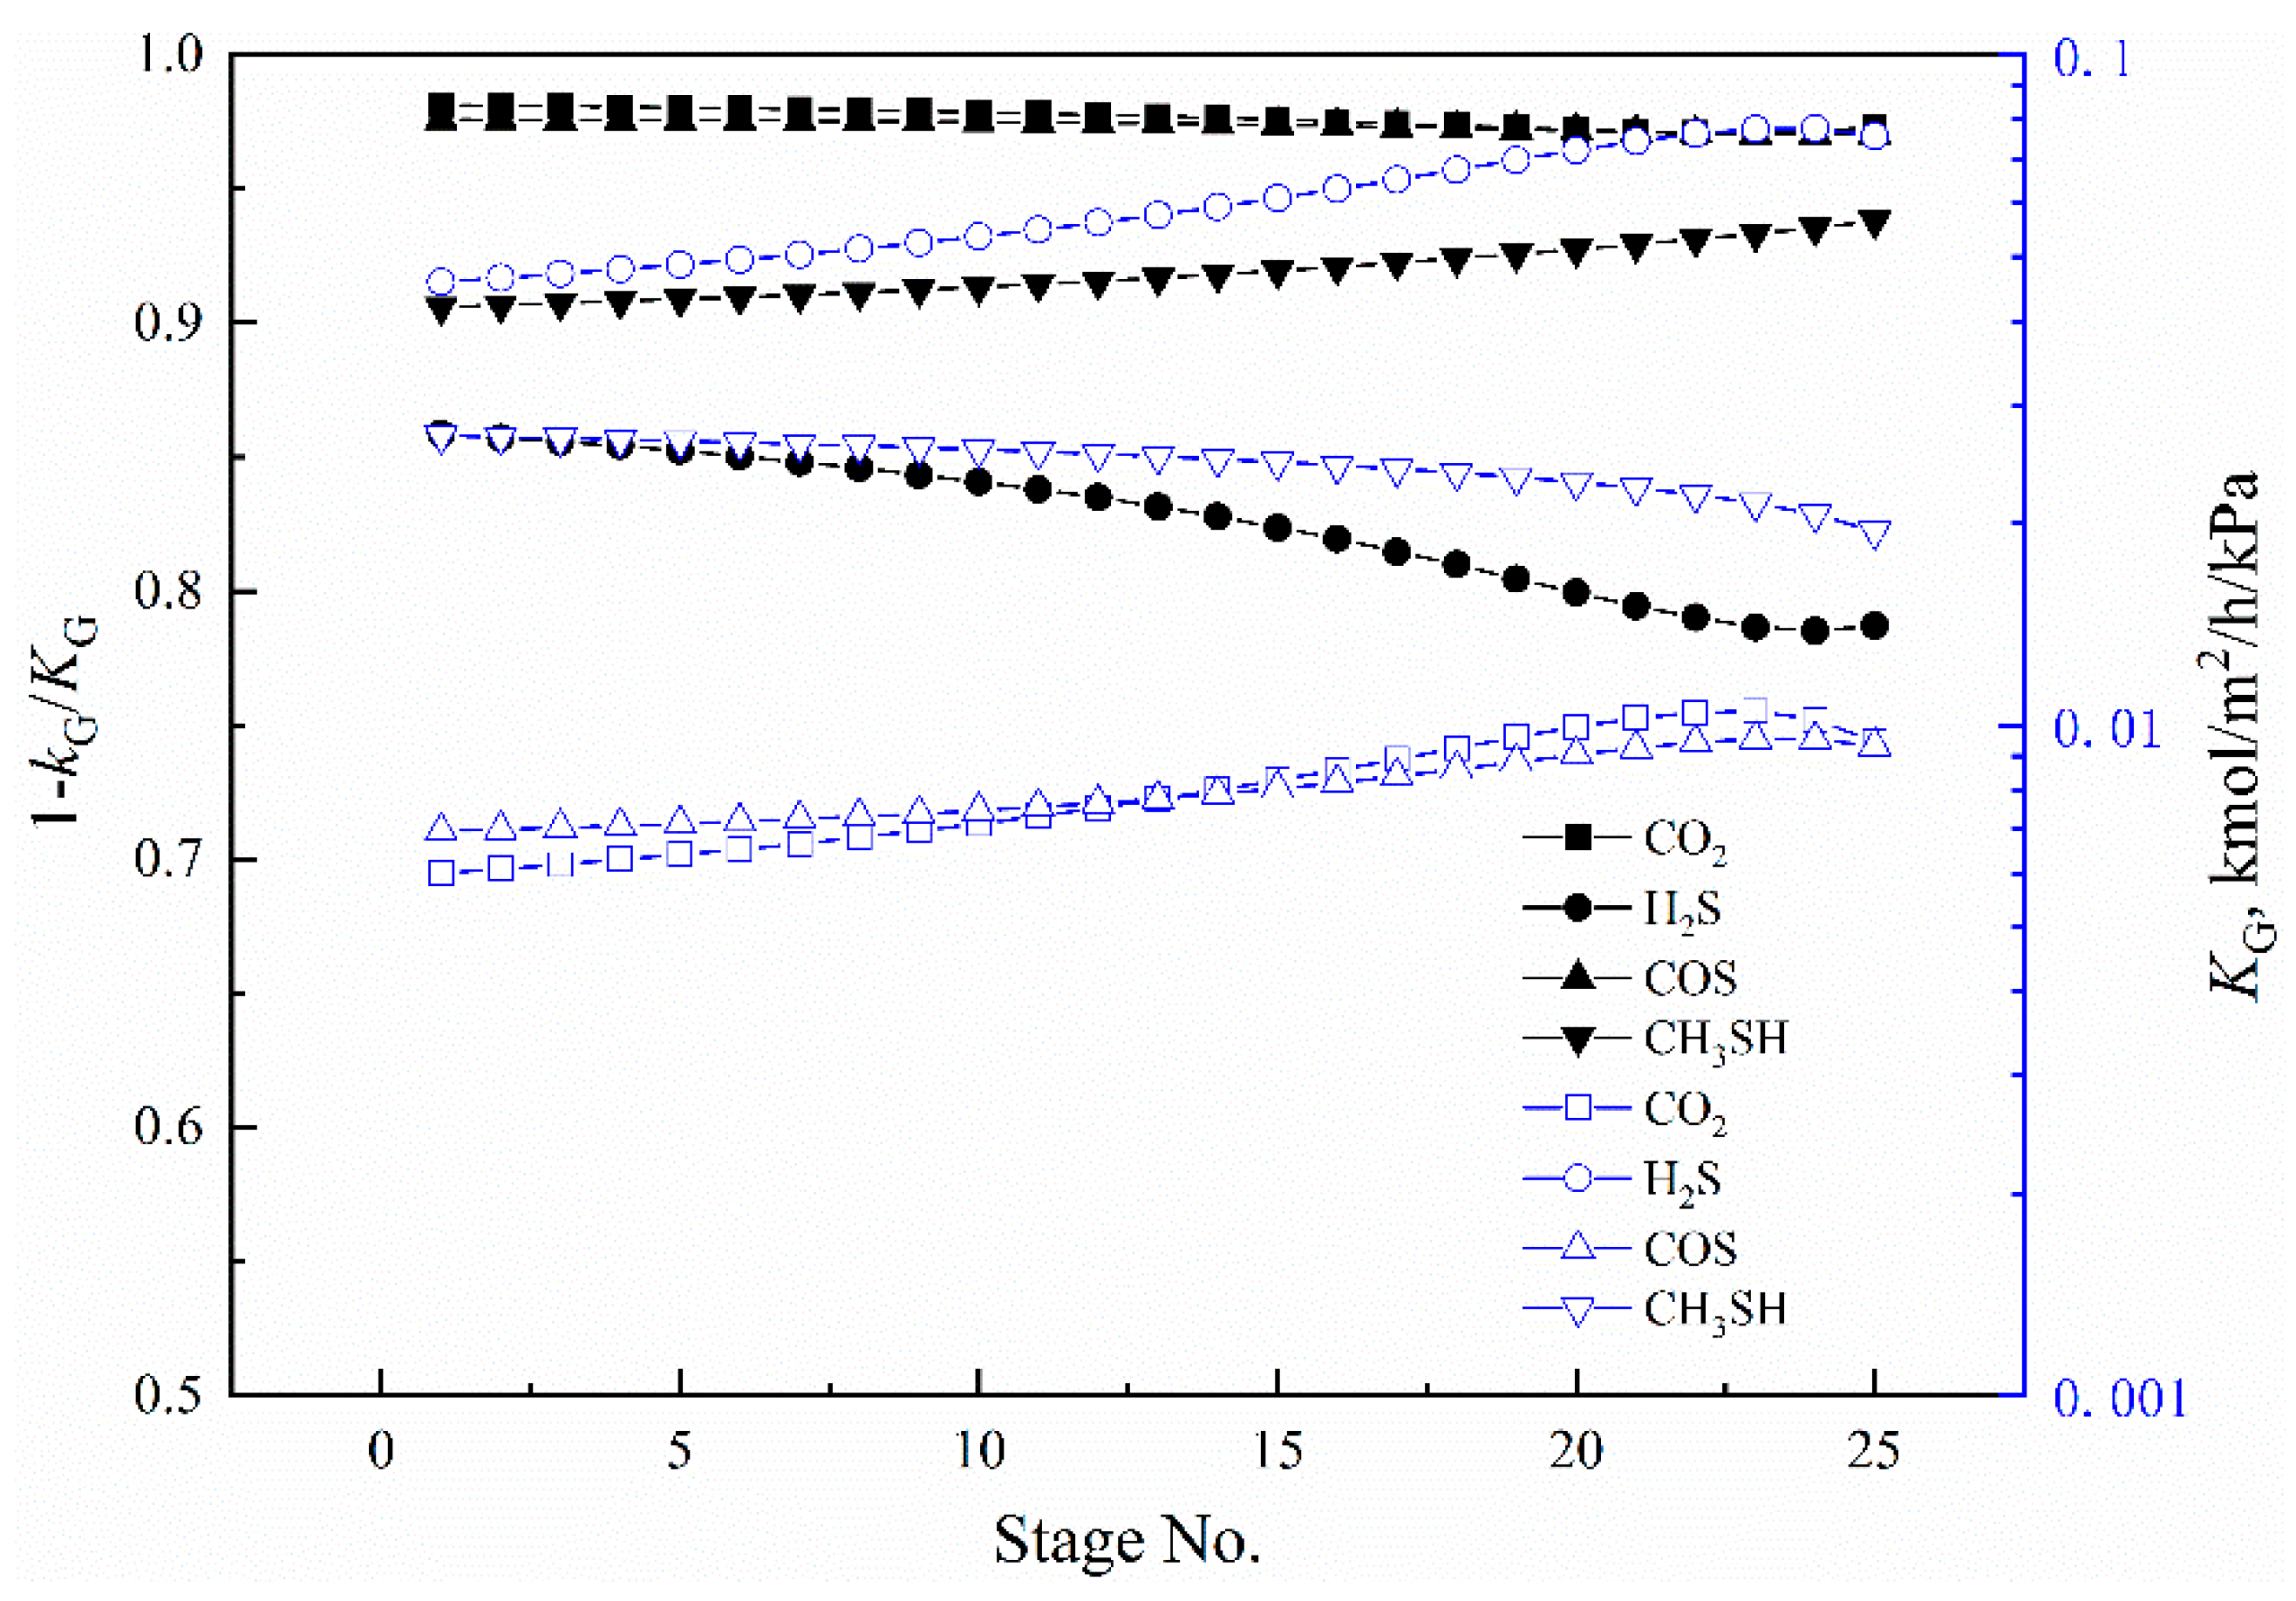
3.3. Rate-Based Absorption Model Calculation

The specifications and operating parameters of the absorption column are summarized in Table 4, and the mass fractions of H2O, sulfolane, and MDEA in the mixed solvent are 0.20, 0.40, and 0.40, respectively. The parameters of the absorber are obtained from (the desulfurizing column of) PetroChina Southwest Oil and Gasfield Company, and the operating parameters are obtained by analyzing the operating parameters of typical industrial absorbers and by making appropriate extensions.
The concentration profile of each component and the gas–liquid temperature profile are also obtained. As shown in Figure 9, the absorption rate of H2S is fast, and the concentration of H2S in the feed gas drops rapidly after entering the absorption column; it is completely removed in the middle of the column. This is the result of the synergistic effect of physical absorption and chemical reaction. However, the absorption rate of CH3SH is low. After the feed gas enters the column, the concentration of CH3SH decreases slowly and the final removal rate is low. The main reason for this is that the physical adsorption and absorption processes are controlled by equilibrium.
Physical absorption and chemical reactions are usually accompanied by a thermal effect, which changes the system temperature and, in turn, affects the absorption of components. Therefore, the temperature of the absorber column needs to be strictly controlled. Figure 10 shows the gas and liquid phase temperatures in the column at different concentrations of H2S and CO2. It can be seen that the gas phase and the liquid phase exchange heat in the column, and as the concentration of H2S and CO2 increases, the heat release during the absorption process increases, resulting in an increase in the outlet temperature of the liquid phase at the top of the column. When the feed composition is the same, the H2S is completely absorbed in the middle section of the column, and then the heat release is rapidly reduced, resulting in a rapid drop in the gas phase temperature at the top of the column.
The calculated total mass transfer coefficient and mass transfer resistance of each solute component at different column positions are shown in Figure 11.
For CO2 and COS, the gas mass transfer resistance can almost be ignored. In the whole absorption column, the gas mass transfer coefficient is less than 0.01 kmol/m2/kPa. For H2S, however, the gas mass transfer coefficient is almost ten times greater than that of CO2 and COS. Additionally, the liquid mass transfer coefficient of H2S is also much higher than that of CO2 and COS, accounting for 15–25% of the total mass transfer resistance, so the gas-side mass transfer resistance cannot be ignored. The gas-side mass transfer resistance of CH3SH accounts for 5–10% of the total mass transfer resistance, which also needs to be considered in the calculation process. This is consistent with the calculation method of the absorption model.
Based on the mass transfer characteristics analysis, the rate-limiting steps of absorption processes for different components can be clarified. Furthermore, it is helpful to simplify the model calculation.

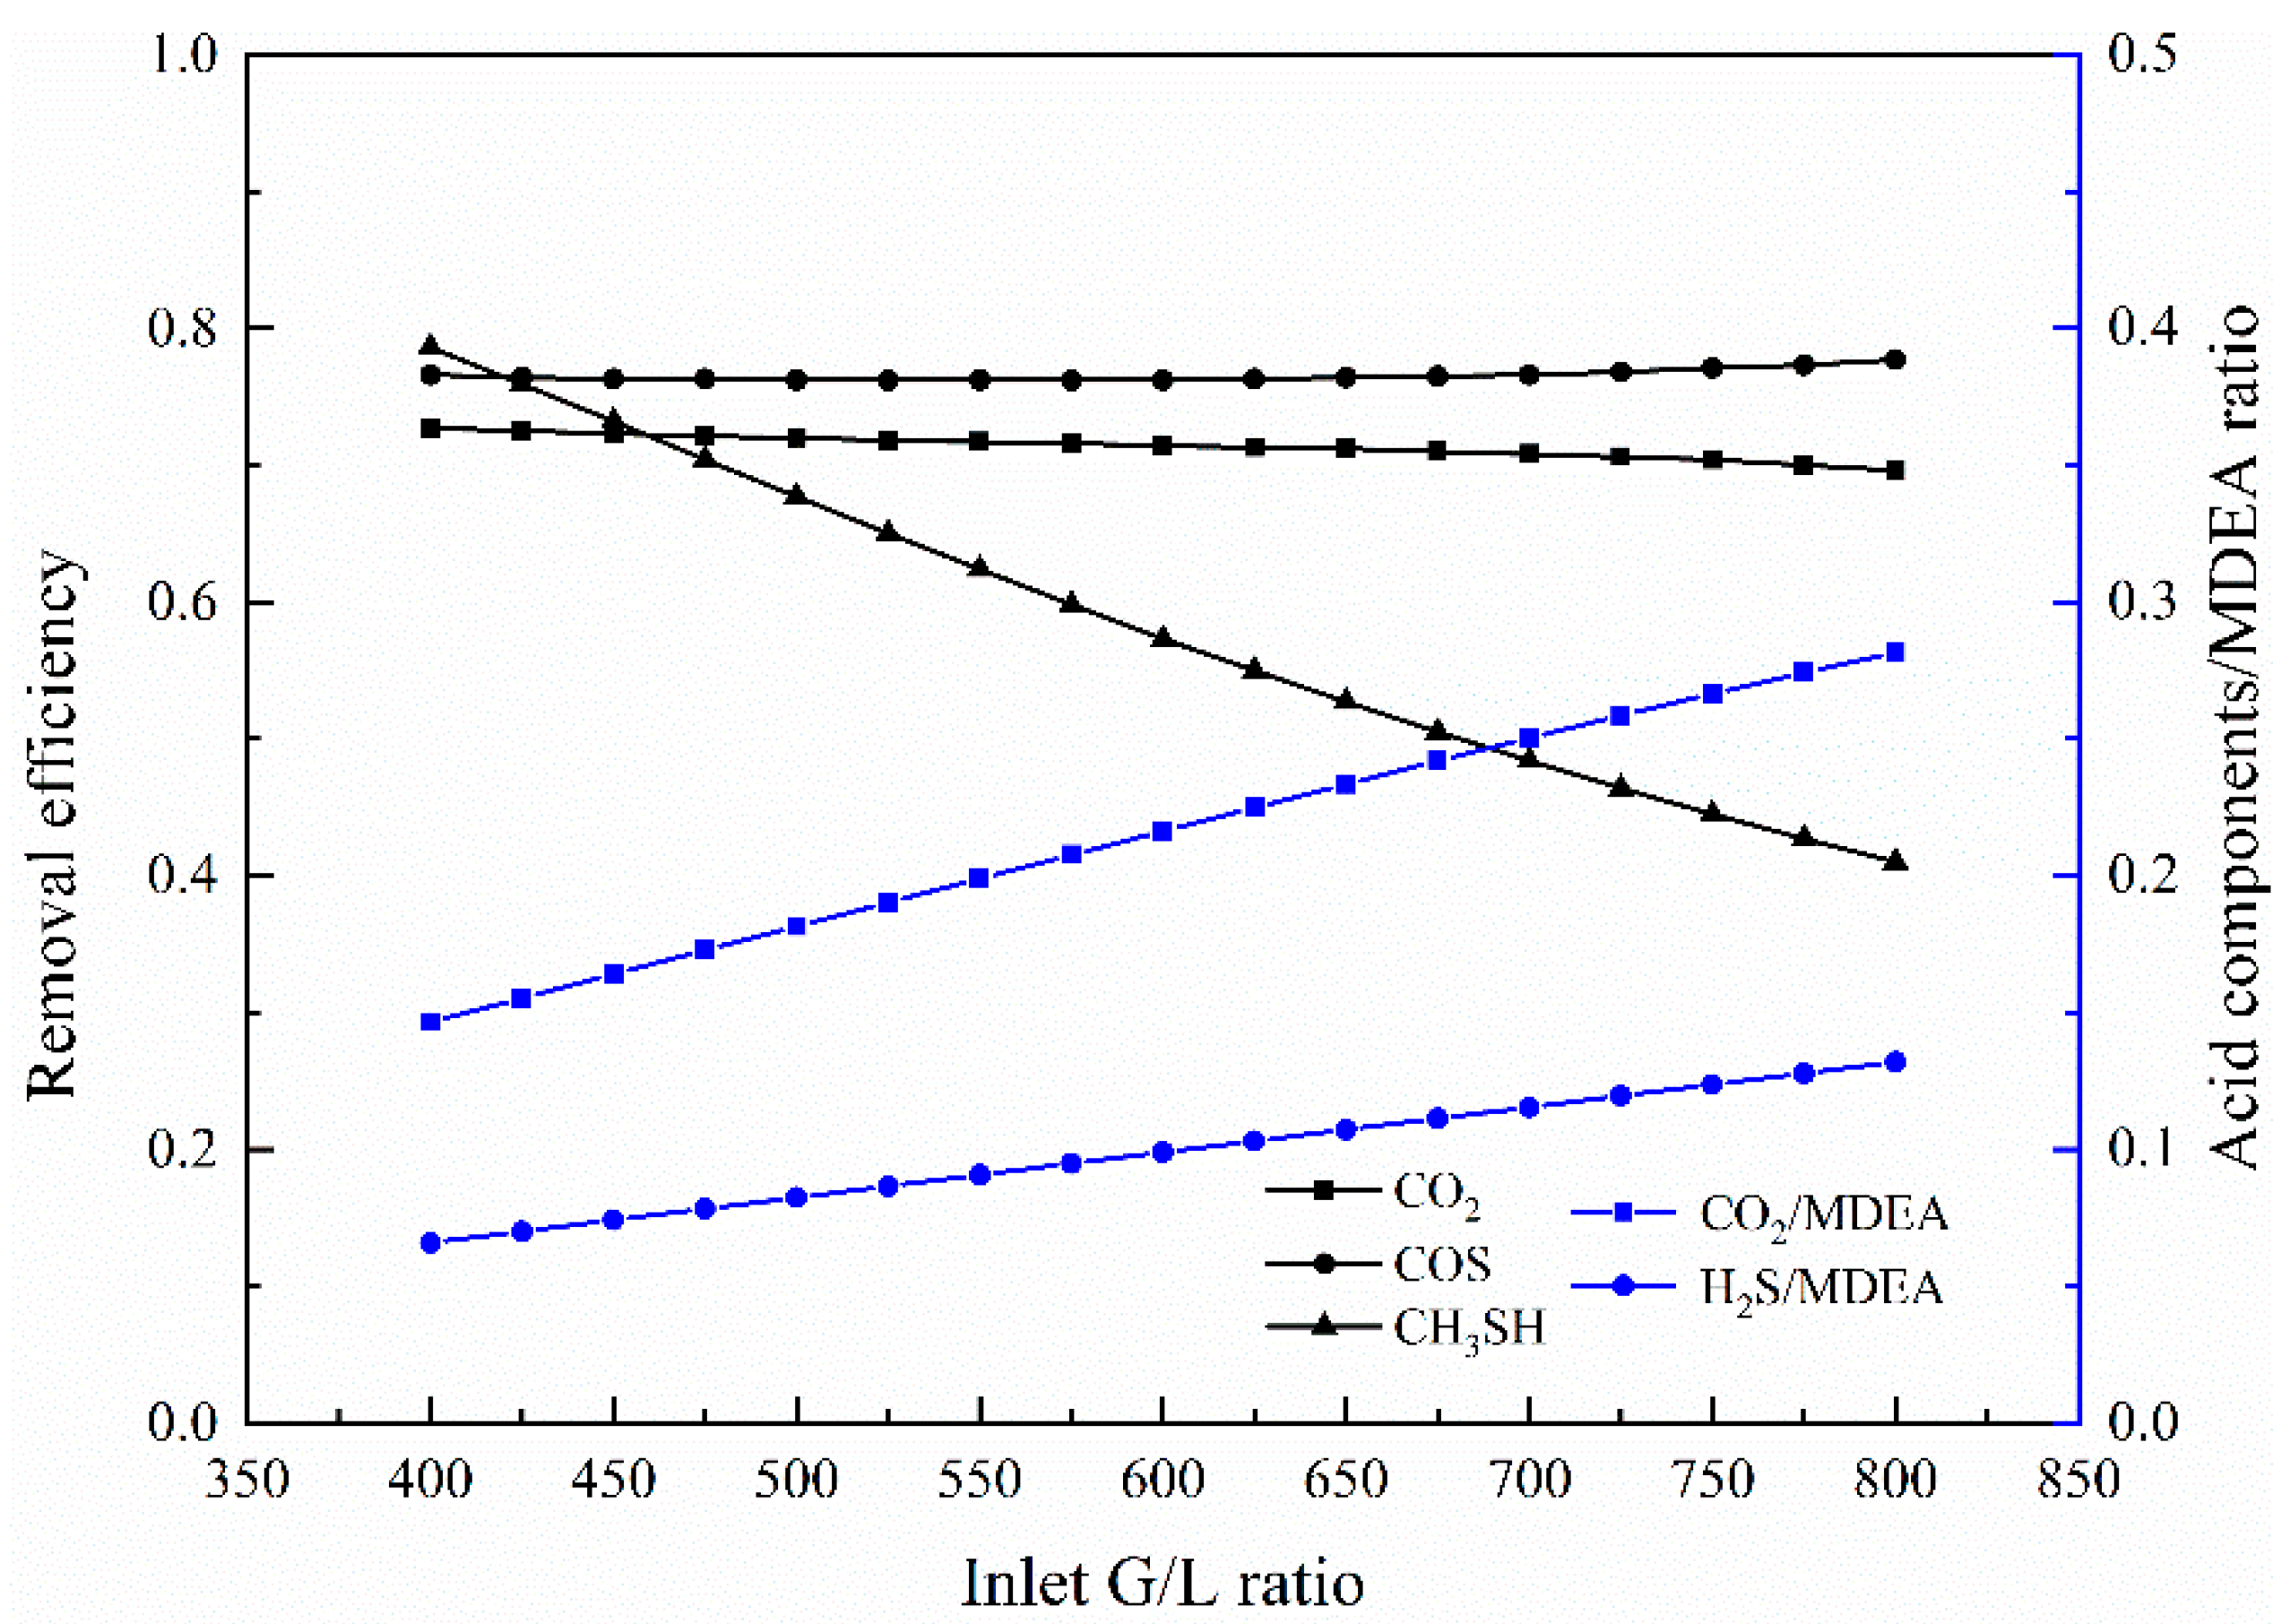
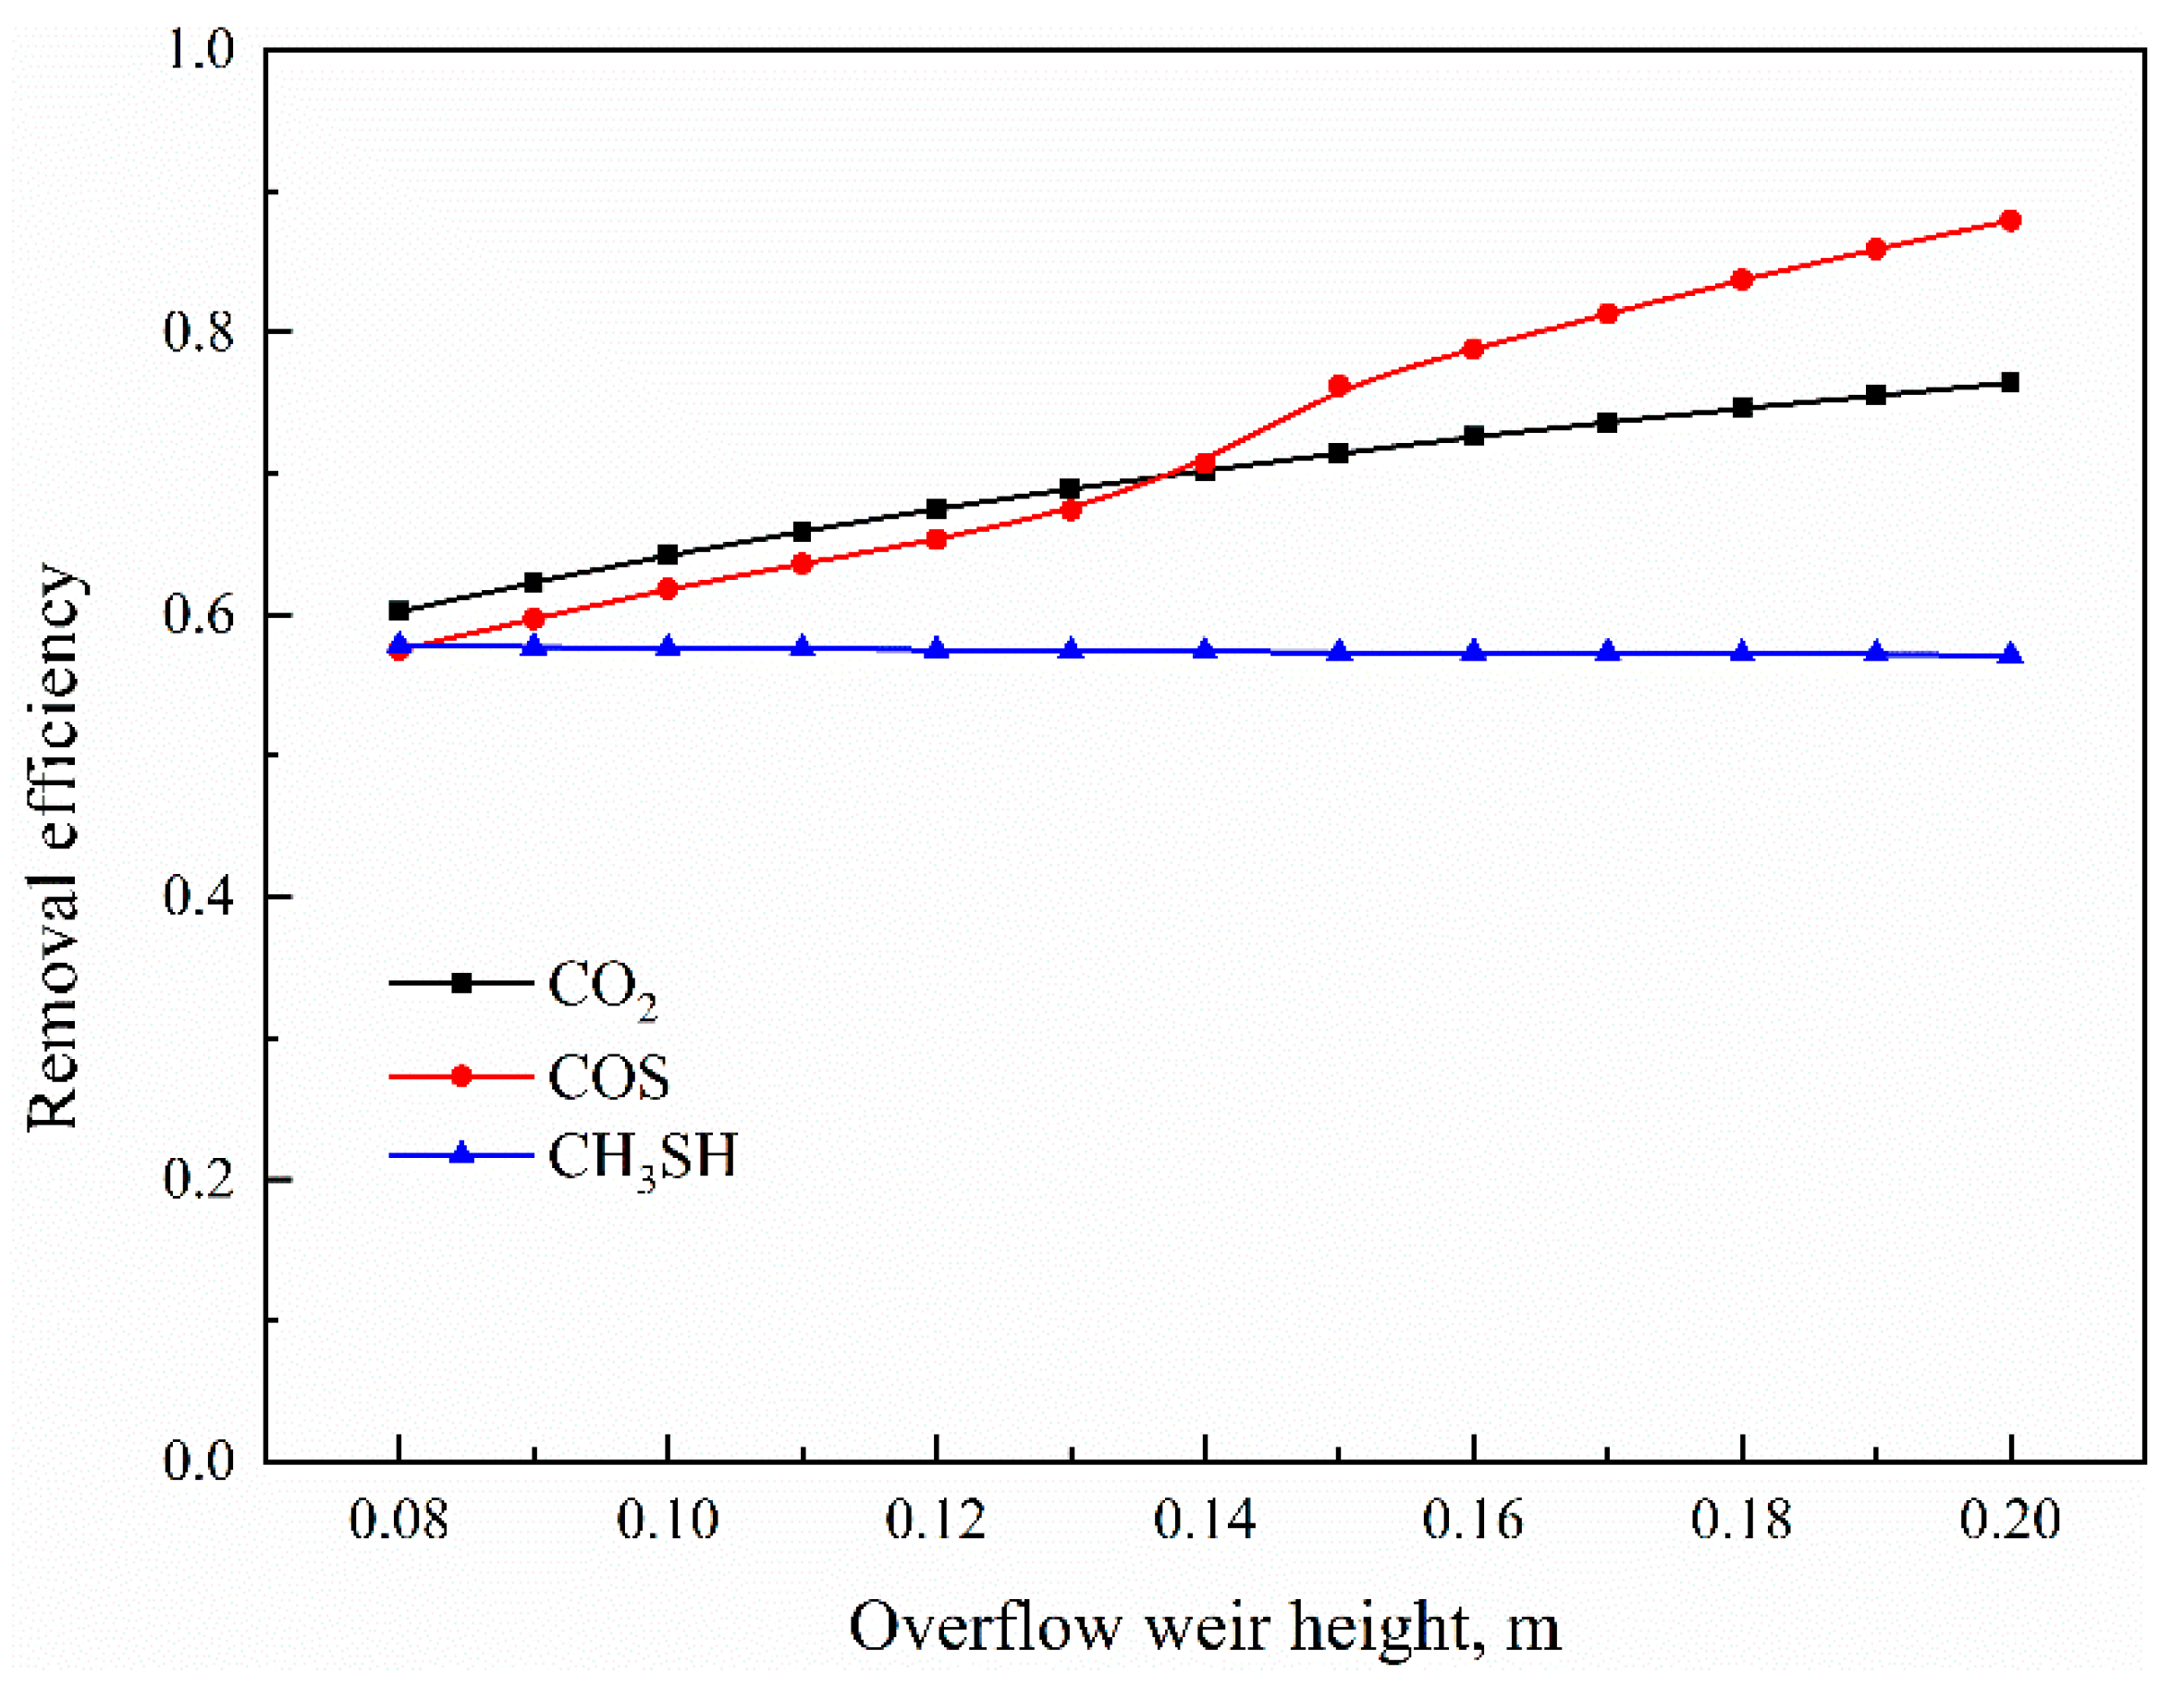
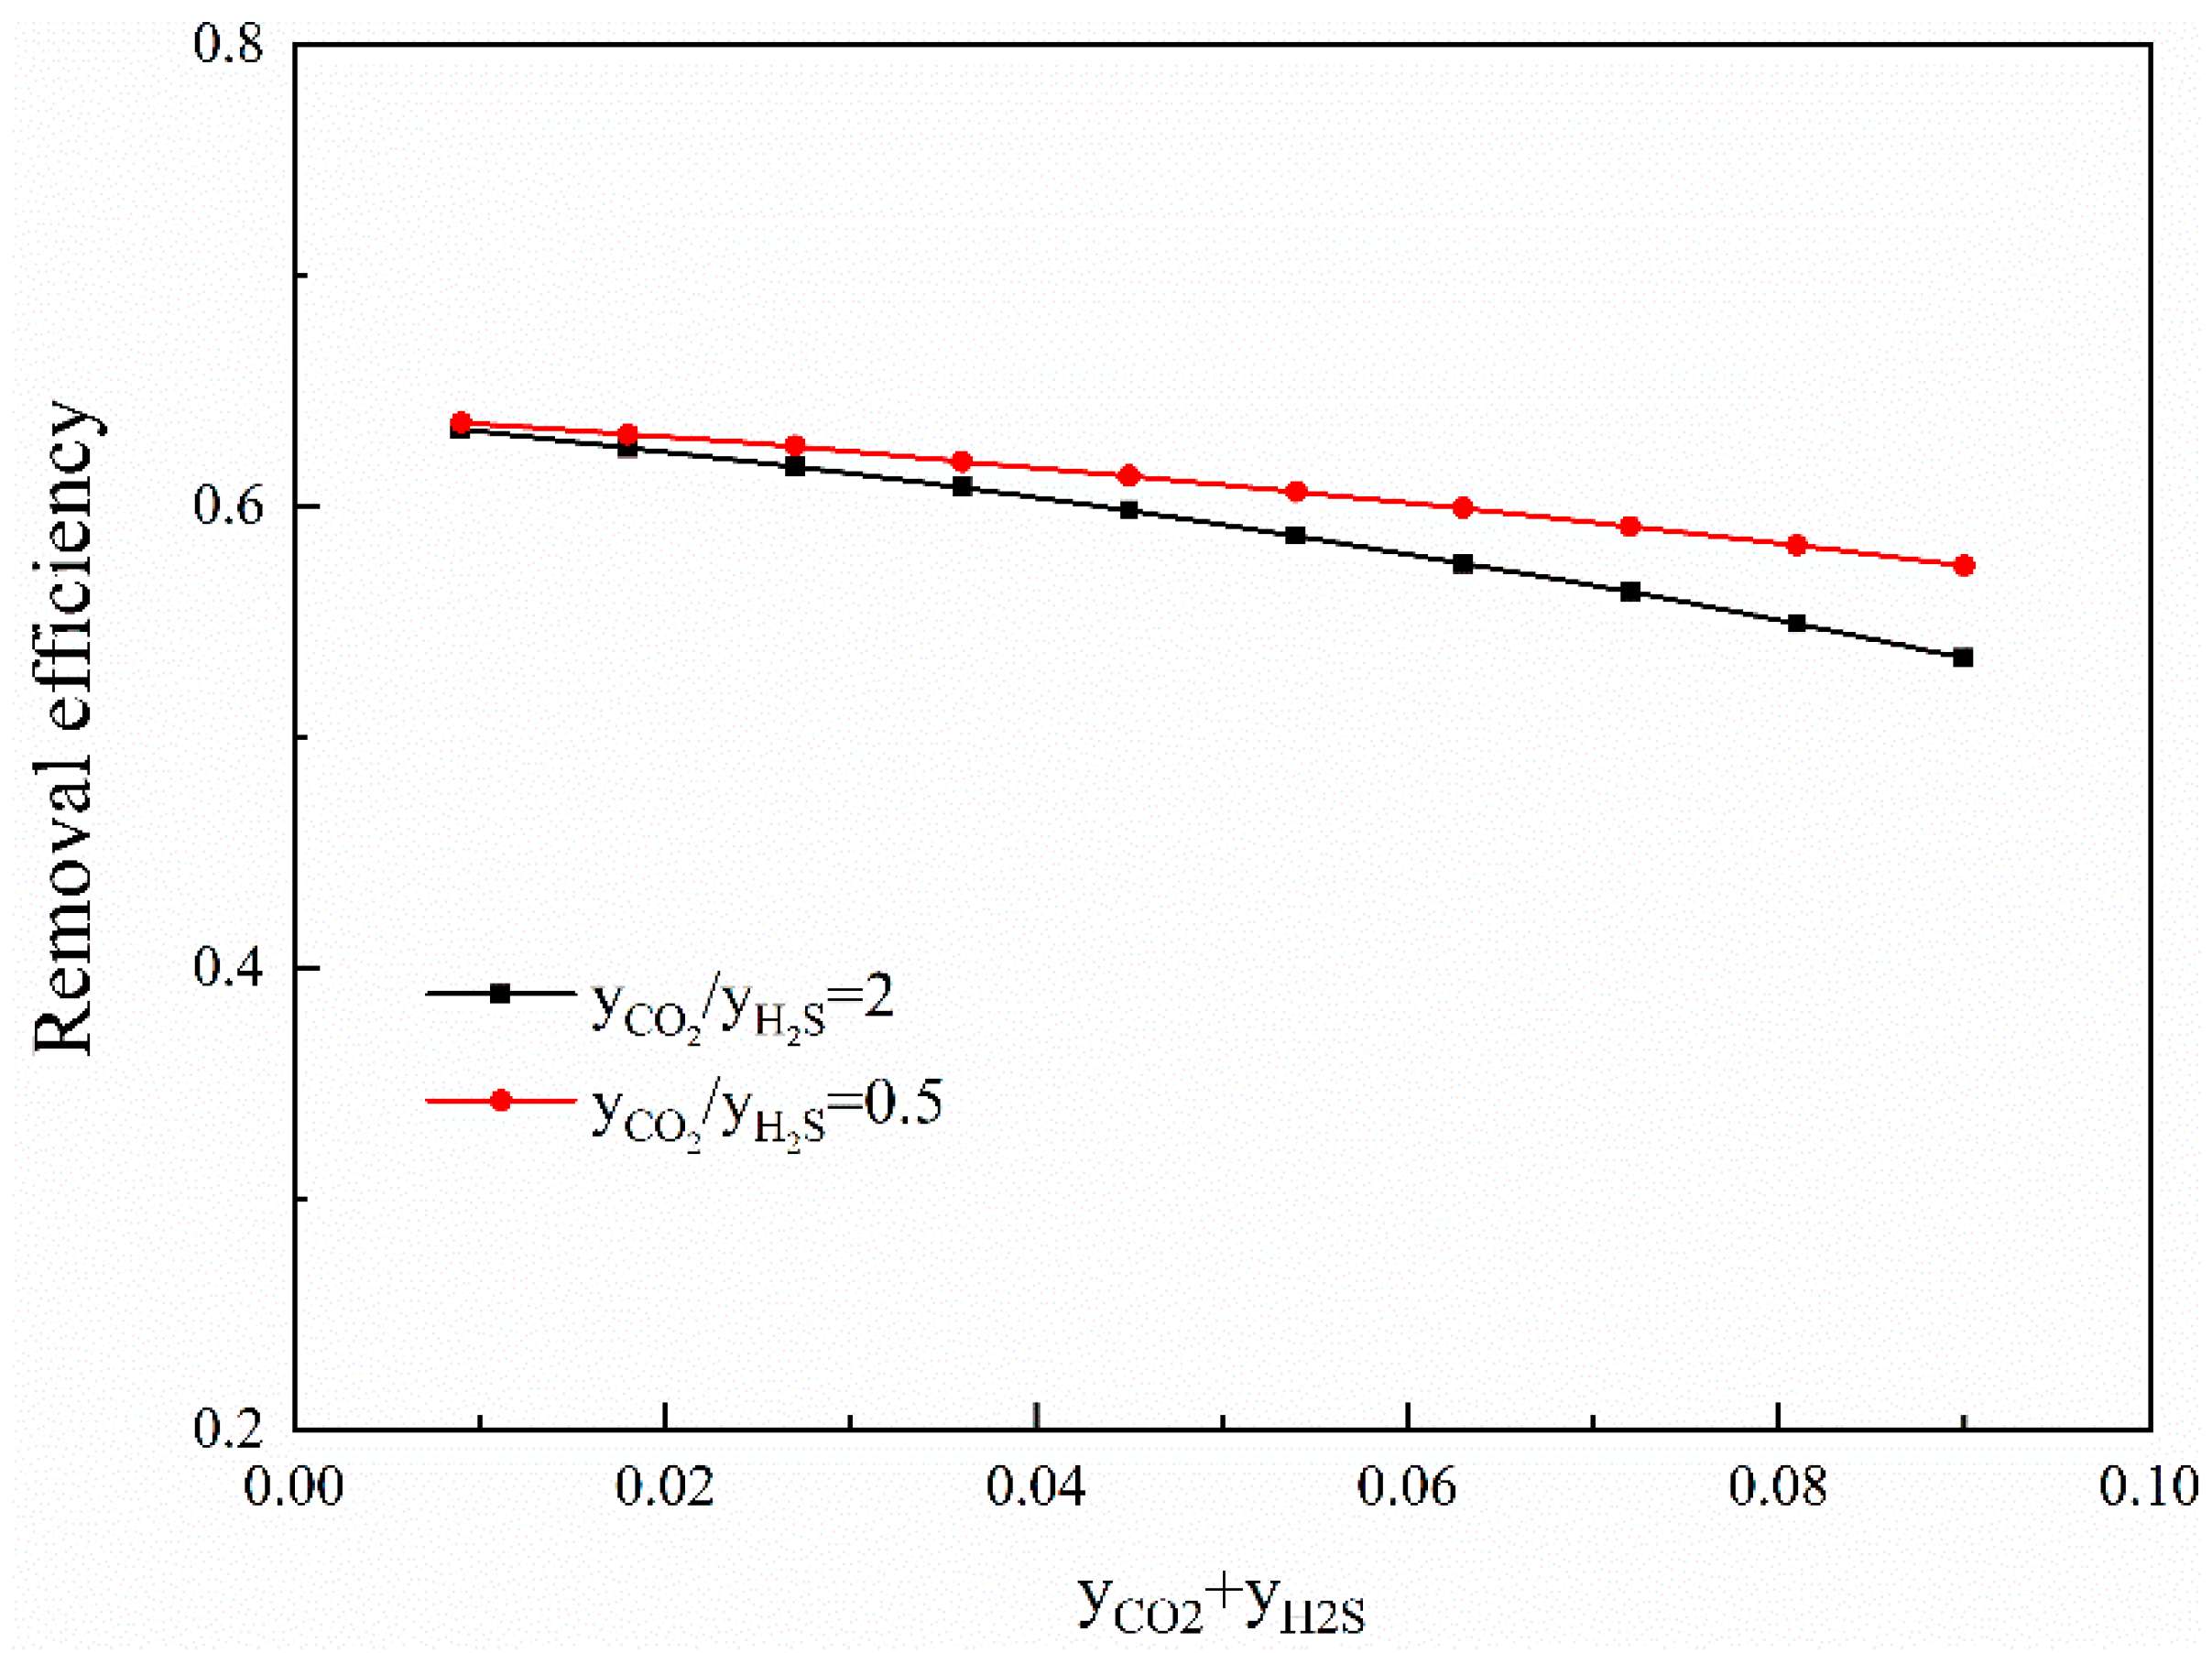
3.4. The Influence of the Operating Parameters

Based on the validated thermodynamic-absorption coupled model, the effects of gas-liquid ratio, overflow weir height, and absorption column pressure on the removal efficiency of each component were studied, and the results are shown in Figure 12, Figure 13 and Figure 14. In addition, the effect of the acid component content in the feed gas on the removal efficiency of methyl mercaptan was studied, and the results are shown in Figure 15.
It can be seen from Figure 12 that the gas–liquid ratio has a greater impact on the absorption of CH3SH because CH3SH is physically absorbed and controlled by equilibrium. When the gas–liquid ratio increases from 400 to 800, the removal efficiency of CH3SH decreases from 0.8 to 0.4. Obviously, a more liquid phase is conducive to the physical absorption process. Since the absorption rate of CO2 and COS is determined by mass transfer rate, it is less affected by the gas–liquid ratio.
Figure 13 shows the effect of the overflow weir height on the absorption performance of each component. As the reaction rate of CO2 in the absorption solvent is very fast, the absorption rate is mainly controlled by the mass transfer rate of CO2. As the overflow weir height increases, the liquid thickness over the tray increases, and, thus, the mass transfer area increases, resulting in an increase in the removal rates of CO2 and COS. For CH3SH, the overflow weir height has little effect on its removal rate. One reason is that the absorption rate of CH3SH is controlled by its physical solubility in the mixed solvent. The second reason is that the increase in the overflow weir height strengthens the absorption of CO2 and H2S, which reduces the solubility of CH3SH in the liquid phase. Figure 15 shows the effect of acid component content in the feed gas on the removal rate of CH3SH. As the acid component content increases, the absorption rate of CH3SH decreases significantly. The reason for this is that, as the acid component content in the liquid phase increases, the Henry constant of CH3SH absorption increases significantly.
The influence of tower pressure is shown in Figure 14. As the absorption pressure increases, the absorption driving force increases, and the removal efficiency of each component increases. Additionally, the physical absorption process is more sensitive to the tower pressure. With the increase in tower pressure, the removal efficiency of CH3SH achieves a significant increase when compared with the removal efficiency of CO2 and COS. Due to the chemical absorption being the rate-limited step for the removal of CO2 and COS, the absorption pressure on their removal efficiency is insignificant. As shown in Figure 14, the removal efficiency of COS increases by less than 10% when the absorption pressure increases from 4 MPa to 8 MPa.

4. Conclusions

In this study, a rate-based absorption model coupled with a thermodynamic model was developed to characterize the removal of acid components (CO2 and H2S) and organic sulfur (COS and CH3SH) from natural gas with an aqueous sulfolane–MDEA solution. The thermodynamic model was improved by improving the calculation method of the chemical equilibrium constant and by incorporating the influence of acid components for COS removal, which made the gas–liquid equilibrium (GLE) data more accurate. The absorption model was validated by the experimental data obtained from an industrial device, and the average relative errors of the removal rates of CO2, COS, and CH3SH obtained by experiment and calculation are 3.3%, 3.0%, and 4.1%, respectively. The validated coupled model indicated that the gas mass transfer resistance can almost be ignored for CO2 and COS, but both gas and liquid mass transfer resistance for H2S and CH3SH should be considered. Additionally, the analysis of influencing factors shows that the gas–liquid ratio has a greater impact on the physical absorption process controlled by equilibrium but has a limited effect on the absorption process determined by a chemical reaction. An increased overflow weir height increases the gas–liquid contact time and mass transfer area, thus resulting in an increase in the removal rates of CO2 and COS, which, however, inhibits the absorption of CH3SH due to the increased Henry coefficient. Furthermore, the physical absorption process rather than the chemical absorption process is more sensitive to the tower pressure.

Author Contributions

Conceptualization, K.L. and J.L.; Formal analysis, K.L., G.X., J.H. and Q.L.; Funding acquisition, J.L.; Investigation, K.L.; Methodology, K.L.; Resources, J.L.; Software, H.C.; Writing–original draft, K.L.; Writing–review & editing, K.L. and J.L. All authors have read and agreed to the published version of the manuscript.

Funding

This research received no external funding.

Institutional Review Board Statement

Not applicable.

Informed Consent Statement

Not applicable.

Data Availability Statement

Not applicable.

Conflicts of Interest

The authors declare no conflict of interest.

Nomenclature

Psystem pressurePa
yimole fraction of component i in the vapor phase-
ximole fraction of component i in the liquid phase-
HiHenry’s law constant of component iPa m3/mol
φifugacity coefficient of component i in the vapor phase -
γi*unsymmetric activity coefficient in the mixed solvent solution-
wAweighting factor-
γinfinite dilution activity coefficient-
HiAHenry’s constant of component i in pure solvent APa m3/mol
HCH3SHHenry’s constants of CH3SH considering the influence of acid gasPa m3/mol
HCH3SH’Henry’s constants of CH3SH ignoring the influence of acid gasPa m3/mol
funremoved rate of MDEA
ceffect factor
Kchemical equilibrium constant
Fmole flow rate of feedkmol/s
Lmole flow rate of liquidkmol/s
Vmole flow rate of liquidkmol/s
Nmole transfer ratekmol/s
Qheat inputJ/s
qheat transfer rateJ/s
HFenthalpy of feedJ/kmol
HVenthalpy of the vaporJ/kmol
HLenthalpy of the liquidJ/kmol
KGoverall mass transfer coefficientkmol/m2 s kPa
Pi*partial pressure of component i in equilibrium with the liquid phase-
Pipartial pressure of component i in the gas bulk-
apeffective mass transfer area of the column per unit area of the traym2/m2
Accross-sectional area of the columnm2
kGmass transfer coefficient without reaction in the gas phase kmol/m2 s kPa
kLmass transfer coefficient without reaction in the liquid phase m/s
Eenhancement factor-
Ha Hatta number-
Eenhancement number for infinite fast reactions-
DLdiffusivity in an aqueous sulfolane–MDEA solutionm2/s
CInconcentration at the gas–liquid interfacekmol/m3
CBulkconcentration in the bulk liquidkmol/m3
k2trate constantm3/kmol s
TtemperatureK
Subscripts
icomponent i
i’product i’
jstage number
Superscripts
Lliquid phase
Vvapor phase

References

  1. Bolhàr-Nordenkampf, M.; Friedl, A.; Koss, U.; Tork, T. Modelling selective H2S absorption and desorption in an aqueous MDEA-solution using a rate-based non-equilibrium approach. Chem. Eng. Process. 2004, 43, 701–715. [Google Scholar] [CrossRef]
  2. Baccanelli, M.; Langé, S.; Rocco, M.V.; Pellegrini, L.A.; Colombo, E. Low temperature techniques for natural gas purification and LNG production: An energy and exergy analysis. Appl. Energy 2016, 180, 546–559. [Google Scholar] [CrossRef]
  3. Song, C.; Liu, Q.; Ji, N.; Deng, S.; Zhao, J.; Kitamura, Y. Natural gas purification by heat pump assisted MEA absorption process. Appl. Energy 2017, 204, 353–361. [Google Scholar] [CrossRef]
  4. Shirazizadeh, H.A.; Haghtalab, A. Simultaneous solubility measurement of (ethyl mercaptan plus carbon dioxide) into the aqueous solutions of (N-methyl diethanolamine plus sulfolane plus water). J. Chem. Thermodyn. 2019, 133, 111–122. [Google Scholar] [CrossRef]
  5. Amararene, F.; Bouallou, C. Kinetics of carbonyl sulfide (COS) absorption with aqueous solutions of diethanolamine and methyldiethanolamine. Ind. Eng. Chem. Res. 2004, 43, 6136–6141. [Google Scholar] [CrossRef]
  6. Huttenhuis, P.J.G.; Agrawal, N.J.; Versteeg, G.F. Solubility of carbon dioxide and hydrogen sulfide in aqueous N-methyldiethanolamine solutions. Ind. Eng. Chem. Res. 2009, 48, 4051–4059. [Google Scholar] [CrossRef]
  7. Gutierrez, J.P.; Benitez, L.A.; Ale Ruiz, E.L.; Erdmann, E. A sensitivity analysis and a comparison of two simulators performance for the process of natural gas sweetening. J. Nat. Gas Sci. Eng. 2016, 31, 800–807. [Google Scholar] [CrossRef]
  8. Xu, S.; Wang, Y.W.; Otto, F.D.; Mather, A.E. The physicochemical properties of the mixed-solvent of 2-piperidineethanol, sulfolane and water. J. Chem. Technol. Biotechnol. 1993, 56, 309–316. [Google Scholar] [CrossRef]
  9. Amararene, F.; Bouallou, C. Study of hydrogen sulfide absorption with diethanolamine in methanolic aqueous solutions. Chem. Eng. Trans. 2016, 52, 259–264. [Google Scholar]
  10. Zhang, Y.; Chen, C.-C. Thermodynamic modeling for CO2 absorption in aqueous MDEA solution with electrolyte NRTL model. Ind. Eng. Chem. Res. 2011, 50, 163–175. [Google Scholar] [CrossRef]
  11. Zhang, Y.; Chen, C.-C. Modeling Gas Solubilities in the Aqueous Solution of Methyldiethanolamine. Ind. Eng. Chem. Res. 2011, 50, 6436–6446. [Google Scholar] [CrossRef]
  12. Austgen, D.M.; Rochelle, G.T.; Peng, X.; Chen, C.C. Model of vapor-liquid equilibria for aqueous acid gas-alkanolamine systems using the electrolyte-NRTL equation. Ind. Eng. Chem. Res. 1989, 28, 1060–1073. [Google Scholar] [CrossRef]
  13. Zong, L.; Chen, C.-C. Thermodynamic modeling of CO2 and H2S solubilities in aqueous DIPA solution, aqueous sulfolane-DIPA solution, and aqueous sulfolane–MDEA solution with electrolyte NRTL model. Fluid Phase Equilibria 2011, 306, 190–203. [Google Scholar] [CrossRef]
  14. Macgregor, R.J.; Mather, A.E. Equilibrium solubility of H2S and CO2 and their mixtures in a mixed solvent. Can. J. Chem. Eng. 1991, 69, 1357–1366. [Google Scholar] [CrossRef]
  15. Jou, F.Y.; Mather, A.E.; Ng, H.J. Effect of CO2 and H2S on the solubility ofmethanethiol in an aqueous methyldiethanolamine solution. Fluid Phase Equilibria 1999, 158–160, 933–938. [Google Scholar] [CrossRef]
  16. Haghtalab, A.; Eghbali, H.; Shojaeian, A. Experiment and modeling solubility of CO2 in aqueous solutions of diisopropanolamine+2-amino-2-methyl-1-propanol+Piperazine at high pressures. J. Chem. Thermodyn. 2014, 71, 71–83. [Google Scholar] [CrossRef]
  17. Kaur, H.; Chen, C.-C. Thermodynamic modeling of CO2 absorption in aqueous potassium carbonate solution with electrolyte NRTL model. Fluid Phase Equilibria 2020, 505, 112339–112350. [Google Scholar] [CrossRef]
  18. Simon, L.L.; Elias, Y.; Puxty, G.; Artanto, Y.; Hungerbuhler, K. Rate based modeling and validation of a carbon-dioxide pilot plant absorbtion column operating on monoethanolamine. Chem. Eng. Res. Des. 2011, 89, 1684–1692. [Google Scholar] [CrossRef]
  19. Borhani, T.N.G.; Afkhamipour, M.; Azarpour, A.; Akbari, V.; Emadi, S.H.; Manan, Z.A. Modeling study on CO2 and H2S simultaneous removal using MDEA solution. J. Ind. Eng. Chem. 2016, 34, 344–355. [Google Scholar] [CrossRef]
  20. Zhang, Y.; Chen, H.; Chen, C.-C.; Plaza, J.M.; Dugas, R.; Rochelle, G.T. Rate-based process modeling study of CO2 capture with aqueous monoethanolamine solution. Ind. Eng. Chem. Res. 2009, 48, 9233–9246. [Google Scholar] [CrossRef]
  21. Afkhamipour, M.; Mofarahi, M. Comparison of rate-based and equilibrium-stage models of a packed column for post-combustion CO2 capture using 2-amino-2-methyl-1-propanol (AMP) solution. Int. J. Greenh. Gas Control 2013, 15, 186–199. [Google Scholar] [CrossRef]
  22. Al-Baghli, N.A.; Pruess, S.A.; Yesavage, V.F.; Selim, M.S. A rate-based model for the design of gas absorbers for the removal of CO2 and H2S using aqueous solutions of MEA and DEA. Fluid Phase Equilibria 2001, 185, 31–43. [Google Scholar] [CrossRef]
  23. Pacheco, M.A.; Rochelle, G.T. Rate-based modeling of reactive absorption of CO2 and H2S into aqueous methyldiethanolamine. Ind. Eng. Chem. Res. 1998, 37, 4107–4117. [Google Scholar] [CrossRef]
  24. Mandal, B.; Bandyopadhyay, S.S. Simultaneous absorption of CO2 and H2S into aqueous blends of N-methyldiethanolamine and diethanolamine. Environ. Sci. Technol. 2006, 40, 6076–6084. [Google Scholar] [CrossRef]
  25. Moioli, S.; Pellegrini, L.A.; Picutti, B.; Vergani, P. Improved rate-based modeling of H2S and CO2 removal by methyldiethanolamine scrubbing. Ind. Eng. Chem. Res. 2013, 52, 2056–2065. [Google Scholar] [CrossRef]
  26. Yang, C.; Liu, K.; Li, L.; Wang, J.; Hu, T.; Zhang, X. Research on the factors affecting organic sulfur removal of natural gas purification unit. Chem. Eng. Oil Gas 2021, 50, 9–16. [Google Scholar]
  27. Peng, D.-Y.; Robinson, D.B. A New two-constant equation of state. Ind. Eng. Chem. Fundam. 1976, 15, 59–64. [Google Scholar] [CrossRef]
  28. Van Ness, H.C.; Abbott, M.M. Vapor-liquid equilibrium. Part VI. standard state fugacities for supercritical components. AIChE J. 1979, 25, 645–653. [Google Scholar] [CrossRef]
  29. Bedell, S.A.; Miller, M. Aqueous amines as reactive solvents for mercaptan removal. Ind. Eng. Chem. Res. 2007, 46, 3729–3733. [Google Scholar] [CrossRef]
  30. Shokouhi, M.; Farahani, H.; Vahidi, M.; Taheri, S.A. Experimental solubility of carbonyl sulfide in sulfolane and γ-butyrolactone. J. Chem. Eng. Data 2017, 62, 3401–3408. [Google Scholar] [CrossRef]
  31. Jou, F.Y.; Deshmukh, R.D.; Otto, F.D.; Mather, A.E. Solubility of H2S, CO2, CH4and C2H6 in sulfolane at elevated pressures. Fluid Phase Equilibria 1990, 56, 313–324. [Google Scholar] [CrossRef]
  32. Al-Ghawas, H.A.; Ruiz-Ibanez, G.; Sandall, O.C. Absorption of carbonyl sulfide in aqueous methyldiethanolamine. Chem. Eng. Sci. 1989, 44, 631–639. [Google Scholar] [CrossRef]
  33. Song, Y.H.; Chen, C.C. Symmetric electrolyte nonrandom two-liquid activity coefficient model. Ind. Eng. Chem. Res. 2009, 48, 7788–7797. [Google Scholar] [CrossRef]
  34. Chen, C.-C.; Britt, H.I.; Boston, J.F.; Evans, L.B. Local composition model for excess Gibbs energy of electrolyte systems. Part I: Single solvent, single completely dissociated electrolyte systems. AIChE J. 1982, 28, 588–596. [Google Scholar] [CrossRef]
  35. Cleeton, C.; Kvam, O.; Rea, R.; Sarkisov, L.; De Angelis, M.G. Competitive H2S-CO2 absorption in reactive aqueous methyldiethanolamine solution: Prediction with ePC-SAFT. Fluid Phase Equilibria 2020, 511, 112453–112468. [Google Scholar] [CrossRef]
  36. Austgen, D.M.; Rochelle, G.T.; Chen, C.C. Model of vapor-liquid equilibria for aqueous acid gas-alkanolamine systems. 2. Representation of hydrogen sulfide and carbon dioxide solubility in aqueous MDEA and carbon dioxide solubility in aqueous mixtures of MDEA with MEA or DEA. Ind. Eng. Chem. Res. 1991, 30, 543–555. [Google Scholar] [CrossRef]
  37. Hairul, N.A.H.; Shariff, A.M.; Tay, W.H.; Mortel, A.M.A.V.D.; Lau, K.K.; Tan, L.S. Modelling of high pressure CO2 absorption using PZ plus AMP blended solution in a packed absorption column. Sep. Purif. Technol. 2016, 165, 179–189. [Google Scholar] [CrossRef]
  38. Almoslh, A.; Alobaid, F.; Heinze, C.; Epple, B. Comparison of equilibrium-stage and rate-based models of a packed column for tar absorption using vegetable oil. Appl. Sci. 2020, 10, 2362. [Google Scholar] [CrossRef] [Green Version]
  39. Treybal, R.E. Adibatic gas absorption and stripping in packed towers. Ind. Eng. Chem. 1969, 61, 36–41. [Google Scholar] [CrossRef]
  40. Saimpert, M.; Puxty, G.; Qureshi, S.; Wardhaugh, L.; Cousins, A. A new rate based absorber and desorber modelling tool. Chem. Eng. Sci. 2013, 96, 10–25. [Google Scholar] [CrossRef]
  41. Danckwerts, P.V. Absorption by simultaneous diffusion and chemical reaction. Trans. Faraday Soc. 1950, 46, 300–304. [Google Scholar] [CrossRef]
  42. DeCoursey, W.J. Enhancement factors for gas absorption with reversible reaction. Chem. Eng. Sci. 1982, 37, 1483–1489. [Google Scholar] [CrossRef]
  43. Jou, F.-Y.; Carroll, J.J.; Mather, A.E.; Otto, F.D. The solubility of carbon dioxide and hydrogen sulfide in a 35 wt% aqueous solution of methyldiethanolamine. Can. J. Chem. Eng. 1993, 71, 264–268. [Google Scholar] [CrossRef]
  44. Qian, W.-M.; Li, Y.-G.; Mather, A.E. Correlation and prediction of the solubility of CO2 and H2S in an aqueous solution of methyldiethanolamine and sulfolane. Ind. Eng. Chem. Res. 1995, 34, 2545–2550. [Google Scholar] [CrossRef]
  45. Sidi-Boumedine, R.; Horstmann, S.; Fischer, K.; Provost, E.; Fürst, W.; Gmehling, J. Experimental determination of hydrogen sulfide solubility data in aqueous alkanolamine solutions. Fluid Phase Equilibria 2004, 218, 149–155. [Google Scholar] [CrossRef]
Figure 1. Rate-based stage model.
Processes 09 01954 g001
Figure 2. Comparison of experimental data and calculated data of the CO2–H2O–MDEA system under different conditions. , measured by Jou et al. [43], T = 313.15 K, MDEA mass fraction = 0.35; , measured by Macgregor and Mather [14], T = 313.15 K, MDEA mass fraction = 0.209; , measured by Qian et al. [44], T = 310.95 K, MDEA mass fraction = 0.20; , measured by Qian et al. [44], T = 338.75 K, MDEA mass fraction = 0.20; and , measured by Sidi-Boumedine et al. [45], T = 313.15 K, MDEA mass fraction = 0.257. The solid line represents the calculated data in this work.
Processes 09 01954 g002
Figure 3. Comparison of experimental data and calculated data of the H2S–H2O–MDEA system under different conditions. , measured by Jou et al. [43], T = 313.15 K, MDEA mass fraction = 0.35; , measured by Jou et al. [43], T = 313.15 K, MDEA mass fraction = 0.50; , measured by Macgregor and Mather [14], T = 310.95 K, MDEA mass fraction = 0.209; , measured by Qian et al. [44], T = 338.75 K, MDEA mass fraction = 0.20; and , measured by Qian et al. [44], T = 338.75 K, MDEA mass fraction = 0.20. The solid line represents the calculated data in this work.
Processes 09 01954 g003
Figure 4. Comparison of the experimental data and calculated data for the CO2–H2O–sulfolane–MDEA system under different conditions. ■, measured by Jou et al. [43], T = 313.15 K, MDEA mass fraction = 0.305, sulfolane mass fraction = 0.209; , measured by Jou et al. [43], T = 373.15 K, MDEA mass fraction = 0.305, sulfolane mass fraction = 0.209. The solid line represents the calculated data in this work.
Processes 09 01954 g004
Figure 5. Comparison of the experimental data and calculated data of the H2S–H2O–sulfolane–MDEA system under different conditions. ■, measured by Jou et al. [43], T = 313.15 K, MDEA mass fraction = 0.305, sulfolane mass fraction = 0.209; , measured by Jou et al. [43], T = 373.15 K, MDEA mass fraction = 0.305, sulfolane mass fraction = 0.209. The solid line represents the calculated data in this work.
Processes 09 01954 g005
Figure 6. Comparison of the calculated data in the reference and in this work for the CO2–H2O– MDEA system. ■, experimental data measured by Jou et al. [43]; , data calculated with the reaction parameters proposed by Austgen et al. [36]; and , data calculated in this work.
Processes 09 01954 g006
Figure 7. Comparison of the calculated data in the reference and in this work for the H2S–H2O– MDEA system. ■, experimental data measured by Jou et al. [43]; , data calculated with the reaction parameters proposed by Austgen et al. [36]; and , data calculated in this work.
Processes 09 01954 g007
Figure 8. Parity plot for CH3SH partial pressure, experimental data vs. model predictions. CH3SH–H2O–MDEA system: , T = 313.15 K, MDEA mass fraction = 0.50; , T = 343.15 K, MDEA mass fraction = 0.50. CO2–H2S–CH3SH–H2O–MDEA system: , T = 313.15 K, MDEA mass fraction = 0.50; , T = 343.15 K, MDEA mass fraction = 0.50.
Processes 09 01954 g008
Figure 9. The concentration profile of each component in the absorption column (overflow weir height: 0.15 m; absorption pressure: 6 MPa; inlet gas flow rate: 5.0 × 10⁶ Nm3/d; inlet gas–liquid ratio: 600; inlet gas loading: CO2, 4.5 vol.%; H2S, 1.5 vol.%; COS, 15 mg/m3; and CH3SH, 15 mg/m3).
Processes 09 01954 g009
Figure 10. The gas–liquid temperature profile of each component in the absorption column (overflow weir height: 0.15 m; absorption pressure: 6 MPa; inlet gas flow rate: 5.0 × 10⁶ Nm3/d; inlet gas–liquid ratio: 600).
Processes 09 01954 g010
Figure 11. Total mass transfer coefficient and mass transfer resistance of different column positions (overflow weir height: 0.15 m; absorption pressure: 6 Mpa; inlet gas flow rate: 5.0 × 10⁶ Nm3/d; inlet gas–liquid ratio: 600; inlet gas loading: CO2, 4.5 vol.%; H2S, 1.5 vol.%; COS, 15 mg/m3; CH3SH, 15 mg/m3).
Processes 09 01954 g011
Figure 12. The effect of gas–liquid ratio on the removal efficiency and the acid components (CO2 and H2S)/MDEA ratio (number of plates: 25; overflow weir height: 0.15 m; absorption pressure: 6 Mpa; inlet gas flow rate: 5.0 × 10⁶ Nm3/d; inlet gas loading: CO2, 4.5 vol.%; H2S, 1.5 vol.%; COS, 15 mg/m3; CH3SH, 15 mg/m3).
Processes 09 01954 g012
Figure 13. The effect of overflow weir height on removal efficiency (number of plates: 25; absorption pressure: 6 Mpa; inlet gas flow rate: 5.0 × 10⁶ Nm3/d; inlet gas–liquid ratio: 600; inlet gas loading: CO2, 4.5 vol.%; H2S, 1.5 vol.%; COS, 15 mg/m3; CH3SH, 15 mg/m3).
Processes 09 01954 g013
Figure 14. The effect of absorption pressure on removal efficiency (number of plates: 25; overflow weir height: 0.15 m; inlet gas flow rate: 5.0 × 10⁶ Nm3/d; inlet gas–liquid ratio: 600; inlet gas loading: CO2, 4.5 vol.%; H2S, 1.5 vol.%; COS, 15 mg/m3; CH3SH, 15 mg/m3).
Processes 09 01954 g014
Figure 15. The effect of acid component content in feed gas on the removal efficiency of CH3SH (number of plates: 25; overflow weir height: 0.15 m; absorption pressure: 6 Mpa; inlet gas flow rate: 5.0 × 10⁶ Nm3/d; and inlet gas–liquid ratio: 600).
Processes 09 01954 g015
Table 1. Parameters for Henry’s constant.
Solute iSolvent AABCDData Source
CH4sulfolane26.68−1538.3800.02Jou et al. [31]
CH3SHH2O21.128−1299.31000Bedell and Miller [29]
CH3SHsulfolane12.987000Bedell and Miller [29]
COSH2O27.402−2407.19200Al-Ghawas et al. [32]
COSMDEA19.323−603.36300Al-Ghawas et al. [32]
COSsulfolane11.0040.17000.015Shokouhi et al. [30]
Table 2. Parameters for temperature-dependent mole-fraction reaction equilibrium constants.
ReactionAB/TCD/K−1T Range/KSource
4819.8−37655.9−124.50273–498In this Work a
5−553.428412.777.70273–423In this Work a
6−9.4165−4234.9800298–333Austgen et al. [36]
7−32.0−3338.000287–343Austgen et al. [36]
8216.049−12431.7−35.48190273–498Austgen et al. [36]
9132.899−13445.9−22.47730273–498Austgen et al. [36]
a The equilibrium reaction order of CO2 and H2S are obtained by fitting the experimental data. The reaction orders of CO2 and HCO3 are 1.25, the reaction orders of H2S and HS are 1.35, and the reaction orders of the remaining reactions are 1.
Table 3. Comparison of experiment data and model calculation data from the industry.
Experimental No.Number of PlatesOverflow Weir Height (m)Inlet Gas Flow Rate (104 Nm3/d)Inlet Gas-Liquid Ratio (vol/vol)Pressure (Mpa)Inlet Gas Loading H2S (vol.%)Inlet Gas Loading CO2 (vol.%)CH3SH Concentration (mg/m3)COS Concentration (mg/m3)Experimental Removal Efficiency (%)Simulated Removal Efficiency (%)
CO2COSCH3SHCO2COSCH3SH
1260.15384.0 490.2 6.14 1.49 4.26 15.53 12.33 74.1 82.9 76.9 76.4 80.2 70.7
2260.15417.0 568.4 6.14 1.44 4.17 15.62 14.64 70.4 79.2 61.9 72.6 78.3 62.8
3260.15446.0 608.6 6.13 1.41 4.32 15.53 11.18 73.3 78.0 56.3 73.1 78.4 58.1
4300.15535.2 614.3 6.20 1.55 4.62 22.42 32.53 73.4 79.4 57.7 73.4 80.3 58.6
5260.15458.0 622.8 6.13 1.41 4.31 15.75 13.78 76.6 76.6 53.9 72.6 78.1 56.8
6260.15553.0 645.4 6.11 1.49 4.73 20.20 41.18 69.7 81.1 56.8 70.3 76.5 54.0
7300.15553.4 655.1 6.44 1.57 4.58 25.41 34.58 74.8 79.7 52.1 76.6 82.0 56.1
8260.15570.0 659.7 6.18 1.50 4.71 19.40 29.94 68.8 79.1 51.2 70.9 76.9 53.2
9260.15442.0 661.1 6.18 1.40 4.28 16.09 23.57 72.0 79.1 51.5 72.1 78.2 54.0
10300.15600.2 661.8 6.11 1.52 4.26 24.39 28.08 70.4 76.7 50.5 71.8 79.0 53.7
11260.15448.0 662.4 6.18 1.41 4.17 16.12 24.29 73.6 79.1 50.4 71.7 77.9 54.1
12260.15596.0 665.8 6.11 1.51 4.23 23.49 19.78 67.8 75.9 54.1 69.3 75.3 53.2
13220.15600.0 666.0 6.11 1.52 3.69 20.54 20.81 57.1 67.2 53.2 59.5 67.6 54.5
14220.15602.3 673.0 6.10 1.51 4.49 24.33 25.01 61.0 71.0 54.0 59.5 67.9 52.7
15300.15612.0 674.3 6.19 1.51 4.31 24.31 31.01 66.8 74.3 56.6 71.7 79.0 53.3
16260.15589.0 681.2 6.16 1.50 4.51 14.85 21.59 66.7 70.9 52.9 68.9 75.6 51.9
17260.15614.7 720.0 6.26 1.51 4.48 17.42 17.45 66.7 75.9 47.7 69.3 76.0 49.5
18260.1475.0 547.6 6.19 1.35 4.34 15.49 17.66 67.0 61.2 66.3 65.9 63.0 65.0
19260.1399.0 558.9 6.15 1.39 4.37 15.23 11.90 71.6 64.8 66.5 68.5 65.9 63.2
20300.1412.0 575.8 6.14 1.38 4.18 14.63 11.82 68.4 66.1 63.2 71.2 68.2 62.4
21260.1407.0 576.0 6.15 1.39 4.30 14.95 11.57 70.0 61.7 63.0 67.9 65.4 61.6
22300.1414.0 582.3 6.15 1.38 4.37 14.12 12.23 67.7 68.9 64.2 71.6 68.9 61.4
23300.1448.0 630.8 6.14 1.38 4.15 14.26 13.48 68.4 67.7 53.2 72.7 71.0 56.4
24260.1599.0 653.3 6.27 1.45 4.23 16.70 26.95 60.8 57.3 52.9 61.8 59.6 56.2
25260.1470.0 653.8 6.22 1.36 4.11 15.48 9.35 65.9 61.3 56.6 65.2 63.0 55.6
26300.1595.0 656.2 6.42 1.35 4.53 17.76 25.27 65.6 63.3 55.1 68.3 66.5 56.5
27220.1605.0 660.6 6.26 1.34 4.53 17.78 24.15 61.1 55.7 53.6 55.5 54.0 55.1
28260.1602.0 661.0 6.51 1.46 4.58 18.48 30.04 62.7 59.5 57.1 62.6 60.7 57.0
29300.1603.0 663.6 6.45 1.45 4.41 17.35 27.17 66.3 63.1 56.9 68.8 67.2 56.2
30260.1597.0 664.9 6.25 1.41 4.45 17.15 28.45 61.8 56.8 59.5 61.5 59.7 54.7
31220.1599.0 671.3 6.31 1.35 4.50 17.21 28.49 61.1 55.1 57.0 55.3 53.7 54.8
32220.1612.0 681.6 6.35 1.35 4.60 17.72 29.77 58.9 53.6 54.7 55.2 53.8 54.2
Table 4. Specifications of the absorber column and typical operating data.
ParametersData
Column diameter (m)3.4
Number of plates25
Overflow weir height (m)0.08–0.2
Inlet gas flow rate (104 Nm3/d)500
Inlet gas temperature (°C)40
Inlet liquid temperature (°C)20
Inlet gas-liquid ratio400–800
Absorption pressure (MPa)4.0–8.0
Inlet gas loading CO2 (vol.%)0–6.0
Inlet gas loading H2S (vol.%)0–6.0
CH3SH concentration (mg/m3)15.0
COS concentration (mg/m3)15.0
Publisher’s Note: MDPI stays neutral with regard to jurisdictional claims in published maps and institutional affiliations.

