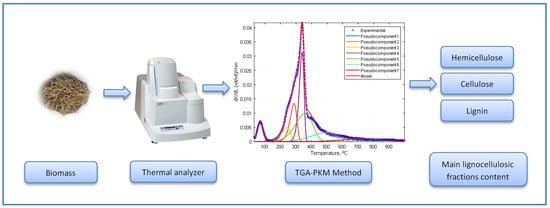
Determination of Hemicellulose, Cellulose, and Lignin Content in Different Types of Biomasses by Thermogravimetric Analysis and Pseudocomponent Kinetic Model (TGA-PKM Method)


Abstract
:
1. Introduction
2. Materials and Methods
2.1. Biomass Samples
2.2. Experimental Method
2.3. Data Treatment
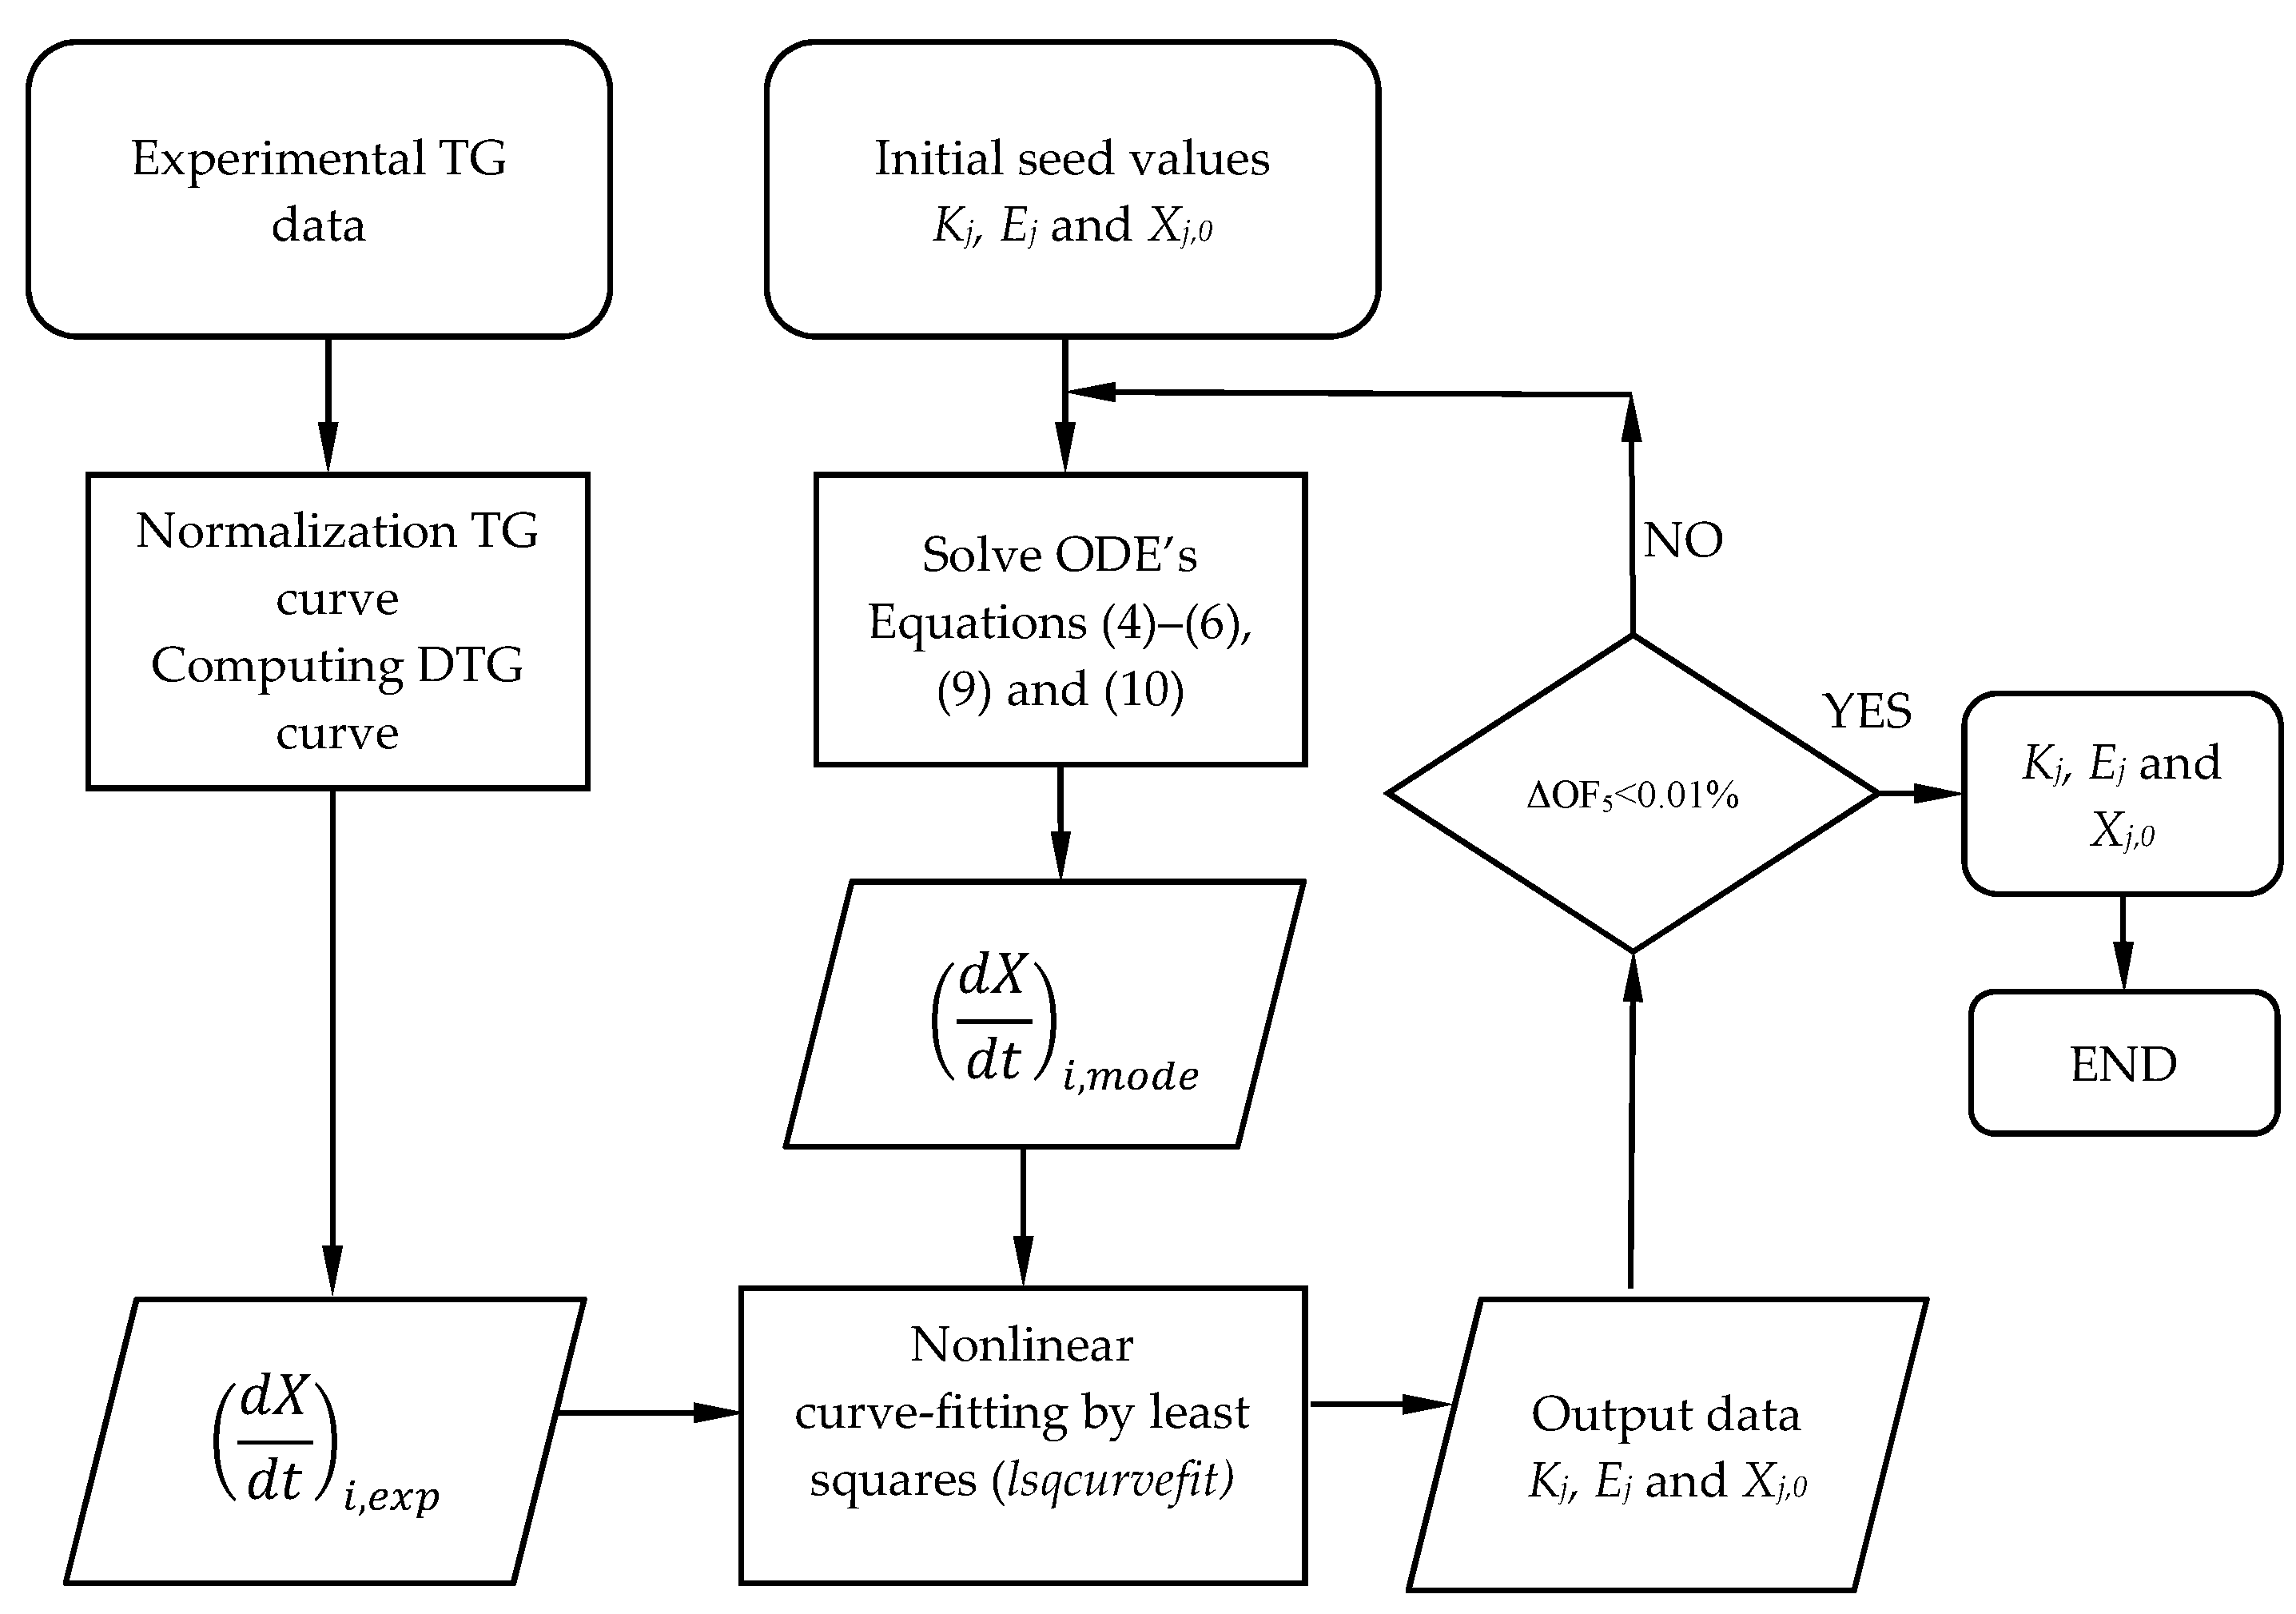
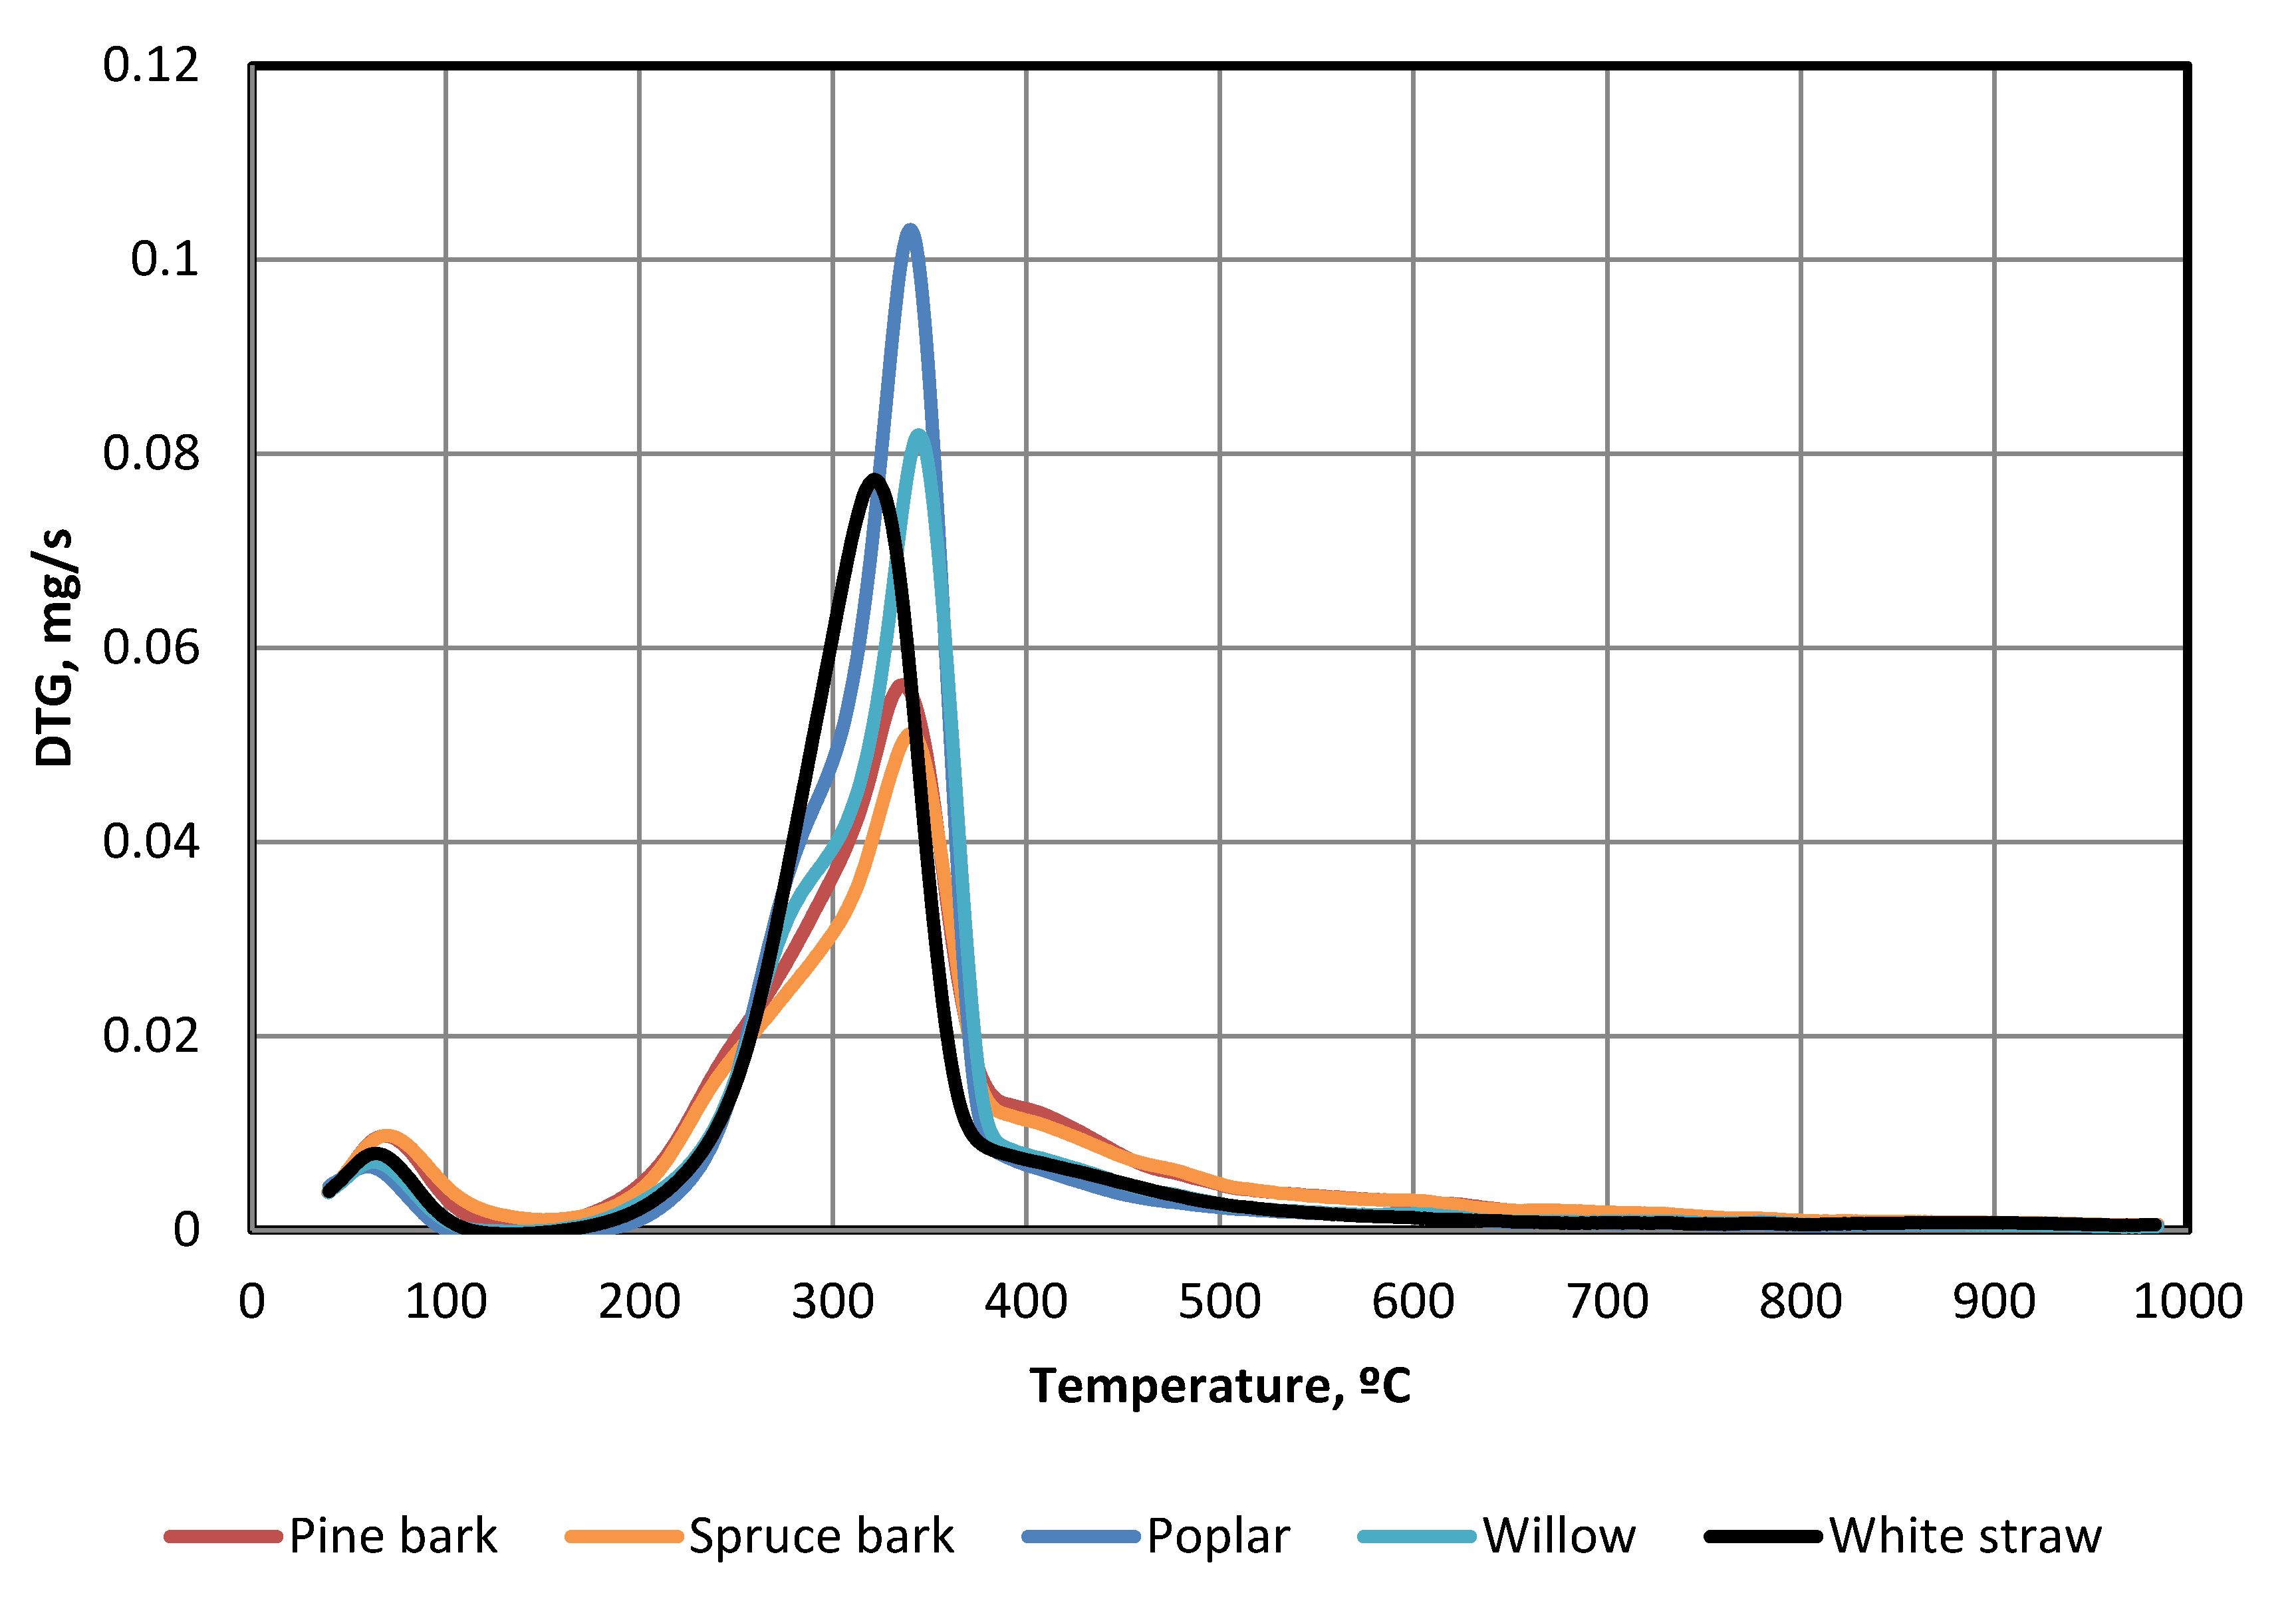
2.4. DTG Curves
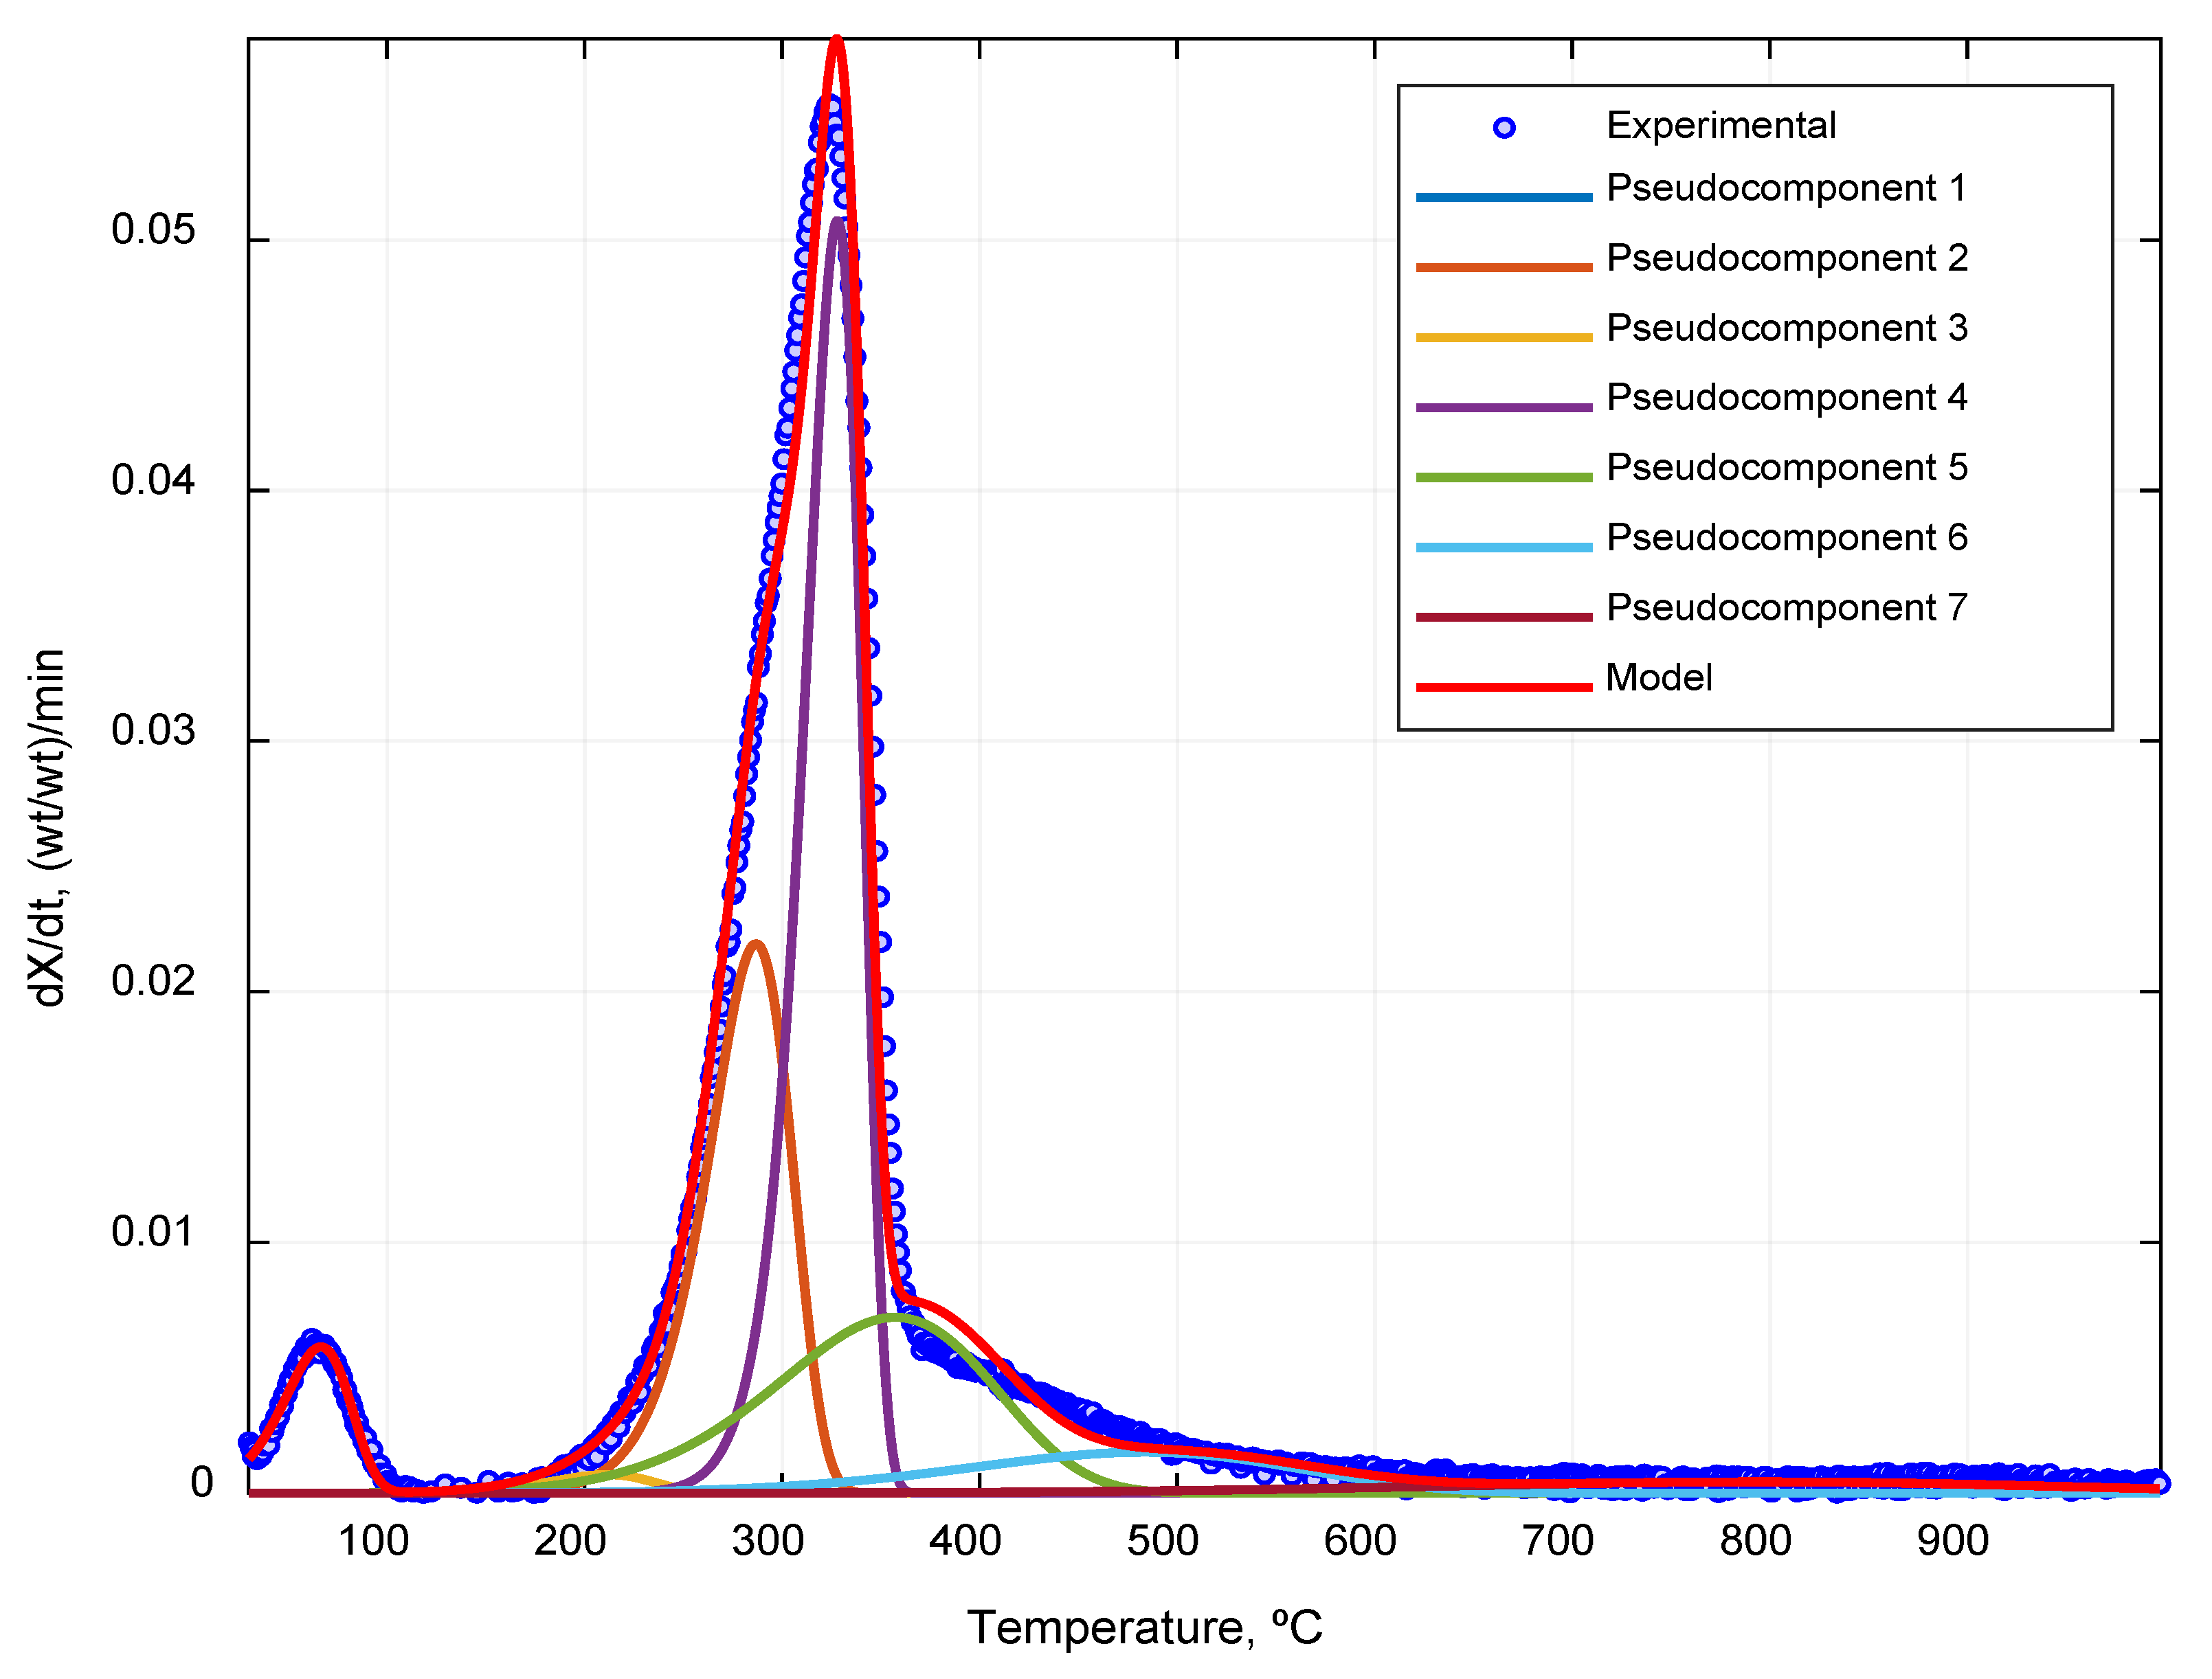
2.5. Kinetic Model
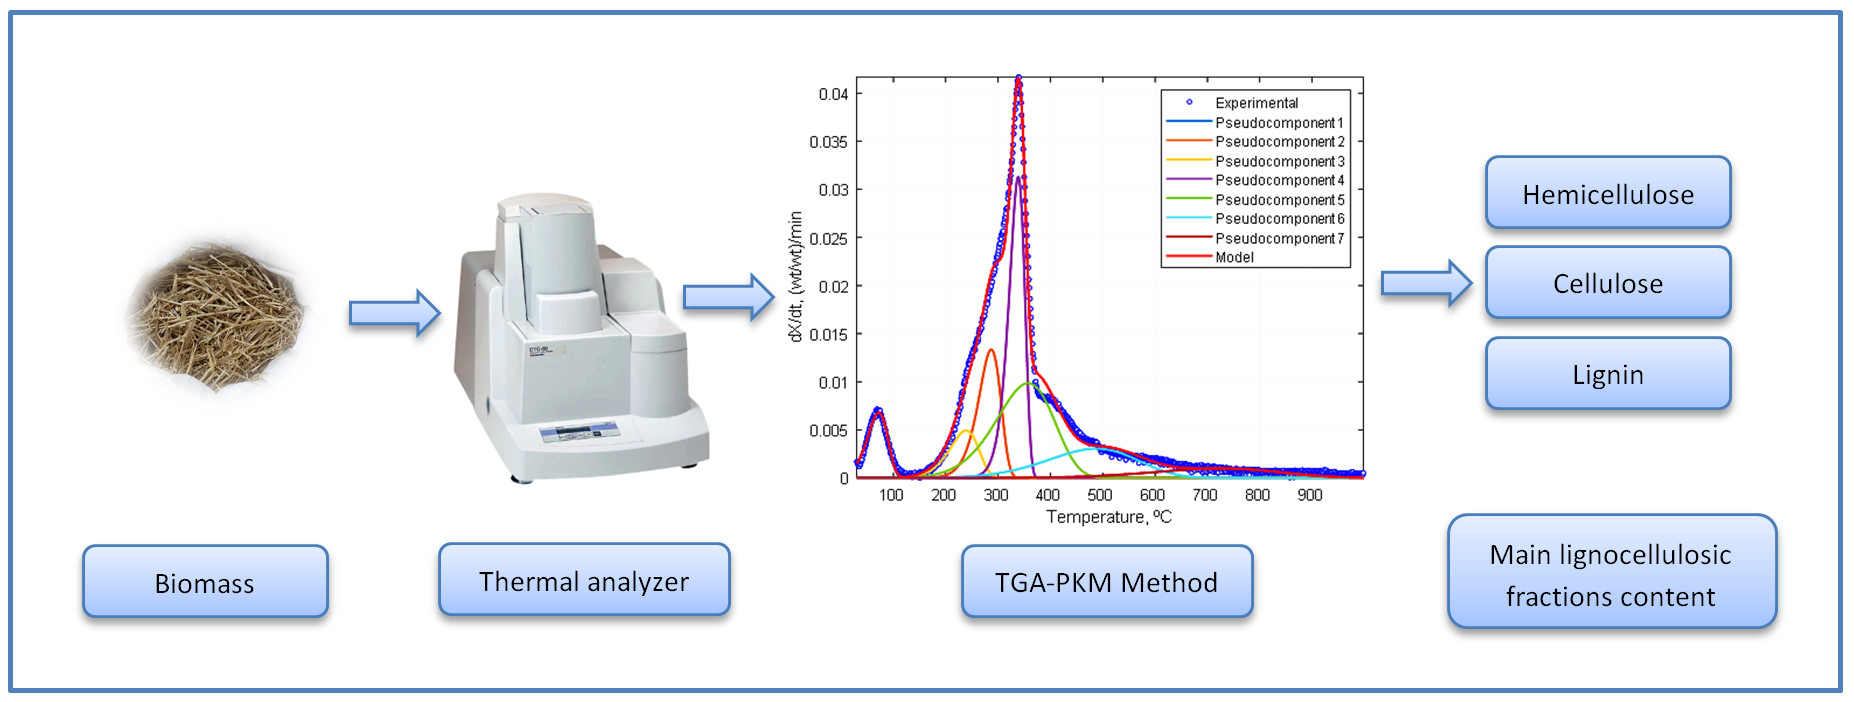
2.6. Calculation Procedure
3. Results and Discussion
3.1. Analytical Method
3.2. Devolatilization Behavior
3.3. TGA-PKM Method
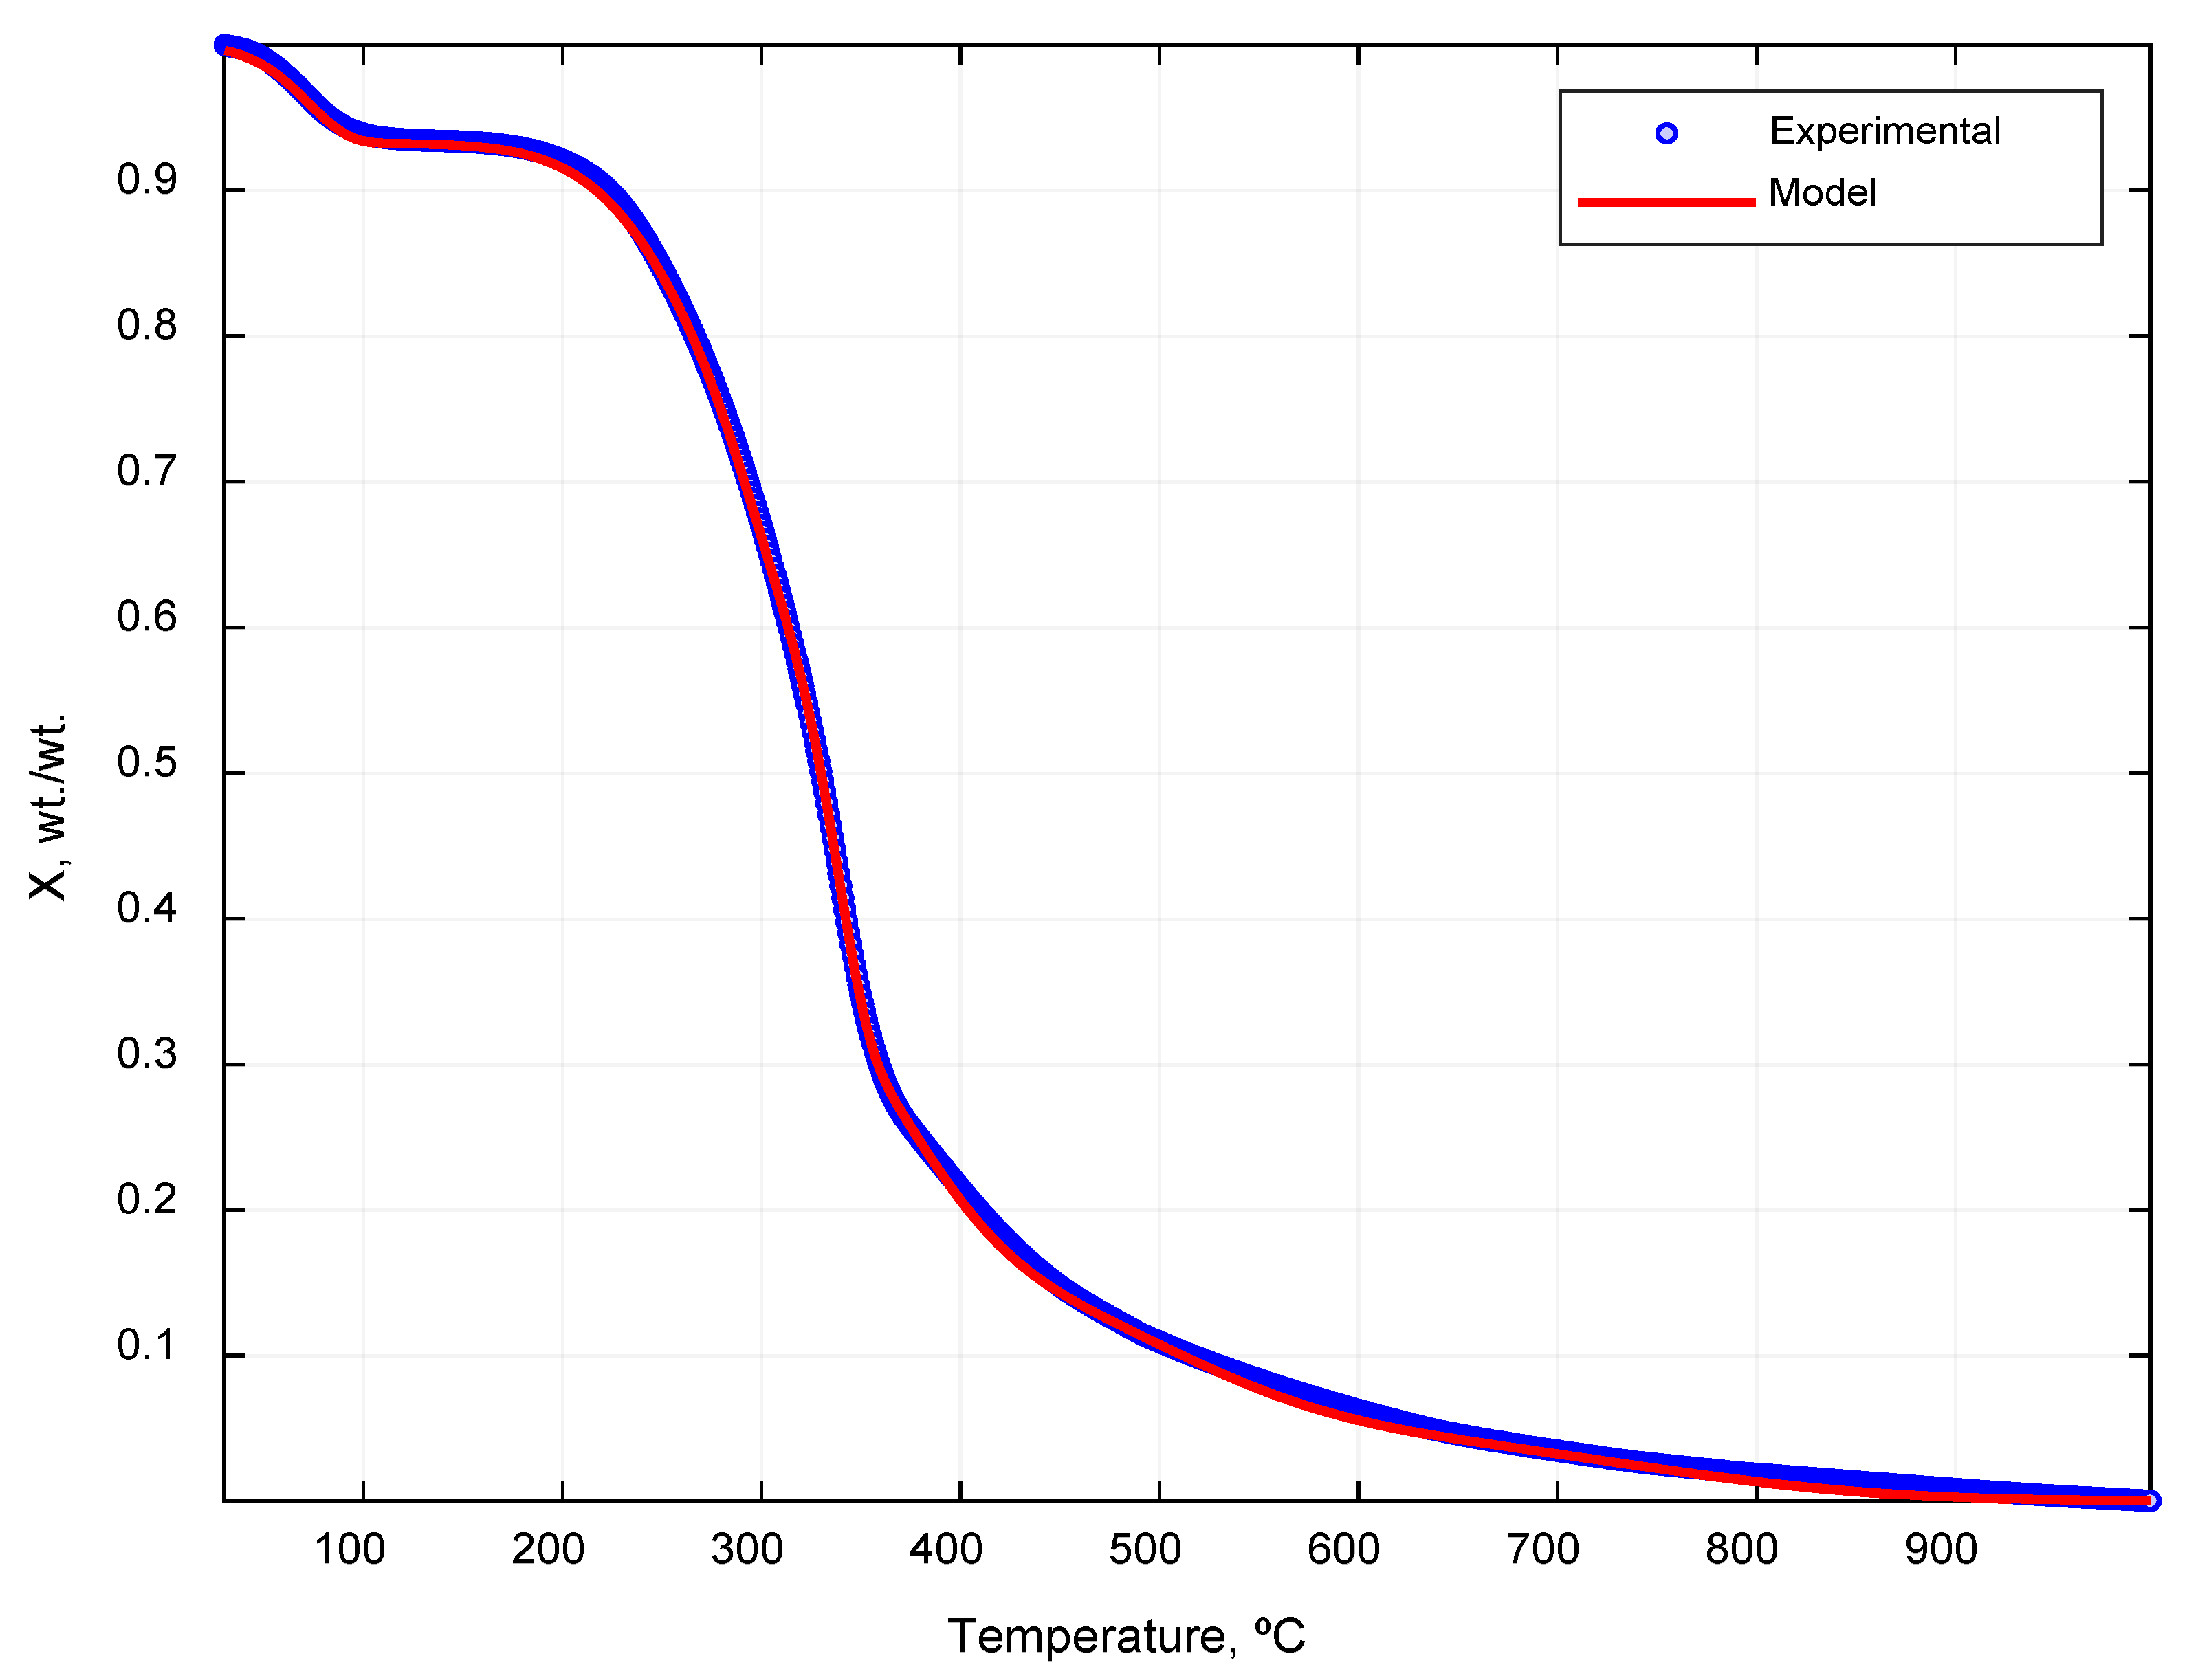
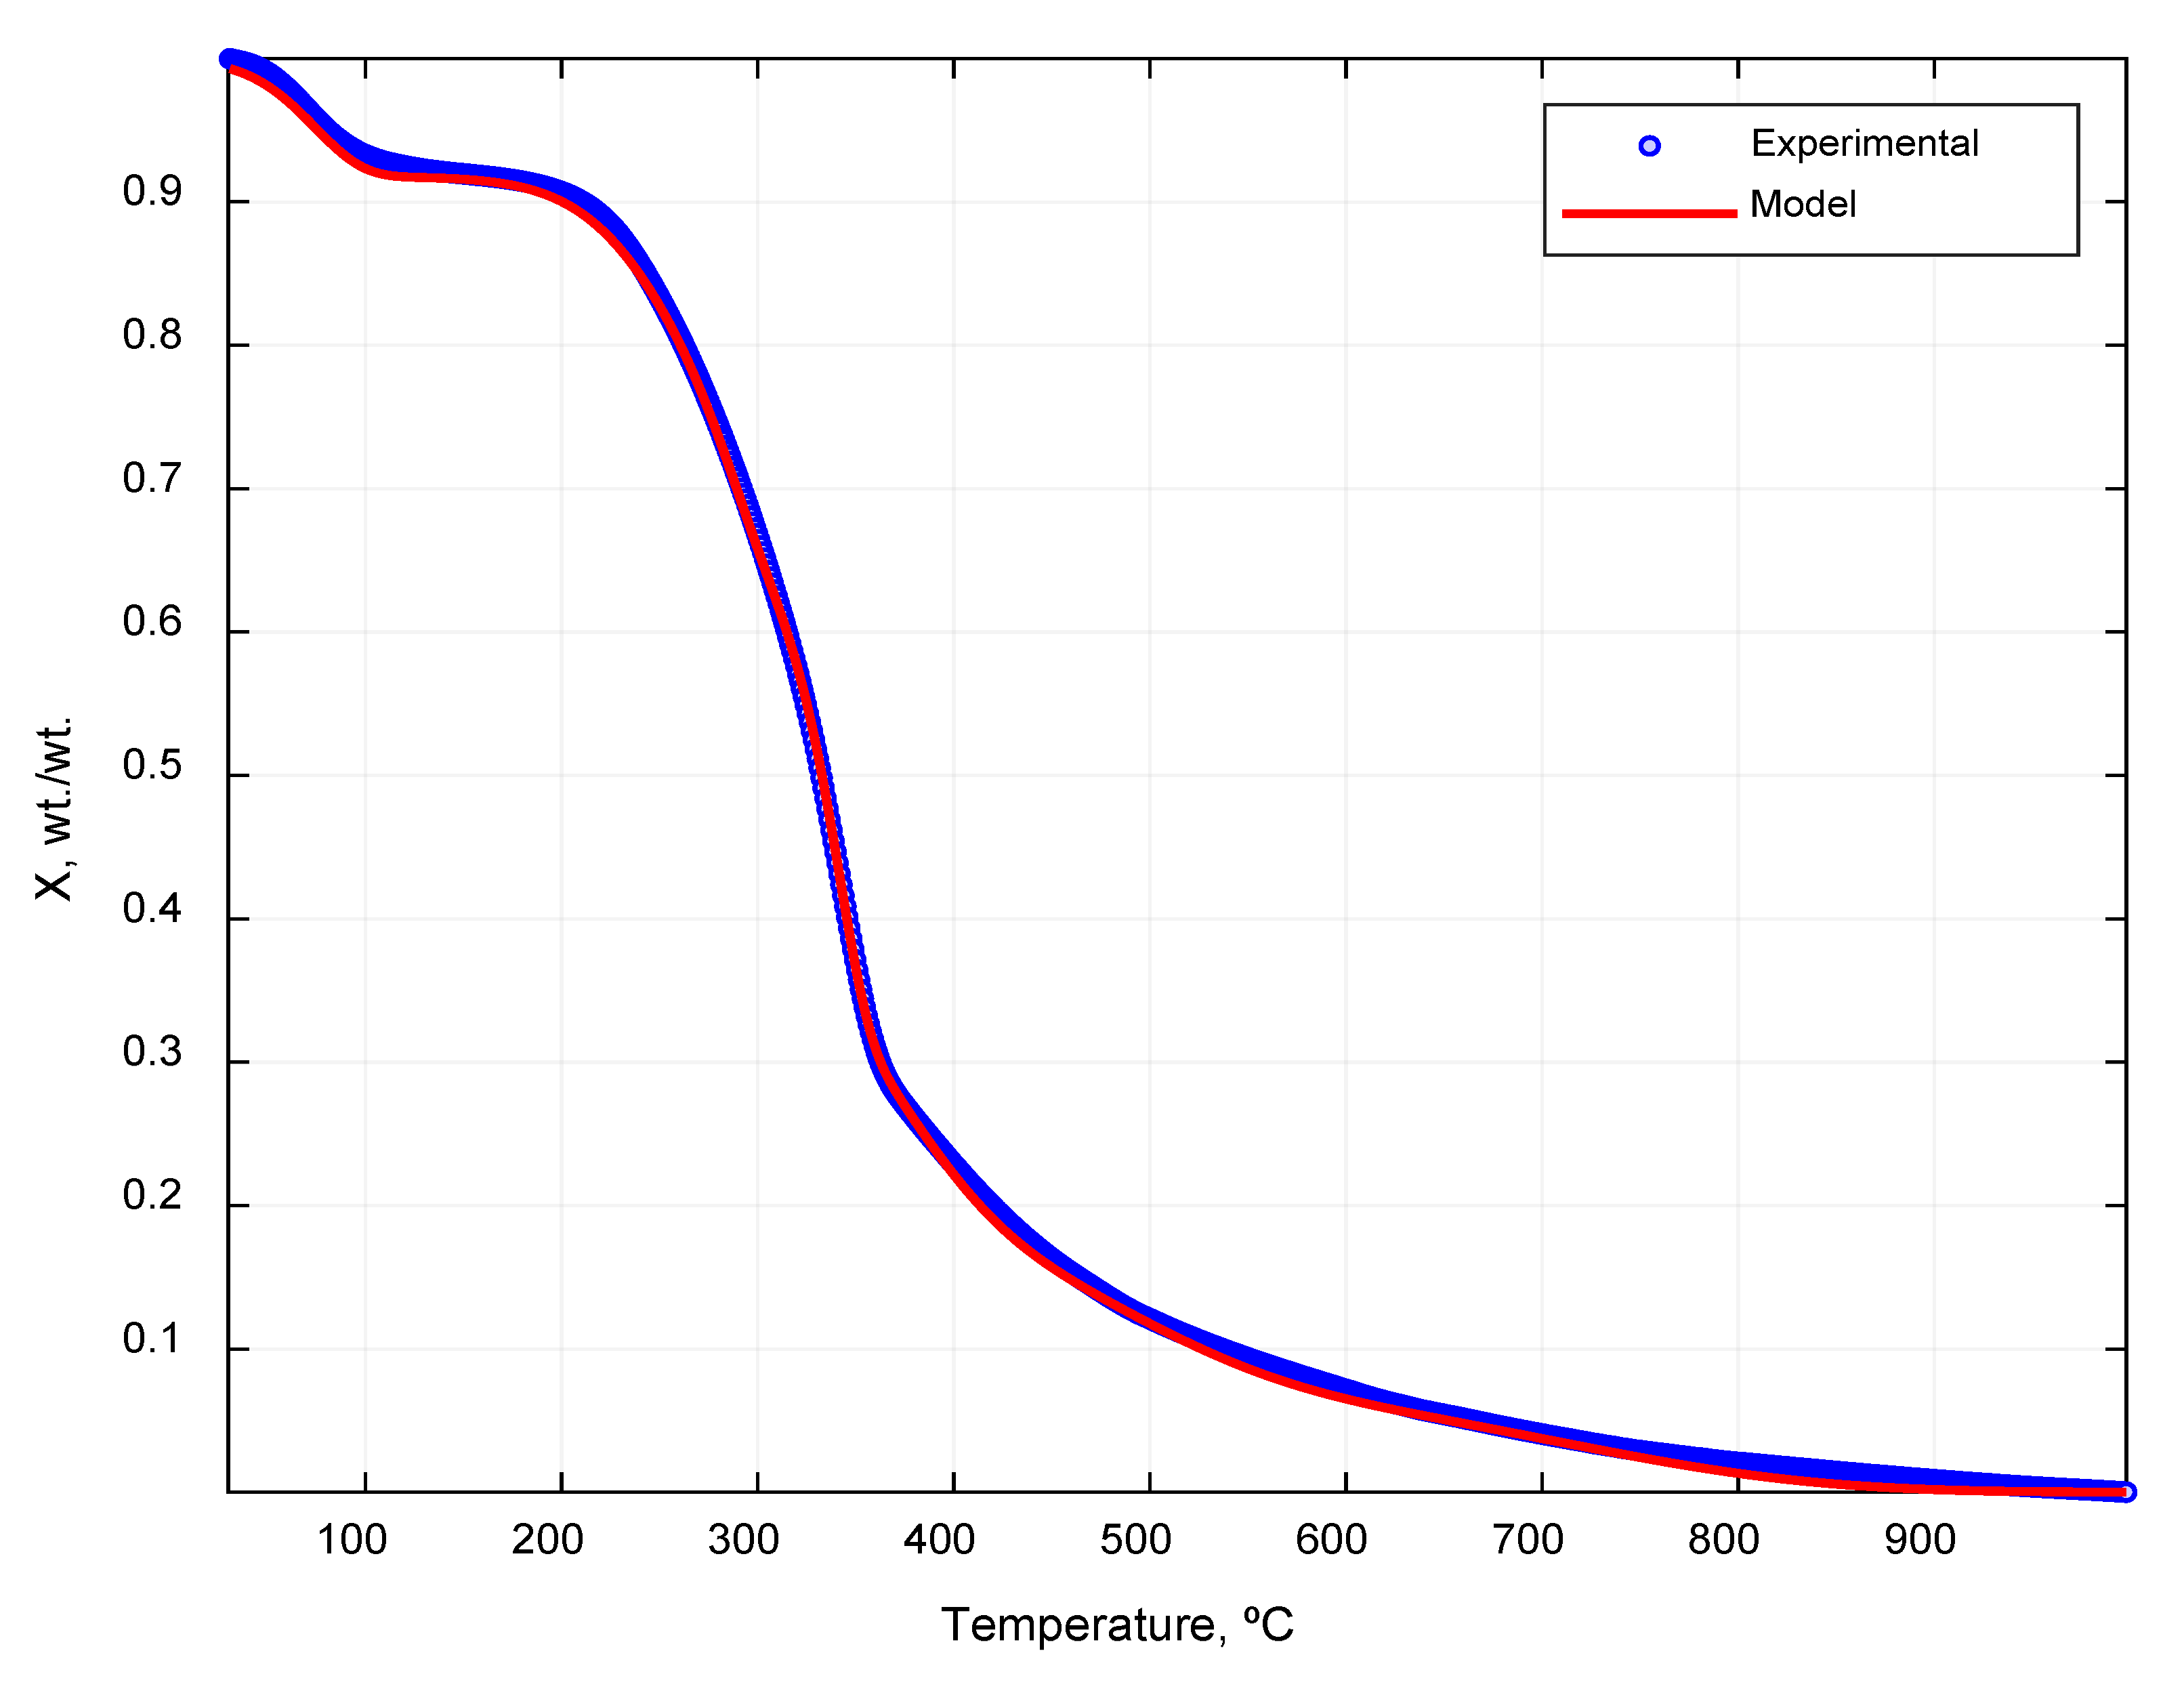
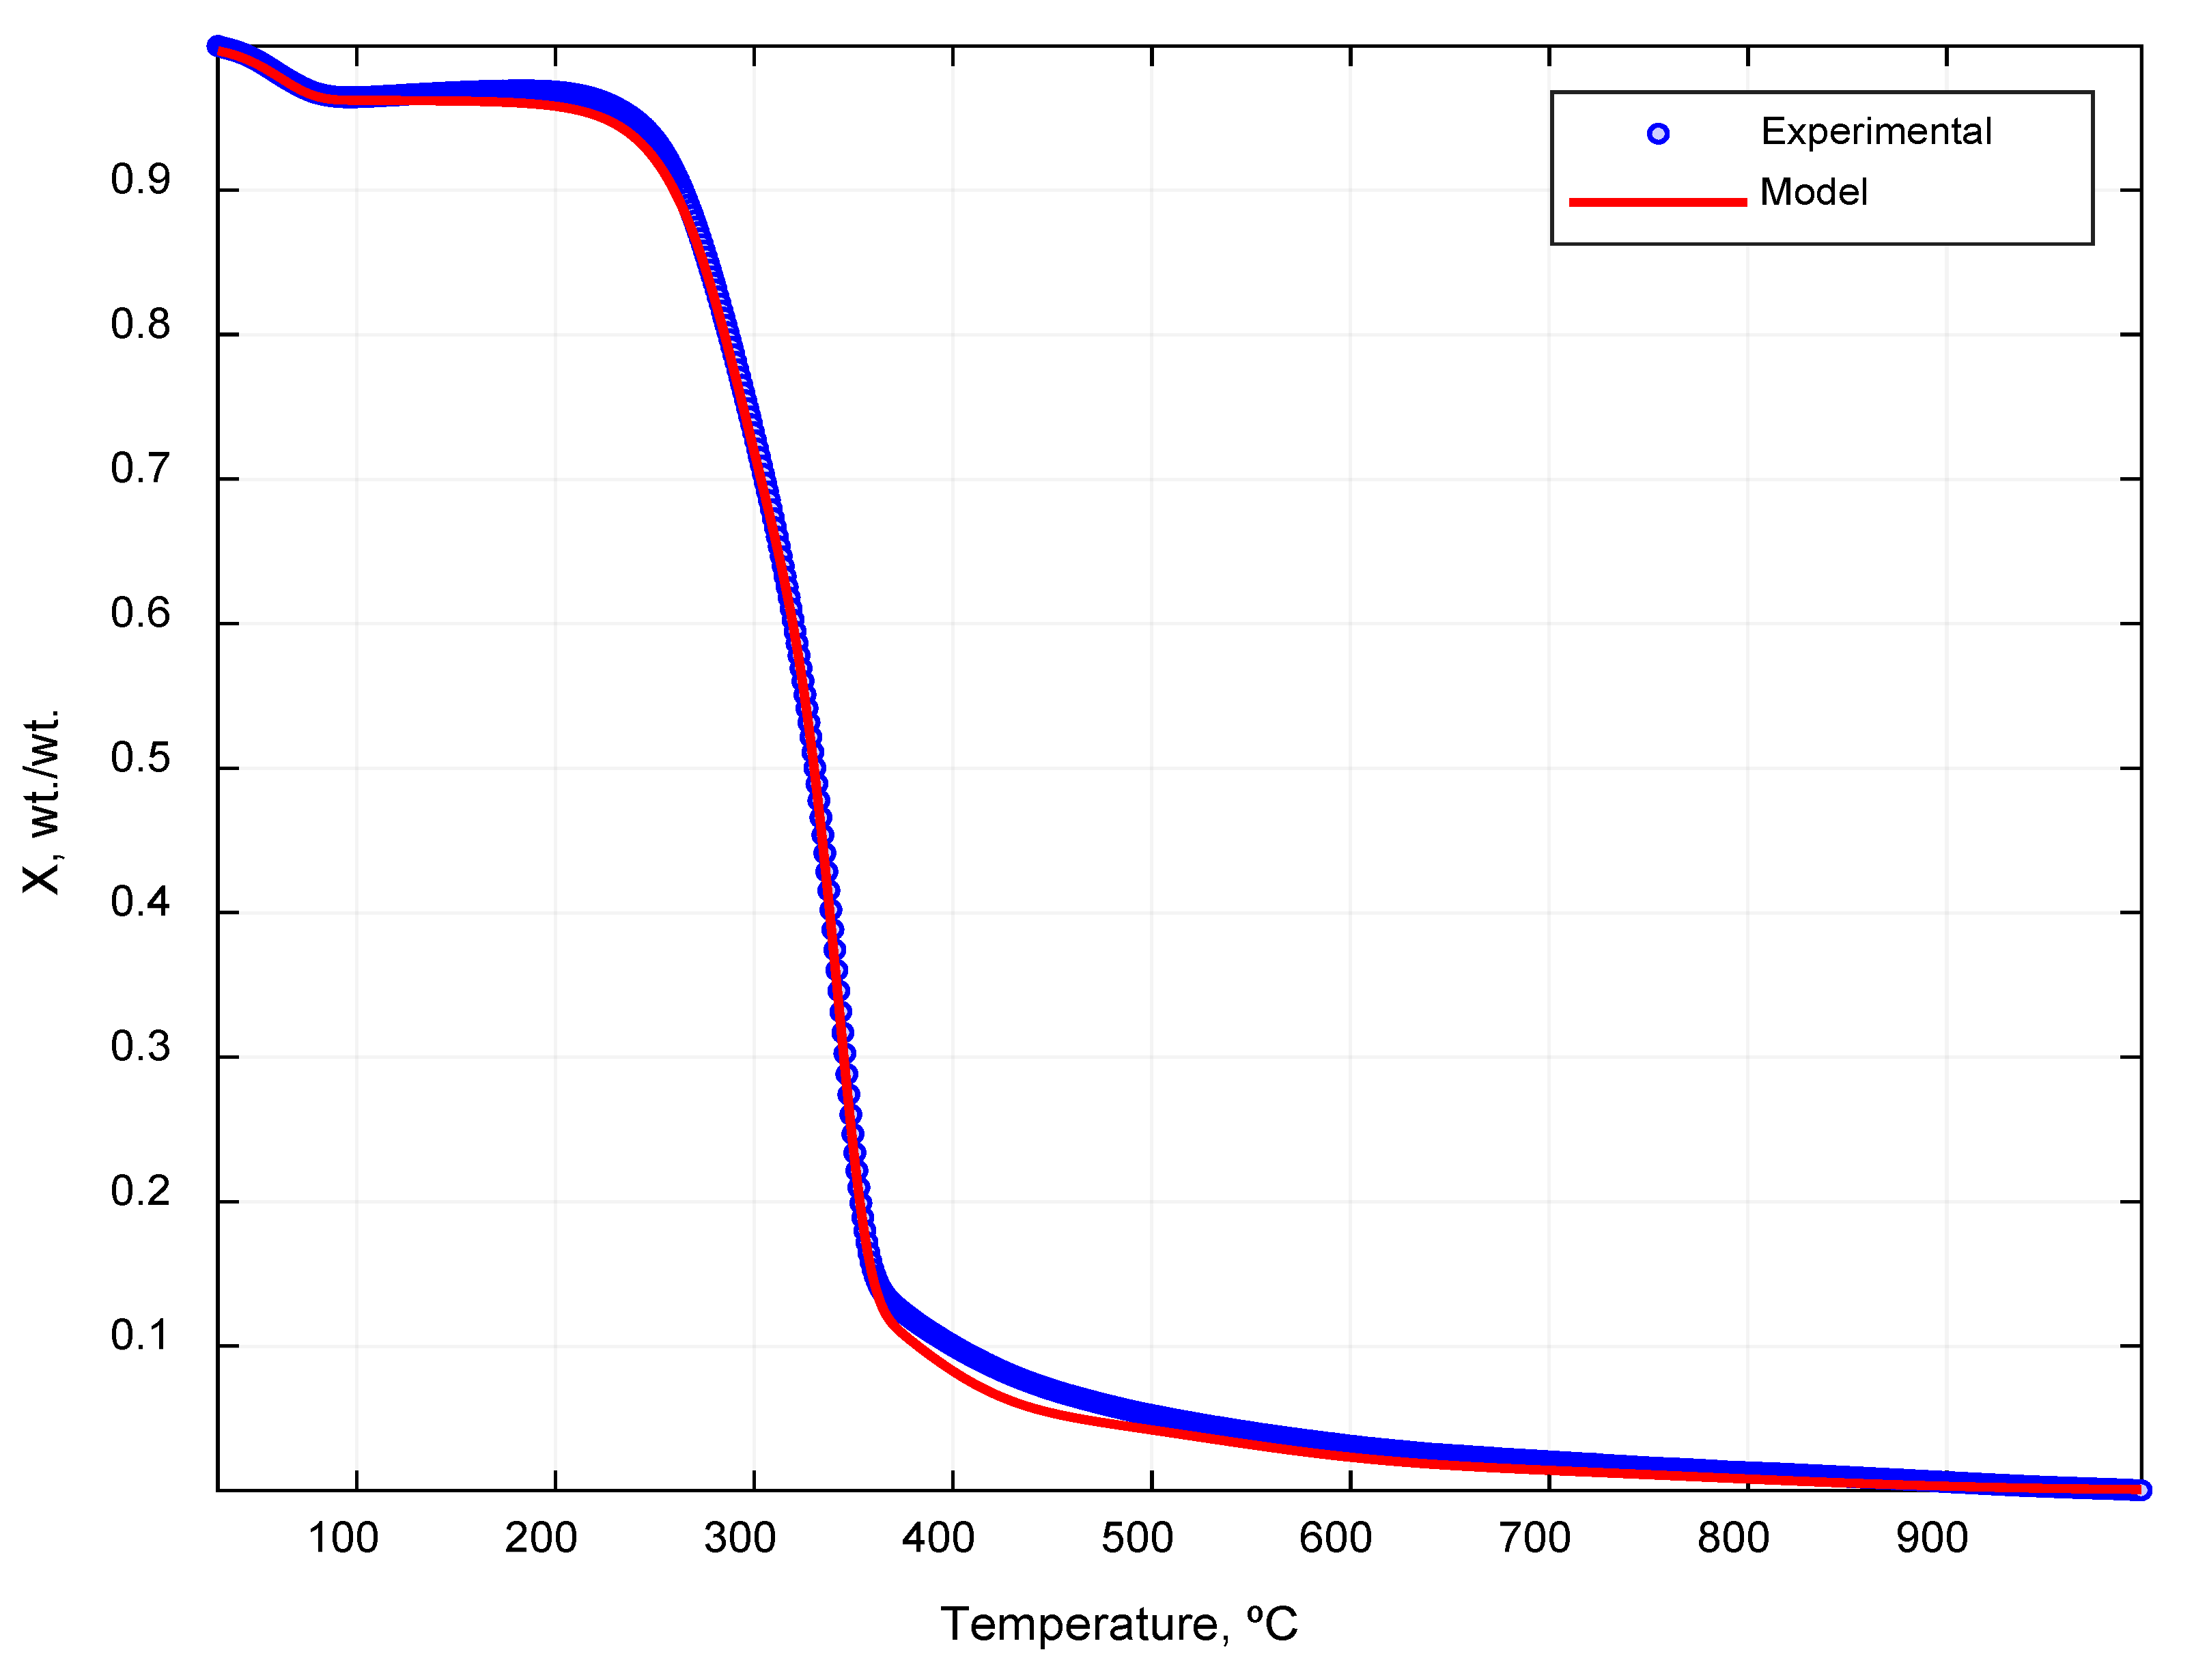
3.4. Validation of the TGA-PKM Method
4. Conclusions
Author Contributions
Funding
Acknowledgments
Conflicts of Interest
References
- Kim, S.; Dale, B.E. All biomass is local: The cost, volume produced, and global warming impact of cellulosic biofuels depend strongly on logistics and local conditions. Biofuels Bioprod. Biorefining 2015, 9, 422–434. [Google Scholar] [CrossRef]
- McKendry, P. Energy production from biomass (part 1): Overview of biomass. Bioresour. Technol. 2002, 83, 37–46. [Google Scholar] [CrossRef]
- Rego, F.; Dias, A.P.S.; Casquilho, M.; Rosa, F.C.; Rodrigues, A. Fast determination of lignocellulosic composition of poplar biomass by thermogravimetry. Biomass Bioenergy 2019, 122, 375–380. [Google Scholar] [CrossRef]
- Álvarez-Mateos, P.; Alés-Álvarez, F.J.; García-Martín, J.F. Phytoremediation of highly contaminated mining soils by Jatropha curcas L. and production of catalytic carbons from the generated biomass. J. Environ. Manag. 2019, 231, 886–895. [Google Scholar] [CrossRef] [PubMed]
- Snell, K.D.; Peoples, O.P. PHA bioplastic: A value-added coproduct for biomass biorefineries. Biofuels Bioprod. Biorefining Innov. Sustain. Econ. 2009, 3, 456–467. [Google Scholar] [CrossRef]
- Pereira, B.L.C.; Carneiro, A.D.C.O.; Carvalho, A.M.M.L.; Colodette, J.L.; Oliveira, A.C.; Fontes, M.P.F. Influence of chemical composition of Eucalyptus wood on gravimetric yield and charcoal properties. BioResources 2013, 8, 4574–4592. [Google Scholar] [CrossRef]
- Melzer, M.; Blin, J.; Bensakhria, A.; Valette, J.; Broust, F. Pyrolysis of extractive rich agroindustrial residues. J. Anal. Appl. Pyrolysis 2013, 104, 448–460. [Google Scholar] [CrossRef]
- Park, J.I.; Liu, L.; Ye, X.P.; Jeong, M.K.; Jeong, Y.S. Improved prediction of biomass composition for switchgrass using reproducing kernel methods with wavelet compressed FT-NIR spectra. Expert Syst. Appl. 2012, 39, 1555–1564. [Google Scholar] [CrossRef]
- Yu, J.; Paterson, N.; Blamey, J.; Millan, M. Cellulose, xylan and lignin interactions during pyrolysis of lignocellulosic biomass. Fuel 2017, 191, 140–149. [Google Scholar] [CrossRef]
- Shen, D.; Xiao, R.; Gu, S.; Luo, K. The pyrolytic behavior of cellulose in lignocellulosic biomass: A review. RSC Adv. 2011, 1, 1641–1660. [Google Scholar] [CrossRef]
- Shen, D.K.; Gu, S.; Bridgwater, A.V. The thermal performance of the polysaccharides extracted from hardwood: Cellulose and hemicellulose. Carbohydr. Polym. 2010, 82, 39–45. [Google Scholar] [CrossRef]
- Shen, D.K.; Gu, S. The mechanism for thermal decomposition of cellulose and its main products. Bioresour. Technol. 2009, 100, 6496–6504. [Google Scholar] [CrossRef] [PubMed]
- Li, S.; Lyons-Hart, J.; Banyasz, J.; Shafer, K. Real-time evolved gas analysis by FTIR method: An experimental study of cellulose pyrolysis. Fuel 2001, 80, 1809–1817. [Google Scholar] [CrossRef]
- Qiao, Y.; Wang, B.; Ji, Y.; Xu, F.; Zong, P.; Zhang, J.; Tian, Y. Thermal decomposition of castor oil, corn starch, soy protein, lignin, xylan, and cellulose during fast pyrolysis. Bioresour. Technol. 2019, 278, 287–295. [Google Scholar] [CrossRef]
- Wang, S.; Lin, H.; Ru, B.; Sun, W.; Wang, Y.; Luo, Z. Comparison of the pyrolysis behavior of pyrolytic lignin and milled wood lignin by using TG–FTIR analysis. J. Anal. Appl. Pyrolysis 2014, 108, 78–85. [Google Scholar] [CrossRef]
- Di Blasi, C. Modeling chemical and physical processes of wood and biomass pyrolysis. Prog. Energy Combust. Sci. 2008, 34, 47–90. [Google Scholar] [CrossRef]
- Zhou, H.; Long, Y.; Meng, A.; Li, Q.; Zhang, Y. The pyrolysis simulation of five biomass species by hemi-cellulose, cellulose and lignin based on thermogravimetric curves. Thermochim. Acta 2013, 566, 36–43. [Google Scholar] [CrossRef]
- Skreiberg, A.; Skreiberg, Ø.; Sandquist, J.; Sørum, L. TGA and macro-TGA characterisation of biomass fuels and fuel mixtures. Fuel 2011, 90, 2182–2197. [Google Scholar] [CrossRef]
- Carrier, M.; Loppinet-Serani, A.; Denux, D.; Lasnier, J.M.; Ham-Pichavant, F.; Cansell, F.; Aymonier, C. Thermogravimetric analysis as a new method to determine the lignocellulosic composition of biomass. Biomass Bioenergy 2011, 35, 298–307. [Google Scholar] [CrossRef]
- Hu, S.; Jess, A.; Xu, M. Kinetic study of Chinese biomass slow pyrolysis: Comparison of different kinetic models. Fuel 2007, 86, 2778–2788. [Google Scholar] [CrossRef]
- Aboyade, A.O.; Carrier, M.; Meyer, E.L.; Knoetze, J.H.; Görgens, J.F. Model fitting kinetic analysis and characterisation of the devolatilization of coal blends with corn and sugarcane residues. Thermochim. Acta 2012, 530, 95–106. [Google Scholar] [CrossRef]
- Vyazovkin, S.; Burnham, A.K.; Criado, J.M.; Pérez-Maqueda, L.A.; Popescu, C.; Sbirrazzuoli, N. ICTAC Kinetics Committee recommendations for performing kinetic computations on thermal analysis data. Thermochim. Acta 2011, 520, 1–19. [Google Scholar] [CrossRef]
- Manya, J.J.; Velo, E.; Puigjaner, L. Kinetics of biomass pyrolysis: A reformulated three-parallel-reactions model. Ind. Eng. Chem. Res. 2003, 42, 434–441. [Google Scholar] [CrossRef]
- Burhenne, L.; Messmer, J.; Aicher, T.; Laborie, M.P. The effect of the biomass components lignin, cellulose and hemicellulose on TGA and fixed bed pyrolysis. J. Anal. Appl. Pyrolysis 2013, 101, 177–184. [Google Scholar] [CrossRef]
- O’Brien, C.M. Statistical Applications for Environmental Analysis and Risk Assessment by Joseph Ofungwu. Int. Stat. Rev. 2014, 82, 487–488. [Google Scholar] [CrossRef]
- Raitanen, J.E.; Järvenpää, E.; Korpinen, R.; Mäkinen, S.; Hellström, J.; Kilpeläinen, P.; Jaana Liimatainen, J.; Ora, A.; Tupasela, T.; Jyske, T. Tannins of Conifer Bark as Nordic Piquancy—Sustainable Preservative and Aroma? Molecules 2020, 25, 567. [Google Scholar] [CrossRef] [Green Version]
- Hofbauer, H.; Kaltschmitt, M.; Nussbaumer, T. Energie aus Biomasse–Grundlagen, Techniken, Verfahren; Springer: Berlin, Germany, 2009. [Google Scholar]
- Demirbaş, A. Calculation of higher heating values of biomass fuels. Fuel 1997, 76, 431–434. [Google Scholar] [CrossRef]
- Rowell, R.M.; Pettersen, R.; Han, J.S.; Rowell, J.S.; Tshabalala, M.A. Cell wall chemistry. In Handbook of Wood Chemistry and Wood Composites; CRC Press: Boca Ratón, FL, USA, 2005; Volume 2. [Google Scholar]
- Wang, S.; Dai, G.; Yang, H.; Luo, Z. Lignocellulosic biomass pyrolysis mechanism: A state-of-the-art review. Prog. Energy Combust. Sci. 2017, 62, 33–86. [Google Scholar] [CrossRef]
- Pasangulapati, V.; Ramachandriya, K.D.; Kumar, A.; Wilkins, M.R.; Jones, C.L.; Huhnke, R.L. Effects of cellulose, hemicellulose and lignin on thermochemical conversion characteristics of the selected biomass. Bioresour. Technol. 2012, 114, 663–669. [Google Scholar] [CrossRef]
- González Martinez, M. Woody and Agricultural Biomass Torrefaction: Experimental Study and Modelling of Solid Conversion and Volatile Species Release Based on Biomass Extracted Macromolecular Components. Ph.D. Thesis, University of Toulouse, Toulouse, France, 2018. [Google Scholar]
- Saini, J.K.; Saini, R.; Tewari, L. Lignocellulosic agriculture wastes as biomass feedstocks for second-generation bioethanol production: Concepts and recent developments. 3 Biotech 2015, 5, 337–353. [Google Scholar] [CrossRef] [Green Version]
- González Martínez, M.; Dupont, C.; da Silva Perez, D.; Mortha, G.; Thiéry, S.; Meyer, X.M.; Gourdon, C. Understanding the torrefaction of woody and agricultural biomasses through their extracted macromolecular components. Part 1: Experimental thermogravimetric solid mass loss. Energy 2020, 205, 118067. [Google Scholar]
- Guo, X.J.; Wang, S.R.; Wang, K.G.; Qian, L.I.U.; Luo, Z.Y. Influence of extractives on mechanism of biomass pyrolysis. J. Fuel Chem. Technol. 2010, 38, 42–46. [Google Scholar] [CrossRef]
- Ebringerová, A.; Hromádková, Z.; Heinze, T.; Hemicellulose, T.H. Polysaccharides I. Adv. Polym. Sci. 2005, 186, 67. [Google Scholar]
- Yang, H.; Yan, R.; Chen, H.; Lee, D.H.; Zheng, C. Characteristics of hemicellulose, cellulose and lignin pyrolysis. Fuel 2007, 86, 1781–1788. [Google Scholar] [CrossRef]
- Chen, W.H.; Wang, C.W.; Ong, H.C.; Show, P.L.; Hsieh, T.H. Torrefaction, pyrolysis and two-stage thermodegradation of hemicellulose, cellulose and lignin. Fuel 2019, 258, 116168. [Google Scholar] [CrossRef]
- Yeo, J.Y.; Chin, B.L.F.; Tan, J.K.; Loh, Y.S. Comparative studies on the pyrolysis of cellulose, hemicellulose, and lignin based on combined kinetics. J. Energy Inst. 2019, 92, 27–37. [Google Scholar] [CrossRef]
- Korpinen, R.; Kallioinen, M.; Hemming, J.; Pranovich, A.; Mänttäri, M.; Willför, S. Comparative evaluation of various lignin determination methods on hemicellulose-rich fractions of spruce and birch obtained by pressurized hot-water extraction (PHWE) and subsequent ultrafiltration (UF). Holzforschung 2014, 68, 971–979. [Google Scholar] [CrossRef]
- Ioelovich, M. Methods for determination of chemical composition of plant biomass. J. SITA 2015, 17, 208–214. [Google Scholar]


| Biomass | Ref. | Hemicellulose, wt.% | Cellulose, wt.% | Lignin, wt.% | Extractives, wt.% | Ash, wt.% |
|---|---|---|---|---|---|---|
| Pine bark | [26] a | 25.0 | 19.0 | 38.0 | 18.0 | |
| Spruce bark | [24] a | 27.0 | 42.0 | 26.0 | ||
| [27] a | 24.3 | 41.0 | 30.0 | |||
| [28] a | 21.2 | 50.8 | 27.5 | |||
| [26] a | 28.0 | 22.0 | 31.0 | 19.0 | ||
| Poplar | [17] b | 26.0 | 50.0 | 24.0 | ||
| [19] a | 28.0 | 43.0 | 25.0 | 5 | ||
| [29] a | 18.0–26.6 | 46.5–52.0 | 16.0–25.9 | |||
| [3] b | 22.0 | 49.0 | 28.0 | |||
| [30] a | 24.0 | 49.0 | 20.0 | 5.9 | 1.0 | |
| Willow | [30] a | 16.7 | 41.7 | 29.3 | 9.7 | 2.5 |
| Wheat straw | [30] a,c | 24.6 | 39.2 | 17.0 | ||
| [28] a | 29.0 | 38.0 | 15.0 | |||
| [28] a | 39.1 | 28.8 | 18.6 | |||
| [30] a | 25.0 | 37.5 | 20.2 | 4.0 | 3.7 |
| Biomass Component | Analysis Method | Pine Bark | Spruce Bark | Poplar | Willow | Wheat Straw |
|---|---|---|---|---|---|---|
| Hemicellulose | TAPPI T249 | 18.30 | 13.90 | 21.70 | 22.60 | 23.80 |
| Cellulose | TAPPI T249 | 21.90 | 29.70 | 42.70 | 44.30 | 37.50 |
| Lignin | TAPPI T222 | 40.70 | 45.10 | 26.90 | 25.10 | 20.50 |
| Extractives | Internal Method | 15.20 | 4.40 | 8.00 | 15.70 | |
| TAPPI 204 | 4.90 | |||||
| Ash | XP CEN/TS 14775 | 2.80 | 2.80 | 2.30 | 8.30 | |
| TAPPI 211 | 5.22 |
| Component | Temperature Range, °C | Number of Pseudocomponents |
|---|---|---|
| Water | 25–150 | 1 |
| Hemicellulose | 200–350 | 2 |
| Cellulose | 250–400 | 1 |
| Lignin | 150–1000 | 3 |
| Kinetic Parameters | PC 2 | PC 3 | PC 4 | PC 5 | PC 6 | PC 7 |
|---|---|---|---|---|---|---|
| K (s−1) | 1.00 × 10⁹ | 1.50 × 10⁵ | 2.40 × 10¹⁵ | 5.00 × 101 | 3.00 | 1.80 |
| E (kJ mol−1) | 120.00 | 80.00 | 240.00 | 60.00 | 60.00 | 68.00 |
| Xj,0 (wt.%) | 50.00 | 50.00 | 60.00 | 60.00 | 20.00 | - |
| Kinetic Parameters | PC 2 | PC 3 | PC 4 | PC 5 | PC 6 | PC 7 |
|---|---|---|---|---|---|---|
| K (s−1) | 7.00 × 10⁸ | 1.40 × 10⁵ | 1.50 × 10¹⁵ | 4.00 × 10⁷ | 2.30 | 1.00 × 10⁻¹ |
| E (kJ mol−1) | 100.00 | 70.00 | 160.00 | 55.00 | 45.00 | 50.00 |
| Xj,0 (wt.%) | 0.1 | 1 | 5.00 | 15.00 | 0.10 | - |
| Water | Hemicellulose | Cellulose | Lignin | |||||
|---|---|---|---|---|---|---|---|---|
| Biomass | Kinetic Parameters | PC 1 | PC 2 | PC 3 | PC 4 | PC 5 | PC 6 | PC 7 |
| Pine bark | K (s−1) | 9.14 × 10⁴ | 6.00 × 10⁸ | 1.50 × 10⁵ | 1.69 × 10¹⁵ | 5.00 × 10 | 2.44 | 9.83 × 10⁻¹ |
| E (kJ mol−1) | 48.58 | 120.00 | 75.60 | 204.74 | 55.00 | 50.20 | 61.31 | |
| Xj,0 (wt.%) | 6.81 | 14.71 | 7.00 | 24.66 | 27.68 | 13.16 | 5.98 | |
| Spruce bark | K (s−1) | 4.52 × 10³ | 7.00 × 10⁸ | 1.42 × 10⁵ | 1.51 × 10¹⁵ | 5.00 × 10 | 2.33 | 1.11 |
| E (kJ mol−1) | 40.74 | 119.99 | 74.93 | 205.17 | 55.00 | 48.79 | 60.95 | |
| Xj,0 (wt.%) | 8.25 | 14.04 | 6.56 | 24.53 | 24.61 | 14.18 | 7.82 | |
| Poplar | K (s−1) | 7.22 × 10⁵ | 6.00 × 10⁸ | 1.40 × 10⁵ | 2.30 × 10¹⁵ | 4.81 × 10 | 2.79 | 5.07 × 10⁻¹ |
| E (kJ mol−1) | 52.44 | 120.00 | 80.00 | 207.39 | 55.00 | 53.22 | 59.71 | |
| Xj,0 (wt.%) | 3.81 | 21.72 | 1.00 | 51.85 | 15.34 | 4.24 | 2.04 | |
| Willow | K (s−1) | 2.98 × 10⁵ | 6.00 × 10⁸ | 1.47 × 10⁵ | 1.94 × 10¹⁵ | 5.00 × 10 | 2.60 | 8.77 × 10⁻¹ |
| E (kJ mol−1) | 50.69 | 120.00 | 74.88 | 208.03 | 55.00 | 49.43 | 62.61 | |
| Xj,0 (wt.%) | 4.69 | 21.91 | 1.91 | 44.33 | 15.00 | 8.25 | 3.91 | |
| Wheat straw | K (s−1) | 8.23 × 10⁵ | 6.00 × 10⁸ | 1.50 × 10⁵ | 1.51 × 10¹⁵ | 5.00 × 10 | 3.00 | 1.62 × 10⁻¹ |
| E (kJ mol−1) | 53.65 | 120.00 | 71.38 | 200.64 | 55.00 | 51.08 | 52.16 | |
| Xj,0 (wt.%) | 5.18 | 24.16 | 1.00 | 39.51 | 19.73 | 6.90 | 3.51 | |
| Component | Temperature, °C | E, kJ mol−1 | K, min−1 | Reference |
|---|---|---|---|---|
| Hemicellulose | 200–350 | 127.00 | 9.5 × 10¹⁰ | [38] |
| 83.20–96.40 | 4.55 × 10⁶–1.57 × 10⁸ | [39] | ||
| Cellulose | 300–340 | 227.02 | 3.36 × 10¹⁸ | [37] |
| 239.70–325.00 | 16.30 × 10¹⁹–3.62 × 1026 | [39] | ||
| Lignin | 220–380 | 7.80 | 2.96 × 10⁻³ | [37] |
| 25–900 | 47.90–54.50 | 6.80 × 10²–6.60 × 10⁴ | [17] | |
| 160–680 | 25.20 | 4.70 × 10² | [18] | |
| 20.00–29.10 | 5.35 × 10–3.18 | [39] |
| Biomass | QOF% | R2Adj |
|---|---|---|
| Pine bark | 1.51 | 0.9939 |
| Spruce bark | 1.94 | 0.9905 |
| Poplar | 1.09 | 0.9960 |
| Willow | 1.42 | 0.9933 |
| Wheat straw | 1.79 | 0.9921 |
| Biomass | Component | Analytical Method wt.%, Dry, Ash and Extractives-Free Basis | TGA-PKM Method wt.%, Dry, Ash and Extractives-Free Basis | Error, wt.% |
|---|---|---|---|---|
| Poplar | Hemicellulose | 23.77 | 23.62 | −0.15 |
| Cellulose | 46.77 | 53.90 | 7.14 | |
| Lignin | 29.46 | 22.48 | −6.99 | |
| Willow | Hemicellulose | 24.57 | 25.00 | 0.43 |
| Cellulose | 48.15 | 46.51 | −1.64 | |
| Lignin | 27.28 | 28.49 | 1.21 | |
| Wheat straw | Hemicellulose | 29.10 | 26.54 | −2.56 |
| Cellulose | 45.84 | 41.67 | −4.18 | |
| Lignin | 25.06 | 31.80 | 6.73 | |
| Spruce Bark | Hemicellulose | 15.67 | 22.45 | 6.78 |
| Cellulose | 33.48 | 26.74 | −6.74 | |
| Lignin | 50.85 | 50.81 | −0.04 | |
| Pine bark | Hemicellulose | 22.62 | 23.30 | 0.68 |
| Cellulose | 27.07 | 26.47 | −0.61 | |
| Lignin | 50.31 | 50.24 | −0.07 |
| Quality of the Fit | 3 °C min−1 | 5 °C min−1 | 10 °C min−1 | Global |
|---|---|---|---|---|
| QOF% | 1.16 | 1.58 | 0.96 | 1.35 |
| R2Adj | 0.9957 | 0.9917 | 0.9971 | 0.9959 |
| Hemicellulose | Cellulose | Lignin | |||||
|---|---|---|---|---|---|---|---|
| Number of Heating Rates | Kinetic Parameters | PC 2 | PC 3 | PC 4 | PC 5 | PC 6 | PC 7 |
| Single heating rate | K (s−1) | 6.00 × 10⁸ | 1.40 × 10⁵ | 2.30 × 10¹⁵ | 4.81 × 101 | 2.79 × 100 | 5.07 × 10⁻¹ |
| E (kJ mol−1) | 120.00 | 80.00 | 207.39 | 55.00 | 53.22 | 59.71 | |
| Xj,0 (wt.%) | 21.72 | 1.00 | 51.85 | 15.34 | 4.24 | 2.04 | |
| Three simultaneous heating rates | K (s−1) | 6.56 × 10⁸ | 1.50 × 10⁵ | 2.23 × 10¹⁵ | 5.49 × 101 | 2.79 × 100 | 5.57 × 10⁻¹ |
| E (kJ mol−1) | 119.98 | 77.18 | 207.48 | 55.00 | 53.99 | 57.48 | |
| Xj,0 (wt.%) | 22.78 | 1.46 | 49.97 | 15.08 | 3.88 | 1.51 | |
| Biomass | Component | Analytical Method Wt.%, Dry, Ash and Extractives-Free Basis | TGA-PKM Method (Three Simultaneous Heating Rates) wt.%, Dry, Ash and Extractives-Free Basis | Error, wt.% |
|---|---|---|---|---|
| Poplar | Hemicellulose | 23.77 | 25.60 | 1.83 |
| Cellulose | 46.77 | 52.78 | 6.01 | |
| Lignin | 29.46 | 21.62 | −7.85 |
© 2020 by the authors. Licensee MDPI, Basel, Switzerland. This article is an open access article distributed under the terms and conditions of the Creative Commons Attribution (CC BY) license (http://creativecommons.org/licenses/by/4.0/).
Share and Cite
Díez, D.; Urueña, A.; Piñero, R.; Barrio, A.; Tamminen, T. Determination of Hemicellulose, Cellulose, and Lignin Content in Different Types of Biomasses by Thermogravimetric Analysis and Pseudocomponent Kinetic Model (TGA-PKM Method). Processes 2020, 8, 1048. https://doi.org/10.3390/pr8091048
Díez D, Urueña A, Piñero R, Barrio A, Tamminen T. Determination of Hemicellulose, Cellulose, and Lignin Content in Different Types of Biomasses by Thermogravimetric Analysis and Pseudocomponent Kinetic Model (TGA-PKM Method). Processes. 2020; 8(9):1048. https://doi.org/10.3390/pr8091048
Chicago/Turabian StyleDíez, David, Ana Urueña, Raúl Piñero, Aitor Barrio, and Tarja Tamminen. 2020. "Determination of Hemicellulose, Cellulose, and Lignin Content in Different Types of Biomasses by Thermogravimetric Analysis and Pseudocomponent Kinetic Model (TGA-PKM Method)" Processes 8, no. 9: 1048. https://doi.org/10.3390/pr8091048