Article

Mesoporous Mn-Doped Fe Nanoparticle-Modified Reduced Graphene Oxide for Ethyl Violet Elimination: Modeling and Optimization Using Artificial Intelligence

1
Guizhou Provincial Key Laboratory for Information Systems of Mountainous Areas and Protection of Ecological Environment, Guizhou Normal University, Guiyang 550001, China
2
Cultivation Base of Guizhou National Key Laboratory of Mountainous Karst Eco-Environment, Guizhou Normal University, Guiyang 550001, China
3
Department of Applied Chemistry, College of Chemistry and Molecular Engineering, Peking University, Beijing 100871, China
*
Author to whom correspondence should be addressed.
Processes 2020, 8(4), 488; https://doi.org/10.3390/pr8040488
Submission received: 16 February 2020 / Revised: 14 April 2020 / Accepted: 16 April 2020 / Published: 22 April 2020
(This article belongs to the Special Issue Application of Advanced Oxidation Processes)

Abstract

:
Mesoporous Mn-doped Fe nanoparticle-modified reduced graphene oxide (Mn-doped Fe/rGO) was prepared through a one-step co-precipitation method, which was then used to eliminate ethyl violet (EV) in wastewater. The prepared Mn-doped Fe/rGO was characterized by X-ray diffraction, X-ray photoelectron spectroscopy, Raman spectroscopy, high-resolution transmission electron microscopy, scanning electron microscopy, energy dispersive spectroscopy, N2-sorption, small angle X-ray diffraction and superconducting quantum interference device. The Brunauer–Emmett–Teller specific surface area of Mn-doped Fe/rGO composites was 104.088 m2/g. The EV elimination by Mn-doped Fe/rGO was modeled and optimized by artificial intelligence (AI) models (i.e., radial basis function network, random forest, artificial neural network genetic algorithm (ANN-GA) and particle swarm optimization). Among these AI models, ANN-GA is considered as the best model for predicting the removal efficiency of EV by Mn-doped Fe/rGO. The evaluation of variables shows that dosage gives the maximum importance to Mn-doped Fe/rGO removal of EV. The experimental data were fitted to kinetics and adsorption isotherm models. The results indicated that the process of EV removal by Mn-doped Fe/rGO obeyed the pseudo-second-order kinetics model and Langmuir isotherm, and the maximum adsorption capacity was 1000.00 mg/g. This study provides a possibility for synthesis of Mn-doped Fe/rGO by co-precipitation as an excellent material for EV removal from the aqueous phase.

Graphical Abstract

1. Introduction

Decolorization of organic dyes in industrial wastewater is an essential process for achieving a pollution free environment [1]. Since these dyes are toxic substances and produce unpleasant odors and non-biodegradable wastes, they pose significant hazards to the environment and the health of humans. For example, it may affect the growth of plants and pose a carcinogenic threat to humans and other mammals [1,2,3]. Triphenylmethane (TPM) dyes are the third largest category in synthetic dyes after azo and anthraquinone dyes, and they are mainly used in food, paper, cosmetic, leather and textile industries [4,5,6,7]. It is estimated that about 15% of the total world production of dyes is lost during the dyeing process, and this quantity is then released into the wastewater [8].
Ethyl violet (EV) (C31H42ClN3, MW = 492.15 g/mol) is a typical cationic dye of triphenylmethane (Figure 1), which is toxic and has strong coloring ability and is difficult to degrade in the natural environment. Current approaches to detoxify the dye wastewater include Fenton or photo-Fenton oxidation, reduction by zero-valence metals, coagulation/flocculation, electrochemical oxidation, biological treatment, membrane filtration, ozonation, electrochemical degradation and adsorption [1,9,10,11,12,13,14,15]. Among these options, zero-valence metals have attracted considerable attention in industries due to their ease of synthesis and operation, low cost and high adsorption capacity [9].
Nanoscale zero-valence iron (nZVI) is widely used in the removal of dyes, heavy metals, trichloroethylene and nitrate wastewater because of its large specific surface area and high reactivity [16,17,18,19,20]. However, the bulk of the synthesized nZVI tends to agglomerate over time, which ultimately reduces the specific surface area and reactivity of these iron nanoparticles [21,22]. Bimetallic nanoparticles are formed by the combination of Fe and Mn to improve the reactivity and function of nZVI, but Mn/Fe nanoparticles are also prone to agglomeration. Graphene oxide (GO) is a good substrate material for Mn/Fe nanoparticles that can disperse nanoparticles and avoid agglomeration. GO has a large specific surface area (theoretical value is about 2600 m2/g), good chemical stability and abundant functional groups and is easily dispersed in water to produce stable suspensions [23,24,25,26]. In addition, it can be obtained from inexpensive bulk graphite and has been proved to be biodegradable and non-toxic [27,28]. Due to these unique characteristics, this material has great application prospects in sensors, membrane material, catalysis, electrochemistry, energy storage devices, cell supercapacitors and other fields [29,30,31,32,33,34,35,36].
At present, artificial intelligence (AI) has led to enormous breakthroughs in big data, automatic driving, pattern recognition, speech recognition, human-computer games, automatic programming, computer vision, robots and intelligent searches, which will have a far-reaching impact on human society [37,38]. Artificial neural network (ANN) is one of the major AI tools, which is inspired by human brain recognition and can be used for predicting and modeling phenomena [39]. ANN is a non-linear dynamical system, which can accurately express the complex correlation between inputs and outputs. The trained ANN models have already worked for the prognosis and optimal routes in a variety of fields based on appointed parameter settings [40]. The back propagation (BP) neural network algorithm is a multilayer feedforward network and can be trained according to the forward propagation of operating signal and the back propagation of error [41]. It is one of the most widely used neural networks. In recent years, the radial basis function (RBF) neural network has attracted much attention because of its ability to approximate nonlinear behavior. RBF-NN has the advantages of simple network structure, fast learning ability and strong approximation ability, and does not encounter local minimal problems [42]. Genetic algorithm (GA) and particle swarm optimization (PSO) have a parallel search strategy and global optimization characteristics, which can facilitate the ANN to achieve fast convergence and high prediction accuracy [43,44]. As an ensemble learning technology, random forest (RF) can improve the accuracy of single-model classification methods and solve the problem of over-fitting [45,46]. The goal of RF is to reduce the correlation among the separate trees by randomizing and bootstrapping variable selection methods, which results in the reduction of variance in tree aggregation [42].
The overall objectives of this study were to synthesize mesoporous Mn-doped Fe/rGO nanocomposites by a co-precipitation method and investigate ultrasonic assisted fast removal of EV from simulated wastewater. The prepared nanocomposites were characterized by X-ray diffraction (XRD), X-ray photoelectron spectroscopy (XPS), Raman spectroscopy, high-resolution transmission electron microscopy (HRTEM), scanning electron microscopy (SEM), energy dispersive spectroscopy (EDS), N2-sorption, small angle X-ray diffraction (SA-XRD) and superconducting quantum interference device (SQUID). AI tools (ANN-GA, ANN-PSO, RF and RBF) were combined with response surface methodology (RSM) to optimize the removal efficiency of Mn-doped Fe/rGO nanocomposites for EV. Various parameters (initial EV concentration, sonication time, pH and amount of adsorbent (Mn-doped Fe/rGO) on the removal efficiency of EV were examined through batch experiments. The importance of four factors in the removal process was evaluated by the Garson method, RF, variance analysis and gradient boosting regression tree (GBRT). The adsorption kinetics and isotherm of the adsorbent for EV were studied.

2. Materials and Methods

2.1. Chemicals

All chemicals used in this work were of analytical grade. FeSO4 7H2O and H2O2 were obtained from Chengdu Jinshan Chemical Reagent Co., Ltd. (Sichuan, China). MnCl2 4H2O was supplied by Tianjin Bodi Chemical Co., Ltd. (Tianjin, China). NaBH4 was purchased from Tianjin Kermel Chemical Reagent Co., Ltd. (Tianjin, China). HCl, H2SO4 and NaOH were obtained from Sinopharm Chemical Reagent Co., Ltd. (Shanghai, China). C2H5OH was procured from Tianjin Fuyu Fine Chemistry Engineering Co., Ltd. (Tianjin, China). Graphite powder was provided by Sinopharm Chemical Reagent (Beijing, China). Ethyl violet (purity ˃ 90%, C31H42ClN3, molecular weight = 492.14 g/mol) was purchased from Shanghai Acmec Biochemical Co. Ltd. (Shanghai, China), and 1000 mg/L stock solution of EV was prepared with deionized water.

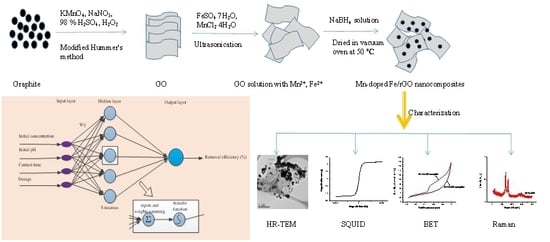
2.2. Fabrication of Fe–Mn and Mn-doped Fe/rGO

GO was synthesized following the improved Hummers method by Shi et al. [47]. The Mn-doped Fe/rGO nanocomposites were prepared by a one-step synthesis approach (Figure 2). FeSO4·7H2O (10 g/100 mL), MnCl2·4H2O (3.60 g/50 mL) and GO suspensions (1.0 g/300 mL) were mixed with ultrasound for 2 h, which was stirred at room temperature for 12 h. Then, NaBH4 (5.4 g/50 mL) solution was slowly added under a nitrogen atmosphere. The Mn-doped Fe/rGO nanocomposites (Mn:Fe = 1:2) were treated with deionized water and ethanol several times and dried in a vacuum oven at 50 °C. Additionally, bimetallic Fe–Mn nanoparticles were synthesized by the same method without adding GO.

2.3. Characterization

Phase structures of GO, Fe–Mn and Mn-doped Fe/rGO were measured by X-ray diffraction (XRD) using a Philips Analytical X-ray (Lelyweg 1 7602, EA, Almelo, The Netherlands) with a Cu-Kα X-ray source at 40 KV and 40 mA within the 2θ angle range from 5 to 90°. The X-ray photoelectron spectroscopy (XPS) was observed by the surface chemical states of the samples using an ESCALAB 250Xi spectrometer (Thermo Electron Corporation, Waltham, MA, USA). Raman spectra were recorded using a Raman spectrometer (LabRAM HR800, Horiba Jobin Yvon, Paris, France) with a 532 nm laser. The morphologies of samples were studied by a high-resolution transmission electron microscope (HR-TEM) and scanning electron microscope (SEM) with an energy dispersive spectrometer (EDS). A nitrogen adsorption–desorption apparatus at 77 K (Quadrasorb SI, Quantachrome Instruments, Boynton Beach, Florida, USA) was employed to determine the Brunauer–Emmet–Teller (BET) specific surface area. The ordered structure of mesoporous Mn-doped Fe/rGO was evaluated using small angle X-ray diffraction (SA-XRD). The magnetic properties of nanocomposites were estimated by a superconducting quantum interference device (SQUID).

2.4. Dye Removal Procedure

The EV adsorption experiments were conducted using solutions with varying pH, sonication time (min), EV concentration (mg/L) and amount of adsorbent (mg) in 100 mL conical flasks, and reactions were carried out at room temperature using an ultrasonic agitation. Then, initial pH of EV solutions was adjusted to expected values by 0.1 mol/L HCl and 0.1 mol/L NaOH. The mixed solution was separated by a magnet and supernatant was obtained. The supernatant liquid was determined using a UV–VIS spectrophotometer at a wavelength of 595 nm. The dye removal percentage was calculated by the following equation:
Y ( % ) = ( C 0 C t ) / C 0 × 100   %
where Y is the removal percentage of EV, C0 is the initial dye concentration (mg/L) and Ct is the concentration of unadsorbed dye residual in the solution. The amount of EV removal at equilibrium was calculated as follows:
q e = ( C 0 C t ) × V / m s
where qe is the removal equilibrium of EV (mg/g), V is the volume of EV solution and ms is the adsorbent dosage (g).

2.5. Response Surface Methodology

Response surface methodology (RSM) consists of the following three steps: experimental statistical design, estimation of variable coefficients in empirical formulas and final prediction of response, model validation and adequacy study [48]. The parameter contributions of Mn-doped Fe/rGO nanocomposites to the elimination of ethyl violet dye were studied by central composite design (CCD). According to the principle of central combination design, there are five levels of code values (−α, −1, 0, 1, α) in each coefficient, which represent the actual operating parameters as presented in Table 1.
Y = β 0 + i = 1 k β i X i + i = 1 k β i i X i 2 + i = 1 k i j = 1 k β i j X i X j + ε
where Y is the response variable; β0, βi, βii and βij are the constant, the linear, the quadratic and the interaction coefficients, respectively; ε is error; Xi and Xj are the independent variables.
Analysis of variance (ANOVA) was the statistical analysis method used to explain the complex relationship between two dependent variables and four independent variables in the whole set of data.

2.6. Artificial Neural Network (ANN)

BP-ANN is one of the most widely used ANN methods. Generally, computational neural networks are superior to rule-based and knowledge-based expert systems because they have better fault tolerance and generalization capabilities [49]. In this study, MATLAB R2016a software was used for all computations related to neural networks. A non-linear prediction model based on RSM data was established by using three layers (input layer, hidden layer and output layer) of BP-ANN. There were four inputs (i.e., initial pH, dosage, initial EV concentration and sonication time) and one output (i.e., elimination efficiency), as demonstrated in Figure 3. In the 30 experimental data groups of RSM, network training was conducted with groups 1–24, and network testing was conducted with groups 25–30. In the process of neural network training, 30 samples were normalized in the range of 0.1 to 0.9 (Equation (13)) [39]. According to the model results, the calculation equations for mean square error (MSE) and the R2 correlation coefficient can be written as follows [50]:
y = 2 × ( x x min x max x min ) 1
M S E = 1 N i = 1 N ( | y p r d , i y exp , i | ) 2
R 2 = 1 i = 1 N ( y p r d , i y e x p , i ) i = 1 N ( y p r d , i y m )
where x is the input variable in a group of variables to be scaled, y is the normalized value of x, xmax and xmin are the maximum and minimum value of x, respectively, yprd,i is the predicted value by the ANN model, yexp,i is the experimental value, N is the number of data and ym is the average of the experimental values.
GBRT is one of the most effective machine learning models, which is suitable for complex nonlinear relations. For regression problems, GBRT is a combination of gradient boosting and regression trees for solving problems that uses ensembles of regression trees to reduce the error over a large single-tree model [51]. The GBRT model (developed with R, version 2.9.2) was used to evaluate the importance of four parameters, which were measured according to the co-occurrence frequency of these characteristics in all splits of decision trees [52]. The relative influence of the individual variable was calculated by the following Garson equation [53,54]:
I a b = e n ( | w a e | g m | w g e | | w e b | ) z n ( l n ( | w a l | g m | w g e | | w e b | ) )
where Iab is the relative importance of the jth input variable on the output variable; wx is the connection weight; a, e and b are the number of neurons in the input layer, hidden layer and output layer, respectively.

2.7. Optimization Using ANN-GA and ANN-PSO Models

A suitable combination of variables was selected to check the aptness of the model. Experiments were carried out with the optimal four variables to verify the prediction models as proposed by ANN-GA and ANN-PSO [55]. GA is a stochastic optimization technology developed based on genetic mechanisms and Darwin’s theory of evolution [56,57]. Simply, GA involves a randomly generated initial population and uses genetic operators (selection, mutation and crossover) to modify the population [56]. The algorithm is used to explore different regions of parameter space and to determine optimal conditions for removal of EV [58]. Kennedy and Eberhart have proposed the PSO method, which is an evolutionary computational algorithm [59]. PSO is similar to GA, which initializes the system with the population of random solutions and also uses the concept of population and evolutionary iteration to achieve the purpose of optimization [59,60]. In the first step of PSO, the random position and velocity of each particle were given. The fitness values of each particle was calculated at the initial location by contrasting the properties of known parameters (i.e., initial pH, sonication time, initial concentration, adsorbent dosage) and was obtained with the prediction results. The closeness between simulated and known properties was defined as the fitness value of particles at any given position, and particles with the highest fitness value were selected as the global optimum particles in the whole operation [61]. On the basis of evolutionary mechanisms, all particles guided by the global optimum eventually converged to some system optimum of the optimized problem by successively executing a certain number of iterations [62].

2.8. Random Forest

Random forest (RF), as an ensemble classifier, consists of multiple decision trees [45,63], which combines the classification tree and regression tree by a bagging algorithm. In random forests, decision trees are independent of each other and have different classification results. Decision trees are also called classification trees, in which leaves and branches are represented in class labels and the connection of feature vectors leading to class labels, respectively [63]. Decision trees are derived from a decision tree learning algorithm in which data sets are divided into different subsets according to attribute value tests. This segmentation process is called recursive partitioning. Each internal node delegates an input trait, and each node has a child of another input characteristic [63]. The advantages of RF are as follows: (1) random variable selection seeks to minimize the correlation among trees in the set, which gives a lower error rate; (2) in order to obtain fast learning and prevent over-fitting, random selection of bootstrap samples can be guided to construct bootstrap data sets (sub-training sample sets) [64,65]. The RF model was established using R studio (version 3.4.4.).

2.9. Radial Basis Function Neural Network

Radial basis function (RBF) neural network is a typical feed-forward network, which consists of three layers, namely the input layer, hidden layer and output layer [66]. The hidden layer contains many nodes, and each node uses a non-linear activation function (φ(r)) [67,68]. The input layer takes the input parameters as input vectors, from input layer to hidden layer, nonlinear transformation of input vectors as activation functions of neurons (i.e., radial basis function) and the conversion from hidden layer to output layer is a linear transfer function [67]. In this work, we investigated four main parameters (as input data) including initial dye concentration (250–450 mg/L), initial pH (3–7), sonication time (7–19 min) and dosage (10–22 mg) and EV removal percentage (as output data) with RBF. The radial basis function is expressed by a Gaussian function as follows [69]:
φ i j = exp ( x j c i 2 σ j 2 )
where xj is the input vector, ‖ ‖ is a measure of Euclidean distance and ci and σj are the center and the spread of jth the RBF, respectively. The output node fk(x) is calculated as follows [69]:
f k ( x ) = j = 1 m ( w k j φ j ( x ) )
where wkj is the weight connection between the hidden and output layers.

3. Results and Discussion

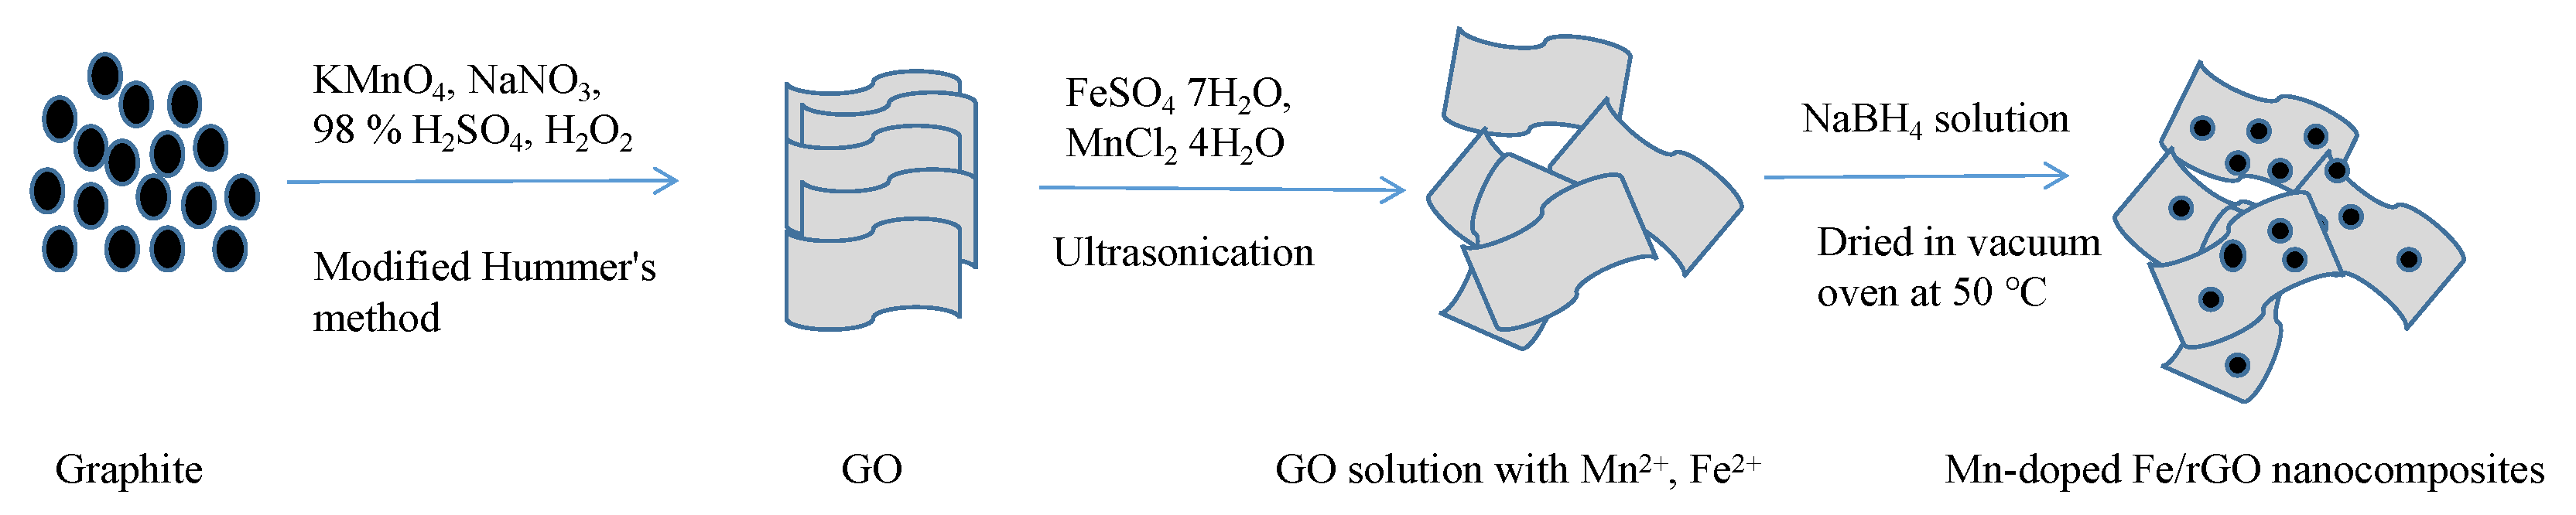
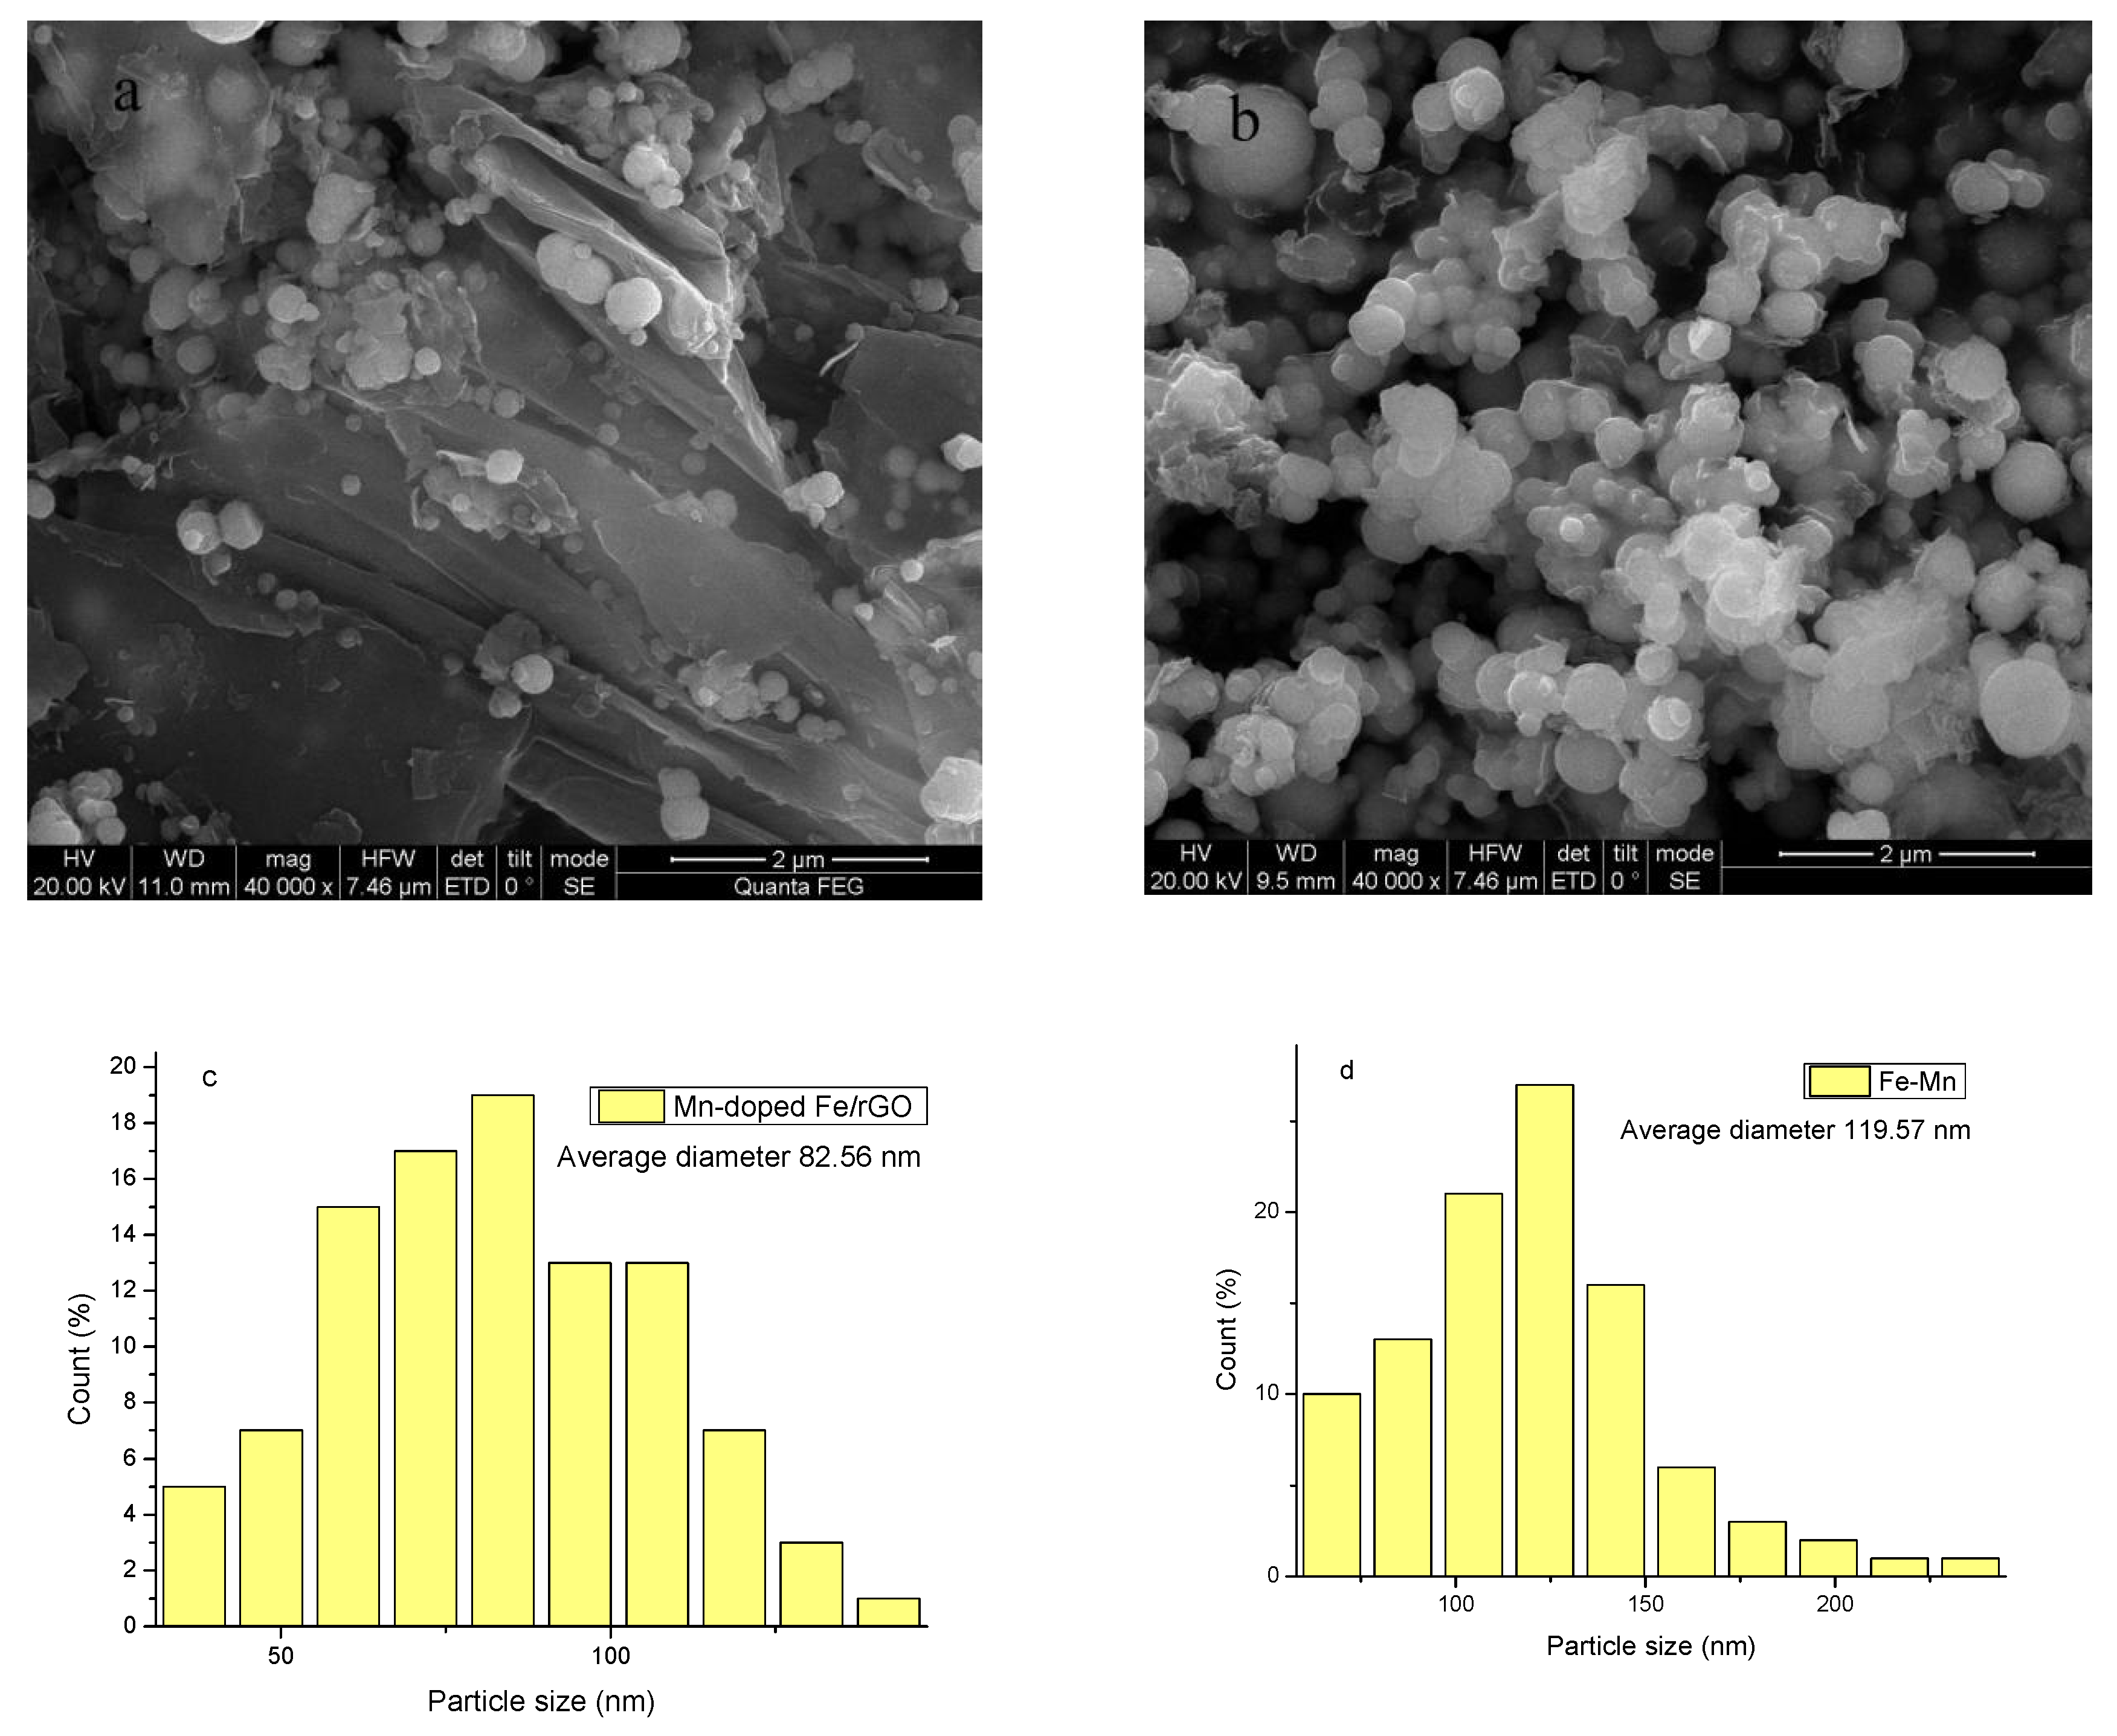
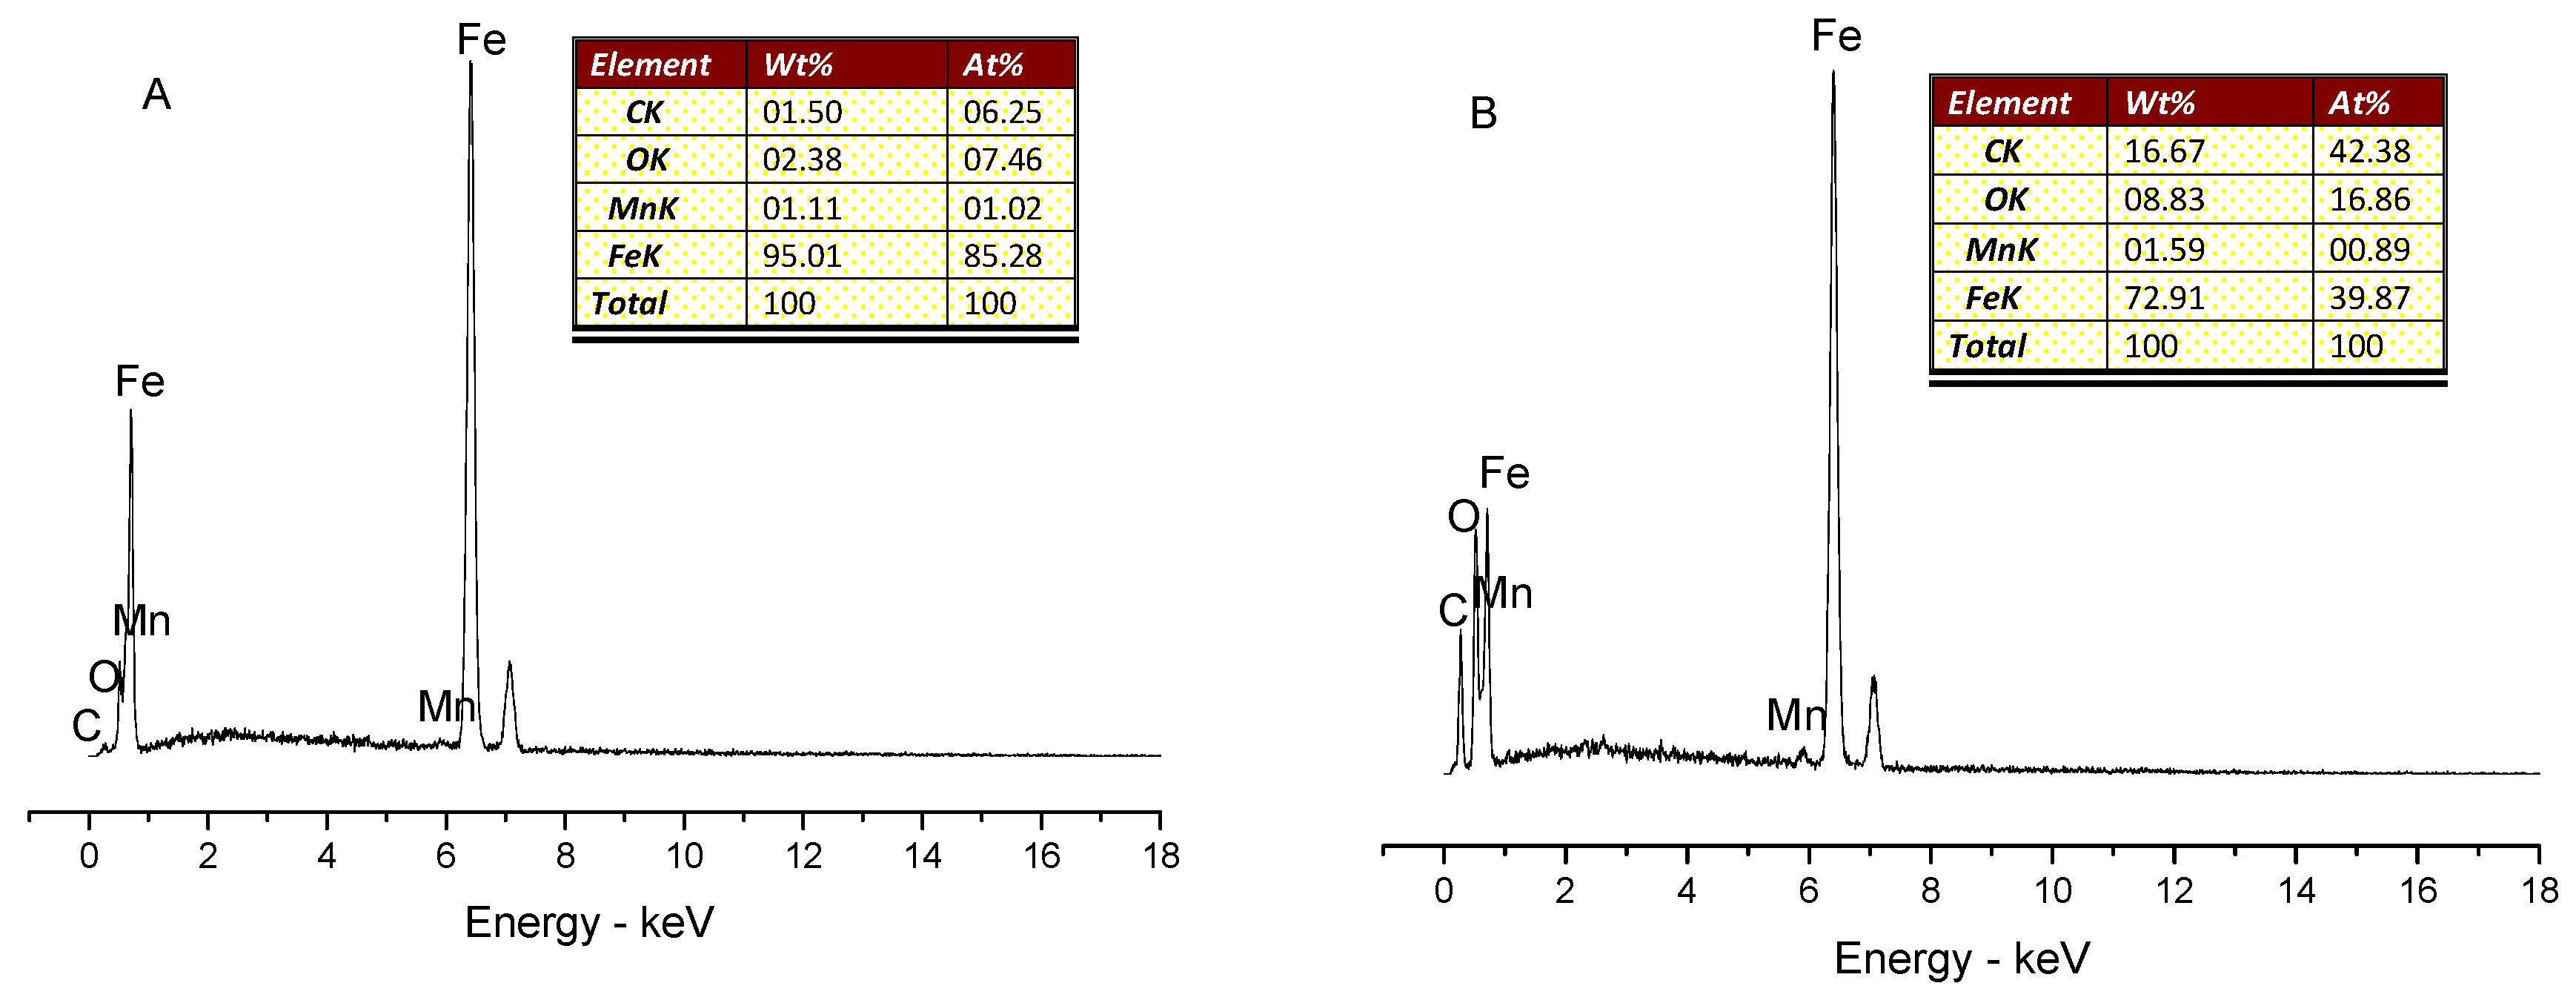
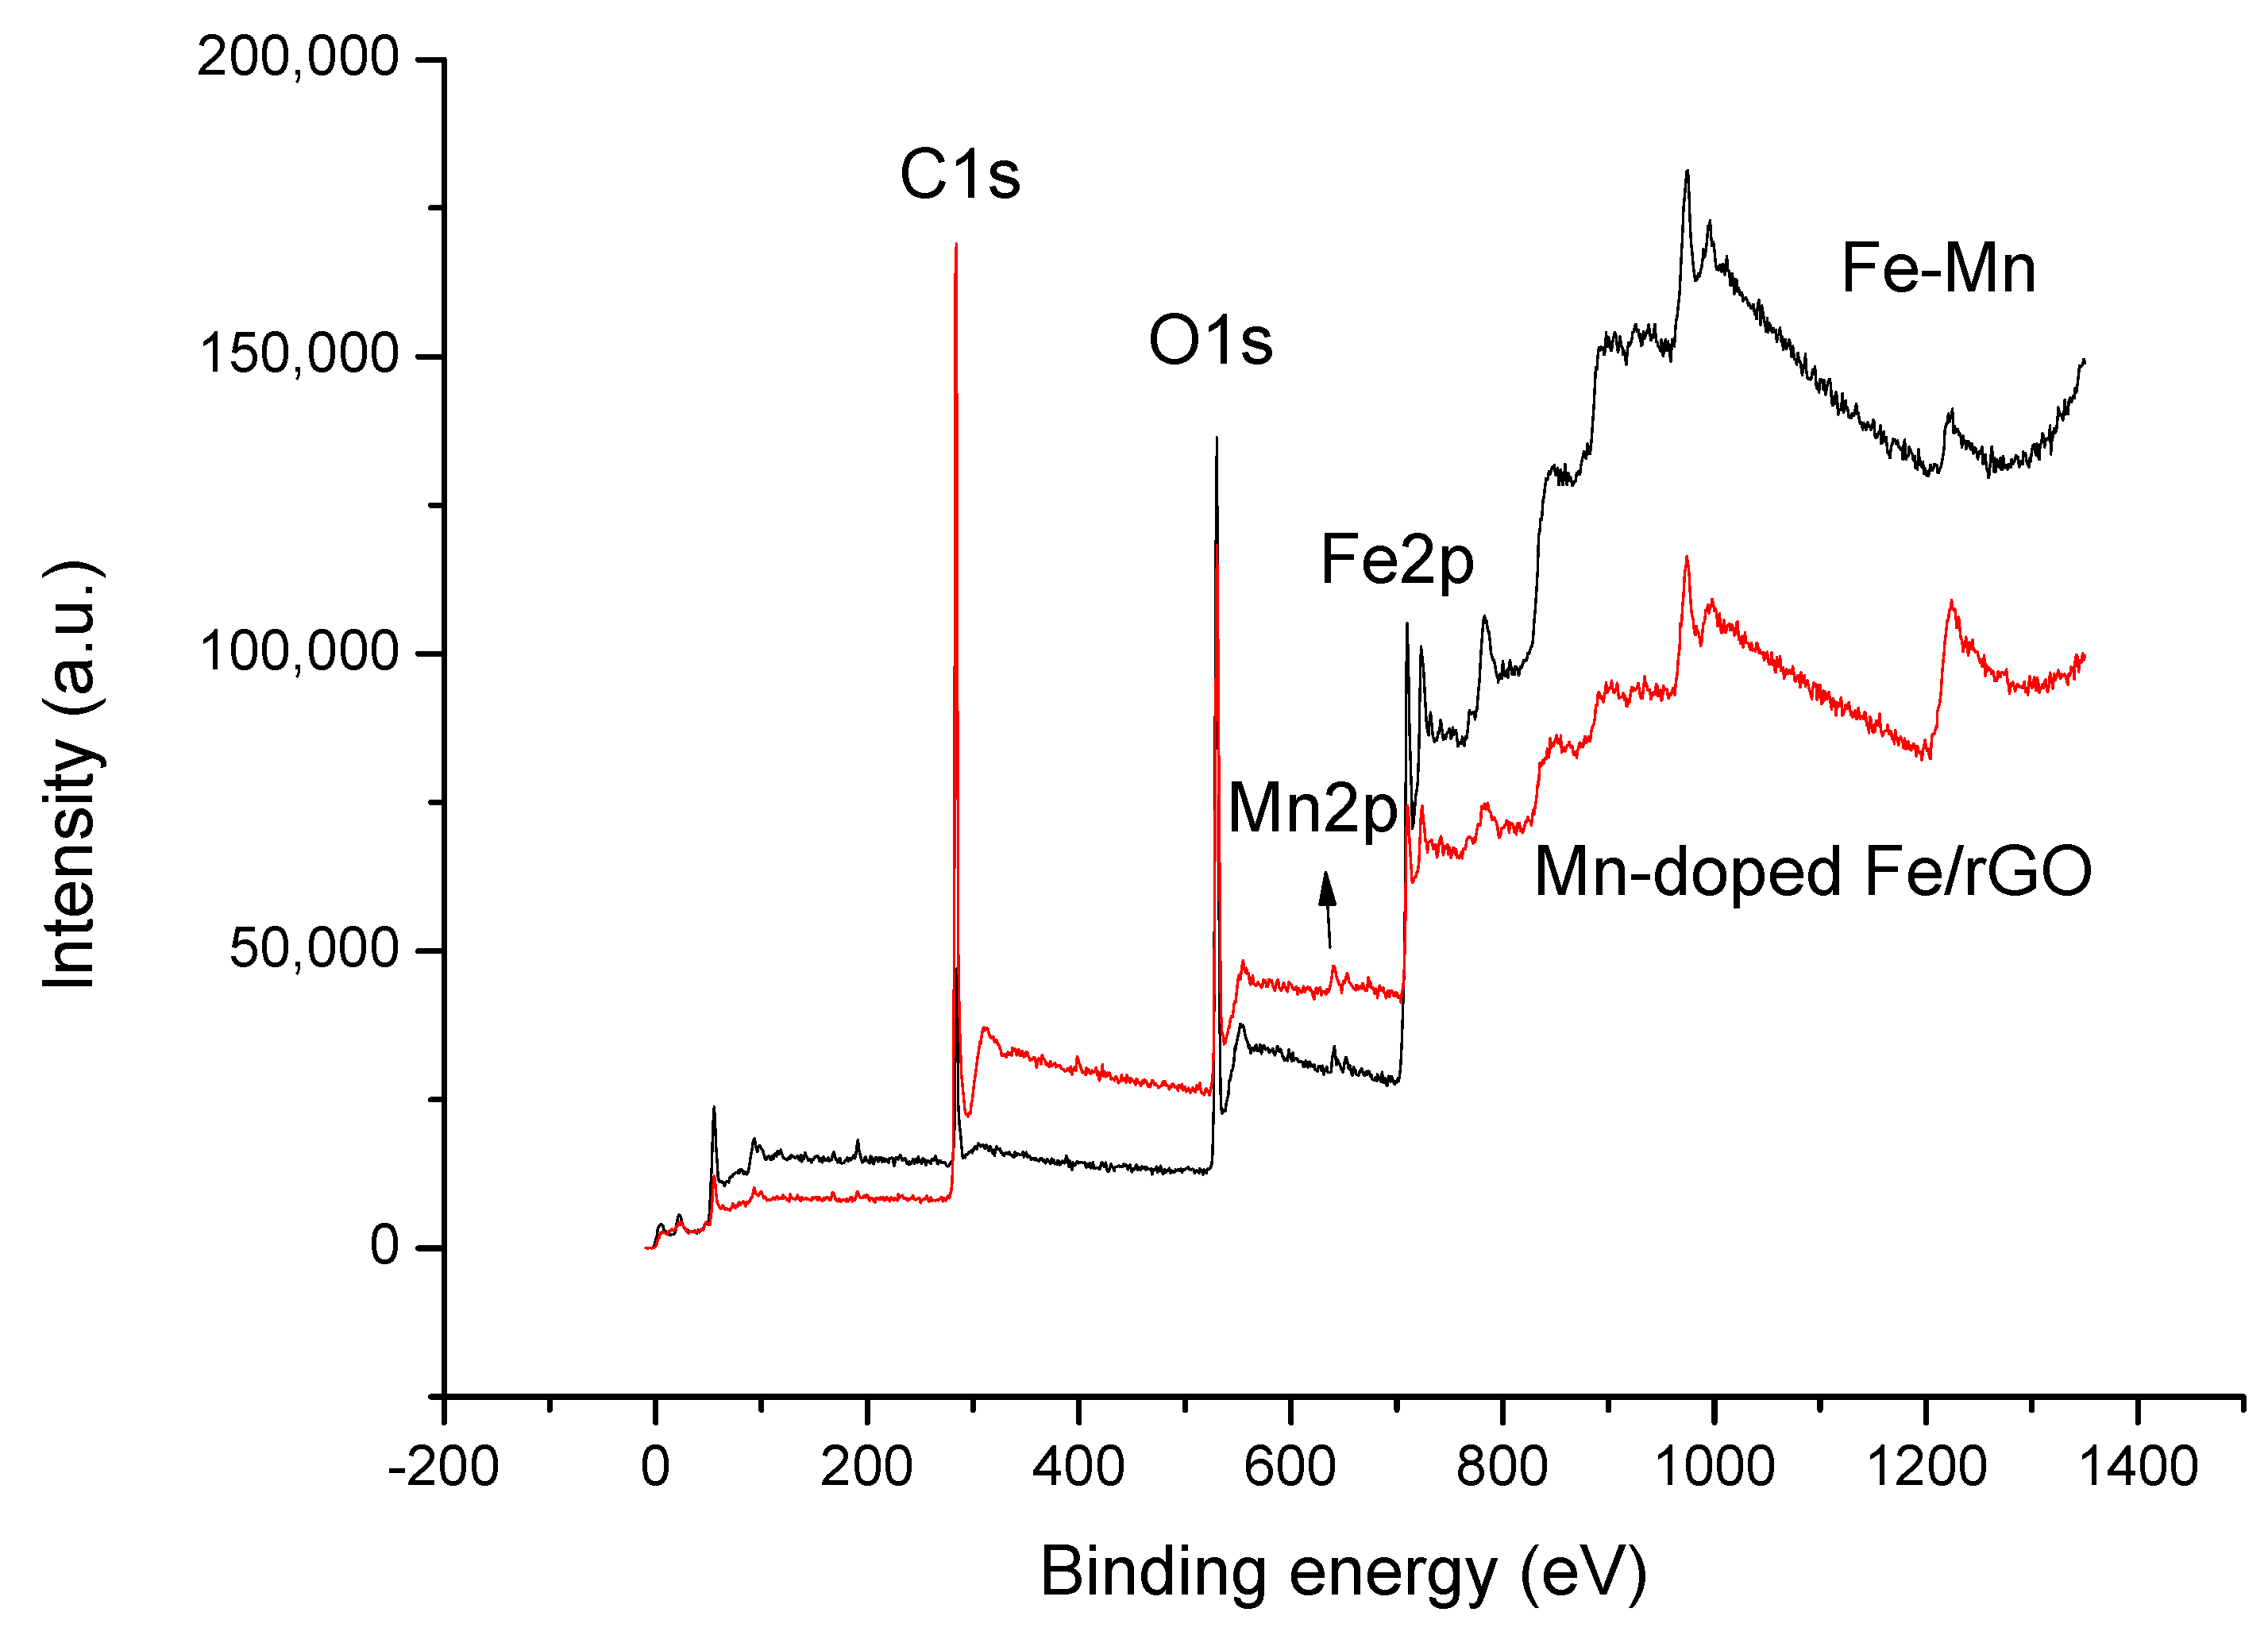
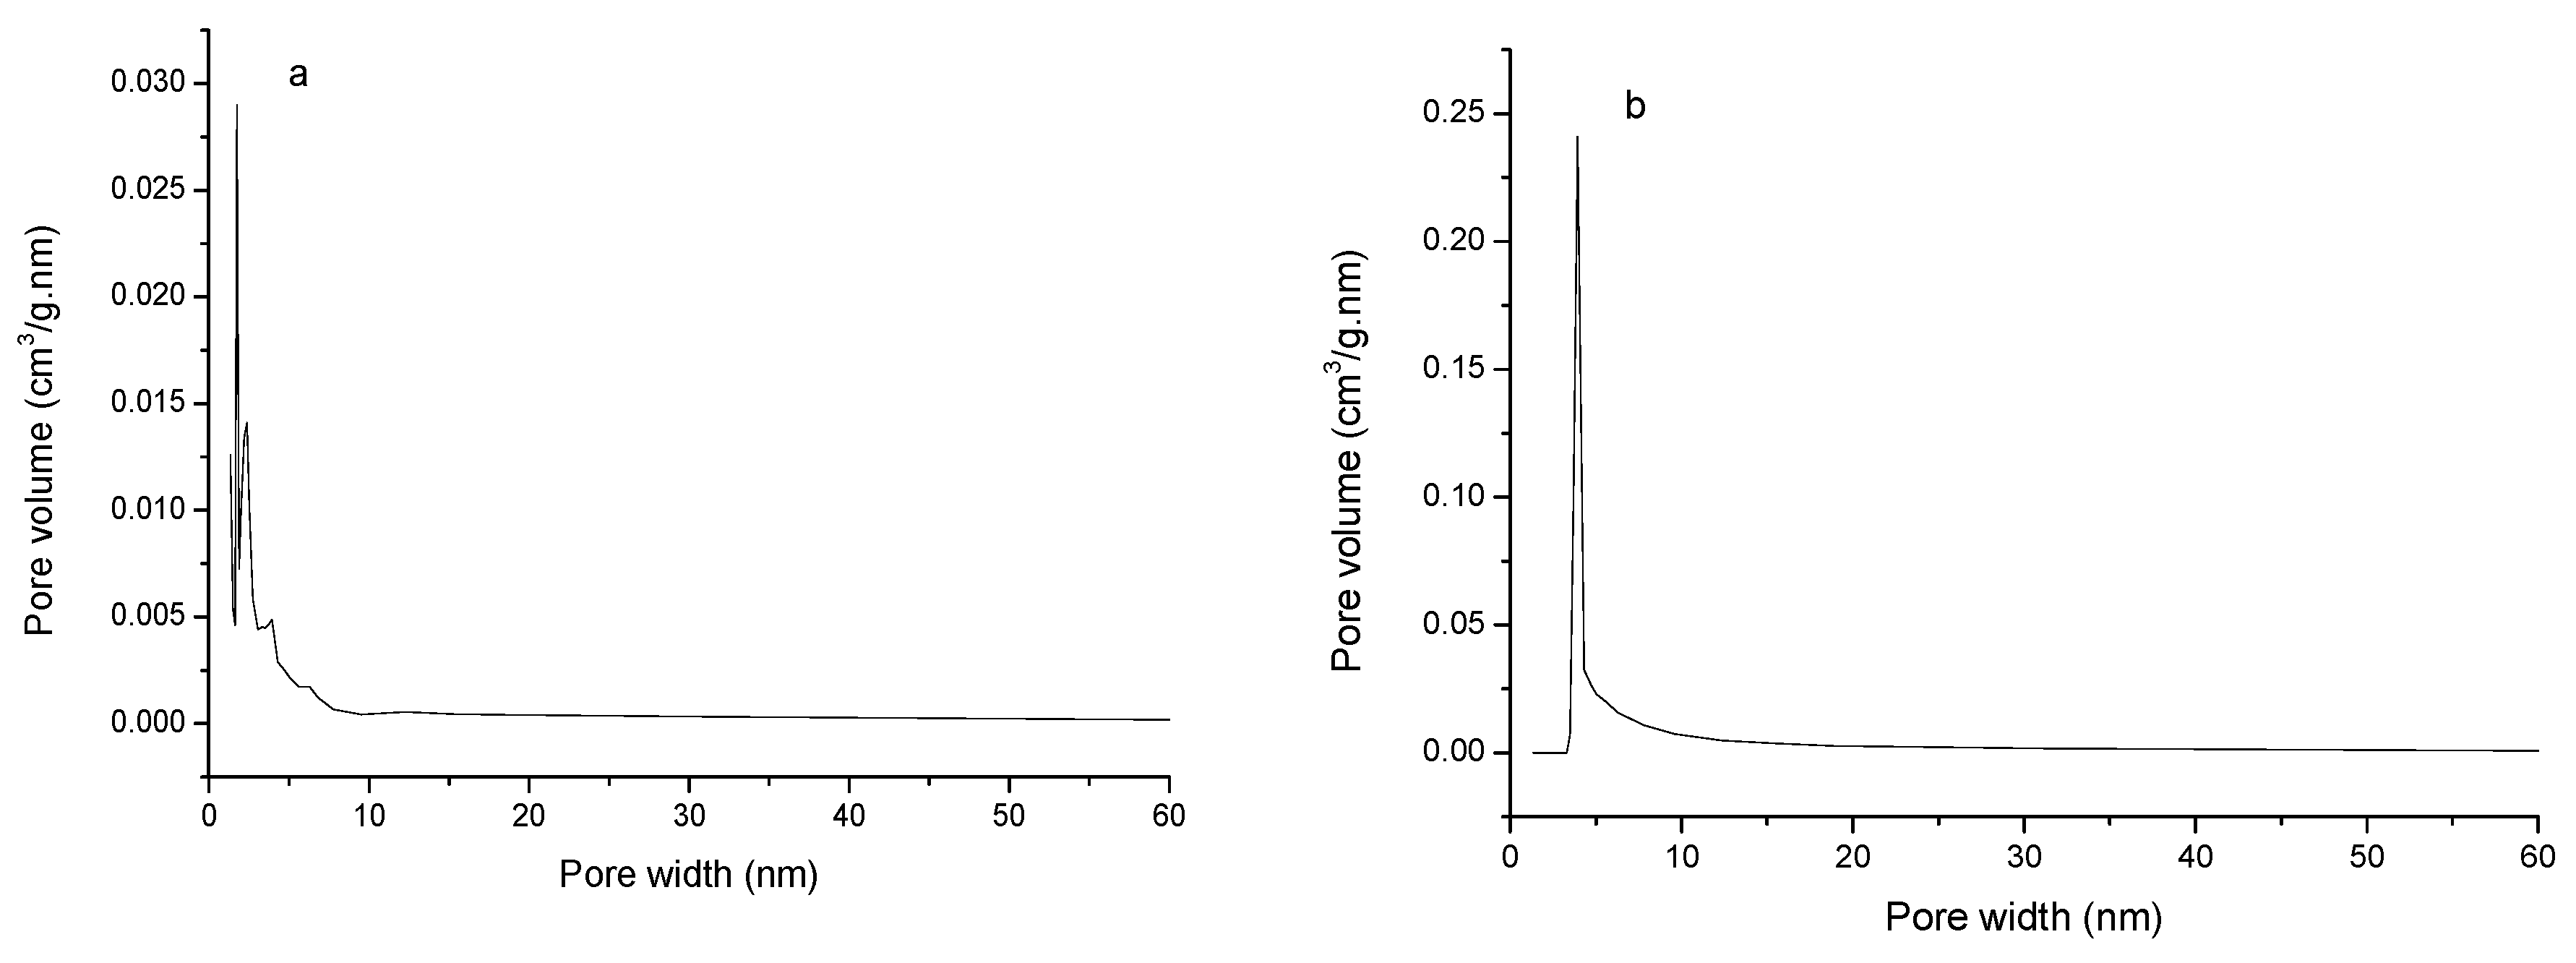
3.1. Surface Characterization of Fe–Mn Nanoparticles and Mn-doped Fe/rGO Nanocomposites

X-ray diffraction (XRD) patterns of GO, Fe–Mn and Mn-doped Fe/rGO are illustrated in Figure 4. GO had a characteristic peak at 11° (002), while the peak disappeared for Mn-doped Fe/rGO, indicating that GO was completely reduced to rGO in the synthesis process. In the Fe–Mn and Mn-doped Fe/rGO composites, no obvious diffraction peaks of Fe and Mn were observed by XRD, suggesting that Fe and Mn in the composites existed in an amorphous form [70].
The surface morphology of Fe–Mn nanoparticles and Mn-doped Fe/rGO nanocomposites are discussed based on SEM images (Figure 5a,b). Figure 5a shows that Fe–Mn spherical particles were dispersed on the surface of graphene. The average particle size of Mn-doped Fe/rGO (Figure 5c) and Fe–Mn (Figure 5d) were 82.56 and 119.57 nm, respectively. The EDS measurement confirmed the composition of Fe–Mn and Mn-doped Fe/rGO (Figure 6). The elemental compositions of C, O, Mn and Fe in Fe–Mn were 1.50, 2.38, 1.11 and 95.01 wt%, respectively. The elemental composition of C, O, Mn and Fe in Mn-doped Fe/rGO were 16.67, 8.83, 1.59 and 72.91 wt%, respectively. EDS is a qualitative and semi-quantitative analysis tool [71], which measures a certain point on the surface of the sample, and thus its result cannot be used for the whole sample. The ratio of Mn to Fe measured by EDS was only 1:50 in Mn-doped Fe/rGO, much lower than the theoretical value of Mn-doped Fe/rGO (Mn:Fe = 1:2). The possible reason is that Mn and Fe were not evenly distributed on the rGO and nanoscale Fe agglomerated on the surface of rGO [72].
Figure 7 displays the Raman spectra of GO and Mn-doped Fe/rGO nanocomposites. The characteristic D and G peaks appeared at 1354 and 1570 cm−1, respectively. The D peak is related to the defects and disorder in the lattice structure of graphite materials, while the G peak is related to the vibration of sp2-bonded carbon and is a doubly degenerate (iTO and LO) phonon mode (E2g symmetry) at the BZ center [73,74,75,76]. The intensity ratio (ID/IG) of Mn-doped Fe/rGO (ID/IG = 1.5) was higher than that of GO (ID/IG = 1.2), which indicated the creation of smaller sp2-bonded carbon domains after the reduction process and the increase of disorder in the graphene sheets [77,78]. The surface survey spectra of Fe–Mn and Mn-doped Fe/rGO were measured by XPS, and the spectra of C1s, O1s, Fe2p and Mn2p are presented in Figure 8. The bonding energies at 284 eV, 531 eV, 641 eV and 711 eV correspond to the C1s, O1s, Mn2p and Fe2p, respectively. The contents of C, O, Mn and Fe in Mn-doped Fe/rGO were 76.19, 19.68, 0.826 and 3.305 at%, respectively. The atomic ratio of Fe and Mn measured by XPS was about Mn:Fe ≈ 1:3, significantly lower than the theoretical value of the nanomaterials (Mn:Fe = 1:2). The possible reason is that most of the Fe and Mn were loaded in the pores of nanomaterials, and only a small amount of iron and manganese were exposed on the outer surface of the nanomaterials [79]. Since XPS can only measure elements in the depth range of about 5 nm on the surface, most of the iron and manganese in the pores of adsorbent were not detected. Figure 9c,d shows the Mn2p peak of the Fe–Mn and the Mn-doped Fe/rGO. The characteristic peaks (Figure 9a,b) of Fe0, Fe2p3/2 and Fe2p1/2 at 707, 711.6 and 725.6 eV, respectively, were observed in the Fe2p XPS spectra. The Fe2p spectra exhibited four peaks at 710.6 eV, 711.9, 723.8 eV and 725.4 eV, which confirmed the Fe3+ and Fe2+ states in the nanocomposites and revealed the core–shell structure of nZVI.
The nitrogen adsorption–desorption isotherms of Fe–Mn nanoparticles and Mn-doped Fe/rGO nanocomposites are shown in Figure 10. The specific surface areas (SBET) were 19.166 m2/g (Fe–Mn) and 104.088 m2/g (Mn-doped Fe/rGO), respectively, which were due to the high specific surface area of reduced graphene sheets. The Fe–Mn and Mn-doped Fe/rGO composites of pore size distribution are shown in Figure 11, and narrow pore size distributions were centered at 1.76 nm and 3.93 nm, respectively. Mn-doped Fe/rGO exhibited type IV isotherms with H3 hysteresis loops, revealing that the nanocomposites were mesoporous (2 nm < pore size < 50 nm) materials [80]. Nanocomposites with large specific surface area can provide more adsorption and reaction sites, improving the dye removal ability from wastewater.
Figure 12A represents the magnetization curves of the Mn-doped Fe/rGO nanocomposites, which are typical soft magnetic materials. The soft magnetic properties of nanocomposites are associated with the very small area encircled by a closed curve [81]. Magnetization increased linearly with rising magnetic field and then reached saturation; the value of saturation magnetization (Ms) was 47.0514 emu/g for Mn-doped Fe/rGO. The magnetic properties of nanocomposites allow them to be easily and rapidly segregated from dye wastewater. Small angle X-ray diffraction (SAXRD) and high-resolution transmission electron microscopy (HR-TEM) of Mn-doped Fe/rGO nanocomposites are given in Figure 12B,E, respectively. Mn-doped Fe/rGO showed a well-resolved diffraction peak at 0.71° of 2θ angles, a large and repetitive lattice commonly conducive to the presence of diffractions at small angles, indicating that the nanocomposites may have been composed of an ordered structure [82]. From the HR-TEM image of Figure 12C–E, it can be observed that the regularly ordered structure appeared in Figure 12A, while the disordered structure emerged in Figure 12B. Therefore, the Mn-doped Fe/rGO nanocomposites were determined to be partially ordered mesoporous materials.

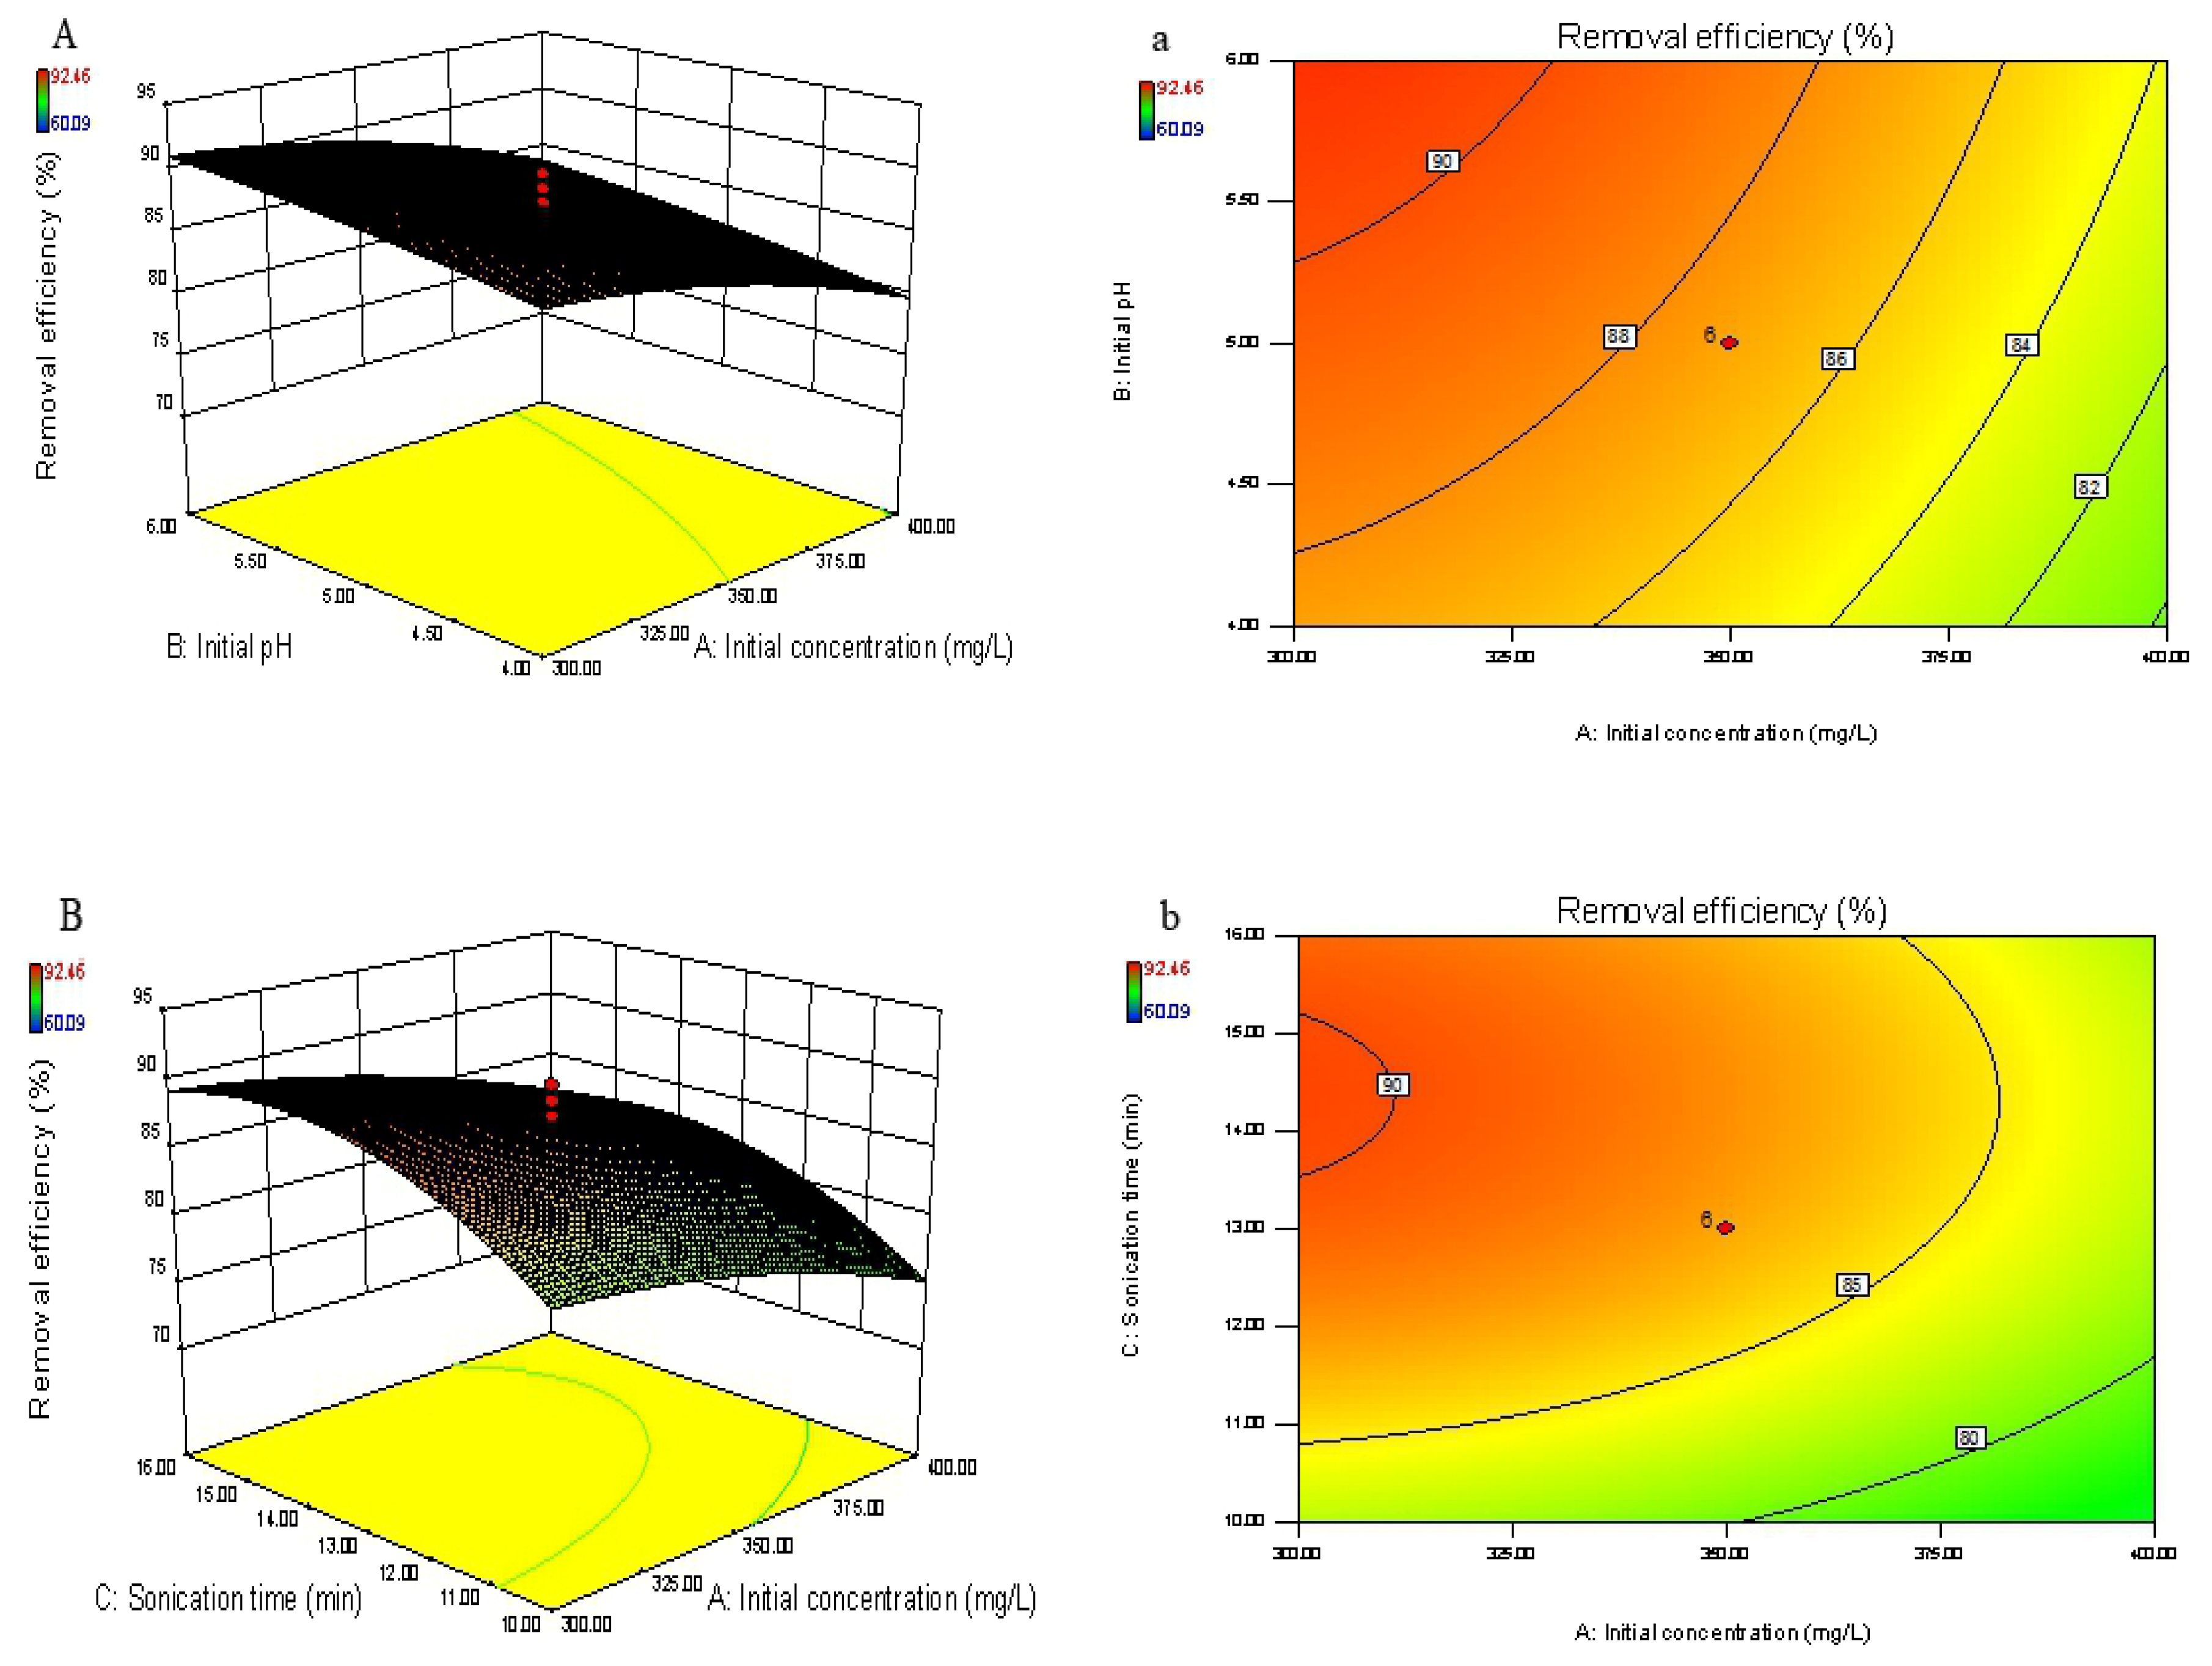
3.2. Central Composite Design (CCD)

Four variables were studied at initial concentration (250–450 mg/L), initial pH (3–7), sonication time (7–19 min) and dosage (10–22 mg). Removal efficiency was measured as response, and the maximum and minimum were 92.46% and 60.09%, respectively. In the CCD and ANOVA programs used, 30 sets of data were used to predict the four independent variables (X1 = A, X2 = B, X3 = C, X4 = D), and the experimental data were analyzed by quadratic multiple regression analysis. Table 2 compares the predicted values with the experimental results, and the relationship between removal efficiency and variables factors are given as follows:
Y = 87.20 − 3.68 A + 1.92 B + 3.32 C + 5.07 D + 0.12 AB − 0.097 AC + 0.21 AD + 0.084 BC + 0.73 BD − 0.27 CD − 1.37 A2 − 0.34 B2 − 3.75 C2 − 3.14 D2
The sufficiency of the model was tested by ANOVA, and the fitting of the second-order polynomial equation with the experimental data was tested (Table 3). The value of “Prob. > F” was used to test the null hypothesis (p < 0.05), which implied that the model was significant. The regression model established for removal of EV by Mn-doped Fe/rGO based on A, B, C and D was significant (p < 0.05) and the lack of fit values was not significant (F = 4.4, p = 0.0578) showing that the regression model was valid for the removal of EV. The values of “Prob. > F” for linear effect of A, B, C, D and quadratic effect of A2, D2, C2 were less than 0.05; thus, these terms were significant. The results in Table 3 display a high R2 (0.9379) for EV, thus demonstrating dependability in the evaluation of EV removal efficiency by Mn-doped Fe/rGO.
Figure 13 illustrates the correlation between the experimental and predicted values. The distribution of data points was relatively close and had a linear behavior, which indicated that there was sufficient consistency between predicted and experimental values. Figure 14 displays the normal probability plot of the residual. The maximum number of points fell on a straight line, which indicates that the residual obeyed a normal distribution and the prediction of the RSM model was accurate. The effects of four factors on the EV removal efficiency were compared by using the perturbation plot (Figure 15). The results show that the elimination of EV was more sensitive to adsorbent dosage and initial concentration than sonication time and initial pH. The interaction between the two dependent and the four independent variables can be represented by the three-dimensional response surface and contour diagrams (Figure 16). It can be seen from Figure 16A,a that the maximum decolorization of EV was in the pH range of 4 to 6. Within the scale of experiment, the removal efficiency of dye increased with the increasing amount of adsorbent and decreased with increasing initial ethyl violet concentration (Figure 16C,c).

3.3. Back Propagation Artificial Neural Network (BP-ANN)

Under the ANN modeling method, it is an important step to determine the optimal number of hidden layer neurons. The optimal number of neurons was determined by MSE, and the minimum MSE value was 0.0005, as presented in Figure 17. Additionally, Figure 18 shows that the BP-ANN training was stopped when the epoch reached 1453, the gradient reached 5.5214 × 10⁻⁶, the best training performance was 0.0030709 and the correlation coefficient (R2) was 0.99403 (Figure 19). The high R2 value and low MSE value indicated goodness of the ANN model performance.

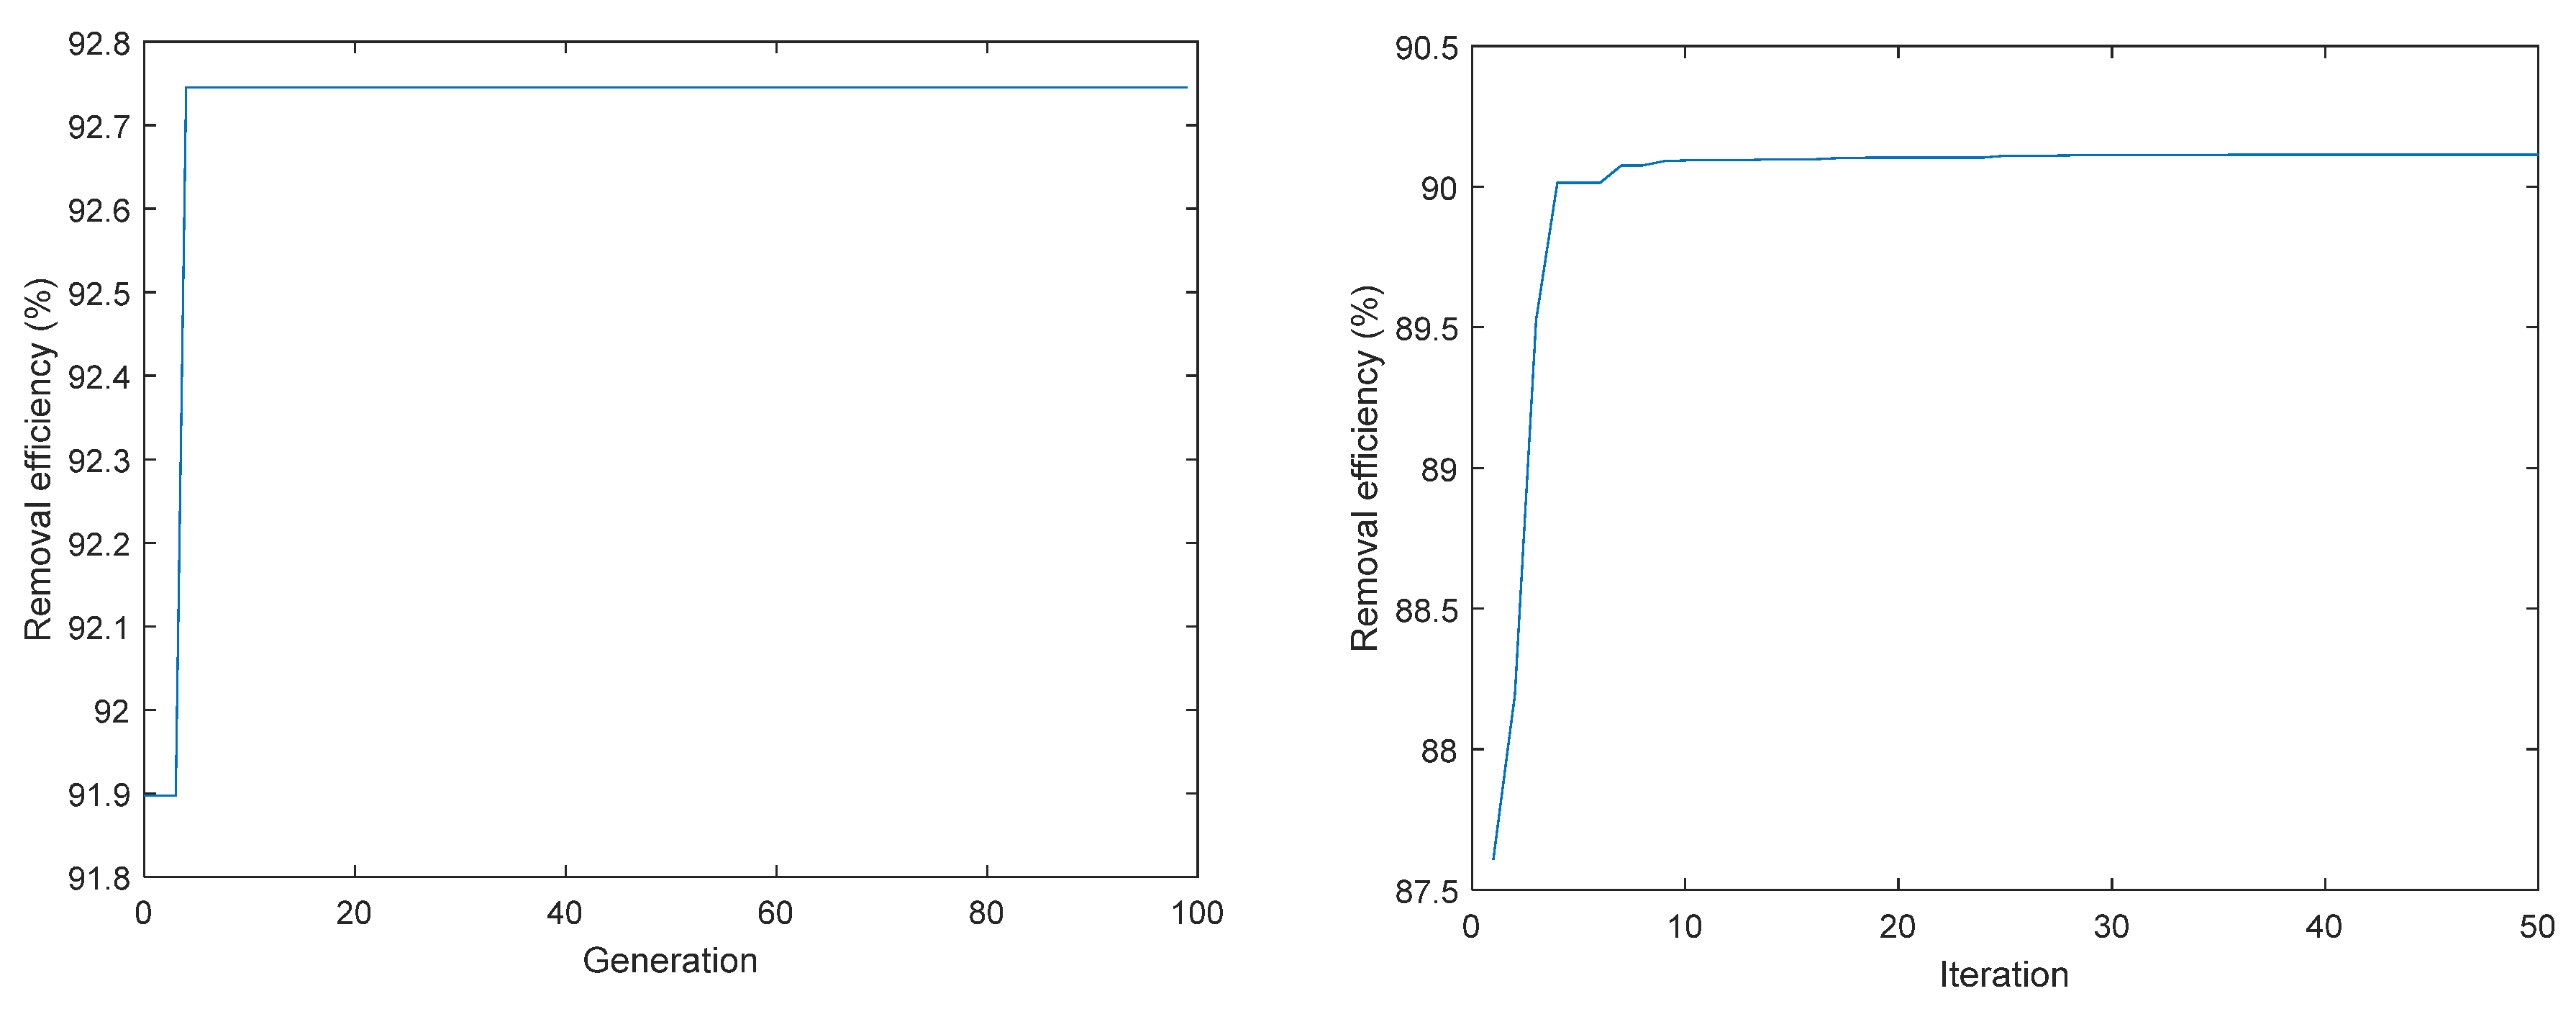
3.4. Optimization for the Removal of EV by RSM, ANN-GA and ANN-PSO

Both ANN-GA and ANN-PSO can obtain global optimal solutions through iterative optimization processes. Figure 20 shows for ANN-GA and ANN-PSO gradual convergence; when the iteration values were 5 and 8 the maximum predicted values were 92.75% and 90.11%, respectively. The optimization conditions for the four parameters were found to be dosage (GA 17.55 mg and PSO 17.20 mg), sonication time (GA 13.19 min and PSO 13.95 min), initial pH (GA 6.1 and PSO 5) and initial concentration (GA 299.22 mg/L and PSO 371.23 mg/L). The developed models from ANN-GA, ANN-PSO and RSM were compared and validated using the predicted optimal conditions (Table 4). The results show that the average values of absolute errors of ANN-GA, ANN-PSO and RSM models were 0.72%, 1.28% and 1.53%, respectively. Compared with the RSM model, ANN-based models had a high R2 value. In a word, the ANN-GA model was considered to be the best one for predicting the removal of EV by Mn-doped Fe/rGO.

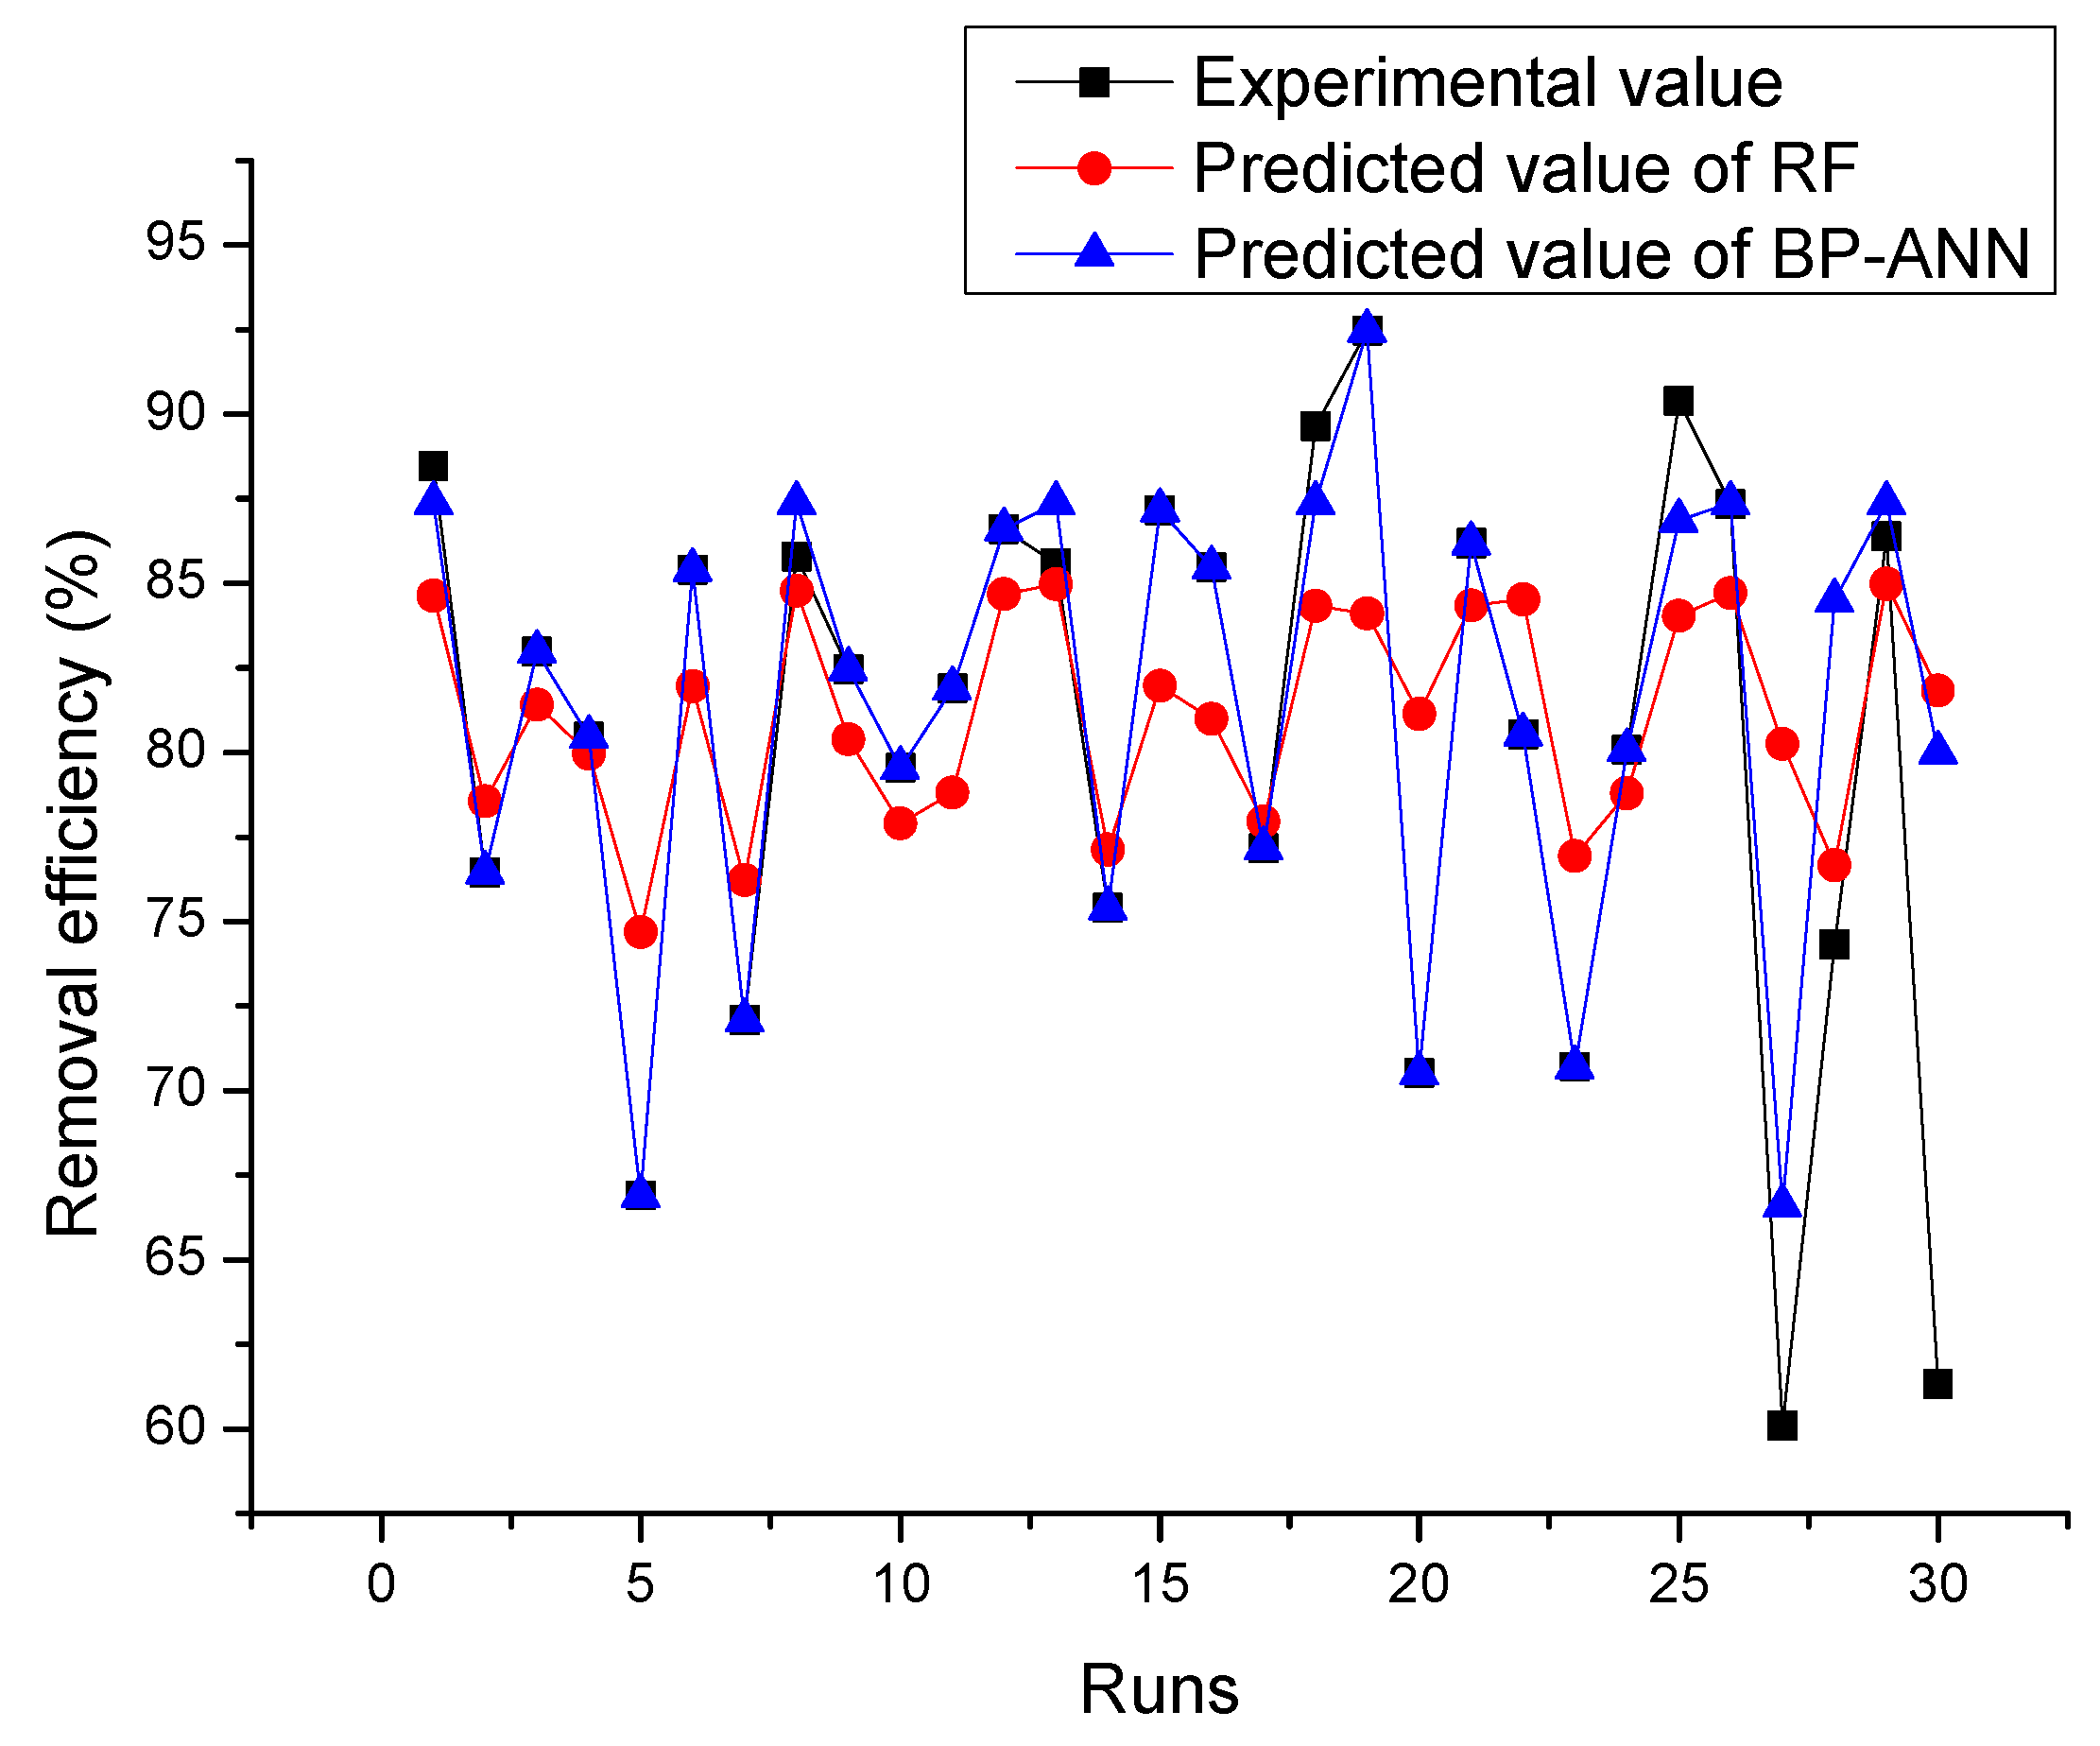
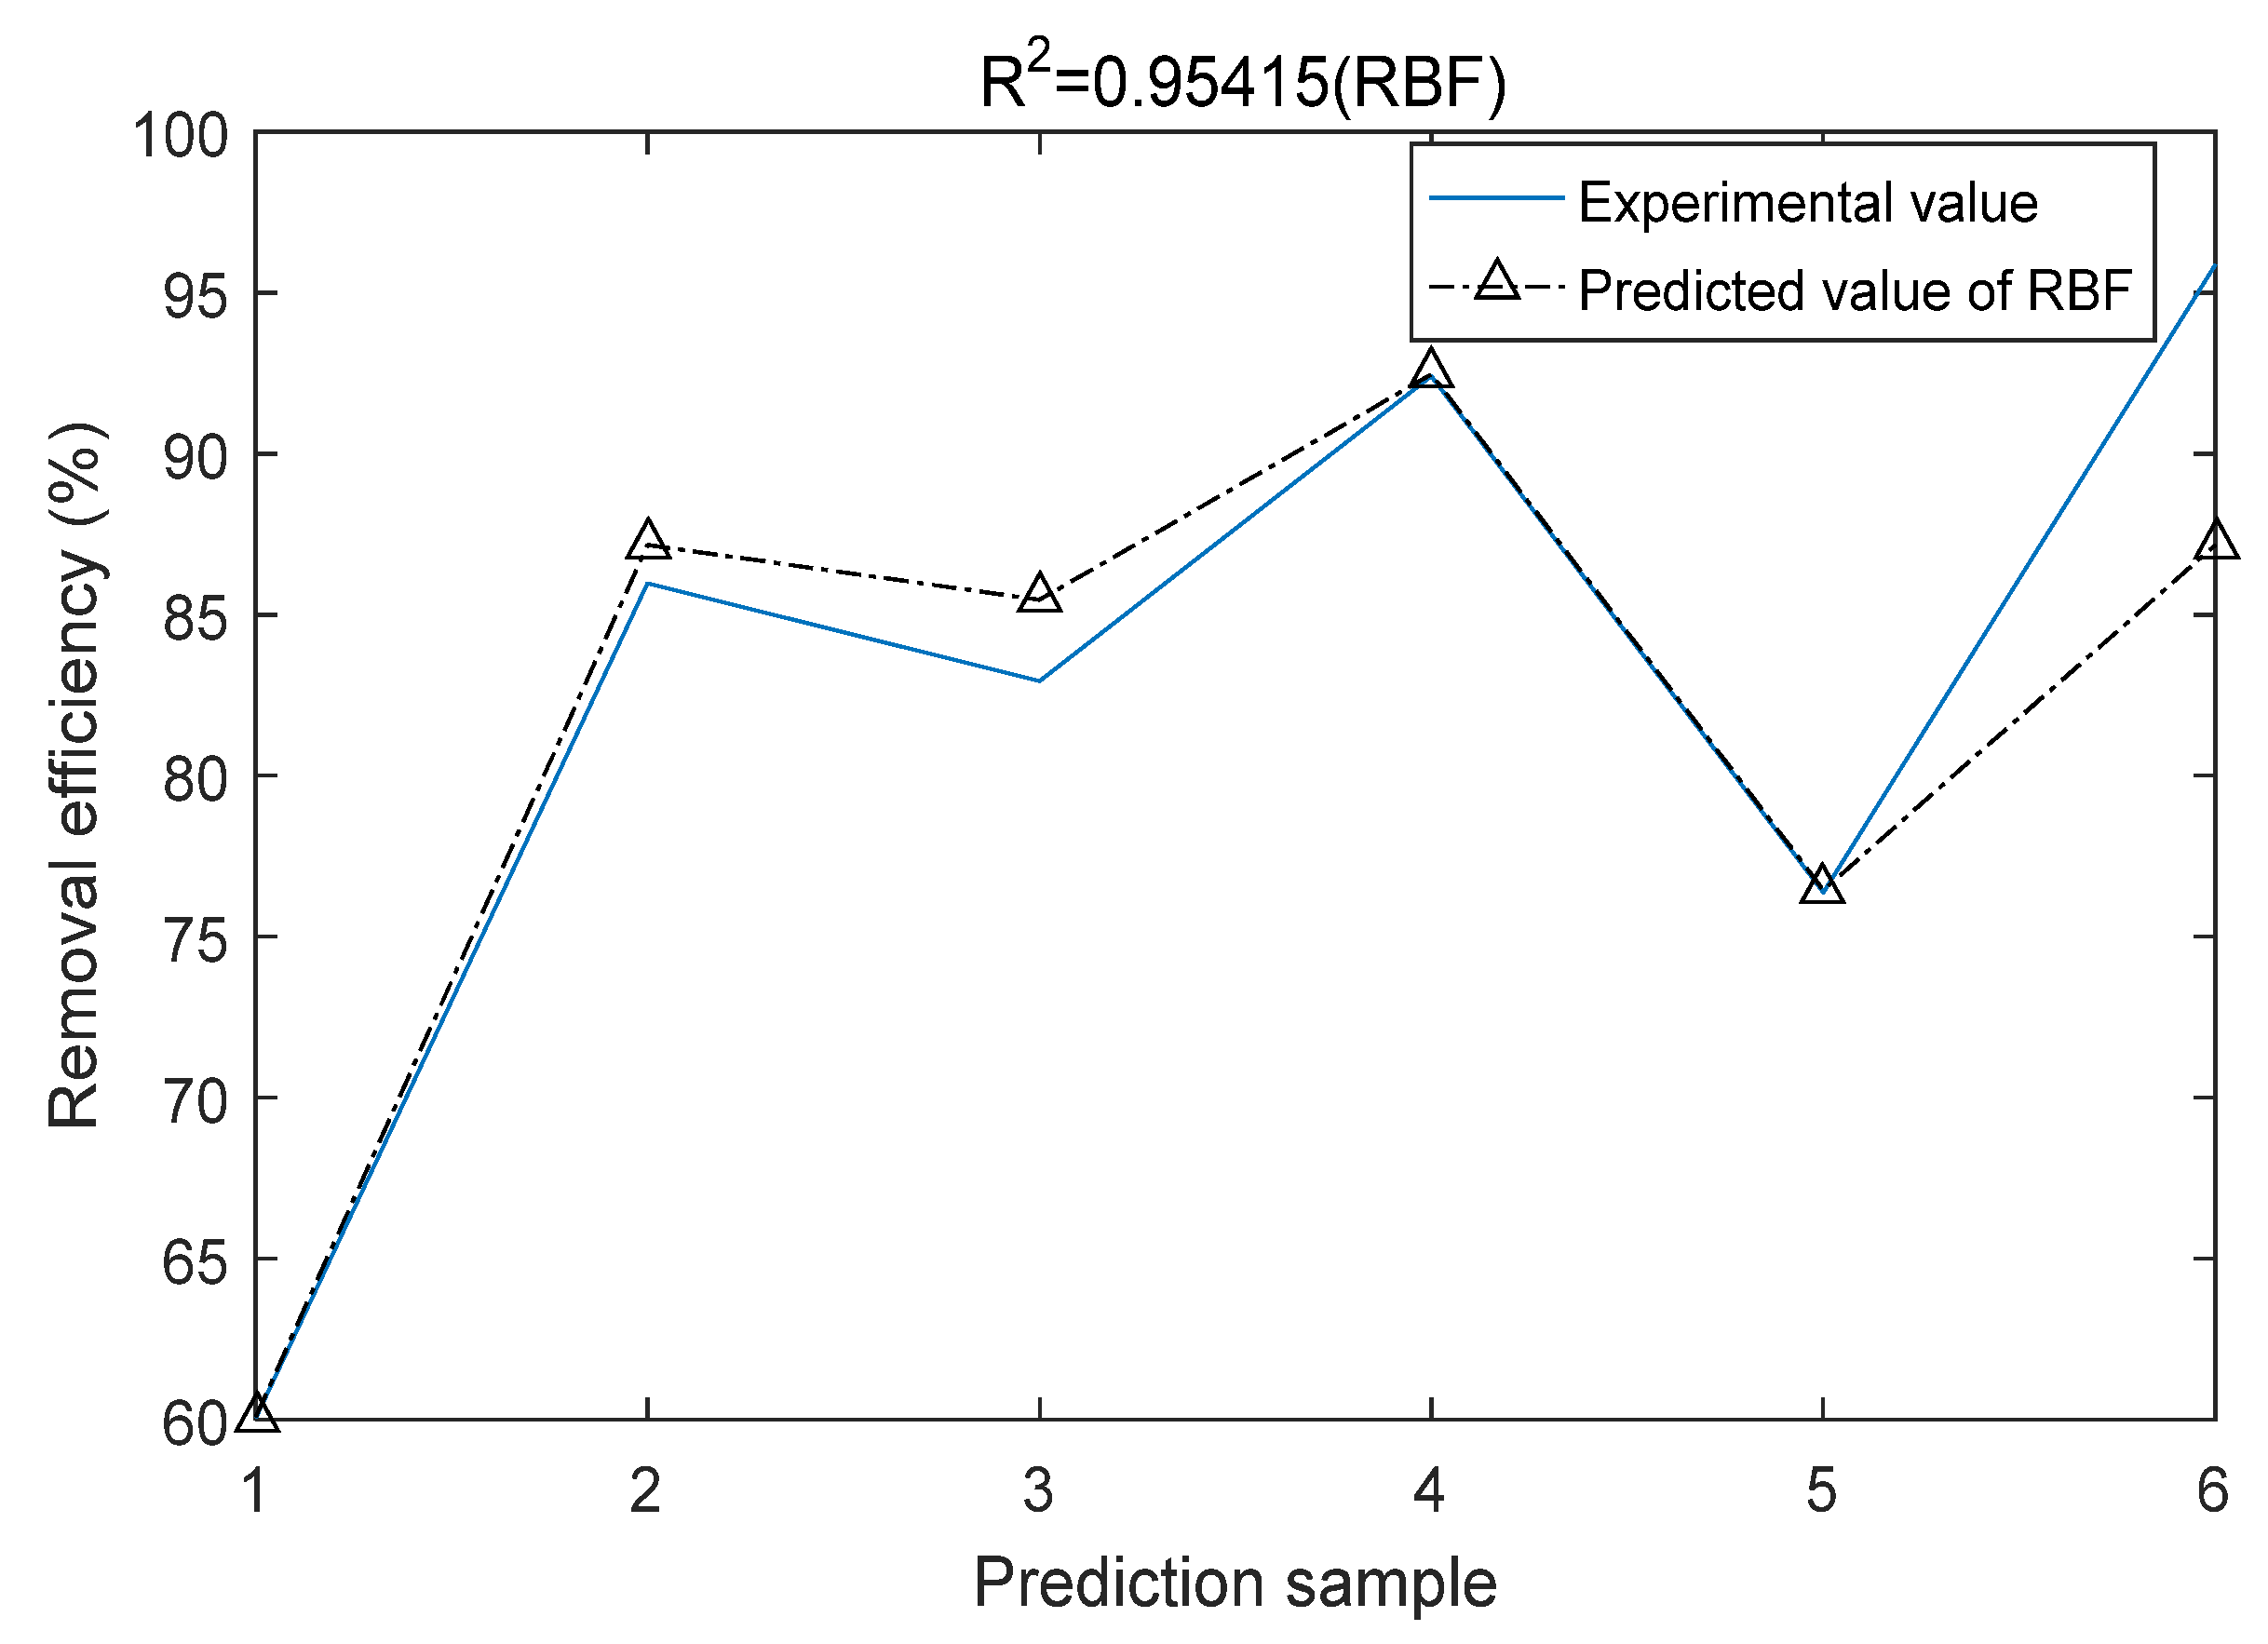
3.5. Comparison of RF, RBF and BP-ANN

Combined with RSM data, 30 sets of experimental values were predicted by RF and BP-ANN (Figure 21). The mean absolute errors of BP-ANN and RF were 1.55% and 4.56%, respectively. In this study, BP-ANN was more suitable than RF to optimize the parameters for the removal of EV by Mn-doped Fe/rGO nanocomposites. Figure 22 demonstrates that the network had a high R2 (0.95415) value, and the R2 value of BP-ANN was 0.99403. According to the results, the RBF-NN and BP-ANN models can be used to predict the elimination of EV from the aqueous phase by Mn-doped Fe/rGO.

3.6. Comparison among Analysis of Variance, GBRT, Garson Method and RF

Relative variable importance analysis is one of the advantages of GBRT and RF models (Figure 23 and Figure 24). The Garson method for calculating the influence of each input variable on the output variable using weight and bias is shown in Table 5. The high importance score of variables indicates that the contribution of variables is significant to dye removal prediction [83]. Table 6 gives the factor importance obtained from F value, Garson method, GBRT and RF, which shows that the dosage had the maximum importance to the EV removal by Mn-doped Fe/rGO.

3.7. Adsorption Isotherms

The adsorption isotherm for adsorption EV onto Mn doped Fe/rGO was studied under the conditions of different dye concentrations (300–1000 mg/L), sonication time of 23 min and pH of 5. The data were fitted to the Langmuir, Freundlich and Temkin equations to find a model suitable for explaining the adsorption mechanism [84]. The Langmuir isotherm model is given by linear Equation (11) and nonlinear Equation (12) [85,86,87,88] as follows:
C e q e = 1 k L q m + C e q m
q e = q m k L c e 1 + k L c e
where Ce (mg/g) is the equilibrium EV concentration in solution (mg/L); qe is the amount of EV adsorbed at equilibrium (mg/g); qm is the maximum adsorption capacity of dye per gram of adsorbent (mg/g); and KL is a constant related to adsorption rate (L/mg). The Langmuir equation was further analyzed and the dimensionless equilibrium parameter (RL) was calculated, which is given by Equation (13) [89] as follows:
R L = 1 1 + K L C 0
where C0 (mg/L) is the initial EV concentration; the RL value indicates the adsorption properties of the dye with the sorbent. If the RL value is equal to 0 or 1, the adsorption is irreversible and linear, respectively; if the value is >1, the adsorption process is unfavorable; and if the value lies between 0 and 1, this indicates the adsorption process is favorable [89].
The Freundlich equilibrium isotherm equation is an empirical relationship describing the multi-layer and heterogenous adsorption of adsorbed intermolecular interactions [84]. The linear and nonlinear forms of the Freundlich Equation (14) and Equation (15) are expressed as follows [90,91]:
I n q e = I n k F + 1 n I n C e
q e = k F ( c e ) 1 / n
where kF = Freundlich isotherm constant (mg/g) and 1/n = adsorption intensity. The linear Temkin equation is expressed as follows [86]:
q e = B T ln K T + B T ln C e
where KT and BT are the Temkin constants.
The adsorption isotherm of EV is illustrated in Figure 25, and Table 7 lists the values of Langmuir, Freundlich and Temkin constants and the correlation coefficient (R2) values. The Langmuir RL values were 0.01585–0.05093, indicating that the adsorption of EV by Mn-doped Fe/rGO was favorable, and the value of maximum adsorption capacity was 1000.00 mg/g. The constant of 1/n in the Freundlich model is related with the adsorption intensity, which varies with the heterogeneity of materials [92]. The value of 1/n was 0.0442 (<0.5), which indicates that the adsorption was favorable. The experimental data were fitted with linear and nonlinear models with the Freundlich and Langmuir models. The R2 given in Table 7 shows that the linear model was better than nonlinear fitting, and compared with the other two models the Langmuir model could better describe the adsorption of EV onto Mn-doped Fe/rGO.

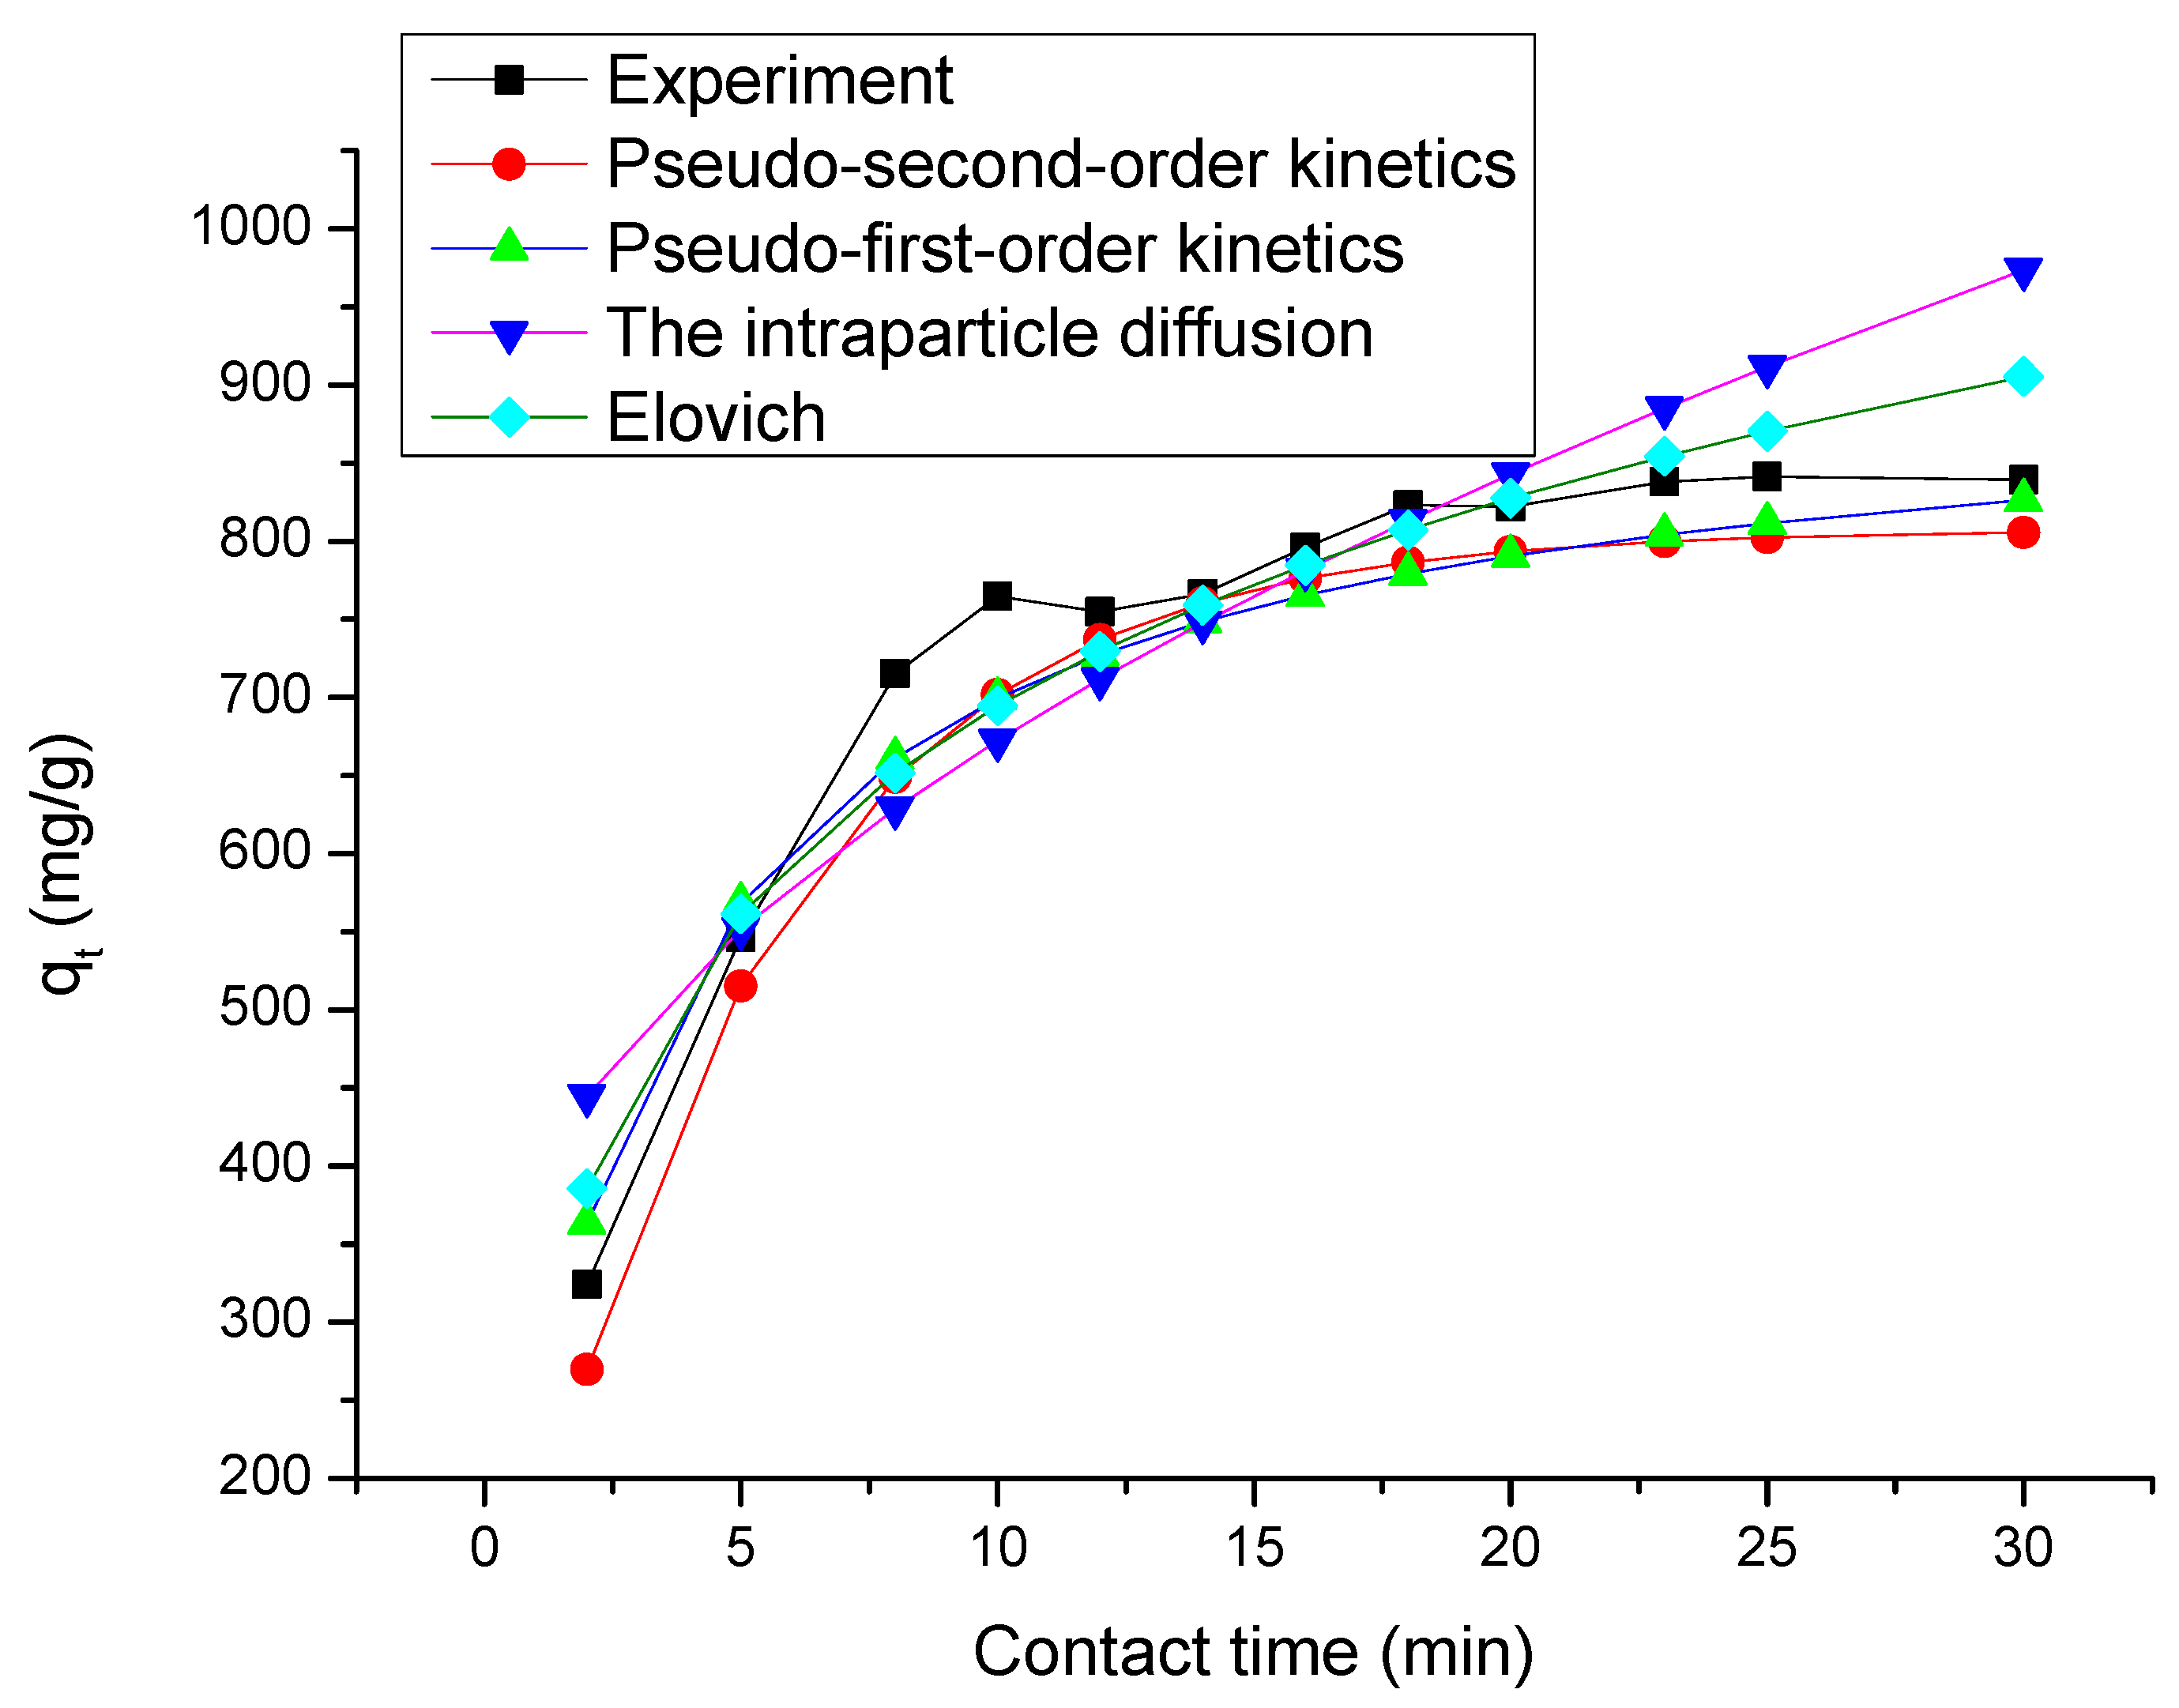
3.8. Kinetics Studies

Four models (pseudo-first-order [93], pseudo-second-order [94,95], intraparticle diffusion [96,97] and Elovich [98]) were investigated in the adsorption of EV by Mn-doped Fe/rGO. The parameters of the four models and calculated values of qt versus t are presented in Table 8 and Figure 26, respectively. It can be seen from this figure that the adsorption of EV onto the nanocomposites increased with sonication time until the equilibrium was attained after 23 min. The adsorption system adsorbed EV rapidly within 7 min. During the rapid adsorption process, the adsorbent diffused from the bulk phase to the outer membrane around the adsorbent surface and then was gradually adsorbed until it reached equilibrium [89]. The R2 values for pseudo-first-order, pseudo-second-order, intraparticle diffusion and Elovich were 0.9509, 0.9969, 0.7926 and 0.9246, respectively. The results indicated that the pseudo-second-order equation (R2 = 0.9969) could fit the experimental data better than the other models.

4. Conclusions

Mesoporous Mn-doped Fe/rGO nanocomposites were successfully synthesized in this work with a one-step co-precipitation method, characterized by XRD, XPS, Raman, HR-TEM, SEM, EDS, N2-sorption, SA-XRD and SQUID techniques and used for EV elimination. The SBET of Mn-doped Fe/rGO composites was 104.088 m2/g, and narrow pore size distributions centered at 3.93 nm. Mn-doped Fe/rGO demonstrated a well-resolved peak at 0.71° of 2θ angles of SA-XRD, and partially ordered pores were clearly observed in HR-TEM images. The results show that the Mn-doped Fe/rGO nanocomposites were partially ordered mesoporous materials. The effects of experimental parameters (initial EV concentration, sonication time, initial pH and amount of adsorbent (Mn-doped Fe/rGO)) on the elimination efficiency of EV were studied by using AI tools (ANN-GA, ANN-PSO, RF and RBF). The mean absolute errors of BP-ANN and RF were 1.55% and 4.56%, respectively, and the R2 values of RBF and BP-ANN were 0.95415 and 0.99403, respectively. According to the results, random forest optimization is not as effective as BP-ANN, while the RBF and BP-ANN models were suitable for predicting the EV removal. The developed models from ANN-GA, ANN-PSO and RSM were compared and validated using the predicted optimal conditions. The results indicated that the absolute errors of ANN-GA, ANN-PSO and RSM models were 0.72%, 1.28% and 1.53%, respectively. Therefore, ANN-GA is considered as the best model for the prediction of the EV elimination by Mn-doped Fe/rGO.
The factor importance was analyzed by F test, Garson method, GBRT and RF. It can be seen that dosage gives the maximum importance to Mn-doped Fe/rGO EV elimination. The isotherms and kinetic models were investigated in the adsorption of EV onto Mn-doped Fe/rGO. The results illustrated that the adsorption of EV accords with Langmuir isotherm and pseudo-second-order models, respectively. The RL values were 0.01585–0.05093, indicating that the adsorption of EV by Mn-doped Fe/rGO is favorable, and the value of maximum adsorption capacity is 1000.00 mg/g. The Mn-doped Fe/rGO composites is an effective adsorbent for removal of dyes in water because of its easy synthesis, large adsorption capacity, high specific surface area and good magnetic property (saturation magnetization was 47.0514 emu/g).

Author Contributions

Conceptualization, Y.H.; methodology, Y.H., J.H. and X.W.; software, Y.H. and J.Q.; formal analysis, J.Q. and Y.X.; data curation, Y.H.; validation, Y.X. and L.X.; supervision, J.Q. and L.X.; Writing the draft and data preparation, Y.H. and J.H. All authors have read and agreed to the published version of the manuscript.

Funding

This research was funded by the National Natural Science Foundation of China (Grant No. 21667012), the Government of Guizhou Province (Project No. [2017] 5726-42) and the National 111 Project of China (Grant No. D17016).

Conflicts of Interest

The authors declare no conflict of interest.

References

  1. Velusamy, P.; Pitchaimuthu, S.; Rajalakshmi, S.; Kannan, N. Modification of the photocatalytic activity of TiO2 by β-Cyclodextrin in decoloration of ethyl violet dye. J. Adv. Res. 2014, 5, 19–25. [Google Scholar] [CrossRef] [PubMed] [Green Version]
  2. Tsai, W.T.; Chang, Y.M.; Lai, C.W.; Lo, C.C. Adsorption of ethyl violet dye in aqueous solution by regenerated spent bleaching earth. J. Colloid Interface Sci. 2005, 289, 333–338. [Google Scholar] [CrossRef] [PubMed]
  3. Khan, H.; Ahmad, N.; Yasar, A.; Shahid, R. Advanced oxidative decolorization of red Cl-5B: Effects of dye concentration, process optimization and reaction kinetics. Pol. J. Environ. Stud. 2010, 19, 83–92. [Google Scholar]
  4. Lee, W.W.; Chung, W.H.; Lu, C.S.; Lin, W.Y.; Chen, C.C. A study on the degradation efficiency and mechanisms of ethyl violet by HPLC―PDA―ESI―MS and GC―MS. Sep. Purif. Technol. 2012, 98, 488–496. [Google Scholar] [CrossRef]
  5. Duxbury, D.F. The photochemistry and photophysics of triphenylmethane dyes in solid and liquid media. Chem. Rev. 1993, 93, 381–433. [Google Scholar] [CrossRef]
  6. Zhang, C.; Li, H.; Li, C.; Li, Z. Fe-loaded MOF-545 (Fe): Peroxidase-like activity for dye degradation dyes and high adsorption for the removal of dyes from wastewater. Molecules 2020, 25, 168. [Google Scholar] [CrossRef] [Green Version]
  7. Ruan, W.; Shi, X.; Hu, J.; Hou, Y.; Fan, M.; Cao, R.; Wei, X. Modeling of malachite green removal from aqueous solutions by nanoscale zerovalent zinc using artificial neural network. Appl. Sci. 2018, 7, 3. [Google Scholar] [CrossRef] [Green Version]
  8. Chen, Y.; Wang, K.; Lou, L. Photodegradation of dye pollutants on silica gel supported TiO2 particles under visible light irradiation. J. Photochem. Photobiol. A 2004, 163, 281–287. [Google Scholar] [CrossRef]
  9. Wang, J.Q.; Liu, Y.H.; Chen, M.W.; Xie, G.Q.; Louzguine-Luzgin, D.V.; Inoue, A.; Perepezko, J.H. Rapid degradation of azo dye by Fe-based metallic glass powder. Adv. Funct. Mater. 2012, 22, 2567–2570. [Google Scholar] [CrossRef]
  10. Zhang, W. Nanoscale iron particles for environmental remediation: An overview. J. Nanopart. Res. 2003, 5, 323–332. [Google Scholar] [CrossRef]
  11. Kalme, S.D.; Parshetti, G.K.; Jadhav, S.U.; Govindwar, S.P. Biodegradation of benzidine based dye direct blue-6 by pseudomonas desmolyticum NCIM 2112. Bioresour. Technol. 2007, 98, 1405–1410. [Google Scholar] [CrossRef] [PubMed]
  12. Amin, N.K. Removal of direct blue-106 dye from aqueous solution using new activated carbons developed from pomegranate peel: Adsorption equilibrium and kinetics. J. Hazard. Mater. 2009, 165, 52–62. [Google Scholar] [CrossRef] [PubMed]
  13. Hmani, E.; Samet, Y.; Abdelhédi, R. Electrochemical degradation of auramine-O dye at boron-doped diamond and lead dioxide electrodes. Diam. Relat. Mater. 2012, 30, 1–8. [Google Scholar] [CrossRef]
  14. Basiri, F.; Ravandi, S.A.H.; Feiz, M.; Moheb, A. Recycling of direct dyes wastewater by nylon-6 nanofibrous membrane. Curr. Nanosci. 2011, 7, 633–639. [Google Scholar] [CrossRef]
  15. Kamal, S.; Pan, G.T.; Chong, S.; Yang, T.C.K. Ultrasonically induced sulfur-doped carbon nitride/cobalt ferrite nanocomposite for efficient sonocatalytic removal of organic dyes. Processes 2020, 8, 104. [Google Scholar] [CrossRef] [Green Version]
  16. Dong, H.; Zhang, C.; Deng, J.; Jiang, Z.; Zhang, L.; Cheng, Y.; Hou, K.; Tang, L.; Zeng, G. Factors influencing degradation of trichloroethylene by sulfide-modified nanoscale zero-valent iron in aqueous solution. Water Res. 2018, 135, 1–10. [Google Scholar] [CrossRef]
  17. Sun, Y.P.; Li, X.Q.; Cao, J.; Zhang, W.X.; Wang, H.P. Characterization of zero-valent iron nanoparticles. Adv. Colloid Interface 2006, 120, 47–56. [Google Scholar] [CrossRef]
  18. Zhang, X.; Lin, S.; Lu, X.Q.; Chen, Z.l. Removal of Pb(II) from water using synthesized kaolin supported nanoscale zero-valent iron. Chem. Eng. J. 2010, 163, 243–248. [Google Scholar] [CrossRef]
  19. Ziajahromi, S.; Mehrdad, M.; Khanizadeh, M. Nitrate Removal from Water Using Synthesis Nanoscale Zero-Valent Iron (NZVI). In Proceedings of the International Conference on Applied Life Sciences (ICALS2012), Konya, Turkey, 10–12 September 2012; pp. 105–110. [Google Scholar]
  20. Arabi, S.; Sohrabi, M.R. Experimental design and response surface modelling for optimization of vat dye from water by nano zero valent iron (NZVI). Acta Chim. Slov. 2013, 60, 853–860. [Google Scholar]
  21. Huber, D.L. Synthesis, properties, and applications of iron nanoparticles. Small 2005, 1, 482–501. [Google Scholar] [CrossRef]
  22. Lu, H.; Wang, J.; Ferguson, S.; Wang, T.; Bao, Y.; Hao, H. Mechanism, synthesis and modification of nano zerovalent iron in water treatment. Nanoscale 2016, 8, 9962–9975. [Google Scholar] [CrossRef] [PubMed]
  23. Diagboya, P.N.; Olu-Owolabi, B.I.; Zhou, D.; Han, B.H. Graphene oxide–tripolyphosphate hybrid used as a potent sorbent for cationic dyes. Carbon 2014, 79, 174–182. [Google Scholar] [CrossRef]
  24. Loh, K.P.; Bao, Q.; Ang, P.K.; Yang, J. The chemistry of graphene. J. Mater. Chem. 2010, 20, 2277–2289. [Google Scholar] [CrossRef]
  25. Gao, W.; Alemany, L.B.; Ci, L.; Ajayan, P.M. New insights into the structure and reduction of graphite oxide. Nat. Chem. 2009, 1, 403–408. [Google Scholar] [CrossRef]
  26. Boukhvalov, D.W.; Katsnelson, M.I. Modeling of graphite oxide. J. Am. Chem. Soc. 2008, 130, 10697–10701. [Google Scholar] [CrossRef] [Green Version]
  27. Akhavan, O.; Ghaderi, E. Toxicity of graphene and graphene oxide nanowalls against bacteria. ACS Nano 2010, 4, 5731–5736. [Google Scholar] [CrossRef]
  28. Tang, J.; Huang, Y.; Gong, Y.; Lyu, H.; Wang, Q.; Ma, J. Preparation of a novel graphene oxide/Fe-Mn composite and its application for aqueous Hg(II) removal. J. Hazard. Mater. 2016, 316, 151–158. [Google Scholar] [CrossRef]
  29. Tan, W.C.; Hofmann, M.; Hsieh, Y.P.; Lu, M.L.; Chen, Y.F. A graphene-based surface plasmon sensor. Nano Res. 2012, 5, 695–702. [Google Scholar] [CrossRef]
  30. Joshi, R.K.; Alwarappan, S.; Yoshimura, M.; Sahajwalla, V.; Nishina, Y. Graphene oxide: The new membrane material. Appl. Mater. Today 2015, 1, 1–12. [Google Scholar] [CrossRef] [Green Version]
  31. Huang, C.; Bai, H.; Li, C.; Shi, G. A graphene oxide/hemoglobin composite hydrogel for enzymatic catalysis in organic solvents. Chem. Commun. 2011, 47, 4962. [Google Scholar] [CrossRef] [Green Version]
  32. Li, W.; Zhang, Z.; Tang, Y.; Bian, H.; Ng, T.W.; Zhang, W.; Lee, C.S. Graphene-nanowall-decorated carbon felt with excellent electrochemical activity toward VO\r 2+\r /VO\r 2+\r couple for all vanadium redox flow battery. Adv. Sci. 2016, 3, 1500276. [Google Scholar] [CrossRef] [PubMed] [Green Version]
  33. Islam, M.M.; Aboutalebi, S.H.; Cardillo, D.; Liu, H.K.; Konstantinov, K.; Dou, S.X. Self-assembled multifunctional hybrids: Toward developing high-performance graphene-based architectures for energy storage devices. ACS Cent. Sci. 2015, 1, 206–216. [Google Scholar] [CrossRef] [PubMed]
  34. Bissett, M.A.; Kinloch, I.A.; Dryfe, R.A.W. Characterization of MoS2-graphene composites for high-performance coin cell supercapacitors. ACS Appl. Mater. Inter. 2015, 7, 17388. [Google Scholar] [CrossRef] [PubMed]
  35. He, Q.; Wu, S.; Yin, Z.; Zhang, H. Graphene-based electronic sensors. Chem. Sci. 2012, 3, 1764–1772. [Google Scholar] [CrossRef] [Green Version]
  36. Wan, L.; Luo, T.; Wang, S.; Wang, X.; Guo, Z.; Xiong, H.; Dong, B.; Zhao, L.; Xu, Z.; Zhang, X.; et al. Pt/graphene nanocomposites with low Pt-loadings: Synthesis through one- and two-step chemical reduction methods and their use as promising counter electrodes for DSSCs. Compos. Sci. Technol. 2015, 113, 46–53. [Google Scholar] [CrossRef]
  37. Fan, M.; Hu, J.; Cao, R.; Ruan, W.; Wei, X. A review on experimental design for pollutants removal in water treatment with the aid of artificial intelligence. Chemosphere 2018, 200, 330. [Google Scholar] [CrossRef]
  38. Mocanu, D.C.; Mocanu, E.; Stone, P.; Nguyen, P.H.; Gibescu, M.; Liotta, A. Scalable training of artificial neural networks with adaptive sparse connectivity inspired by network science. Nat. Commun. 2018, 9, 2383–2395. [Google Scholar] [CrossRef] [Green Version]
  39. Vakili, M.; Karami, M.; Delfani, S.; Khosrojerdi, S.; Kalhor, K. Experimental investigation and modeling of thermal conductivity of CuO–water/EG nanofluid by FFBP-ANN and multiple regressions. J. Therm. Anal. Calorim. 2017, 129, 629–637. [Google Scholar] [CrossRef]
  40. Hua, J.; Xiao, C.; Ke, Z.; Wang, Y. Construct Drawing Man-Hour Forecasting based on GA-BP in Chemical Equipment Design Process. In Proceedings of the 2016 22nd International Conference on Automation and Computing (ICAC), Colchester, UK, 7–8 September 2016; pp. 1–6. [Google Scholar]
  41. Li, J.; Cheng, J.; Shi, J.; Huang, F. Brief Introduction of Back Propagation (BP) Neural Network Algorithm and its Improvement. In Advances in Computer Science and Information Engineering-Volume 2; Jin, D., Lin, S., Eds.; Vol. 169 of Advances in Intelligent and Soft Computing; Springer: Berlin/Heidelberg, Germany, 2012; pp. 553–558. [Google Scholar]
  42. Ahmadi Azqhandi, M.H.; Ghaedi, M.; Yousefi, F.; Jamshidi, M. Application of random forest, radial basis function neural networks and central composite design for modeling and/or optimization of the ultrasonic assisted adsorption of brilliant green on ZnS-NP-AC. J. Colloid Interface Sci. 2017, 505, 278–292. [Google Scholar] [CrossRef]
  43. Kayarvizhy, N.; Kanmani, S.; Rhymend, U.V. Improving fault prediction using ANN-PSO in object oriented systems. Int. J. Comput. Appl. 2014, 73, 18–25. [Google Scholar]
  44. Che, Z.H. PSO-based back-propagation artificial neural network for product and mold cost estimation of plastic injection molding. Comput. Ind. Eng. 2010, 58, 625–637. [Google Scholar] [CrossRef]
  45. Breiman, L. Random Forests. Mach. Learn. 2001, 45, 5–32. [Google Scholar] [CrossRef] [Green Version]
  46. Zhang, M.; Liu, Y. Signal Sorting Using Teaching-Learning-Based Optimization and Random Forest. In Proceedings of the 2018 17th International Symposium on Distributed Computing and Applications for Business Engineering and Science (DCABES), Wuxi, China, 19–23 October 2018; pp. 258–261. [Google Scholar]
  47. Shi, X.; Ruan, W.; Hu, J.; Fan, M.; Cao, R.; Wei, X. Optimizing the removal of Rhodamine B in aqueous solutions by reduced graphene oxide-supported nanoscale zerovalent iron (nZVI/rGO) using an artificial neural network-genetic algorithm (ANN-GA). Nanomaterials 2017, 7, 134. [Google Scholar] [CrossRef] [Green Version]
  48. Parsaee, Z.; Karachi, N.; Abrishamifar, S.M.; Kahkha, M.R.R.; Razavi, R. Silver-choline chloride modified graphene oxide: Novel nano-bioelectrochemical sensor for Celecoxib detection and CCD-RSM model. Ultrason. Sonochem. 2018, 45, 106–115. [Google Scholar] [CrossRef] [PubMed]
  49. Wang, Y.X.; Liu, B.; Gao, J.X.; Zhang, X.F.; Li, S.L.; Liu, J.Q.; Tian, Z.P. Auto recognition of carbonate microfacies based on an improved back propagation neural network. J. Cent. South Univ. 2015, 22, 3521–3535. [Google Scholar] [CrossRef]
  50. Ghaedi, M.; Zeinali, N.; Ghaedi, A.M.; Teimuori, M.; Tashkhourian, J. Artificial neural network-genetic algorithm based optimization for the adsorption of methylene blue and brilliant green from aqueous solution by graphite oxide nanoparticle. Spectrochim. Acta A 2014, 125, 264–277. [Google Scholar] [CrossRef]
  51. Huang, Y.; Liu, Y.; Li, C.; Wang, C. GBRTVis: Online analysis of gradient boosting regression tree. J. Visual. 2019, 22, 125–140. [Google Scholar] [CrossRef]
  52. Li, X.; Bai, R. Freight Vehicle Travel Time Prediction Using Gradient Boosting Regression Tree. In Proceedings of the 2016 15th IEEE International Conference on Machine Learning and Applications (ICMLA), Anaheim, CA, USA, 18–20 December 2016; pp. 1–7. [Google Scholar]
  53. Montaño, J.J.; Palmer, A. Numeric sensitivity analysis applied to feedforward neural networks. Neural Comput. Appl. 2003, 12, 119–125. [Google Scholar] [CrossRef]
  54. Ruan, W.; Hu, J.; Qi, J.; Hou, Y.; Cao, R.; Wei, X. Removal of crystal violet by using reduced-graphene-oxide-supported bimetallic Fe/Ni nanoparticles (rGO/Fe/Ni): Application of artificial intelligence modeling for the optimization process. Materials 2018, 11, 865. [Google Scholar] [CrossRef] [Green Version]
  55. Dhingra, S.; Dubey, K.K.; Bhushan, G. A polymath approach for the prediction of optimized transesterification process variables of polanga biodiesel. J. Am. Oil Chem. Soc. 2014, 91, 641–653. [Google Scholar] [CrossRef]
  56. Gulati, T.; Chakrabarti, M.; Sing, A.; Duvuuri, M.; Banerjee, R. Comparative study of response surface methodology, artificial neural network and genetic algorithms for optimization of soybean hydration. Food Technol. Biotech. 2010, 48, 11–18. [Google Scholar]
  57. Sarkar, D.; Modak, J.M. Optimisation of fed-batch bioreactors using genetic algorithms. Chem. Eng. Sci. 2003, 58, 2283–2296. [Google Scholar] [CrossRef]
  58. Lee, K.H.; Jun, S.O.; Pak, K.H.; Lee, D.H.; Lee, K.W.; Park, J.P. Numerical optimization of site selection for offshore wind turbine installation using genetic algorithm. Curr. Appl. Phys. 2010, 10, S302–S306. [Google Scholar] [CrossRef]
  59. Eberhart, R.; Kennedy, J. A New Optimizer Using Particle Swarm Theory. In Proceedings of the MHS’95. Proceedings of the Sixth International Symposium on Micro Machine and Human Science, Nagoya, Japan, 4–6 October 1995; pp. 39–43. [Google Scholar]
  60. Mitchell, M.L.D. Davis, handbook of genetic algorithms. Artif. Intell. 1998, 100, 325–330. [Google Scholar] [CrossRef] [Green Version]
  61. Bejagam, K.K.; Singh, S.; An, Y.; Berry, C.; Deshmukh, S.A. PSO assisted development of new transferable coarse-grained water models. J. Phys. Chem. B 2018, 122, 1–37. [Google Scholar] [CrossRef]
  62. Wang, D.; Liu, Y.; Wu, Z.; Fu, H.; Shi, Y.; Guo, H. Scenario analysis of natural gas consumption in China based on wavelet neural network optimized by particle swarm optimization algorithm. Energies 2018, 11, 825. [Google Scholar] [CrossRef] [Green Version]
  63. Sami, M.; Hassanien, A.E.; Nashwa, E.B.; Berwick, R.C. Incorporating Random Forest Trees with Particle Swarm Optimization for Automatic Image Annotation. In Proceedings of the 2012 Federated Conference on Computer Science and Information Systems (FedCSIS), Wroclaw, Poland, 9–12 September 2012; pp. 791–797. [Google Scholar]
  64. Ming, D.; Zhou, T.; Min, W.; Tian, T. Land cover classification using random forest with genetic algorithm-based parameter optimization. J. Appl. Remote Sens. 2016, 10, 035021. [Google Scholar] [CrossRef]
  65. Gislason, P.O.; Benediktsson, J.A.; Sveinsson, J.R. Random forests for land cover classification. Pattern Recogn. Lett. 2006, 27, 294–300. [Google Scholar] [CrossRef]
  66. Li, J.; Liu, X. Melt index prediction by RBF neural network optimized with an adaptive new ant colony optimization algorithm. J. Appl. Polym. Sci. 2011, 119, 3093–3100. [Google Scholar] [CrossRef]
  67. Najafi-Marghmaleki, A.; Khosravi-Nikou, M.R.; Barati-Harooni, A. A new model for prediction of binary mixture of ionic liquids+water density using artificial neural network. J. Mol. Liq. 2016, 220, 232–237. [Google Scholar] [CrossRef]
  68. Tatar, A.; Shokrollahi, A.; Mesbah, M.; Rashid, S.; Arabloo, M.; Bahadori, A. Implementing radial basis function networks for modeling CO2-reservoir oil minimum miscibility pressure. J. Nat. Gas Sci. Eng. 2013, 15, 82–92. [Google Scholar] [CrossRef]
  69. Rasouli, Z.; Hassanzadeh, Z.; Ghavami, R. Application of a new version of GA-RBF neural network for simultaneous spectrophotometric determination of Zn(II), Fe(II), Co(II) and Cu(II) in real samples: An exploratory study of their complexation abilities toward MTB. Talanta 2016, 160, 86–98. [Google Scholar] [CrossRef] [PubMed]
  70. Zhang, K.; Dwivedi, V.; Chi, C.; Wu, J. Graphene oxide/ferric hydroxide composites for efficient arsenate removal from drinking water. J. Hazard. Mater. 2010, 182, 162–168. [Google Scholar] [CrossRef] [PubMed]
  71. Trejos, T.; Corzo, R.; Subedi, K.; Almirall, J. Characterization of toners and inkjets by laser ablation spectrochemical methods and Scanning Electron Microscopy-Energy Dispersive X-ray Spectroscopy. Spectrochim. Acta B 2014, 92, 9–22. [Google Scholar] [CrossRef]
  72. Su, J.; Lin, S.; Chen, Z.; Megharaj, M.; Naidu, R. Dechlorination of p-chlorophenol from aqueous solution using bentonite supported Fe/Pd nanoparticles: Synthesis, characterization and kinetics. Desalination 2011, 280, 167–173. [Google Scholar] [CrossRef]
  73. Casiraghi, C.; Pisana, S.; Novoselov, K.S.; Geim, A.K.; Ferrari, A.C. Raman fingerprint of charged impurities in graphene. Appl. Phys. Lett. 2007, 91, 183. [Google Scholar] [CrossRef] [Green Version]
  74. Kotutha, I.; Swatsitang, E.; Meewassana, W.; Maensiri, S. One-pot hydrothermal synthesis, characterization, and electrochemical properties of rGO/MnFe2O4 nanocomposites. Jpn. J. Appl. Phys. 2015, 54, 06FH10. [Google Scholar] [CrossRef]
  75. Pimenta, M.; Dresselhaus, G.; Dresselhaus, M.; Cancado, L.; Jorio, A.; Saito, R. Studying disorder in graphite-based systems by Raman spectroscopy. Phys. Chem. Chem. Phys. 2007, 9, 1276–1291. [Google Scholar] [CrossRef]
  76. Fontana, M.D.; Bourson, P. Microstructure and defects probed by Raman spectroscopy in lithium niobate crystals and devices. Appl. Phys. Rev. 2015, 2, 040602. [Google Scholar] [CrossRef]
  77. Srivastava, R.K.; Xavier, P.; Gupta, S.N.; Kar, G.P.; Bose, S.; Sood, A. Excellent electromagnetic interference shielding by graphene-MnFe2O4-multiwalled carbon nanotube hybrids at very low weight percentage in polymer matrix. ChemistrySelect 2016, 1, 5995–6003. [Google Scholar] [CrossRef]
  78. Stankovich, S.; Dikin, D.A.; Piner, R.D.; Kohlhaas, K.A.; Kleinhammes, A.; Jia, Y.; Wu, Y.; Nguyen, S.T.; Ruoff, R.S.J.C. Synthesis of graphene-based nanosheets via chemical reduction of exfoliated graphite oxide. Carbon 2007, 45, 1558–1565. [Google Scholar] [CrossRef]
  79. Liu, G.; Chen, Q.; Oyunkhand, E.; Ding, S.; Yamane, N.; Yang, G.; Yoneyama, Y.; Tsubaki, N. Nitrogen-rich mesoporous carbon supported iron catalyst with superior activity for Fischer-Tropsch synthesis. Carbon 2018, 130, 304–314. [Google Scholar] [CrossRef]
  80. Leofanti, G.; Padovan, M.; Tozzola, G.; Venturelli, B. Surface area and pore texture of catalysts. Catal. Today 1998, 41, 207–219. [Google Scholar] [CrossRef]
  81. Lin, X.; Lv, X.; Wang, L.; Zhang, F.; Duan, L. Preparation and characterization of MnFe2O4 in the solvothermal process: Their magnetism and electrochemical properties. Mater. Res. Bull. 2013, 48, 2511–2516. [Google Scholar] [CrossRef]
  82. Hung, I.M.; Hung, D.T.; Fung, K.Z.; Hon, M.H. Synthesis and characterization of highly ordered mesoporous YSZ by tri-block copolymer. J. Porous Mat. 2006, 13, 225–230. [Google Scholar] [CrossRef]
  83. Solaymani, E.; Ghaedi, M.; Karimi, H.; Azqhandi, M.H.A.; Asfaram, A. Intensified removal of Malachite green by AgOH-AC nanoparticles combined with ultrasound: Modeling and optimization. Appl. Organomet. Chem. 2017, 31, e3857. [Google Scholar] [CrossRef]
  84. El-Gamal, S.; Amin, M.; Ahmed, M. Removal of methyl orange and bromophenol blue dyes from aqueous solution using Sorel’s cement nanoparticles. J. Environ. Chem. Eng. 2015, 3, 1702–1712. [Google Scholar] [CrossRef]
  85. Forouz, F.S.; Ravandi, S.A.H.; Allafchian, A.R. Removal of Ag and Cr heavy metals using nanofiber membranes functionalized with aminopropyltriethoxysilane (APTES). Curr. Nanosci. 2016, 12, 266–274. [Google Scholar] [CrossRef]
  86. Chowdhury, S.; Misra, R.; Kushwaha, P.; Das, P. Optimum sorption isotherm by linear and nonlinear methods for safranin onto alkali-treated rice husk. Bioremediat. J. 2011, 15, 77–89. [Google Scholar] [CrossRef]
  87. Zhang, J.; Lin, S.; Han, M.; Su, Q.; Xia, L.; Hui, Z. Adsorption properties of magnetic magnetite nanoparticle for coexistent Cr (VI) and Cu (II) in mixed solution. Water 2020, 12, 446. [Google Scholar] [CrossRef] [Green Version]
  88. Chen, C.; Cheng, T.; Zhang, X.; Wu, R.; Wang, Q. Synthesis of an efficient Pb adsorption nano-crystal under strong alkali hydrothermal environment using a gemini surfactant as directing agent. J. Chem. Soc. Pak. 2019, 41, 1034–1038. [Google Scholar]
  89. Altaher, H.; Khalil, T.E.; Abubeah, R. The effect of dye chemical structure on adsorption on activated carbon: A comparative study. Color. Technol. 2014, 130, 205–214. [Google Scholar] [CrossRef]
  90. Cheng, C.; Cheng, T.; Wang, Z.L.; Han, C.H. Removal of Zn2+ in aqueous solution by Linde F (K) zeolite prepared from recycled fly ash. J. Indian Chem. Soc. 2014, 91, 1–7. [Google Scholar]
  91. Kumar, K.V.; Porkodi, K.; Rocha, F. Comparison of various error functions in predicting the optimum isotherm by linear and non-linear regression analysis for the sorption of basic red 9 by activated carbon. J. Hazard. Mater. 2008, 150, 158–165. [Google Scholar] [CrossRef] [PubMed]
  92. Pan, M.; Lin, X.; Xie, J.; Huang, X. Kinetic, equilibrium and thermodynamic studies for phosphate adsorption on aluminum hydroxide modified palygorskite nano-composites. RSC Adv. 2017, 7, 4492–4500. [Google Scholar] [CrossRef] [Green Version]
  93. Ho, Y.S. Citation review of Lagergren kinetic rate equation on adsorption reactions. Scientometrics 2004, 59, 171–177. [Google Scholar]
  94. Ho, Y.S.; Mckay, G. Sorption of dye from aqueous solution by peat. Chem. Eng. J. 1998, 70, 115–124. [Google Scholar] [CrossRef]
  95. Chen, C.; Cheng, T.; Shi, Y.; Tian, Y. Adsorption of Cu (II) from aqueous solution on fly ash based Linde F (K) zeolite. Iran. J. Chem. Chem. Eng. 2014, 33, 29–35. [Google Scholar]
  96. Dogan, M.; Alkan, M. Adsorption kinetics of methyl violet onto perlite. Chemosphere 2003, 50, 517–528. [Google Scholar] [CrossRef]
  97. Cheng, T.; Chen, C.; Tang, R.; Han, C.H.; Tian, Y. Competitive adsorption of Cu, Ni, Pb, and Cd from aqueous solution onto fly ash-based linde F(K) Zeolite. Iran. J. Chem. Chem. Eng. 2018, 37, 61–72. [Google Scholar]
  98. Reffas, A.; Bouguettoucha, A.; Chebli, D.; Amrane, A. Adsorption of ethyl violet dye in aqueous solution by forest wastes, wild carob. Desalin. Water Treat. 2015, 57, 9859–9870. [Google Scholar] [CrossRef]
Figure 1. Chemical structure of cationic ethyl violet dye.
Processes 08 00488 g001
Figure 2. Schematic of Mn-doped Fe/rGO nanocomposite synthesis.
Processes 08 00488 g002
Figure 3. Back propagation artificial neural network (BP-ANN) structure.
Processes 08 00488 g003
Figure 4. XRD spectra of graphene oxide (GO), Fe–Mn and Mn-doped Fe/rGO.
Processes 08 00488 g004
Figure 5. SEM image and the corresponding particle size of Mn-doped Fe/rGO (a,c) and Fe–Mn (b,d).
Processes 08 00488 g005
Figure 6. EDS of Fe–Mn (A) and Mn-doped Fe/rGO (B).
Processes 08 00488 g006
Figure 7. Raman spectra of GO and Mn-doped Fe/rGO.
Processes 08 00488 g007
Figure 8. XPS survey spectra of Fe–Mn NPs and Mn-doped Fe/rGO composites.
Processes 08 00488 g008
Figure 9. XPS analyses of high resolution spectra of Fe2p for Fe–Mn nanoparticles (NPs) (a) and Mn-doped Fe/rGO composites (b), Mn2p for Fe–Mn NPs (c) and Mn-doped Fe/rGO composites (d).
Processes 08 00488 g009
Figure 10. Nitrogen adsorption–desorption isotherm of Fe–Mn and Mn-doped Fe/rGO.
Processes 08 00488 g010
Figure 11. Pore size distribution of Fe/Mn (a) and Mn-doped Fe/rGO (b).
Processes 08 00488 g011
Figure 12. Magnetization curves of Mn-doped Fe/rGO (A), small angle X-ray diffraction (SAXRD) patterns of Mn-doped Fe/rGO (B), HR-TEM (CE) images with different magnifications of Mn-doped Fe/rGO nanocomposites.
Processes 08 00488 g012aProcesses 08 00488 g012b
Figure 13. Predicted versus experimental values plot for EV removal.
Processes 08 00488 g013
Figure 14. Normal probability plot of residuals.
Processes 08 00488 g014
Figure 15. Perturbation plot of EV removal efficiency.
Processes 08 00488 g015
Figure 16. The three-dimensional response surface and contour plots: interactive effects of (A) and (a) X1–X2; (B) and (b) X1–X3; (C) and (c) X1–X4 (D) and (d) X2–X3; (E) and (e) X2–X4; (F) and (f) X3–X4 on decolorization efficiency (%) of dye.
Processes 08 00488 g016aProcesses 08 00488 g016bProcesses 08 00488 g016c
Figure 17. Correlation between MSE and the number of hidden neurons.
Processes 08 00488 g017
Figure 18. Training process of BP-ANN.
Processes 08 00488 g018
Figure 19. Predicted vs. experimental values of the normalized removal of EV from the BP-ANN.
Processes 08 00488 g019
Figure 20. Genetic algorithm (GA) and particle swarm optimization (PSO) chart predicted optimum value of EV removal efficiency.
Processes 08 00488 g020
Figure 21. Comparison between experimental and predicted values of random forest (RF) and BP-ANN.
Processes 08 00488 g021
Figure 22. Comparison between experimental and predicted values of RBF.
Processes 08 00488 g022
Figure 23. Feature importance for gradient boosting regression tree (GBRT).
Processes 08 00488 g023
Figure 24. Feature importance for RF.
Processes 08 00488 g024
Figure 25. Adsorption isotherm of EV by Mn-doped Fe/rGO (sonication time = 23 min; initial pH = 5.0; dosage = 20 mg).
Processes 08 00488 g025
Figure 26. Time dependent study of EV removal by Mn-doped Fe/rGO (initial pH = 5.0; Mn-doped Fe/rGO dosage = 20 mg; EV concentration = 500 mg/L).
Processes 08 00488 g026
Table 1. Four factor, five level central composite design.
FactorsCoded Variable Levels
−α−101α
Initial concentration (mg/L)250300350400450
Initial pH34567
Sonication time (min)710131619
Dosage (mg)1013161922
Table 2. Central composite design matrix for ethyl violet (EV) removal.
Run No.Initial Concentration (mg/L)Initial pHSonication Time (min)Dosage (mg)Removal Efficiency (%)Prediction Efficiency (%)
1350513168887
2300610137675
3350313168382
4300410198082
5400410136765
6300416198588
7400416137272
8350513168687
9300616138282
10300416138080
11400610198280
12350513228785
13350513168687
14400410197575
15300610198786
16400616198586
17400616137775
18350513169087
19300616199293
20450513167174
21350713168690
22350519168078
23400610137067
24400416198080
25250513169089
26350513168787
27350513106064
28300410137473
29350513168687
3035057166166
Table 3. Results of ANOVA for response surface quadratic model.
SourceSum of SquaresdfMean SquareF Valuep-Value
Model1899.5914135.6816.19<0.0001significant
A325.241325.2438.8<0.0001
B88.05188.0510.50.0055
C265.141265.1431.63<0.0001
D617.021617.0273.6<0.0001
AB0.2410.240.0280.8685
AC0.1510.150.0180.8953
AD0.6810.680.0810.7802
BC0.1110.110.0140.9087
BD8.6318.631.030.3264
CD1.211.20.140.71
A251.24151.246.110.0259
B23.0913.090.370.553
C2385.561385.5645.99<0.0001
D2271.171271.1732.35<0.0001
Residual125.75158.38
Lack of Fit112.921011.294.40.0578not significant
Pure Error12.8352.57
Cor Total2025.3329
R2 = 0.9379
Cor total: total of all information corrected for the mean.
Table 4. Comparison of the confirmatory results with predicted results.
Process ParametersOptimization
ANN-GAANN-PSOResponse Surface Methodology (RSM)
Initial concentration (mg/L)299.22371.23300
Initial pH6.156
Sonication time (min)13.1913.9514.32
Dosage (mg)17.5517.2018.62
Decolorization efficiency of model (%)92.75%90.11%94.18%
Experimental verification values (%)92.03%88.83%92.65%
Average values of absolute errors (%)0.72%1.28%1.53%
R20.994030.9379
MSE0.0005
Table 5. The weights and biases of input layers (wi and bi) and hidden layers (wj and bj).
Number of Neuronswibi
Input Bias
wj
Hidden Weights
bj
Hidden Bias
Input Weights
ABCD
11.9019230650.366456135−0.6539557811.420846441−2.489591174−0.9302897410.149904727
21.3095101831.3459139210.27228768−1.611714128−1.936348691−0.26791453
3−1.358393495−1.004381258−0.6310648451.7163352761.3831062080.145250088
40.835468192−0.017592712−1.2682342451.972645308−0.829863725−0.328025674
50.491800507−1.4717224141.8759697560.520544991−0.276621242−0.496795294
6−0.2138964281.474611835−1.322999207−1.492483021−0.2766212420.127936272
70.978450096−0.8855304361.591737282−1.3866895450.8298637250.612899558
81.8123750020.7313476961.323745446−0.7913214311.3831062080.861938074
9−2.371460889−0.698563644−0.1771670650.234218125−1.9363486910.669754604
10−1.325902143−0.6680653521.5926290161.207174065−2.4895911740.812121353
Table 6. Comparison among F value, Garson method, GBRT and RF of factors importance.
F testGarsonGBRTRF
FactorsF ValueOrderRelative Influence (%)OrderRelative Influence (%)Order% IncMSEOrderIncNodePurityOrder
Initial concentration38.8229.96222.34312.763282.693
Initial pH10.5416.51414.6444.544127.764
Sonication time31.63322.64325.01213.632411.462
Dosage73.6130.89138.00121.811551.581
Table 7. Freundlich, Langmuir and Temkin isotherm parameters for the removal of EV by Mn-doped Fe/rGO.
Isotherms ModelsParametersValue of Parameters Obtained by the Linear FittingValue of Parameters Obtained by the Nonlinear Fitting
FreundlichKf (mg/g)705.7775698.97
1/n0.04420.0462
R20.85030.8049
LangmuirKL (L/mg)0.062110.05494
qm (mg/g)1000.0013,417.92
R20.99450.7642
RL0.01585−0.05093
TemkinKT (L/g)1.2 × 108
BT37.395
R20.7491
Table 8. Kinetic parameters for the removal of EV on Mn-doped Fe/rGO.
Kinetic ModelsEquationsParametersValues of Parameters
Pseudo-first-order log ( q e q t ) = log q e k 1 t 2.303 k1 (1/min)0.2034
qe (mg/g)807.4209
R20.9509
Pseudo-second-order t q t = 1 k 2 q e 2 + t q e k2 (g/mg/min)0.37 × 10−3
qe (mg/g)909.0909
R20.9969
Intraparticle diffusion q t = k d t 0.5 + C kd (mg/g/min1/2)115.09
C (mg/g)305.97
R20.7926
Elovich q t = 1 β ln ( α β ) + 1 β ln t α (mg/g/min)715.2812
β (g/mg)5.209 × 10−3
R20.9246

