NMR Determination of Free Fatty Acids in Vegetable Oils


Abstract
:
1. Introduction
2. Discussion
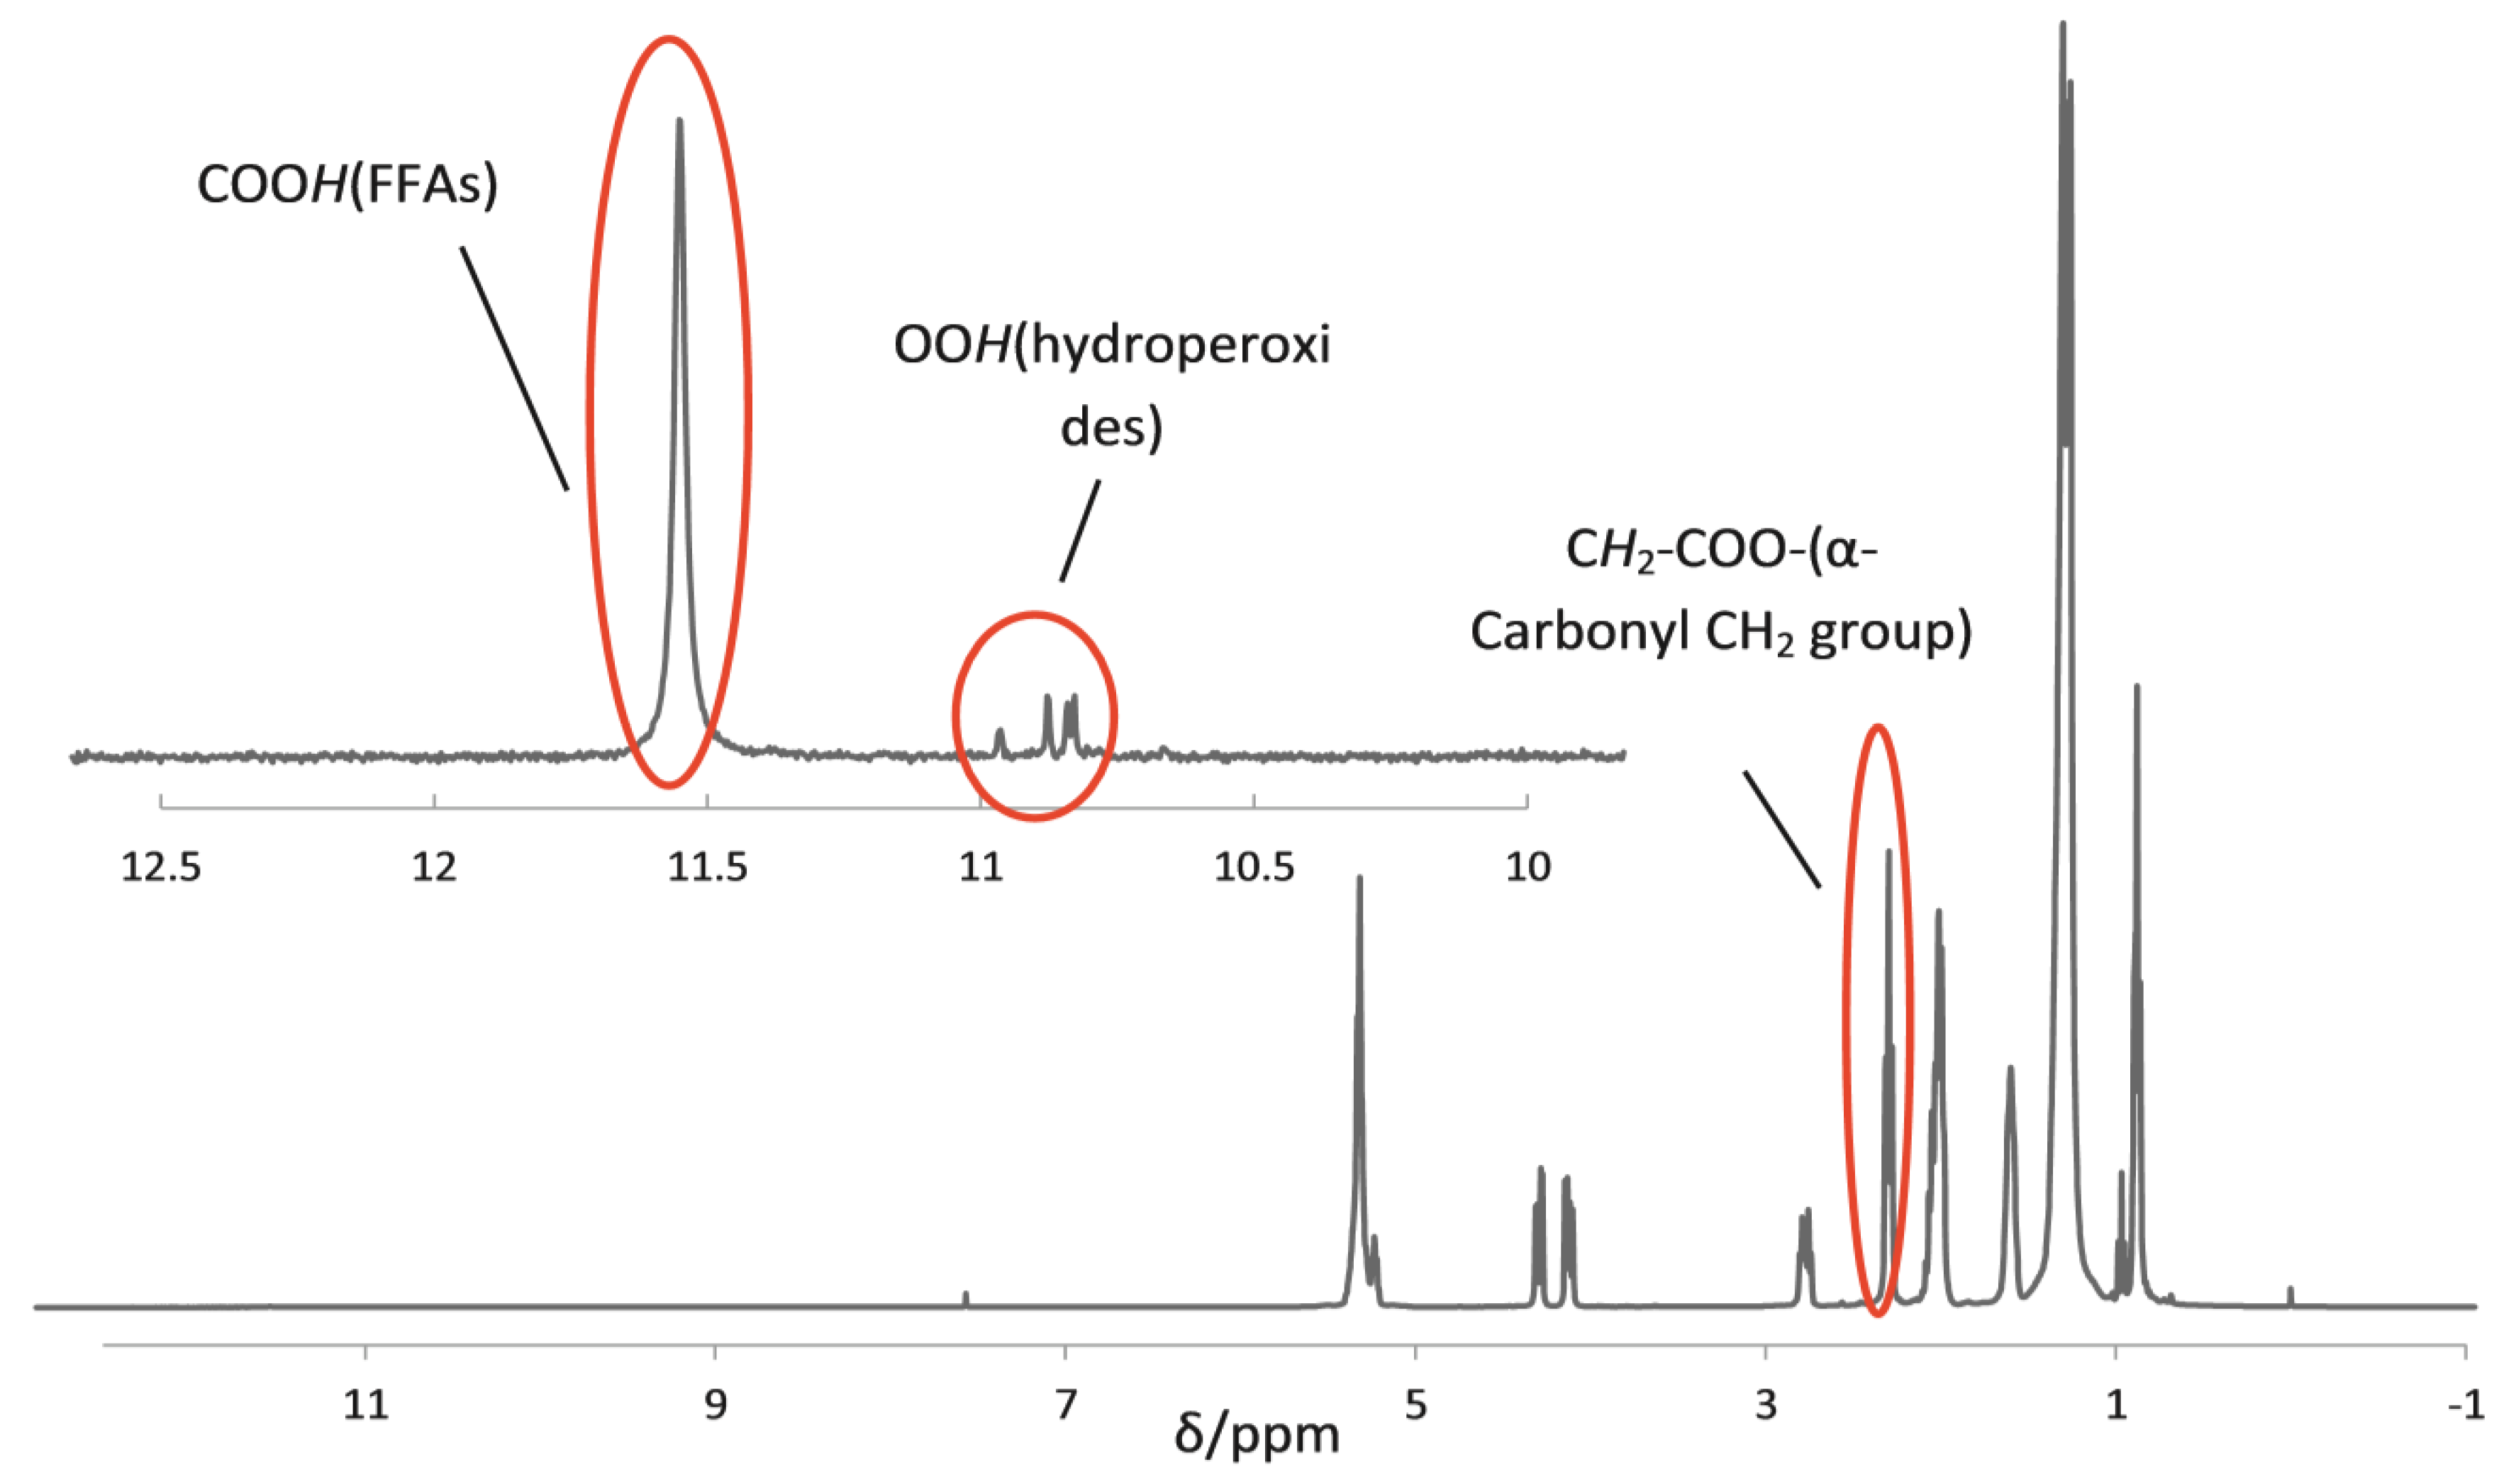
2.1. 1H NMR
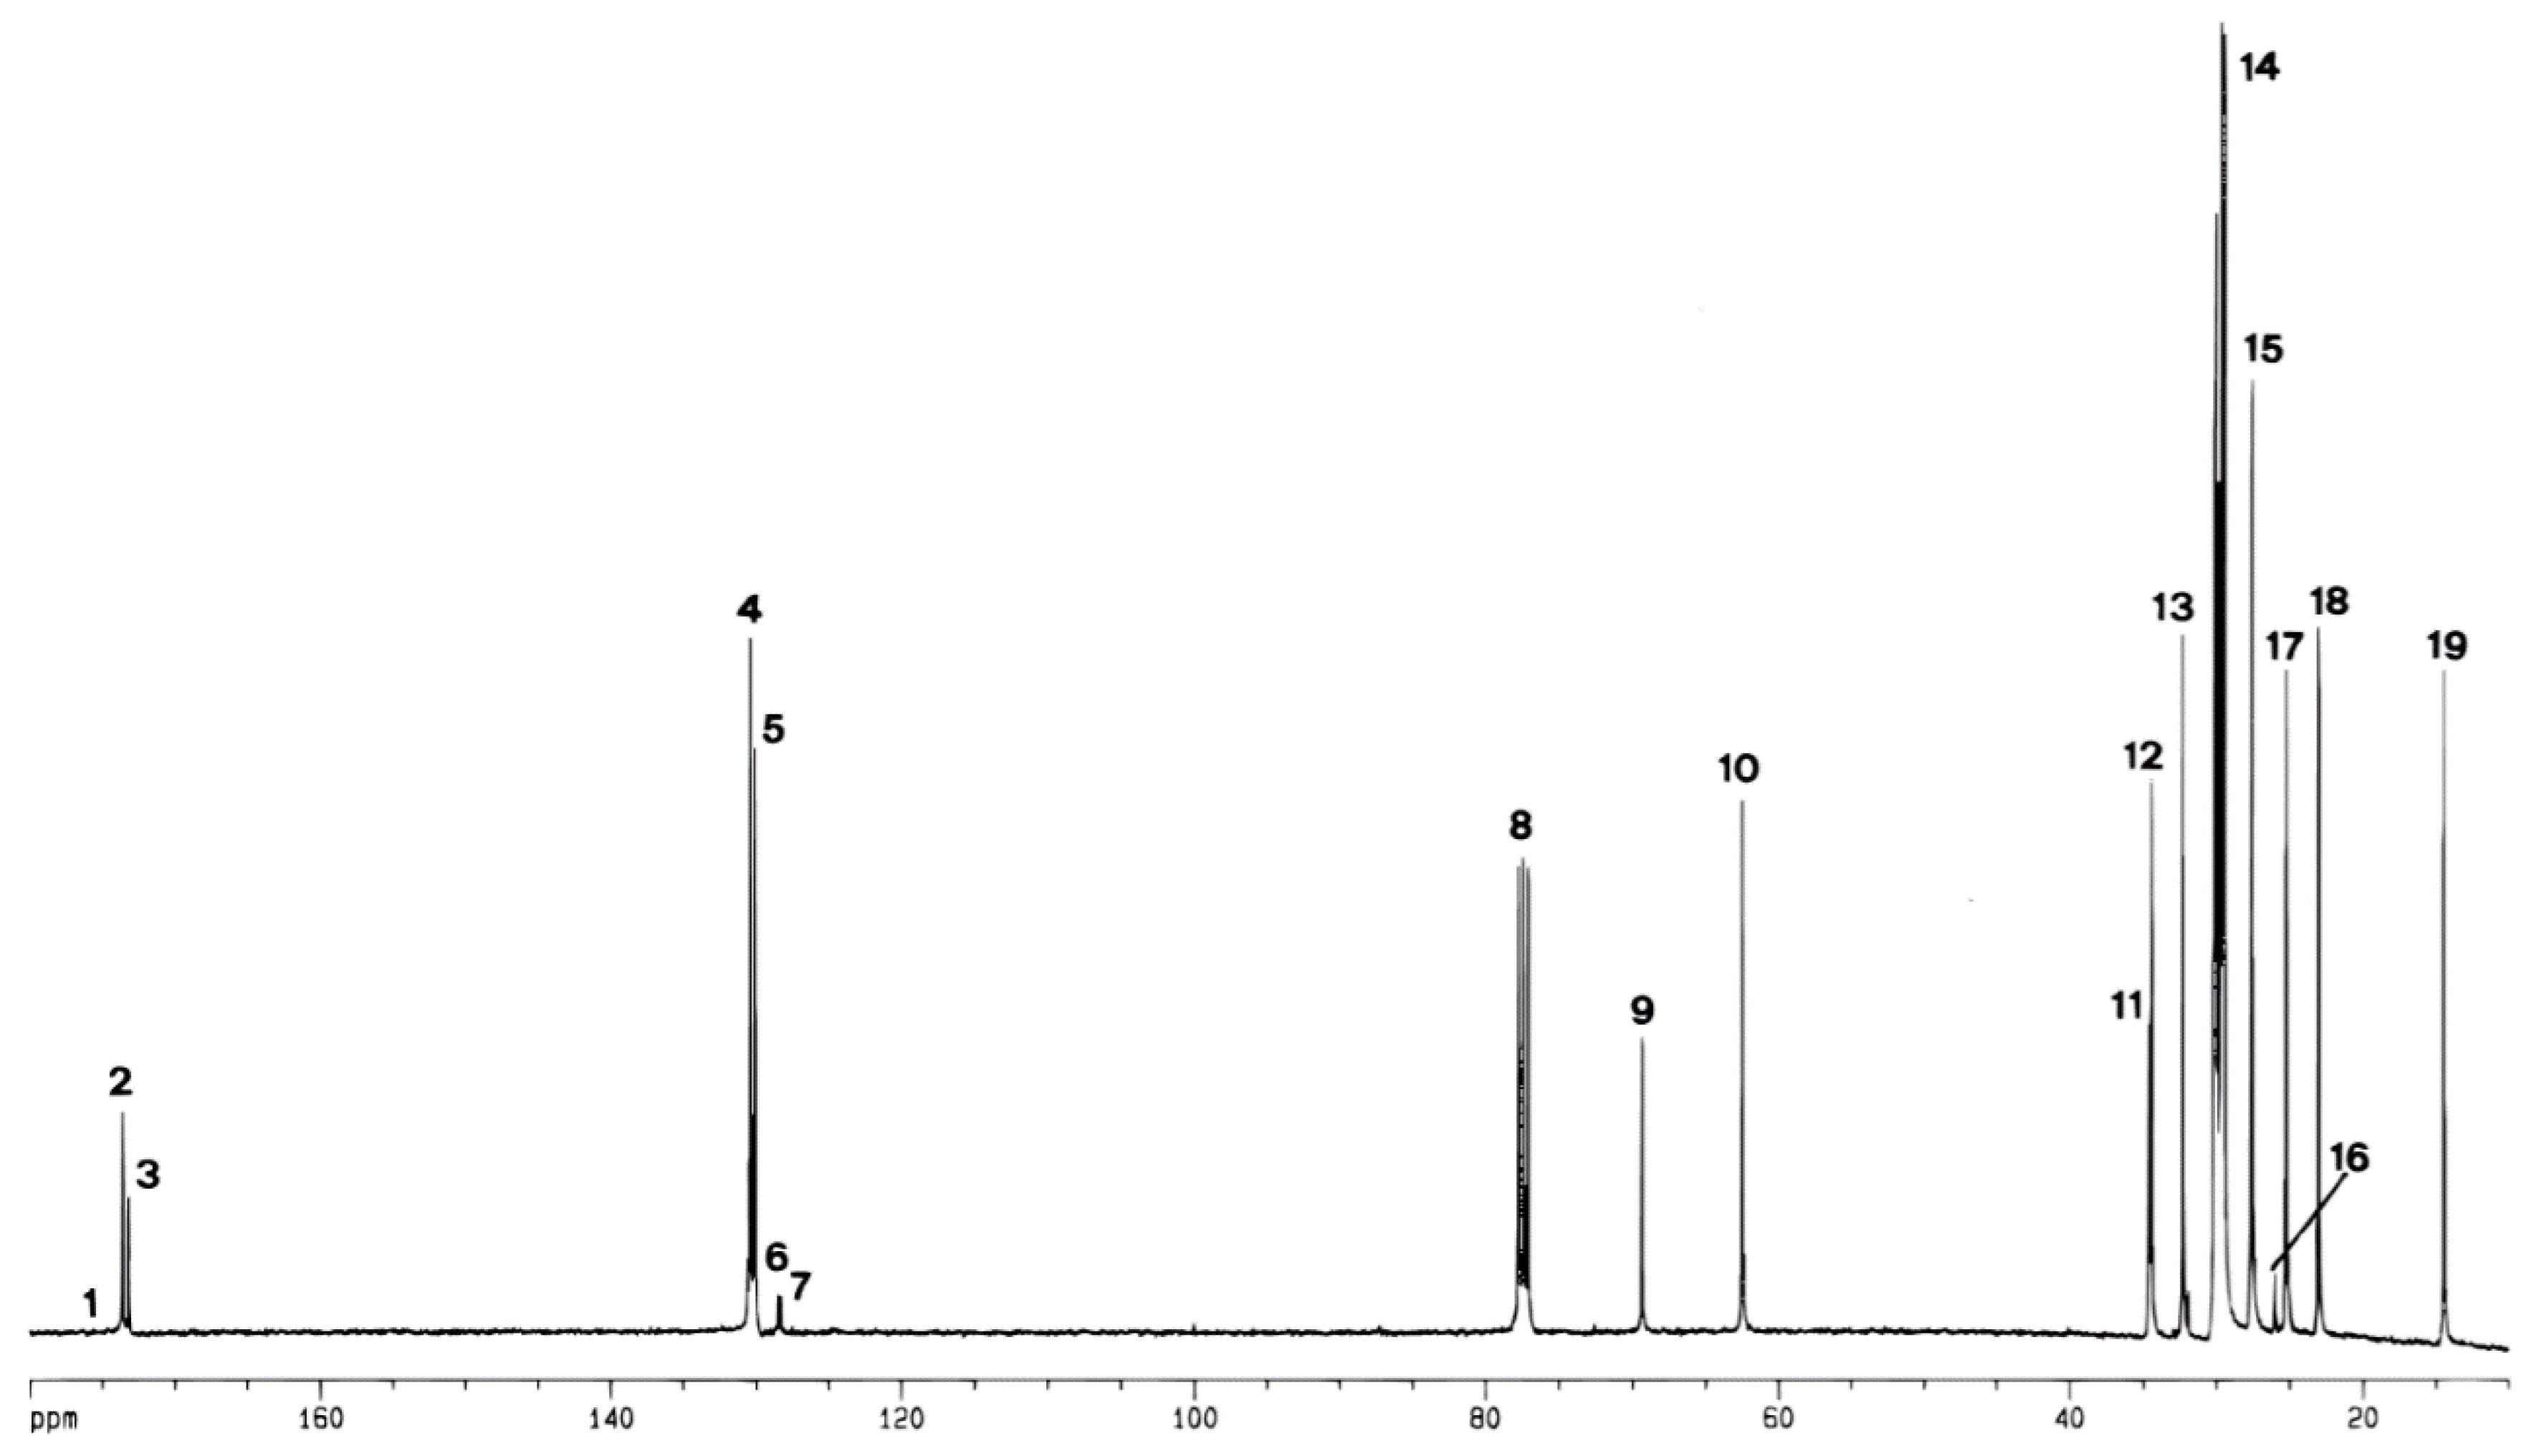
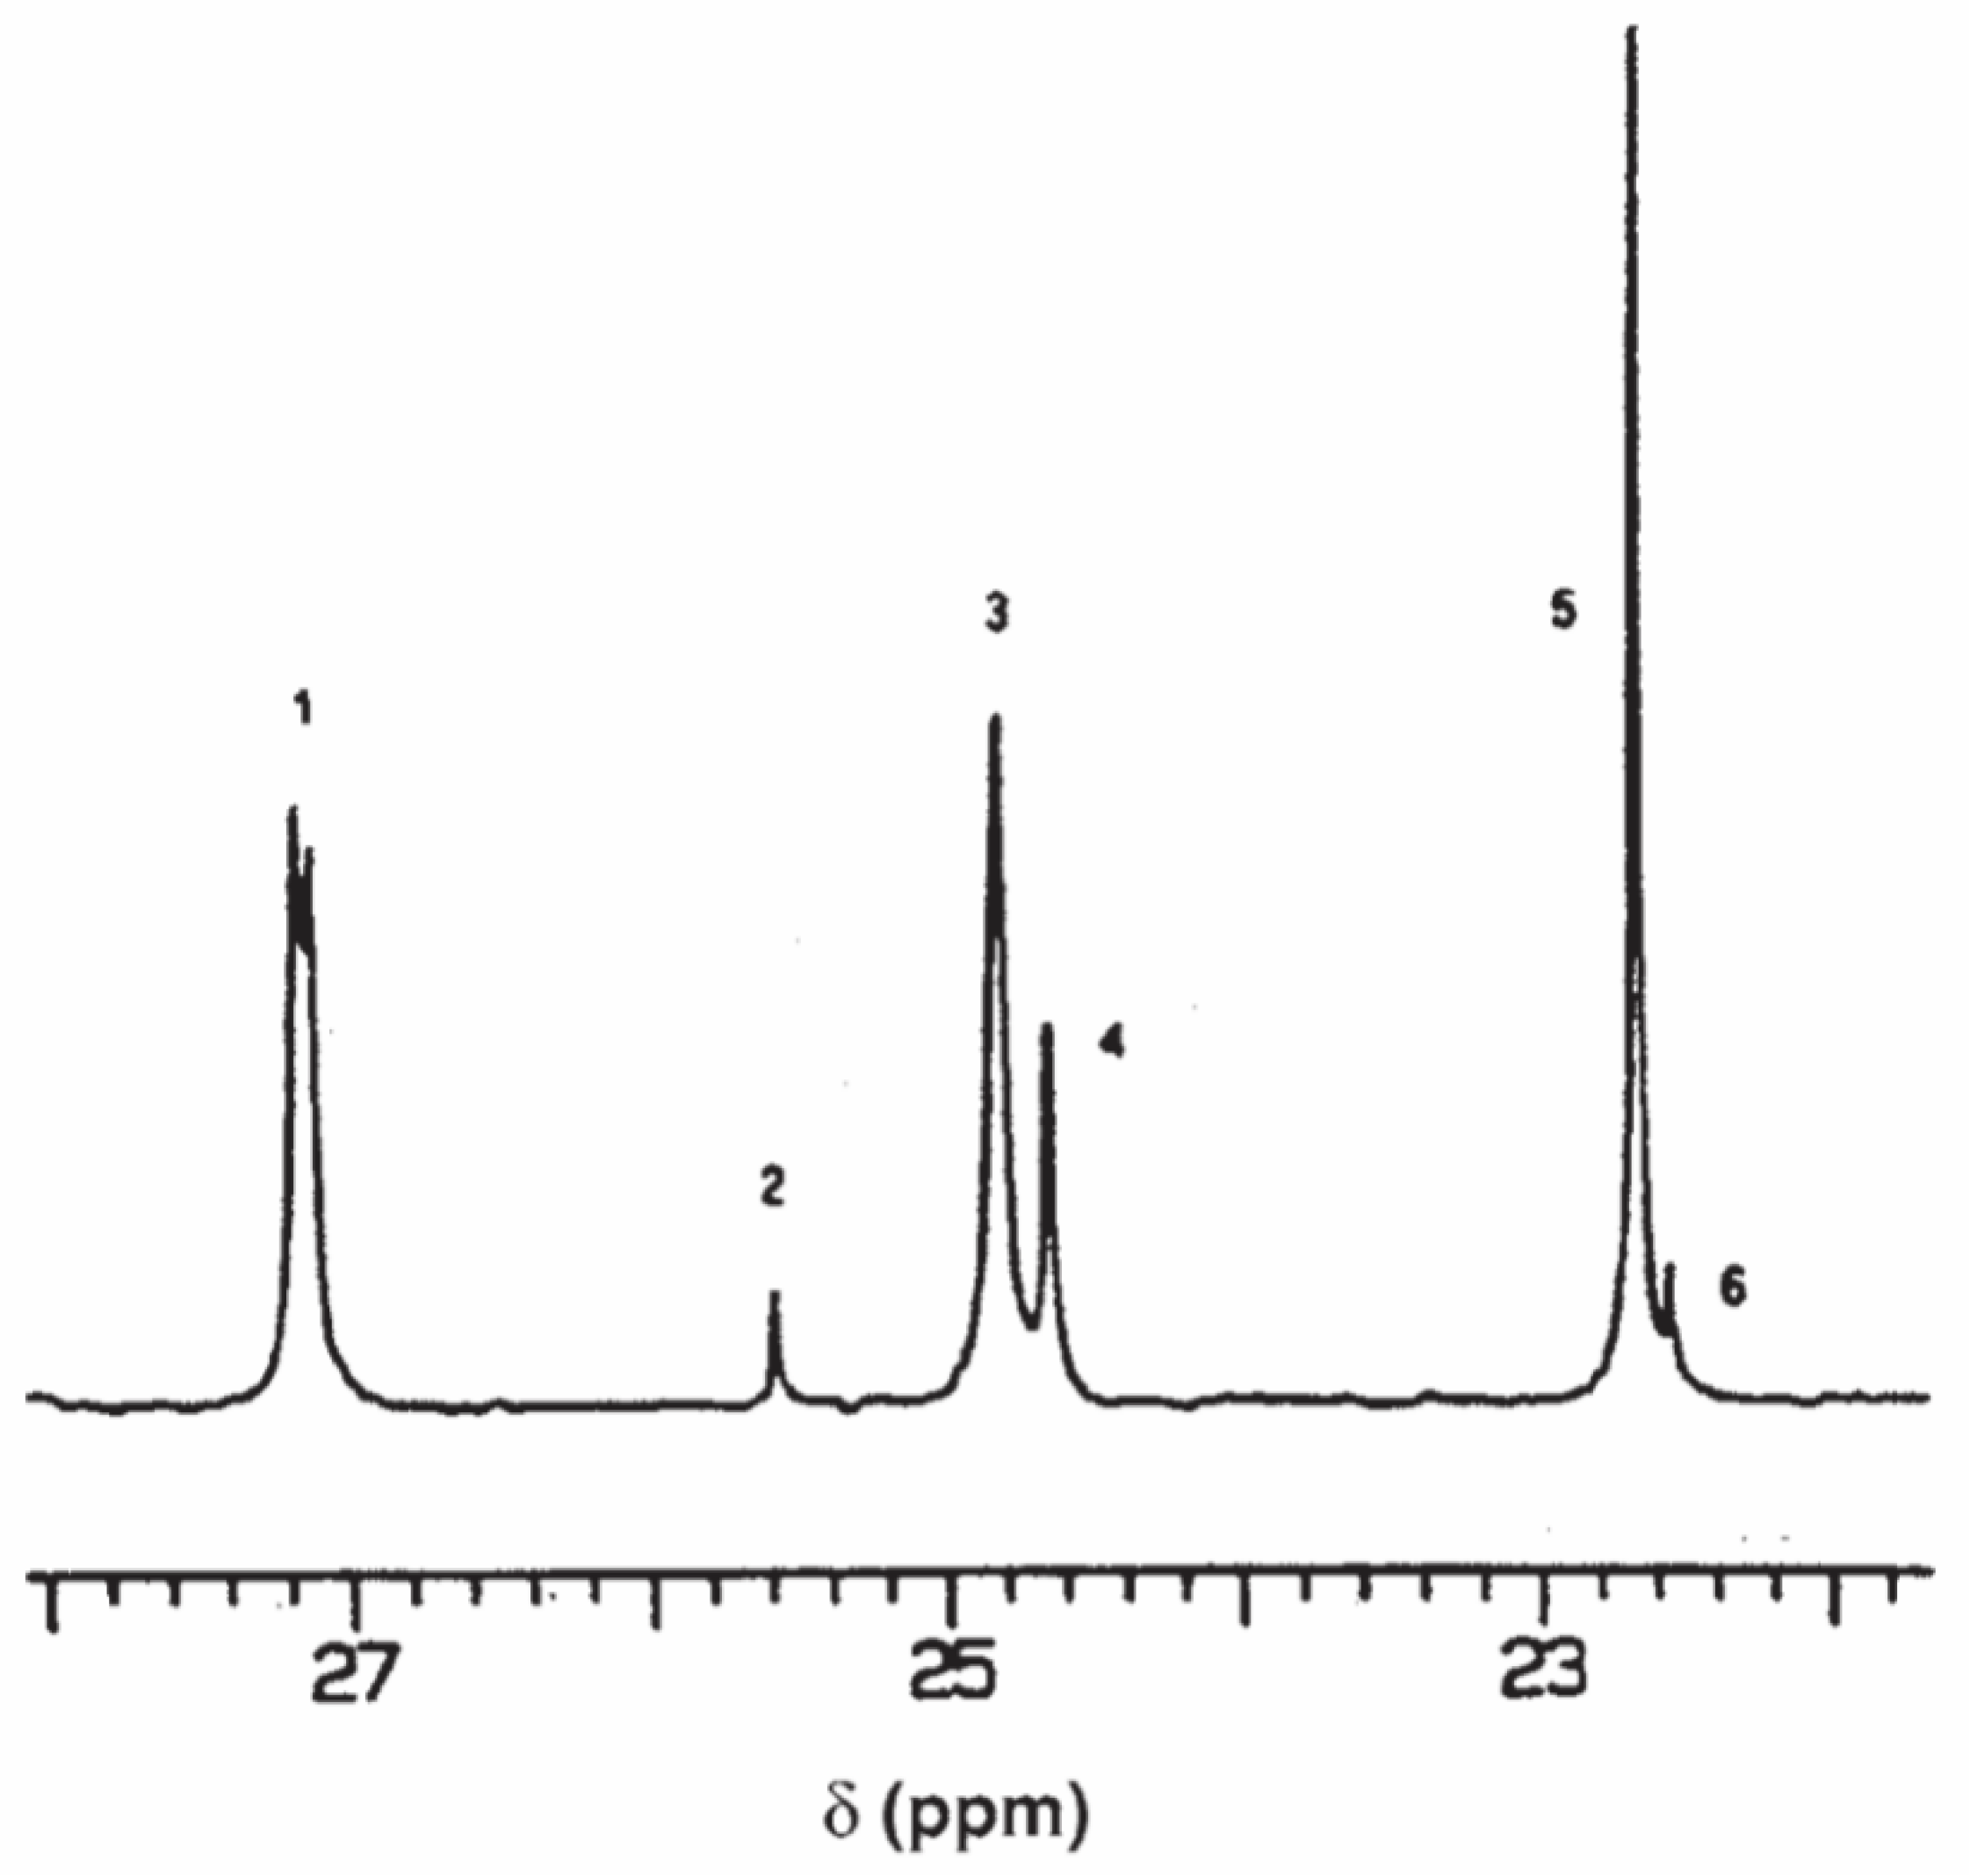
2.2. 13C NMR
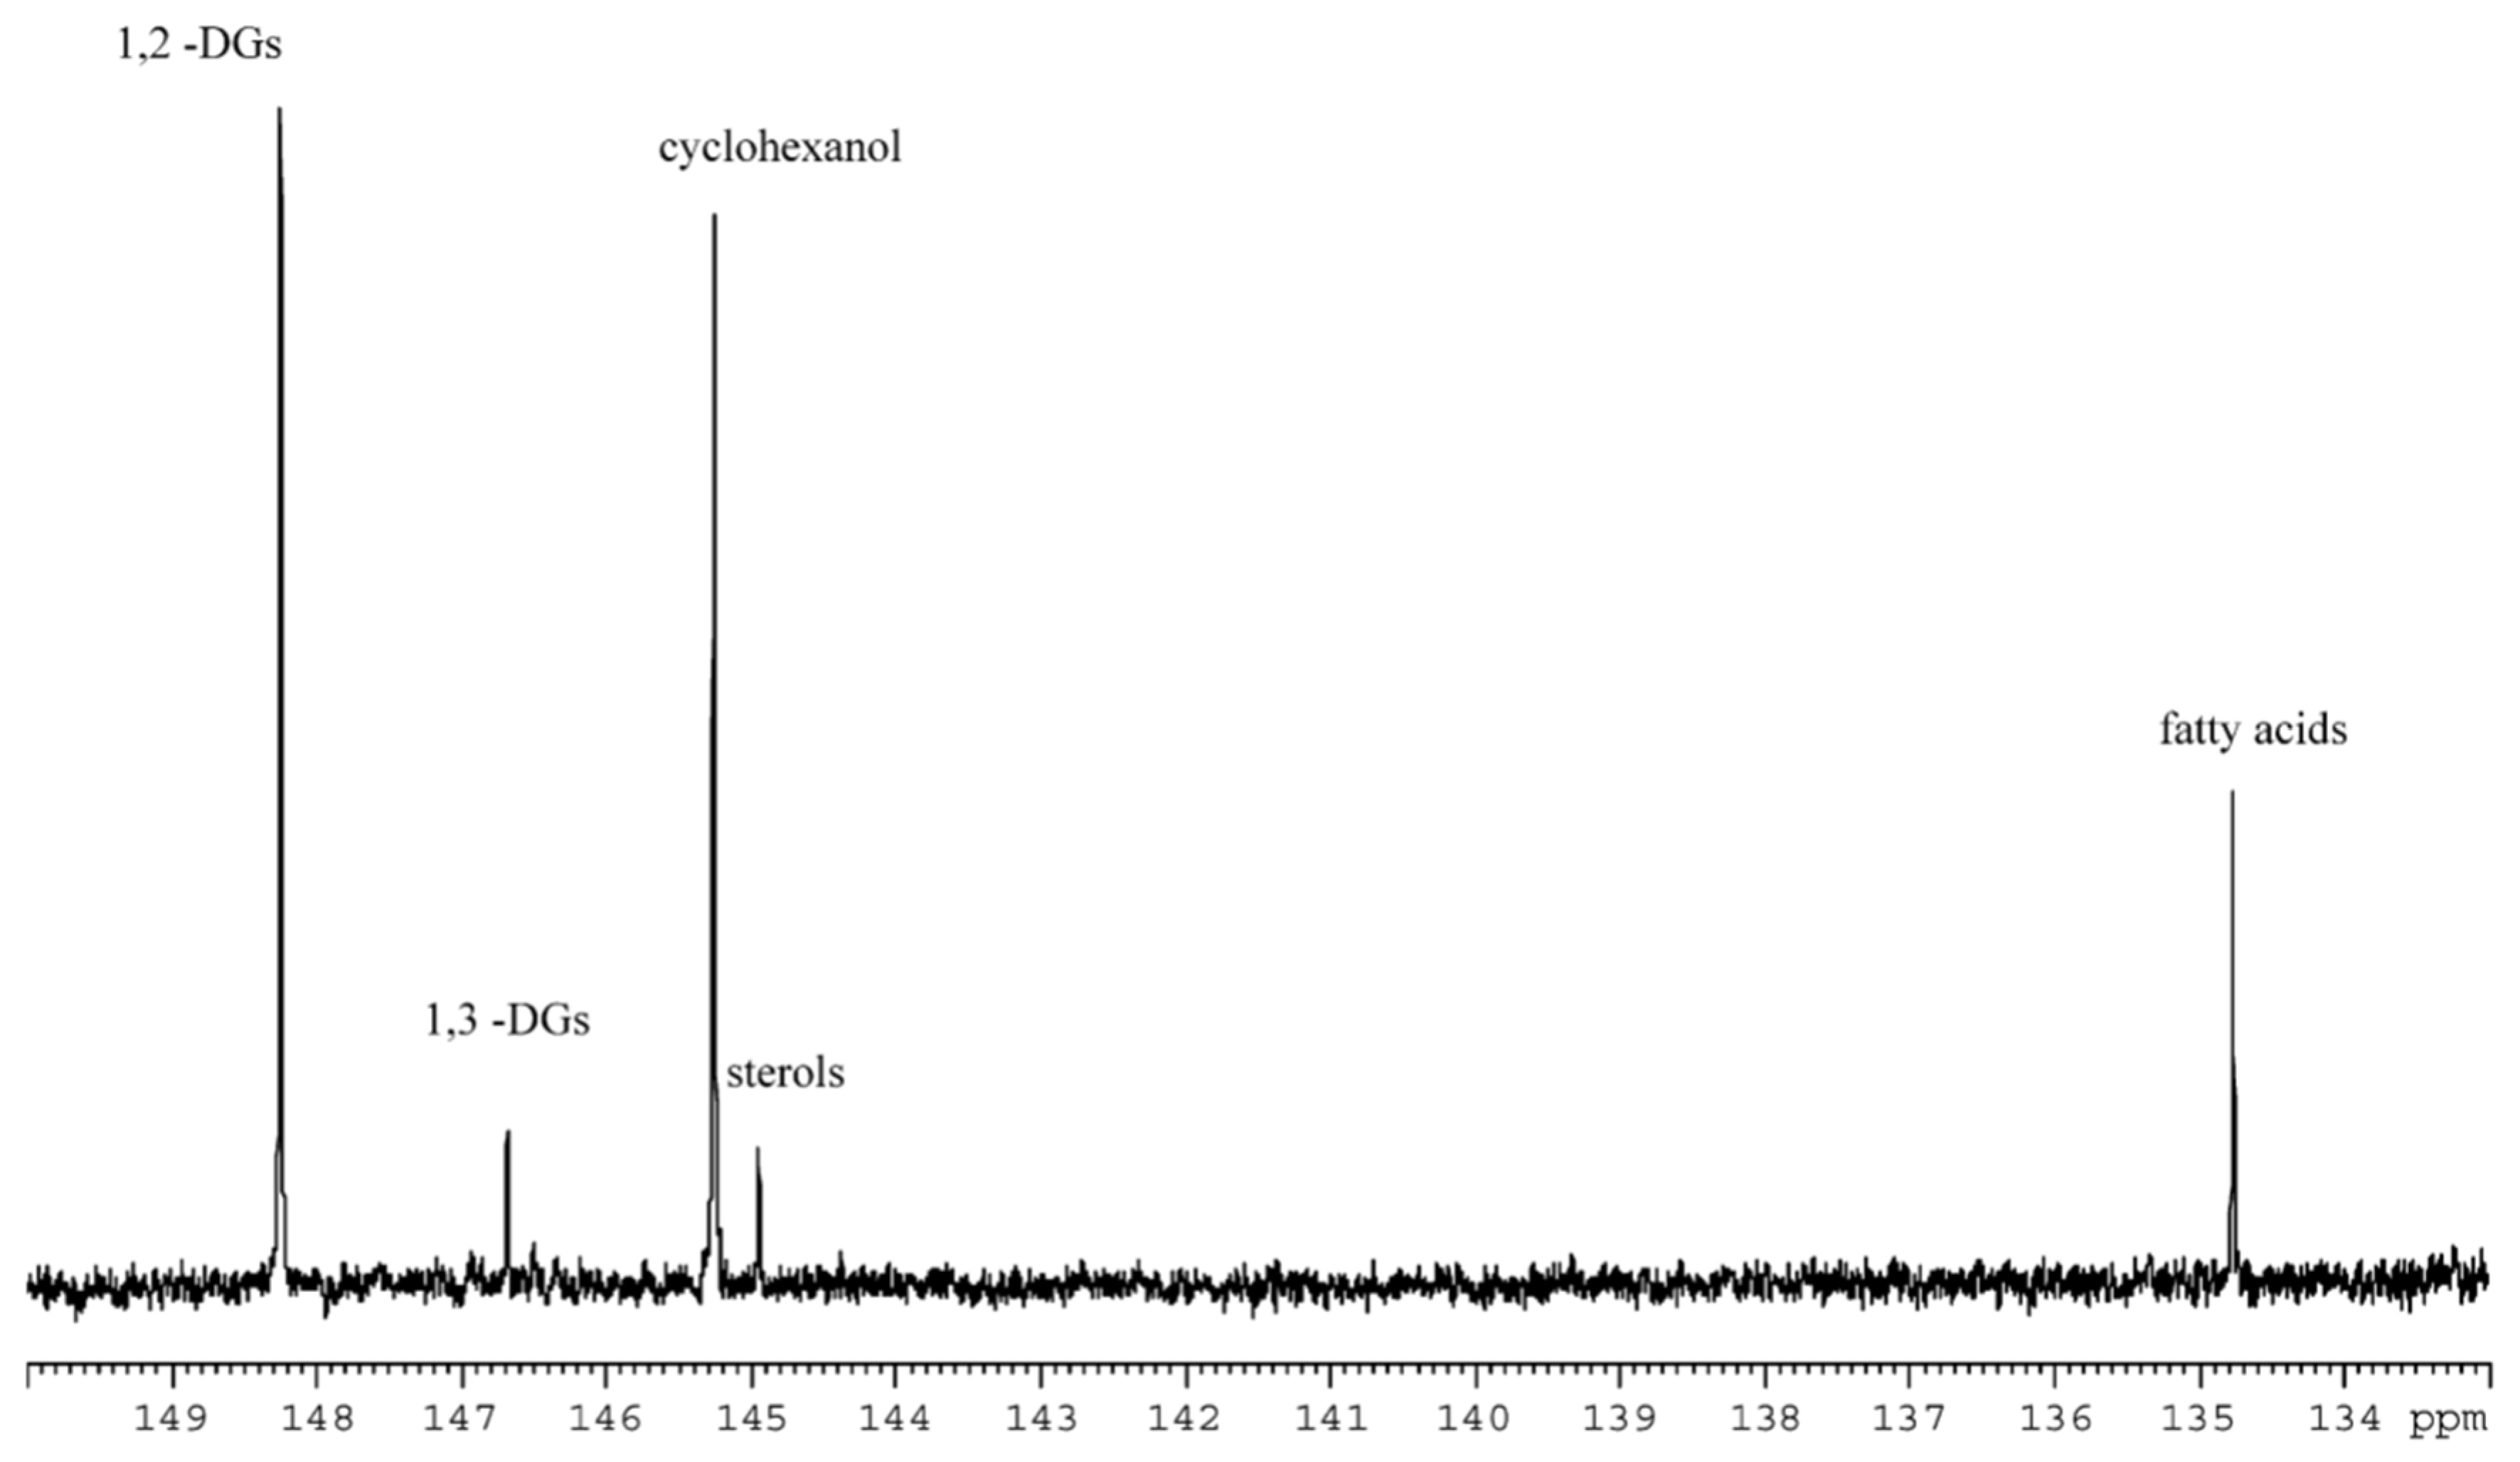
2.3. 31P NMR
3. Conclusions
Author Contributions
Funding
Acknowledgments
Conflicts of Interest
References
- Skiera, C.; Steliopoulos, P.; Kuballa, T.; Diehl, B.; Holzgrabe, U. Determination of free fatty acids in pharmaceutical lipids by 1H NMR and comparison with the classical acid value. J. Pharm. Biomed. Anal. 2014, 93, 43–50. [Google Scholar] [CrossRef] [PubMed]
- Alexandri, E.; Ahmed, R.; Siddiqui, H.; Choudhary, M.I.; Tsiafoulis, C.G.; Gerothanassis, I.P. High resolution NMR spectroscopy as a structural and analytical tool for unsaturated lipids in solution. Molecules 2017, 22, 1663. [Google Scholar] [CrossRef] [PubMed]
- Skiera, C.; Steliopoulos, P.; Kuballa, T.; Holzgrabe, U.; Diehl, B. Determination of free fatty acids in edible oils by 1H NMR spectroscopy. Lipid Technol. 2012, 24, 279–281. [Google Scholar] [CrossRef]
- Dayrit, F.M.; Buenafe, O.E.M.; Chainani, E.T.; De Vera, I.M.S. Analysis of monoglycerides, diglycerides, sterols, and free fatty acids in coconut (Cocos nucifera L) oil by 31P NMR spectroscopy. J. Agric. Food Chem. 2008, 56, 5765–5769. [Google Scholar] [CrossRef] [PubMed]
- Banani, R.; Youssef, S.; Bezzarga, M.; Abderrabba, M. Waste frying oil with high levels of free fatty acids as one of the prominent sources of biodiesel production. J. Mater. Environ. Sci. 2015, 6, 1178–1185. [Google Scholar]
- Mannu, A.; Ferro, M.; Di Pietro, M.E.; Mele, A. Innovative applications of waste cooking oil as raw material. Sci. Prog. 2019, 102, 153–160. [Google Scholar] [CrossRef]
- Mannu, A.; Vlahopoulou, G.; Sireus, V.; Petretto, G.L.; Mulas, G.; Garroni, S. Bentonite as a refining agent in waste cooking oils recycling: Flash point, density and color evaluation. Nat. Prod. Commun. 2018, 13, 613–616. [Google Scholar] [CrossRef] [Green Version]
- Bautista, L.F.; Vicente, G.; Rodríguez, R.; Pacheco, M. Optimisation of FAME production from waste cooking oil for biodiesel use. Biomass Bioenergy 2009, 33, 862–872. [Google Scholar] [CrossRef]
- Bockisch, M. (Ed.) Fats and Oils Handbook; AOCS Press: Urbana, IL, USA, 1998; ISBN 9780981893600. [Google Scholar]
- Lanser, A.C.; List, G.R.; Holloway, R.K.; Mounts, T.L. FTIR estimation of free fatty acid content in crude oils extracted from damaged soybeans. J. Am. Oil Chem. Soc. 1991, 68, 448–449. [Google Scholar] [CrossRef]
- Li, G.; You, J.; Suo, Y.; Song, C.; Sun, Z.; Xia, L.; Zhao, X.; Shi, J. A developed pre-column derivatization method for the determination of free fatty acids in edible oils by reversed-phase HPLC with fluorescence detection and its application to Lycium barbarum seed oil. Food Chem. 2011, 125, 1365–1372. [Google Scholar] [CrossRef]
- Mahesar, S.A.; Sherazi, S.T.H.; Khaskheli, A.R.; Kandhro, A.A.; Uddin, S. Analytical approaches for the assessment of free fatty acids in oils and fats. Anal. Methods 2014, 6, 4956–4963. [Google Scholar] [CrossRef]
- Mannu, A.; Ferro, M.; Dugoni, G.C.; Panzeri, W.; Petretto, G.L.; Urgeghe, P.; Mele, A. Improving the recycling technology of waste cooking oils: Chemical fingerprint as tool for non-biodiesel application. Waste Manag. 2019, 96, 1–8. [Google Scholar] [CrossRef] [PubMed]
- Mannu, A.; Ferro, M.; Colombo Dugoni, G.; Garroni, S.; Taras, A.; Mele, A. Response Surface Analysis of density and flash point in recycled Waste Cooking Oils. Chem. Data Collect. 2020, 25, 100329. [Google Scholar] [CrossRef]
- Vlahopoulou, G.; Petretto, G.L.; Garroni, S.; Piga, C.; Mannu, A. Variation of density and flash point in acid degummed waste cooking oil. J. Food Process. Preserv. 2018, 42, 1–6. [Google Scholar] [CrossRef]
- Mannu, A.; Vlahopoulou, G.; Urgeghe, P.; Ferro, M.; Del Caro, A.; Taras, A.; Garroni, S.; Rourke, J.P.; Cabizza, R.; Petretto, G.L. Variation of the chemical composition ofwaste cooking oils upon bentonite filtration. Resources 2019, 8, 108. [Google Scholar] [CrossRef] [Green Version]
- Berezin, O.Y.; Tur’yan, Y.I.; Kuselman, I.; Shenhar, A. Alternative methods for titratable acidity determination. Talanta 1995, 42, 507–517. [Google Scholar] [CrossRef]
- Tur’yan, Y.I.; Berezin, O.Y.; Kuselman, I.; Shenhar, A. pH-metric determination of acid values in vegetable oils without titration. J. Am. Oil Chem. Soc. 1996, 73, 295–301. [Google Scholar] [CrossRef]
- Lau, H.L.N.; Puah, C.W.; Choo, Y.M.; Ma, A.N.; Chuah, C.H. Simultaneous quantification of free fatty acids, free sterols, squalene, and acylglycerol molecular species in palm oil by high-temperature gas chromatography-flame ionization detection. Lipids 2005, 40, 523–528. [Google Scholar]
- Wan, P.J.; Dowd, M.K.; Thomas, A.E.; Butler, B.H. Trimethylsilyl derivatization/gas chromatography as a method to determine the free fatty acid content of vegetable oils. J. Am. Oil Chem. Soc. 2007, 84, 701–708. [Google Scholar] [CrossRef]
- Kanya, T.C.S.; Rao, L.J.; Sastry, M.C.S. Characterization of wax esters, free fatty alcohols and free fatty acids of crude wax from sunflower seed oil refineries. Food Chem. 2007, 101, 1552–1557. [Google Scholar] [CrossRef]
- Bazina, N.; He, J. Analysis of fatty acid profiles of free fatty acids generated in deep-frying process. J. Food Sci. Technol. 2018, 55, 3085–3092. [Google Scholar] [CrossRef]
- Tarvainen, M.; Suomela, J.P.; Kallio, H. Ultra high performance liquid chromatography-mass spectrometric analysis of oxidized free fatty acids and acylglycerols. Eur. J. Lipid Sci. Technol. 2011, 113, 409–422. [Google Scholar] [CrossRef]
- Yu, X.; Van De Voort, F.R.; Sedman, J.; Gao, J.M. A new direct Fourier transform infrared analysis of free fatty acids in edible oils using spectral reconstitution. Anal. Bioanal. Chem. 2011, 401, 315–324. [Google Scholar] [CrossRef] [PubMed]
- Che Man, Y.B.; Setiowaty, G. Application of Fourier transform infrared spectroscopy to determine free fatty acid contents in palm olein. Food Chem. 1999, 66, 109–114. [Google Scholar] [CrossRef]
- Moschner, C.R.; Biskupek-Korell, B. Estimating the content of free fatty acids in high-oleic sunflower seeds by near-infrared spectroscopy. Eur. J. Lipid Sci. Technol. 2006, 108, 606–613. [Google Scholar] [CrossRef]
- Gerde, J.A.; Hardy, C.L.; Hurburgh, C.R.; White, P.J. Rapid determination of degradation in frying oils with near-infrared spectroscopy. J. Am. Oil Chem. Soc. 2007, 84, 519–522. [Google Scholar] [CrossRef]
- Novak, M. Colorimetric Ultramicro Method for the Determination of Free Fatty Acids. J. Lipid Res. 1965, 6, 431–433. [Google Scholar]
- Gyrik, M.; Ajtony, Z.; Dóka, O.; Alebic-Juretić, A.; Bicanic, D.; Koudijs, A. Determination of free fatty acids in cooking oil: Traditional spectrophotometry and optothermal window assay. Instrum. Sci. Technol. 2006, 34, 119–128. [Google Scholar] [CrossRef]
- Lowry, R.R.; Tinsley, I.J. Rapid Colorimetric Determination of Free Fatty Acids. J. Am. Oil Chem. Soc. 1976, 53, 470–472. [Google Scholar] [CrossRef]
- Mariotti, E.; Mascini, M. Determination of extra virgin olive oil acidity by FIA-titration. Food Chem. 2001, 73, 235–238. [Google Scholar] [CrossRef]
- Saad, B.; Ling, C.W.; Jab, M.S.; Lim, B.P.; Mohamad Ali, A.S.; Wai, W.T.; Saleh, M.I. Determination of free fatty acids in palm oil samples using non-aqueous flow injection titrimetric method. Food Chem. 2007, 102, 1407–1414. [Google Scholar] [CrossRef]
- Zhi, Z.L.; Ríos, A.; Valcárcel, M. An automated flow-reversal injection/liquid-liquid extraction approach to the direct determination of total free fatty acids in olive oils. Anal. Chim. Acta 1996, 318, 187–194. [Google Scholar] [CrossRef]
- Lankhorst, P.P.; Chang, A.N. The Application of NMR in Compositional and Quantitative Analysis of Oils and Lipids. In Modern Magnetic Resonance; Webb, G.A., Ed.; Springer International Publishing AG: Cham, Switzerland, 2018; pp. 1743–1764. ISBN 9783319283883. [Google Scholar]
- Diehl, B.W.K. Multinuclear high-resolution nuclear magnetic resonance spectroscopy. In Lipid Analysis in Oils and Fats; Hamilton, R.J., Ed.; Blackie Academic & Professional, Thomson Science: London, UK, 1997; pp. 87–135. ISBN 9788578110796. [Google Scholar]
- Lie Ken Jie, M.S.F.; Mustafa, J. High-resolution nuclear magnetic resonance spectroscopy—Applications to fatty acids and triacylglycerols. Lipids 1997, 32, 1019–1034. [Google Scholar] [CrossRef] [PubMed]
- Gunstone, F.D. High Resolution 13C NMR. A Technique for the Study of Lipid Structure and Composition. Progr. Lipid Res. 1994, 33, 19–28. [Google Scholar] [CrossRef]
- Gunstone, F.D.; Shukla, V.K.S. NMR of lipids. Annu. Rep. NMR Spectrosc. 1995, 31, 219–237. [Google Scholar]
- Miyake, Y.; Yokomizo, K.; Matsuzaki, N. Rapid Determination of Iodine Value by 1H Nuclear Magnetic Resonance Spectroscopy. J. Am. Oil Chem. Soc. 1998, 75, 15–19. [Google Scholar] [CrossRef]
- Guillén, M.D.; Ruiz, A. Rapid simultaneous determination by proton NMR of unsaturation and composition of acyl groups in vegetable oils. Eur. J. Lipid Sci. Technol. 2003, 105, 688–696. [Google Scholar] [CrossRef]
- Dais, P.; Spyros, A.; Christophoridou, S.; Hatzakis, E.; Fragaki, G.; Agiomyrgianaki, A.; Salivaras, E.; Siragakis, G.; Daskalaki, D.; Tasioula-Margari, M.; et al. Comparison of analytical methodologies based on 1H and 31P NMR spectroscopy with conventional methods of analysis for the determination of some olive oil constituents. J. Agric. Food Chem. 2007, 55, 577–584. [Google Scholar] [CrossRef]
- Fauhl, C.; Reniero, F.; Guillou, C. 1H NMR as a tool for the analysis of mixtures of virgin olive oil with oils of different botanical origin. Magn. Reson. Chem. 2000, 38, 436–443. [Google Scholar] [CrossRef]
- Guillén, M.D.; Ruiz, A. High resolution 1H nuclear magnetic resonance in the study of edible oils and fats. Trends Food Sci. Technol. 2001, 12, 328–338. [Google Scholar] [CrossRef]
- The Human Metabolome Database. Available online: https://hmdb.ca/. (accessed on 27 March 2020).
- Wishart, D.S.; Feunang, Y.D.; Marcu, A.; Guo, A.C.; Liang, K.; Vázquez-Fresno, R.; Sajed, T.; Johnson, D.; Li, C.; Karu, N.; et al. HMDB 4.0: The human metabolome database for 2018. Nucleic Acids Res. 2018, 46, D608–D617. [Google Scholar] [CrossRef] [PubMed]
- Satyarthi, J.K.; Srinivas, D.; Ratnasamy, P. Estimation of free fatty acid content in oils, fats, and biodiesel by 1H NMR spectroscopy. Energy Fuels 2009, 23, 2273–2277. [Google Scholar] [CrossRef]
- Kumar, R.; Bansal, V. Estimation of Glycerides and Free Fatty Acid in Oils Extracted From Various Seeds from the Indian Region by NMR Spectroscopy. J. Am. Oil Chem. Soc. 2011, 88, 1675–1685. [Google Scholar] [CrossRef]
- Annarao, S.; Sidhu, O.P.; Roy, R.; Tuli, R.; Khetrapal, C.L. Lipid profiling of developing Jatropha curcas L. seeds using 1H NMR spectroscopy. Bioresour. Technol. 2008, 99, 9032–9035. [Google Scholar] [CrossRef]
- Nieva-Echevarría, B.; Goicoechea, E.; Manzanos, M.J.; Guillén, M.D. A method based on 1H NMR spectral data useful to evaluate the hydrolysis level in complex lipid mixtures. Food Res. Int. 2014, 66, 379–387. [Google Scholar] [CrossRef] [Green Version]
- Kumar, R.; Das, N. Seed oil of Jatropha curcas L. germplasm: Analysis of oil quality and fatty acid composition. Ind. Crops Prod. 2018, 124, 663–668. [Google Scholar] [CrossRef]
- San Martín, E.; Avenoza, A.; Peregrina, J.M.; Busto, J.H. Solvent-based strategy improves the direct determination of key parameters in edible fats and oils by 1 H NMR. J. Sci. Food Agric. 2020, 100, 1726–1734. [Google Scholar] [CrossRef] [PubMed]
- Sacchi, R.; Addeo, F.; Paolillo, L. 1H and 13C NMR of Virgin Olive Oil. An Overview. Magn. Reson. Chem. 1997, 35, 133–145. [Google Scholar] [CrossRef]
- Ng, S. Quantitative analysis of partial acylglycerols and free fatty acids in palm oil by 13C nuclear magnetic resonance spectroscopy. J. Am. Oil Chem. Soc. 2000, 77, 749–755. [Google Scholar] [CrossRef]
- Sacchi, R.; Medina, J.I.; Aubourg, S.P.; Giudicianni, I.; Paolillo, L.; Addeo, F. Quantitative High-Resolution 13C NMR Analysis of Lipids Extracted from the White Muscle of Atlantic Tuna (Thunnus alalunga). J. Agric. Food Chem. 1993, 41, 1247–1253. [Google Scholar] [CrossRef]
- Scano, P.; Rosa, A.; Marincola, F.C.; Locci, E.; Melis, M.P.; Dess, M.A.; Lai, A. C NMR, GC and HPLC characterization of lipid components of the salted and dried mullet (Mugil cephalus) roe “ bottarga”. Chem. Phys. Lipids 2008, 151, 69–76. [Google Scholar] [CrossRef] [PubMed]
- O’Brien, R.D. Soybean Oil Purification. In Soybeans. Chemistry, Production, Processing, and Utilization; Johnson, L.A., White, P.J., Galloway, R., Eds.; Academic Press: Cambridge, MA, USA; AOCS Press: Urbana, IL, USA, 2008; pp. 377–408. ISBN 978-1-893997-64-6. [Google Scholar]
- Spyros, A.; Dais, P. Application of 31P NMR spectroscopy in food analysis. 1. Quantitative determination of the mono- and diglyceride composition of olive oils. J. Agric. Food Chem. 2000, 48, 802–805. [Google Scholar] [CrossRef] [PubMed]
- Fronimaki, P.; Spyros, A.; Christophoridou, S.; Dais, P. Determination of the diglyceride content in Greek virgin olive oils and some commercial olive oils by employing 31P NMR spectroscopy. J. Agric. Food Chem. 2002, 50, 2207–2213. [Google Scholar] [CrossRef] [PubMed]
- Vigli, G.; Philippidis, A.; Spyros, A.; Dais, P. Classification of edible oils by employing 31P and 1H NMR spectroscopy in combination with multivariate statistical analysis. A proposal for the detection of seed oil adulteration in virgin olive oils. J. Agric. Food Chem. 2003, 51, 5715–5722. [Google Scholar] [CrossRef]
- Christophoridou, S.; Dais, P. Novel approach to the detection and quantification of phenolic compounds in olive oil based on 31P nuclear magnetic resonance spectroscopy. J. Agric. Food Chem. 2006, 54, 656–664. [Google Scholar] [CrossRef]
- Christophoridou, S.; Spyros, A.; Dais, P. 31P nuclear magnetic resonance spectroscopy of polyphenol-containing olive oil model compounds. Phosphorus Sulfur Silicon Relat. Elem. 2001, 170, 139–157. [Google Scholar] [CrossRef]
- Lucas-Torres, C.; Pérez, Á.; Cabañas, B.; Moreno, A. Study by 31 P NMR spectroscopy of the triacylglycerol degradation processes in olive oil with different heat-transfer mechanisms. Food Chem. 2014, 165, 21–28. [Google Scholar] [CrossRef]


| Proton Signal | Palmitic Acid (16:0) | Stearic Acid (18:0) | Oleic Acid (18:1 Δ9) | Linoleic Acid (18:2 Δ9,12) | α-Linolenic Acid (18:3 Δ9,12,15) |
|---|---|---|---|---|---|
| =CH- | 5.36 (H9, H10) | 5.37 (H9, H10, H12, H13) | 5.36 (H9, H10, H12, H13, H15, H16) | ||
| =CH-CH2-CH= | 2.78 (H11) | 2.80 (H11, H14) | |||
| -CH2COOH | 2.36 (H2) | 2.35 (H2) | 2.36 (H2) | 2.36 (H2) | 2.35 (H2) |
| =CH-CH2- | 2.03 (H8, H11) | 2.06 (H8, H14) | 2.04 (H8, H17) | ||
| -CH2CH2COOH | 1.64 (H3) | 1.63 (H3) | 1.64 (H3) | 1.64 (H3) | 1.61 (H3) |
| -CH2- | 1.24 (H4–H15) | 1.25 (H4–H17) | 1.30 (H4–H7, H12–H17) | 1.35 (H4–H7, H15–H17) | 1.31 (H4–H7) |
| -CH3 | 0.89 (H16) | 0.88 (H18) | 0.89 (H18) | 0.90 (H18) | 0.98 (H18) |
| Carbon Signal | Palmitic Acid (16:0) | Stearic Acid (18:0) | Oleic Acid (18:1 Δ9) | Linoleic Acid (18:2 Δ9,12) | α-Linolenic Acid (18:3 Δ9,12,15) |
|---|---|---|---|---|---|
| -COOH | 182.62 (C1) | 182.78 (C1) | 180.50 (C1) | 180.16 (C1) | 180.10 (C1) |
| =CH- | 130 (C9, C10) | 128-130 (C9, C10, C12, C13) | 127-131 (C9, C10, C12, C13, C15, C16) | ||
| -CH2COOH | 36.68 (C2) | 36.70 (C2) | 33.96 (C2) | 34.01 (C2) | 33.95 (C2) |
| -CH2- | 32-34 (C4-C14) | 29-32 (C4-C16) | 29-31 (C4-C7, C12-C16) | 29-31 (C4-C7, C15-C16) | 29 (C4-C7) |
| =CH-CH2- | 27.12 (C8, C11) | 27.25 (C8, C14) | 27.22 (C8) | ||
| =CH-CH2-CH= | 25.65 (C11) | 25-26 (C11, C14) | |||
| -CH2CH2COOH | 27.33 (C3) | 27.33 (C3) | 24.59 (C3) | 24.70 (C3) | 24.56 (C3) |
| -CH2CH3 | 25.36 (C15) | 25.36 (C17) | 22.52 (C17) | 22.54 (C17) | 20.58 (C17) |
| -CH3 | 16.78 (C16) | 16.79 (C18) | 14.07 (C18) | 14.06 (C18) | 14.27 (C18) |
© 2020 by the authors. Licensee MDPI, Basel, Switzerland. This article is an open access article distributed under the terms and conditions of the Creative Commons Attribution (CC BY) license (http://creativecommons.org/licenses/by/4.0/).
Share and Cite
Di Pietro, M.E.; Mannu, A.; Mele, A. NMR Determination of Free Fatty Acids in Vegetable Oils. Processes 2020, 8, 410. https://doi.org/10.3390/pr8040410
Di Pietro ME, Mannu A, Mele A. NMR Determination of Free Fatty Acids in Vegetable Oils. Processes. 2020; 8(4):410. https://doi.org/10.3390/pr8040410
Chicago/Turabian StyleDi Pietro, Maria Enrica, Alberto Mannu, and Andrea Mele. 2020. "NMR Determination of Free Fatty Acids in Vegetable Oils" Processes 8, no. 4: 410. https://doi.org/10.3390/pr8040410