Article

A Simple Approach for Determining the Maximum Sorption Capacity of Chlorpropham from Aqueous Solution onto Granular Activated Charcoal

by
Bandar R. M. Alsehli
Department of Chemistry, Faculty of Science, Taibah University, Al-Madinah Al-Munawarah 30002, Saudi Arabia
Processes 2020, 8(4), 398; https://doi.org/10.3390/pr8040398
Submission received: 6 February 2020 / Revised: 19 March 2020 / Accepted: 25 March 2020 / Published: 29 March 2020
(This article belongs to the Special Issue Screening of Bioactive Compounds from Food Processing Waste)

Abstract

:
UV-Vis spectrophotometer was used to determine chlorpropham (CIPC) concentration in aqueous solution. The method was validated in term of linearity, precision and limit of detection and limit of quantitation. The correlation coefficient of standards calibration curve of (1.0–10.0 µg/mL CIPC) was R2 = 1 with a precision (RSD%, n=10) ranged from (0.87–0.53%). The limit of detection (LOD) and limit of quantitation (LOQ) based on the regression statistics of the calibration curve data of (1.0–10.0 µg/mL CIPC) were 0.04 µg/mL and 0.11 µg/mL respectively. The activated carbon adsorbent was found to be effective for the removal approximately 80% of CIPC from aqueous solution. Several isotherm models (Langmuir, Freundlich, Tempkin and Dubinin–Radushkevich) were evaluated. The maximum monolayer sorption capacity (Qm) from the Langmuir isotherm model was determined to be (44316.92 µg/g). The separation factor (RL) is 0.11 which indicates a favorable equilibrium sorption with the R2 value of 0.99, indicating that the Langmuir isotherm model fit the experimental sorption data well.

1. Introduction

Potatoes are an important food crop for people, with almost every country in the world considering them to be a staple food [1]. The annual production of potatoes is estimated to be 375 million tons [2]. Given the importance of the crop in most diets, high production of potatoes is justified. Therefore, storage is an essential post-harvest activity that must be undertaken by farmers in case the crop cannot be immediately availed to prospective markets. According to [3], storage of potatoes is associated with various challenges such as sprouting and accumulation of sugars. Consequently, there is a need to store the tubers under specific conditions to reduce loss. While the produce is mostly stored at 8–12 °C (85%–90% RH) temperatures around the world, such conditions favor sprouting and sprout growth once the period of natural dormancy is over, hence the need for an effective sprout suppressant [3].
Isopropyl N-(3-chlorophenyl) carbamate (see Figure 1), commonly known as chlorpropham (CIPC), is a widely used chemical for inhibiting the sprouting process in potatoes in most places around the world [4]. CIPC has been in use for over 50 years [3]. The chemical belongs to the group of inhibitors called carbamates which are similar in properties to organochlorine insecticides [5]. Generally, carbamates have been used quite extensively, due to the fact that some weak functional groups may be broken down to less toxic molecules, hence solving problems with persistence in the environment [6]. Chlorpropham is degraded in an aerobic environment (15% to 30% after 100 days) and in water solution (90% after 59–130 days). Chlorpropham has a low toxicity profile with no acute toxicity effects under (1000 mg/kg/day) after exposure. Long-term exposure to the blood can lead to reduced body weight, decreased hemoglobin and hematocrits and increased blood reticulocyte at high doses (to 1000 mg/kg/day) [4,7,8,9].
While the effectiveness of CIPC in sprout suppression is highlighted in various studies including [4,5,10], there is a growing concern regarding the safety linked to long term use. Some researchers [3] identify maximum residual time and daily intake as some of the key issues that involve discussions on the use of CIPC currently. Additionally, a study by [11] asserts that the presence of CIPC particles on the potatoes increases the levels of chemical residues on the tubers, and hence, there is a need for an alternative application method that ensures that only small amount of the chemical is used for optimum outcomes. Furthermore, investigators [12] have highlighted that the CIPC residues are not only evident in stored produce, but also in the processed potato products. On the same note, the study by [10] has investigated how cross-contamination of other crops stored in the same room may occur due to residual effects of CIPC [13].
It is worth mentioning that CIPC has been subject to a periodic investigation in Europe since 2015; successive meetings of the Standing Committee on Plants, Animals, Food and Feed (SCoPAFF) and the appeals committee were addressed. After this, authorizations for using chlorpropham (CIPC) both as an herbicide and as a sprout suppressant cannot be renewed on 17 June 2019 by the European Union Health and Food Safety Directorate-General Appeal Committee [14]. The date of withdrawal defined in this regulation was 8 January 2020, and the maximum duration of grace period for use, storage and disposal will expire no later than 8 October 2020. The maximum residue limit (MRL) may be reduced to almost zero within 2 years as the active substance was not renewed, and it will not be allowed to import potato products into Europe with CIPC residues above a limit [15,16]. Despite the fact that CIPC was banned in Europe, it is currently being used in USA and many other developing and third world countries [17].
The problem of cross-contamination still occurs since CIPC is solid at room temperatures, hence implying that continued use leads to the accumulation of the chemical residues that can be found on other crops in the same store. Previous research by [18] highlights that CIPC can contaminate both bulk and box stores since the CIPC fog can infiltrate concrete and other substrates. Other parts of the stores that are contaminated by CIPC include walls, roofs and even the boxes. Findings by [19] highlight negative impacts of cross-contamination by CIPC residues on wheat seeds that exhibit delayed germination, hence a need to control the dissipation of such chemicals in the store environments.
The problem has extended to wastewater and has attracted concern to study the persistent and behavior of the potato sprout suppressant chemicals (particularly, CIPC and its main metabolite 3-chloroaniline (3CA)) in wastewater [4]. Several studies [3,5,20] have been conducted to determine the concentration of CIPC and its main metabolite 3CA in various wastewater specimens gathered from numerous commercial wash effluents at different times. The researchers found that in the barrel of washing samples, CIPC could reach a concentration of 60 mg/L and that the quantity was subject to seasonal variations. In addition, concerns over amounts of 3CA in wastewater are also reported [20]. Washed soil from the potato surface that carries CIPC will likely settle at the base of the washing barrels and cause severe harm [21]. Consequently, the high amount of CIPC presented in potato wastewater requires a certain level of treatment in order to meet the CIPC Environmental Quality Standard of 10 μg/ L [11].
In our previous study [4], the behavior of CIPC and 3CA in soil and water systems was examined, including numerous sorption and microbial degradation experiments. However, activated carbon was not addressed, and as far as we know, no previous published researches have investigated activated carbon’s applicability for removing CIPC from aqueous solutions by applying isotherm models.
Activated carbon is known as a very strong adsorbent to most organic compounds due to its high efficiency and surface capacity. However, as it has a microcrystalline shape, it is not considered an amorphous material. In addition, it has an extended inter-particulate surface area and a highly developed porous structure [22]. Generally, the preparation of activated carbon involves two steps: 1) carbonization of raw material in an inert atmosphere with temperature a round 800 °C; 2) carbonized product’s activation. The final product involves conversion of carbonaceous materials into activated (carbon/charcoal) may differ from one another depending, for example, on the property of the activating agent, raw materials and carbonization processes [23].
During the process of carbonization, the pyrolytic decomposition of the starting material eliminates the majority of non-carbon elements, including nitrogen, oxygen and hydrogen as volatile species. A typical activated carbon contains the following elements: 0.50% N, 0.50% H, 1.0% S, 6–7% O and 88% C [23,24].
The aromatic layers are arranged irregularly, leaving interstices free. These interstices create pores that produce excellent adsorbents for activated carbons. These pores are loaded with the tarry material or decomposed products during carbonization or at least partially blocked by unorganized carbon. During the activation process in the carbonized char the pore structure is enhanced and developed, which transforms carbonized material to a form containing as many randomly spread pores of varying dimensions, resulting in a high and an extremely extended surface area [23].
The char is commonly activated in CO2, air or steam atmosphere at temperatures from 800 °C–900 °C. This causes some regions of the char to be oxidized preferably by others so that a preferential etching occurs as combustion progresses. In this way, a large inner surface can be developed, sometimes up to 2500 m2/g [23,25].
Thus, the objective of this study is to develop and validate a simple and green UV-Vis method used in the analysis of CIPC concentrations in aqueous solution. Then to examine the applicability of activated carbon for removing CIPC from aqueous solutions and to determine its efficiency in term of maximum sorption capacity.

2. Materials and Methods

2.1. Chemicals and Reagents

Chlorpropham (CIPC): ~95% crystalline was obtained from Sigma–Aldrich (13877-25g) Lot # 106H0655V. Activated charcoal granular LR (2.0 mm–5.0 mm) was obtained from (SDFCL lab chemical company in Asia). Methanol for HPLC, ≥ 99.9% obtained from (Sigma-Aldrich, U.K.). Distilled water was used during sample preparation and instrumental measurements.

2.2. Preparation of Stock Solutions and Working Standards

1000 µg/mL CIPC in methanol: 0.10 g of CIPC was placed in 100 mL and completed to the mark with methanol.
10.0–1.0 µg/mL CIPC in aqueous solutions: 10 mL, 8 mL, 6 mL, 3 mL, 1 mL from (100 µg/mL CIPC in methanol) was put individually in a 100 mL volumetric flask and filled to the mark with distilled water. Smaller concentrations were prepared following similar procedures.

2.3. UV-Vis Spectrophotometer Validation

All prepared working standards of CIPC in methanol and aqueous solutions were measured using UV-Vis (Thermo Fisher Scientific, S.N: 5A4S343001). The instrument was standardized and scanned in the UV range from 400–200 nm in order to find the wavelength of maximum absorption (λmax).
CIPC linearity was evaluated using a UV-Vis spectrophotometer at different calibration curve levels. Also, the instrumental precision (RSD %) was determined by measuring each concentration 10 times. Furthermore, limit of detection (LOD) and limit of quantification (LOQ) using different methods were calculated and are described in detail in the results and discussion section.

2.4. Sorption of Prepared CIPC Solutions on Activated Charcoal

2.4.1. Effect of Contact Time

0.10 g activated charcoal was weighed and transferred to a 250 mL conical flask. Then, 50 mL from (10.0 µg/mL CIPC in aqueous solution) was added and the flask was directly positioned on the incubator shaker (model ZWY-100H, Serial number: 433DDA19, CE ISO9001) was used at 25 °C and 120 rpm. After each period (0, 30, 60, 90, 120, 150, 180 min.), the flask was removed and an aliquot was taken, filtered (via a 0.2 um PTFE syringe filter) and then measured by UV-Vis spectrophotometer. The adsorbed amount qe denoted by (µg/g) was plotted against each time.

2.4.2. Sorption Isotherm

0.10 g activated charcoal was weighed and transferred to every 250 mL conical flask. Then, 50 mL from (100.0, 80.0, 60.0, 30.0, 15.0, 10.0 µg/mL CIPC in aqueous solution) was added individually to each flask, and then the flask was directly positioned on the shaker at 25 °C and 120 rpm. After 3 hours of shaking, the flask was removed and an aliquot was taken, filtered (via a 0.2 um PTFE syringe filter) and then measured by UV-Vis spectrophotometer. The adsorbed amount qe denoted by (µg/g) was plotted against the equilibrium concentration (Ce).

2.5. Theory of Sorption

2.5.1. Langmuir Isotherm

The Langmuir isotherm is conventionally used to quantify and compare the performance of various bio-sorbents, originally designed to describe gas–solid-phase sorption on activated carbon. In the formulation of this empirical model, monolayer sorption can be taken with sorption in a limited number of locally identical and equal locations, even at adjoining sites, without lateral interaction and steric interaction between the adsorbed molecules [26]. The model assumes a homogenous sorption and equal sorption activation energy [27]. There are different forms of Langmuir equation which are expressed in the following:
Nonlinear   form :   q e = Q m b C e 1 + b C e
Linear   form :   C e q e = 1 b Q m + C e Q m
whereas qe (µg/g), is the adsorbed amount of adsorbate per unit weigh of adsorbent and Ce (µg/mL) is the un-adsorbed adsorbate concentration in solution after equilibrium. The constant Qm is the saturation capacity for the theoretical monolayer (or the maximum sorption capacity). The constant b (dm3/mg) is the Langmuir isotherm equilibrium constant [28]. A dimensionless constant RL, called the separation factor or equilibrium parameter, which is defined by the following equation, can express the essential characteristic of the Langmuir isotherm:
R L = 1 1 + b C 0
The term C0 is the initial concentration of adsorbate. The shape of the isotherm can be indicated by the value of the RL. It is favorable when (0 < RL< 1), unfavorable (RL > 1), linear (RL= 1), or irreversible (RL = 0).

2.5.2. Freundlich Isotherm

Freundlich isotherm is not limited to a monolayer sorption [29]. It is possible to extend this empiric model to multilayer sorption, where sorption heat and affinities on the heterogeneous surface are likely not to be distributed uniformly [30,31]. In this perspective, the amount adsorbed is the summation of sorption at all sites (each with bond energy), with the stronger binding sites being occupied first, until sorption energy is decreased exponentially upon completion of the sorption process [32]. The Freundlich isotherm is commonly used for the molecular sieves and activated carbon in heterogeneous systems particularly for high-interactive species or organic compounds.
The ranges of slope of (0 to 1) are a sorption intensity measure—or a surface heterogeneity—that becomes more heterogeneous as its value approaches zero. A lower unity value (less than 1) implies chemisorption, whereas 1/n above one indicates cooperative sorption process [33]. The Freundlich isotherm is criticized for its limitation that it does not approach Henry’s law at low concentrations and lacks a principle basis in thermodynamic law [34]. The Freundlich linear and non-linearized equations are listed below:
Nonlinear   form :   q e = K F   C e 1 / n
Linear   form :   log   q e = log K F + 1 n log C e
where KF (µg/g) is the Freundlich isotherm constant, which can be related to the sorption capacity. The constant n is the sorption intensity.

2.5.3. Tempkin Isotherm

This isotherm includes a factor that takes adsorbent-adsorbed interactions into consideration explicitly. The model assumes that the heat sorption of all molecules within the layer would be linearly lower than the logarithmic coverage, by ignoring the exceptionally small and high concentration value [35,36]. As indicated in the equation, its formulation is defined by the consistent allocation of binding energies (up to some peak binding power).
Nonlinear   form :   q e = R T b T ln A T C e
Linear   form :   q e = (   R T b T ) ln A T + (   R T b T ) l n C e As ,   B = R T b T
The   linear   form   can   be   rewritten   as :   q e = B ln A T + B   l n C e
where:
  • R: Universal gas constant (8.314 J/mol K).
  • T: Temperature at 298 K.
  • bT: Tempkin isotherm constant.
  • AT: Tempkin isotherm equilibrium binding constant (L/g).
  • B: Constant associated with heat of sorption (J/mol).

2.5.4. Dubinin–Radushkevich Isotherm

The sorption mechanism with the Gaussian power distribution on a heterogeneous surface is commonly applied for the Dubinin–Radushkevich isotherm. It is an empirical model initially designed to assort subcritical vapors in a pore filling mechanism. The model has often successfully fit high solute activities and the intermediate range of concentrations data well, but has unsatisfactory asymptotic properties and does not predict Henry’s law at low pressure [27].
Nonlinear   form :   q e = ( q s )   e x p ( k a d   ε 2   )
Linear   form :   l n ( q e ) = l n ( q s ) k a d   ε 2
E = [ 1 2 B D R ]
ε = R T   l n   [ 1 + 1 C e   ]
where:
  • qe: Amount of adsorbate in the adsorbent at equilibrium (mg/g).
  • qs: Theoretical isotherm saturation capacity (mg/g).
  • kad: Dubinin–Radushkevich isotherm constant (mol2/kJ2).
  • E: mean free energy (kJ/mol)
  • BDR: Dubinin–Radushkevich isotherm constant
  • ɛ: Dubinin–Radushkevich isotherm constant.
The approach has typically been applied in order to distinguish between physical and chemical sorption of ions with a mean free energy; the relation can be calculated by the energy E of adsorbate molecule to remove a molecule from its position in the sorption location.

3. Results and Discussion

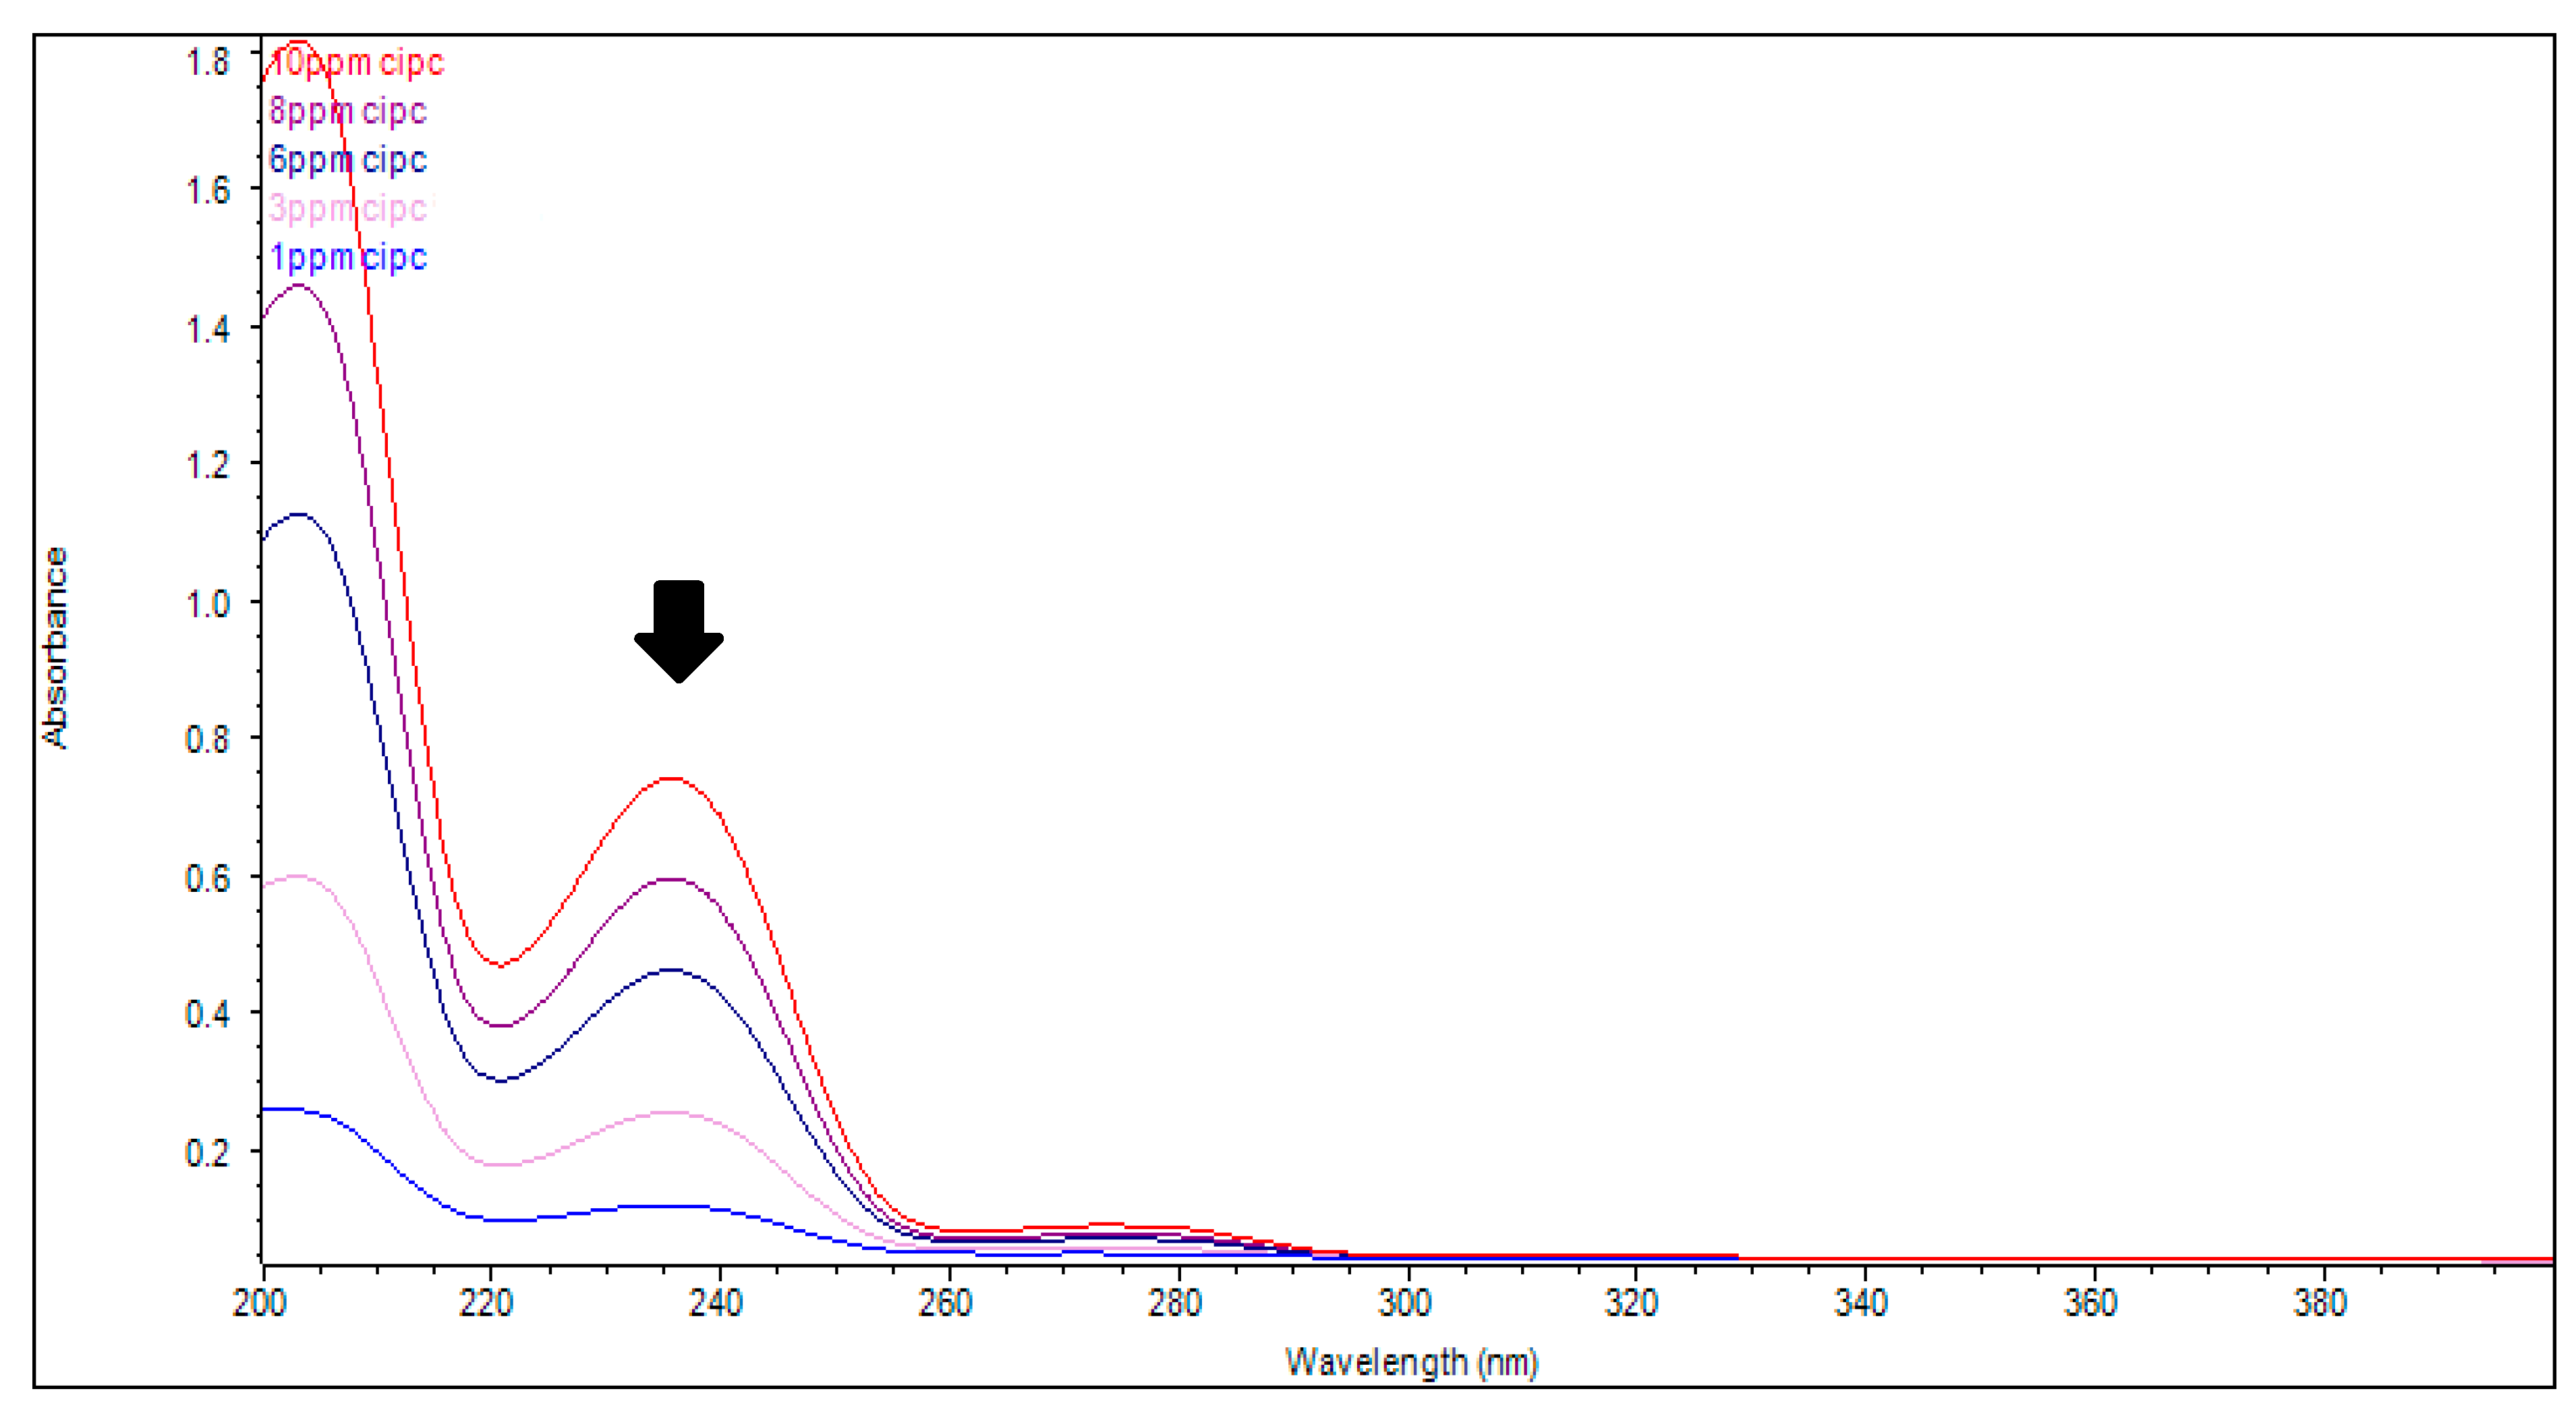
3.1. UV-Vis Spectrophotometer Validation

The instrument was calibrated by using the performance verification tests to ensure all criteria were working (wavelength accuracy, photometric accuracy, baseline flatness, etc.). After this, blanks (without analyte) and CIPC standards were measured. Figure 2 shows the absorbance vs. wavelength spectra and Figure 3, shows the CIPC calibration curve at 235 nm.
It can be seen from the spectra that the first peak is near to the methanol cut-off (205 nm) and water cut-off (190 nm). The solvent cut-off is the wavelength where the solvent starts to absorb nearly all the incident radiation. Any absorption data collected for the analyte for wavelengths shorter than the cutoff should be considered as indistinguishable from noise. Therefore, the second peak (at 235 nm) was chosen for CIPC determination.
In addition, concentrations out the range of 1.0–10.0 µg/mL were excluded as it is quite important to keep the absorption range within 0.1–1.0 to obtain an accurate result. Any higher concentration than this range was diluted with the same solvent and brought to the middle of calibration curve [4].
As can be seen from Figure 4 and Figure 5, repetitive measurements (n = 10) of different concentrations showed precise results which ranged from (0.87–0.53) RSD %. However, measurements at higher concentration appeared to be more precise than measurements at lower concentrations.
The LOD and LOQ based on 10 injections (n = 10) of a lower concentration of (1.0 µg/mL CIPC) can be calculated as follows:
L O D   ( µ g / m L ) = 1.0 × ( R e s p o n s e   o f   L O D ) M e a n
L O Q   ( µ g / m L ) = 1.0 × ( R e s p o n s e   o f   L O Q ) M e a n
Response of LOD= 3* STDEV
Response of LOQ= 10* STDEV
Accordingly, the LOD and LOQ for CIPC were 0.03 µg/mL and 0.09 µg/mL respectively. These are the lowest amount that the system can detect or quantify.
The LOD and LOQ based on the regression statistics for the calibration curve data (1.0–10.0 µg/mL CIPC) can be calculated (Table 1) as follows:
L O Q   ( µ g / m L ) = 3.3 × (   S E   o f   y i n t e r c e p t   )   S l o p e
L O Q   ( µ g / m L ) = 10 × (   S E   o f   y i n t e r c e p t   )   S l o p e
Therefore:
  • LOD (95% Confidence Level) = 0.04 µg/mL
  • LOQ (95% Confidence Level) = 0.11 µg/mL
Although the instrument can measure down to the lowest value of (0.11 µg/mL), it is advisable to stick with concentrations (1.0–10.0 µg/mL) that were covered on the calibration curve and within 0.1–0.7 absorption value to get away from deviations of Beer-Lambert Law.

3.2. Sorption of Prepared CIPC Solutions on Activated Charcoal

3.2.1. Effect of Contact Time

The adsorbed amount (qe) which has a unit of (µg/g) can be calculated as follows:
A d s o r b e d   a m o u n t   ( q e ,   µ g / g ) = ( C 0 C )   V W
where C0 and C are the initial and final CIPC concentrations (µg/mL), respectively, V is the volume of solution (mL) and W is the weight of adsorbent (g). Note that the final concentration (C) is not the equilibrium concentration (Ce) at this stage.
Therefore, as can be seen from Figure 6, that the sorption increased rapidly at lower concentrations then gradually reached equilibrium after 2 hours in which approximately 80% of CIPC being adsorbed on the surface of activated carbon.
To make sure that the equilibrium time is justified for various concentrations, 3 hours equilibrium time was chosen to conduct the sorption isotherm experiment [4].

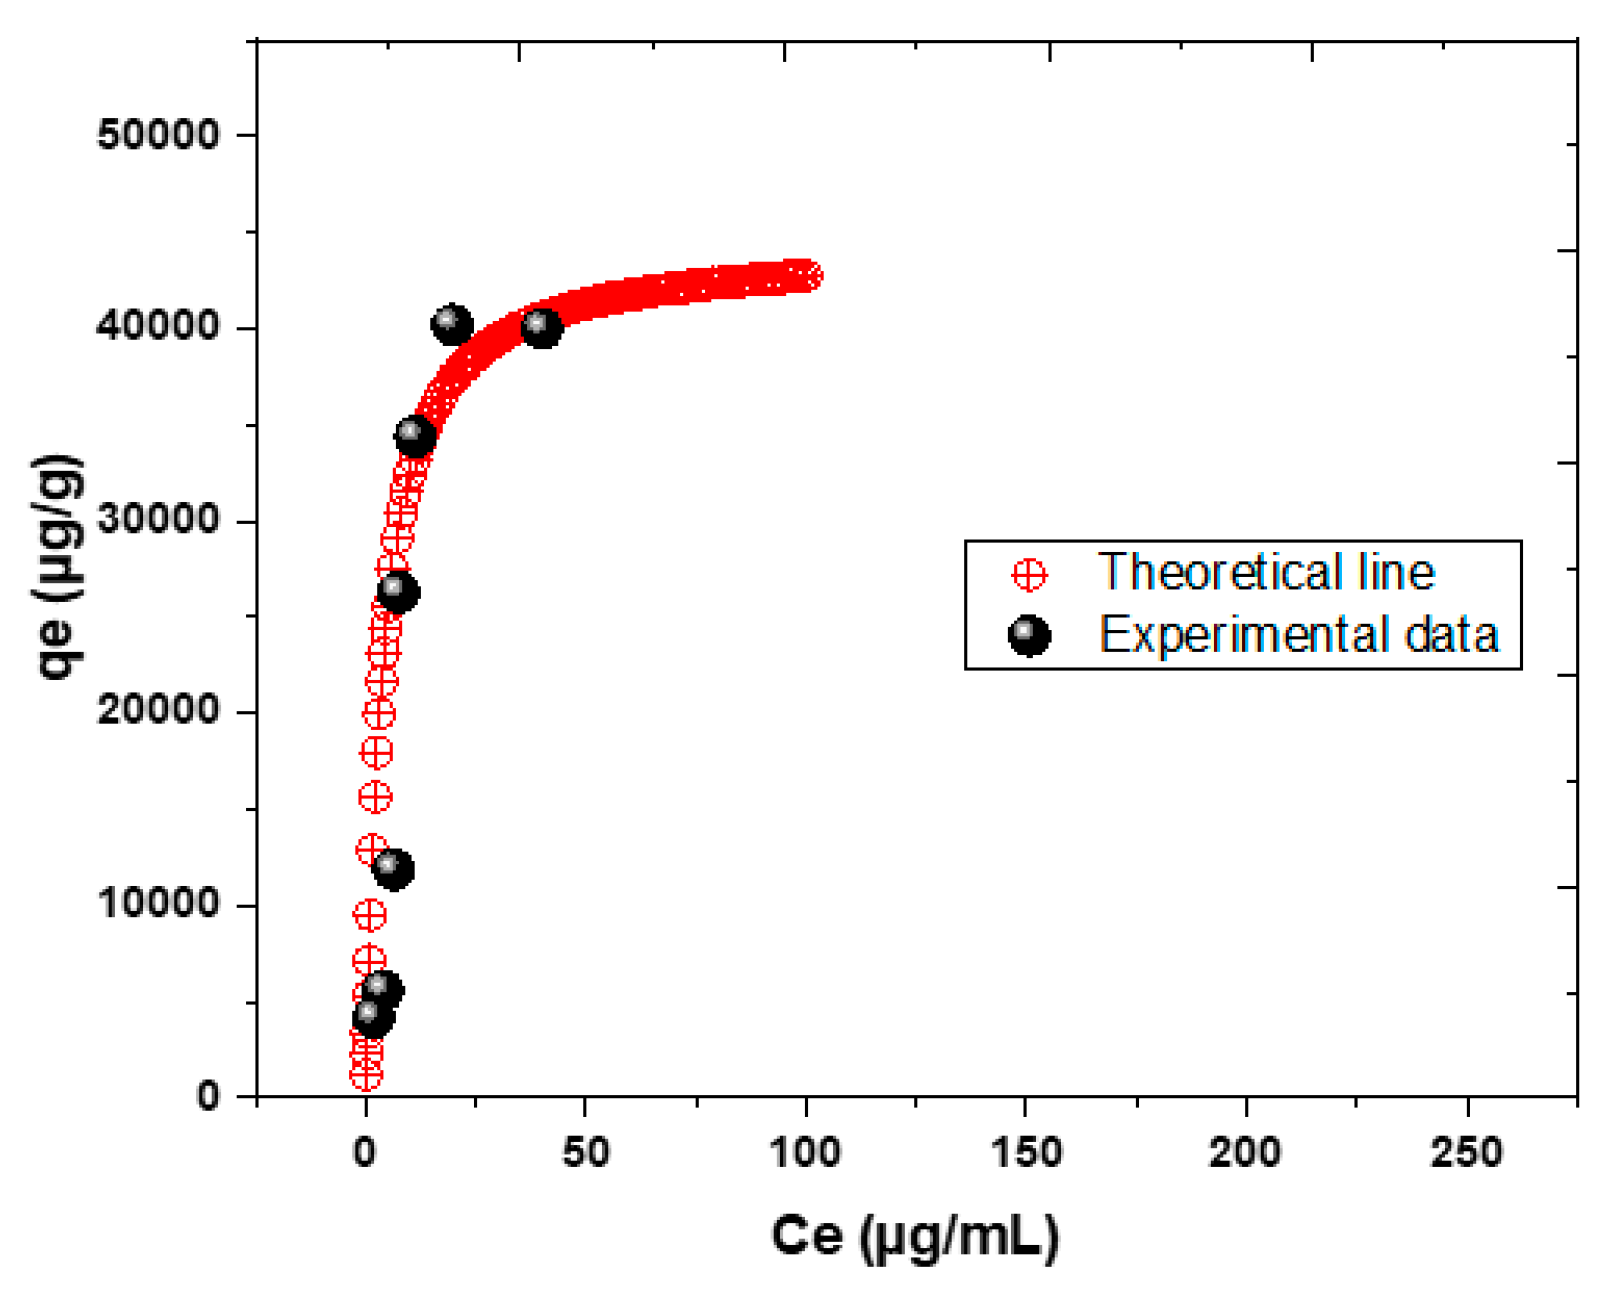
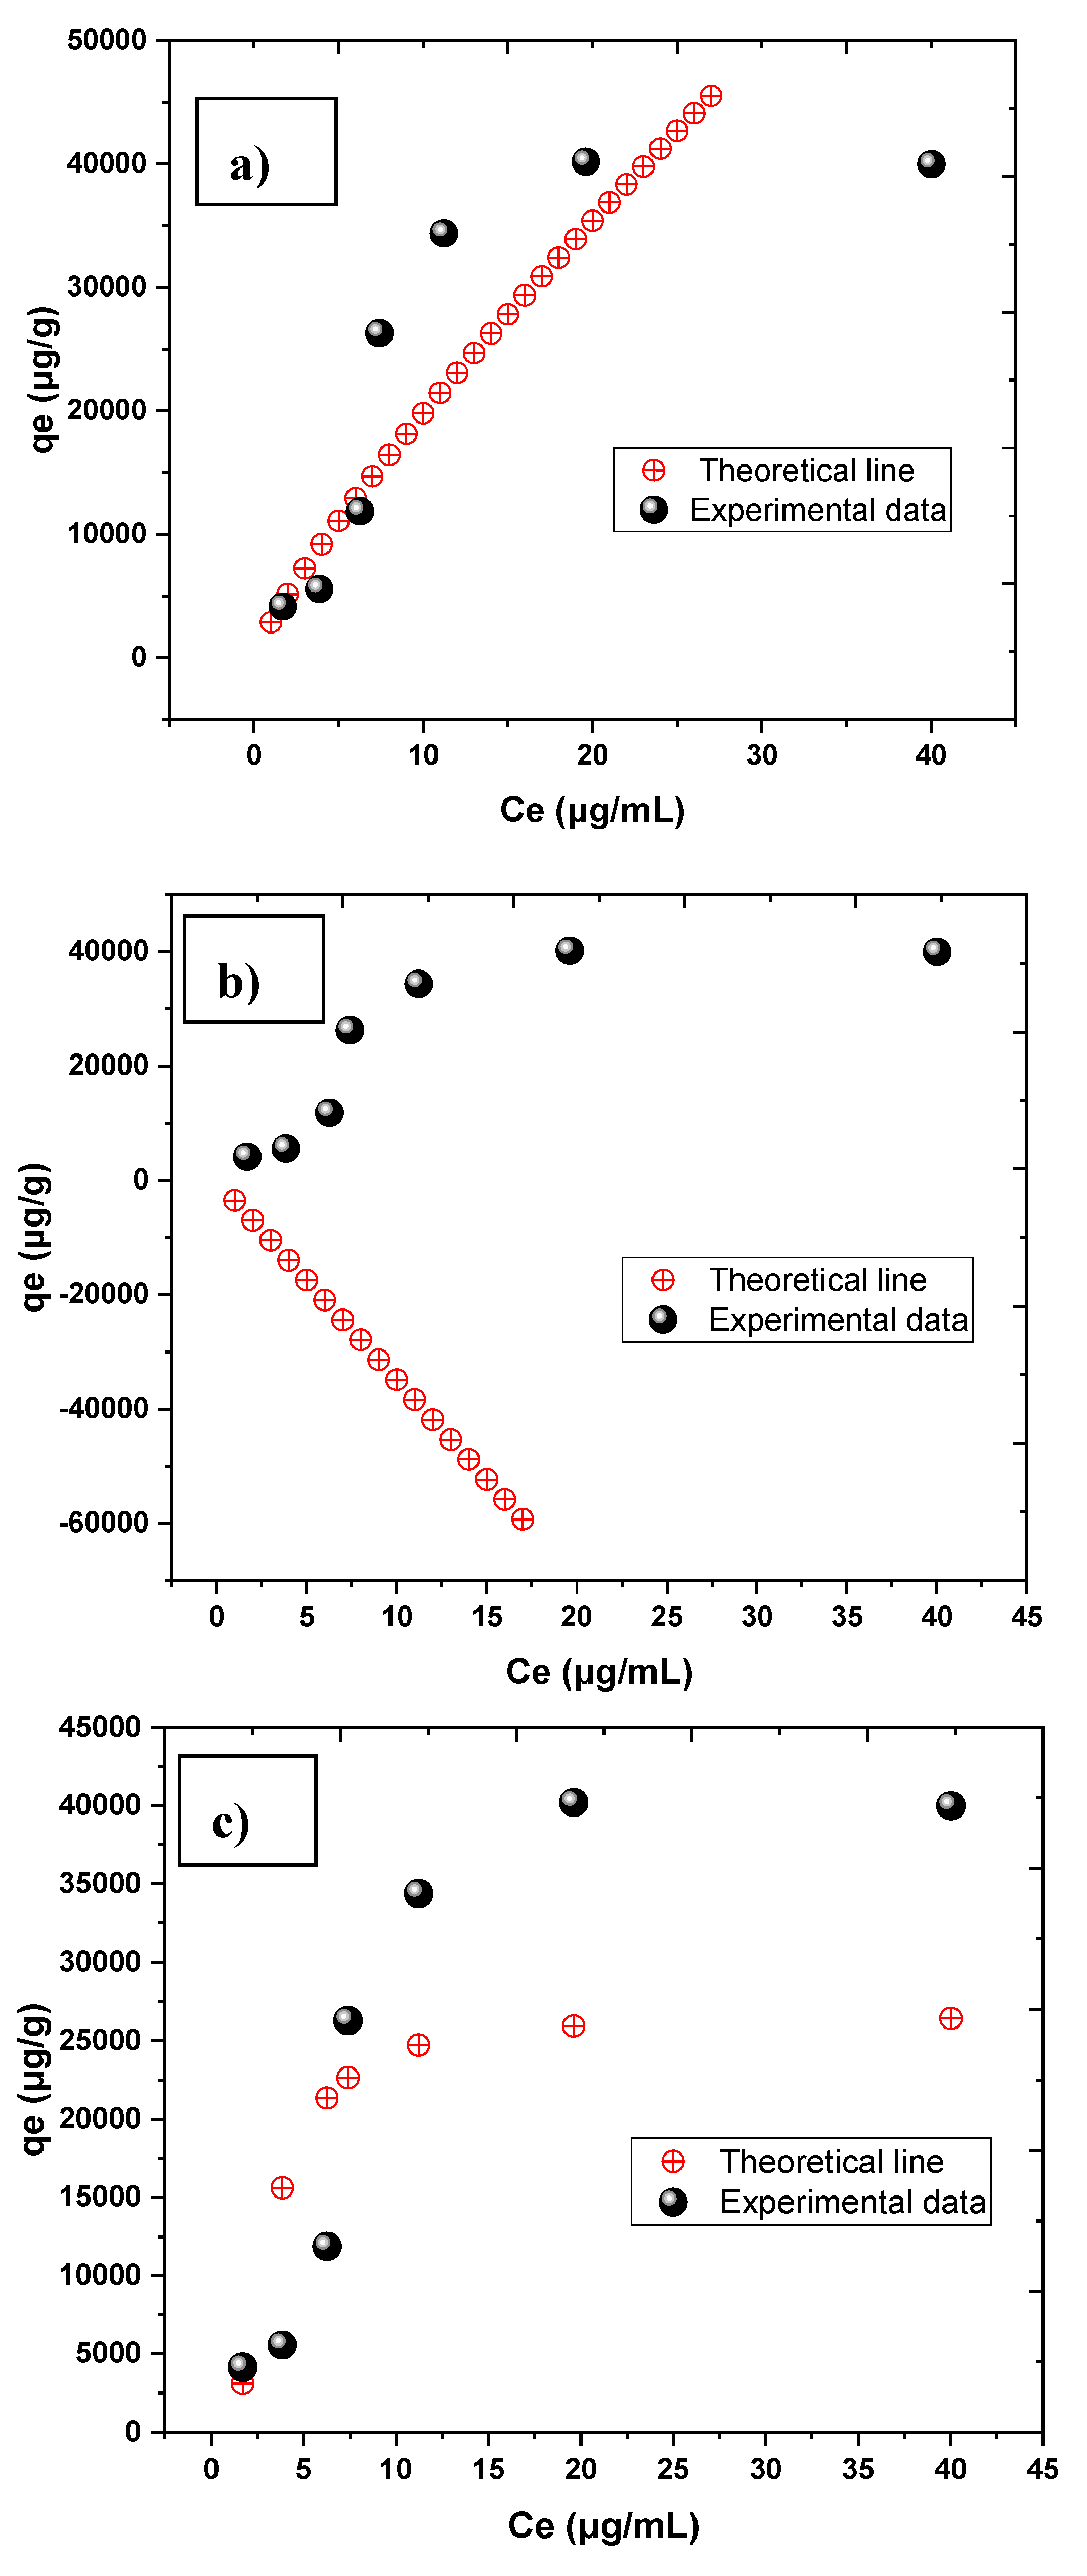
3.2.2. Sorption Isotherm

The Langmuir plot (Ce /qe vs. Ce) was constructed (see Figure 7) to test the linearity and validate the model fitting to the sorption isotherm data. In order to improve linearity, the red points in Langmuir plot were excluded as they were considered as outlier from the main points. Also, this considered as a limiting factor for the applicability of the Langmuir isotherm to explain the behavior in inhomogeneous surface. In many cases, the surface roughness of the adsorbent is not considered. Irregular inhomogeneous surfaces have many different types of sorption sites with certain parameters, including sorption heat, varying from one site to another [37].
The parameters for the Langmuir plotting are presented in Table 2. The Langmuir constant (b) is 0.27 (L/mg) and the maximum monolayer sorption capacity Qm from the Langmuir isotherm model was determined to be (44316.92 µg/g). The separation factor RL is 0.11 which indicates a favorable equilibrium sorption with the R2 value of 0.99 proving that the Langmuir Isotherm model fit the sorption data well.
The theoretical adsorbed amount qe was calculated from the Langmuir nonlinear form equation after substituting the knowing values of Qm, (b) and (Ce) values of 1, 2, 3, etc.
The theoretical line (red dots) for chlorpropham fit well with the experimental data points (black dots) (Figure 8). This confirms the applicability of the Langmuir isotherm for simulating experimental results [4].
Other isotherm models (Freundlich, Tempkin and Dubinin–Radushkevich) have also been tested. In summary, Figure 9 and Figure 10 show the results of fitting these isotherm models; Table 3 shows their parameters.
In comparison, the models of Langmuir (R2 = 0.99) fit the experimental data well, while reasonable fitting was observed in the Freundlich (R2 = 0.82) and Tempkin models (R2 = 0.87), but not in the Dubinin–Radushkevich model (R2 = 0.64). While the Langmuir model commonly fits well, it appears to not be fit for high concentrations, showing that the hypothesis concerning a monolayer sorption is restricted.
However, as the Tempkin model fit the data, it is suspected that there was an electrostatic interaction with the process of sorption of chlorpropham at all the concentration levels tested [4,38]. The Dubinin–Radushkevich isotherm model in (Figure 10) fit the sorption isotherm data (black dots) at lower concentration and was successful to mimic the sorption experimental behavior but at lower sorption capacity of nearly (26,606.63 µg/g) than (44,316.92 µg/g) that Langmuir model better achieved. This maybe because of the unsatisfied linearity of Dubinin–Radushkevich isotherm (R2 = 0.64) and the high possibility of multilayer sorption of CIPC and interaction between molecules in the layer.
In a survey [39] conducted to investigate the sorption of chlorpropham in different soil types, it was found that the Freundlich exponent (1/n) ranged from (0.71–0.80). This to some extent agrees with our study on activated carbon using the Freundlich model (1/n=0.84). No maximum sorption capacity for chlorpropham on activated carbon was reported in the literature but other general studies on activated carbon [40], fit the data to Langmuir model and found, for example, that methylene blue uptake on different activated carbon treatments reached the monolayer sorption capacity range of (6720–454,200 µg/g). This is close to the our study value (Qm = 44,316.92 µg/g) and values found in previous studies [41,42] for commercially activated carbon being used to remove different organic compounds.
The mechanism for the removal of CIPC by sorption maybe presumed to implicate the subsequent steps: migration of CIPC from solution bulk to the adsorbent surface (activated carbon), CIPC diffusion through the adsorbent surface, sorption at the active surface of activated carbon and intra- diffusion of CIPC to the internal pores of the activated carbon particle [41]. It is quite possible to expect multilayer sorption of CIPC and interaction between molecules in the layer.
The fundamental chemical structure of activated carbon is closely related to pure graphite structure. The crystal of graphite is made up of layers of fused hexagons that held by carbon–carbon bonds and weak van de Waals forces. The mechanism for fast sorption of CIPC on the surface of activated carbon is not fully understood. π–π stacking interaction has also been used as a powerful driving power to describe the aromatic adsorbate process onto the surface of activated carbon. It is likely that activated carbon can adsorb CIPC due to π–π stacking interactions between the CIPC ring structure and the activated carbon hexagonal cells. π–π stacking interaction was also found to be the dominant force on the surface of graphene oxide (structurally similar to activated carbon) for the deposition of porphyrin (a group of heterocyclic organic compounds) [43,44,45,46].

4. Conclusions

UV-Vis spectrophotometer was used to determine CIPC concentration in aqueous solution. The method was validated in which the correlation coefficient of standards calibration curve of (1.0–10.0 µg/mL CIPC) was R2=1 with a precision (RSD%, n = 10) ranged from (0.87–0.53%). The LOD and LOQ based on the regression statistics of the calibration curve data of (1.0–10.0 µg/mL CIPC) were 0.04 µg/mL and 0.11 µg/mL respectively.
The activated carbon adsorbent was found to be effective for the removal of CIPC from aqueous solution. The sorption increased rapidly at lower concentrations then gradually reached equilibrium after 2 hours in which approximately 80% of CIPC being adsorbed on the surface of activated charcoal. Several isotherm models (Langmuir, Freundlich, Tempkin and Dubinin–Radushkevich) have been evaluated. The maximum monolayer sorption capacity (Qm) from the Langmuir isotherm model was determined to be (44,316.92 µg/g). The separation factor (RL) was 0.11 which indicates a favorable equilibrium sorption with the R2 value of 0.99 proving that the Langmuir isotherm model fit the sorption data well. It can be concluded that activated carbon can be the potential and active material to remove chlorpropham from its aqueous solution and to remedy industrial wastewater.

Author Contributions

The author (Bandar R. M. Alsehli) conceived and designed the experiments; performed the experiments; analyzed the data; contributed reagents/materials/analysis tools and wrote the paper. The author has read and agreed to the published version of the manuscript.

Funding

This research received no external funding.

Conflicts of Interest

The author declares no conflicts of interest.

References

  1. Agarwal, M.; Sinha, A.; Gupta, S.K.; Mishra, D.; Mishra, R. Potato Crop Disease Classification Using Convolutional Neural Network. In Proceedings of the Smart Innovation, Systems and Technologies; Springer: Singapore, 2020; Volume 141, pp. 391–392. Available online: https://link.springer.com/chapter/10.1007%2F978-981-13-8406-6_37 (accessed on 16 March 2020).
  2. Flis, B.; Domański, L.; Zimnoch-Guzowska, E.; Polgar, Z.; Pousa, S.Á.; Pawlak, A. Stability Analysis of Agronomic Traits in Potato Cultivars of Different Origin. Am. J. Potato Res. 2014, 91, 404–413. [Google Scholar] [CrossRef] [Green Version]
  3. Paul, V.; Ezekiel, R.; Pandey, R. Sprout suppression on potato: Need to look beyond CIPC for more effective and safer alternatives. J. Food Sci. Technol. 2016, 53, 1–18. [Google Scholar] [CrossRef] [PubMed] [Green Version]
  4. Alsehli, B.R.M. Behaviour of Chlorpropham and Its Main Metabolite 3-Chloroaniline in Soil and Water Systems. Doctoral Thesis, University of Glasgow, Lascot, UK, 2014. [Google Scholar]
  5. Singh, B.; Ezekiel, R. Isopropyl N-(3-chlorophenyl) carbamate (CIPC) residues in potatoes stored in commercial cold stores in India. Potato Res. 2010, 53, 111–120. [Google Scholar] [CrossRef]
  6. Huang, Z.; Tian, S.; Ge, X.; Zhang, J.; Li, S.; Li, M.; Cheng, J.; Zheng, H. Complexation of chlorpropham with hydroxypropyl-β-cyclodextrin and its application in potato sprout inhibition. Carbohydr. Polym. 2014, 107, 241–246. [Google Scholar] [CrossRef]
  7. European Commission. Genetically Modified Food and Feed and Phytopharmaceuticals—Pesticides Legislation. Available online: https://ec.europa.eu/food/sites/food/files/safety/docs/app-comm_gmffer-ppl_20190411_sum.pdf (accessed on 15 March 2020).
  8. Sousa, S.; Maia, M.L.; Correira-Sá, L.; Fernandes, V.C.; Delerue-Matos, C.; Calhau, C.; Domingues, V.F. Chemistry and Toxicology Behind Insecticides and Herbicides. In Controlled Release of Pesticides for Sustainable Agriculture; Springer: Berlin/Heidelberg, Germany, 2020; pp. 59–109. [Google Scholar]
  9. Goeckener, B.; Kotthoff, M.; Kling, H.-W.; Bücking, M. Fate of Chlorpropham during High Temperature Processing of Potatoes. J. Agric. Food Chem. 2020, 68, 2578–2587. [Google Scholar] [CrossRef]
  10. Douglas, L.; MacKinnon, G.; Cook, G.; Duncan, H.; Briddon, A.; Seamark, S. Determination of chlorpropham (CIPC) residues, in the concrete flooring of potato stores, using quantitative (HPLC UV/VIS) and qualitative (GCMS) methods. Chemosphere 2018, 195, 119–124. [Google Scholar] [CrossRef] [Green Version]
  11. Gouseti, O.; Briddon, A.; Saunders, S.; Stroud, G.; Fryer, P.J.; Cunnington, A.; Bakalis, S. CIPC vapour for efficient sprout control at low application levels. Postharvest Biol. Technol. 2015, 110, 239–246. [Google Scholar] [CrossRef]
  12. Vijay, P.; Ezekiel, R.; Pandey, R. Use of CIPC as a potato sprout suppressant: Health and environmental concerns and future options. Qual. Assur. Saf. Crop. Foods 2018, 10, 17–24. [Google Scholar] [CrossRef]
  13. De Castro Lima, J.A.M.; Labanowski, J.; Bastos, M.C.; Zanella, R.; Prestes, O.D.; De Vargas, J.P.R.; Mondamert, L.; Granado, E.; Tiecher, T.; Zafar, M.; et al. “Modern agriculture” transfers many pesticides to watercourses: a case study of a representative rural catchment of southern Brazil. Environ. Sci. Pollut. Res. 2020, 27, 2–17. [Google Scholar] [CrossRef]
  14. AHDB Industry Statement on Chlorpropham (CIPC)|AHDB Potatoes. Available online: https://potatoes.ahdb.org.uk/news/industry-statement-chlorpropham-cipc (accessed on 15 March 2020).
  15. Douglas, L.; MacKinnon, G.; Cook, G.; Duncan, H.; Briddon, A.; Seamark, S. The risk of chlorpropham cross-contamination of grain in potato stores. Food Control 2019, 98, 1–8. [Google Scholar] [CrossRef] [Green Version]
  16. European Commission EU Pesticides Database—European Commission. Available online: https://ec.europa.eu/food/plant/pesticides/eu-pesticides-database/public/?event=activesubstance.detail&language=EN&selectedID=1129 (accessed on 15 March 2020).
  17. Naidenko, O.V. Application of the Food Quality Protection Act children’s health safety factor in the U.S. EPA pesticide risk assessments. Environ. Health Glob. Access Sci. Source 2020, 19, 1–15. [Google Scholar] [CrossRef] [PubMed] [Green Version]
  18. Khan, W.A.; Duncan, H.J.; Baloch, A.K.; McGowan, G. Methodology development for routine estimation of chlorpropham in commercial potato stores. Czech J. Food Sci. 2012, 30, 67–73. [Google Scholar] [CrossRef] [Green Version]
  19. Randhawa, M.A.; Ahmed, A.; Javed, M.S. Wheat Contaminants (Pesticides) and their Dissipation during Processing. In Wheat and Rice in Disease Prevention and Health; Academic Press: Cambridge, MA, USA, 2014; pp. 263–277. ISBN 9780124017160. [Google Scholar]
  20. Park, L.; Duncan, H.; Briddon, A.; Jina, A.; Cunnington, A.; Saunders, S. Review and development of the CIPC application process and evaluation of environmental issues. Available online: https://projectblue.blob.core.windows.net/media/Default/ResearchPapers/Potatoes/20095CIPCFinalReportR243_0.pdf (accessed on 6 August 2019).
  21. Zhang, L.; Hang, P.; Zhou, X.; Dai, C.; He, Z.; Jiang, J. Mineralization of the herbicide swep by a two-strain consortium and characterization of a new amidase for hydrolyzing swep. Microb. Cell Factories 2020, 19, 4. [Google Scholar] [CrossRef] [PubMed] [Green Version]
  22. Crini, G.; Lichtfouse, E.; Wilson, L.D.; Morin-Crini, N. Conventional and non-conventional adsorbents for wastewater treatment. Environ. Chem. Lett. 2019, 17, 195–213. [Google Scholar] [CrossRef]
  23. Bansal, R.C.; Goyal, M. Activated Carbon Adsorption; Taylor & Francis: London, UK, 2005; ISBN 9781420028812. [Google Scholar]
  24. Jiang, W.; Xing, X.; Li, S.; Zhang, X.; Wang, W. Synthesis, characterization and machine learning based performance prediction of straw activated carbon. J. Clean. Prod. 2019, 212, 1210–1223. [Google Scholar] [CrossRef]
  25. Kim, M.H.; Tang, J.; Jang, S.J.; Pol, V.G.; Roh, K.C. Porous graphitic activated carbon sheets upcycled from starch-based packing peanuts for applications in ultracapacitors. J. Alloy. Compd. 2019, 805, 1282–1287. [Google Scholar] [CrossRef]
  26. Ma, K.; Wang, R.; Jiao, T.; Zhou, J.; Zhang, L.; Li, J.; Bai, Z.; Peng, Q. Preparation and aggregate state regulation of co-assembly graphene oxide-porphyrin composite Langmuir films via surface-modified graphene oxide sheets. Colloids Surf. Physicochem. Eng. Asp. 2020, 584, 124023. [Google Scholar] [CrossRef]
  27. Foo, K.Y.; Hameed, B.H. Insights into the modeling of adsorption isotherm systems. Chem. Eng. J. 2010, 156, 2–10. [Google Scholar] [CrossRef]
  28. Langmuir, I. The constitution and fundamental properties of solids and liquids. Part I. Solids. J. Am. Chem. Soc. 1916, 38, 2221–2295. [Google Scholar] [CrossRef] [Green Version]
  29. Herbert, F. Over the adsorption in solution. Z. Phys. Chem. 1907, 57U, 385. [Google Scholar]
  30. Adamson, A.W.; Gast, A.P. Physical Chemistry of Surfaces; Interscience Publishers: New York, NY, USA, 1997; Volume 210, ISBN 0471148733. [Google Scholar]
  31. Ahmaruzzaman, M. Adsorption of phenolic compounds on low-cost adsorbents: A review. Adv. Colloid Interface Sci. 2008, 143, 48–67. [Google Scholar] [CrossRef] [PubMed]
  32. Ng, K.C.; Burhan, M.; Shahzad, M.W.; Ismail, A. Bin a Universal Isotherm Model to Capture Adsorption Uptake and Energy Distribution of Porous Heterogeneous Surface. Sci. Rep. 2017, 7, 10634. [Google Scholar] [CrossRef] [PubMed] [Green Version]
  33. Haghseresht, F.; Lu, G.Q. Adsorption characteristics of phenolic compounds onto coal-reject-derived adsorbents. Energy Fuels 1998, 12, 1100–1107. [Google Scholar] [CrossRef]
  34. Ho, Y.S.; Porter, J.F.; McKay, G. Equilibrium isotherm studies for the sorption of divalent metal ions onto peat: Copper, nickel and lead single component systems. Water Air Soil Pollut. 2002, 141, 1–33. [Google Scholar] [CrossRef]
  35. Tempkin, M.I.; Pyzhev, V. Kinetics of ammonia synthesis on promoted iron catalyst. Acta Phys. Chim. USSR 1940, 12, 327–356. [Google Scholar]
  36. Aharoni, C.; Ungarish, M. Kinetics of activated chemisorption. Part 2—Theoretical models. J. Chem. Soc. Faraday Trans. Phys. Chem. Condens. Phases 1977, 73, 456–464. [Google Scholar] [CrossRef]
  37. Martínez-Vitela, M.A.; Gracia-Fadrique, J. The Langmuir-Gibbs surface equation of state. Fluid Phase Equilibria 2020, 506, 112372. [Google Scholar] [CrossRef]
  38. Boudjema, L.; Long, J.; Petitjean, H.; Larionova, J.; Guari, Y.; Trens, P.; Salles, F. Adsorption of volatile organic compounds by ZIF-8, Cu-BTC and a Prussian blue analogue: A comparative study. Inorg. Chim. Acta 2020, 501, 119316. [Google Scholar] [CrossRef]
  39. Arena, M.; Auteri, D.; Barmaz, S.; Bellisai, G.; Brancato, A.; Brocca, D.; Bura, L.; Byers, H.; Chiusolo, A.; Court Marques, D.; et al. Peer review of the pesticide risk assessment of the active substance chlorpropham. EFSA J. 2017, 15, e04903. [Google Scholar]
  40. Hameed, B.H.; Din, A.T.M.; Ahmad, A.L. Adsorption of methylene blue onto bamboo-based activated carbon: Kinetics and equilibrium studies. J. Hazard. Mater. 2007, 141, 819–825. [Google Scholar] [CrossRef]
  41. Kannan, N.; Sundaram, M.M. Kinetics and mechanism of removal of methylene blue by adsorption on various carbons—A comparative study. Dye. Pigment. 2001, 51, 25–40. [Google Scholar] [CrossRef]
  42. Tsai, W.T.; Chang, C.Y.; Lin, M.C.; Chien, S.F.; Sun, H.F.; Hsieh, M.F. Adsorption of acid dye onto activated carbons prepared from agricultural waste bagasse by ZnCl2 activation. Chemosphere 2001, 45, 51–58. [Google Scholar] [CrossRef]
  43. Gao, Y.; Li, Y.; Zhang, L.; Huang, H.; Hu, J.; Shah, S.M.; Su, X. Adsorption and removal of tetracycline antibiotics from aqueous solution by graphene oxide. J. Colloid Interface Sci. 2012, 368, 540–546. [Google Scholar] [CrossRef] [PubMed]
  44. Akbar Ali, A.M.; Karthikeyan, R.K.; Sentamil Selvan, M.; Rai, M.K.; Priyadharshini, M.; Maheswari, N.; Janani Sree, G.; Padmanaban, V.C.; Singh, R.S. Removal of Reactive Orange 16 by adsorption onto activated carbon prepared from rice husk ash: Statistical modelling and adsorption kinetics. Sep. Sci. Technol. 2020, 55, 26–34. [Google Scholar]
  45. Egbosiuba, T.C.; Abdulkareem, A.S.; Kovo, A.S.; Afolabi, E.A.; Tijani, J.O.; Auta, M.; Roos, W.D. Ultrasonic enhanced adsorption of methylene blue onto the optimized surface area of activated carbon: Adsorption isotherm, kinetics and thermodynamics. Chem. Eng. Res. Des. 2020, 153, 315–336. [Google Scholar] [CrossRef]
  46. Guillossou, R.; Le Roux, J.; Mailler, R.; Pereira-Derome, C.S.; Varrault, G.; Bressy, A.; Vulliet, E.; Morlay, C.; Nauleau, F.; Rocher, V.; et al. Influence of dissolved organic matter on the removal of 12 organic micropollutants from wastewater effluent by powdered activated carbon adsorption. Water Res. 2020, 172, 115487. [Google Scholar] [CrossRef]
Figure 1. chlorpropham structure.
Processes 08 00398 g001
Figure 2. UV spectra of (1.0–10.0 µg/mL CIPC in aqueous solution at scan range 400–200 nm.
Processes 08 00398 g002
Figure 3. Calibration plot of (1.0–10.0 µg/mL CIPC) in aqueous solution at 235.0 nm.
Processes 08 00398 g003
Figure 4. Average absorbance precision of (1.0–10.0 µg/mL CIPC) in aqueous solution at 235.0 nm, n=10.
Processes 08 00398 g004
Figure 5. An example of UV spectra of (1.0 µg/mL CIPC) measured 10 times (n=10) in aqueous solution at scan range 400–200 nm.
Processes 08 00398 g005
Figure 6. Effect of contact time on CIPC sorption.
Processes 08 00398 g006
Figure 7. Langmuir isotherm for CIPC sorption on activated charcoal.
Processes 08 00398 g007
Figure 8. Experimental data of CIPC (black dots) fit through the theoretical line (red dots) using the Langmuir sorption isotherm equation.
Processes 08 00398 g008
Figure 9. Sorption isotherm for CIPC on activated charcoal (a) Freundlich, (b) Tempkin, (c) Dubinin–Radushkevich.
Processes 08 00398 g009aProcesses 08 00398 g009b
Figure 10. Theoretical line fitting through the experimental data of CIPC using (a) Freundlich, (b) Tempkin and (c) Dubinin–Radushkevich isotherms.
Processes 08 00398 g010
Table 1. Regression statistics for the calibration curve.
CoefficientsStandard Errort StatP-ValueLower 95%Upper 95%Lower
95.0%
Upper 95.0%
Intercept0.0509473680.00075945467.08427.299E-060.048530.05336430.0485304460.05336429
X Variable 10.0684022560.000117186583.7051.109E-080.0680290.06877520.0680293160.06877519
Table 2. Langmuir isotherm constants for CIPC sorption on activated charcoal.
ComponentLangmuir Isotherm
CIPCQm
(µg/mg)
b
(L/mg)
RLR2
44316.920.270.110.99
Table 3. Freundlich, Tempkin and Dubinin–Radushkevich isotherm constants for CIPC sorption on activated charcoal.
CIPCFreundlich Isotherm
1 n nKF (µg/g)R2
0.841.192883.750.82
Tempkin isotherm
AT
(L/g)
bTBR2
0.76 0.19 12861.590.87
Dubinin–Radushkevich isotherm
qs
(µg/g)
Kad
(mol2/kJ2)
E
(kJ/mol)
R2
26606.631.63E-06 0.690.64

