Article

Biodrying of the Light Fraction from Anaerobic Digestion Pretreatment in Order to Increase the Total Recovery Rate

1
DESTEC—Department of Energy, Systems, Territory and Construction Engineering, University of Pisa, 56122 Pisa, Italy
2
DIEF—Department of Industrial Engineering of Florence, University of Florence, 50139 Florence, Italy
*
Author to whom correspondence should be addressed.
Processes 2020, 8(3), 276; https://doi.org/10.3390/pr8030276
Submission received: 7 February 2020 / Revised: 22 February 2020 / Accepted: 26 February 2020 / Published: 28 February 2020
(This article belongs to the Special Issue Current Trends in Anaerobic Digestion Processes)

Abstract

:
Two pilot-scale tests were carried out to assess if biodrying could be an effective process for the treatment of light fraction produced by an hydromechanical pre-treatment in an anaerobic digestion plant. The trials were performed using two pilot-scale stainless steel cylindrical reactors of 750 L capacity. Two tests were performed: in Test 1, only the light fraction was used; in Test 2, the light fraction was mixed with a bulking agent composed of garden and pruning waste. In Test 2, the highest temperature (71 °C) in a short time (8 days) was reached. An average water content reduction of 78% in Test 1 and 61% in Test 2 was measured, leading to similar reductions of weight (47–48%) and volume (27–29%). A high biological stability was measured on the final light fraction samples collected from both the tests. Furthermore, the lower heating value obtained after the biodrying treatment complies with the quality specification of the European standard on refuse-derived fuels.

Graphical Abstract

1. Introduction

In order to achieve sustainable low-carbon development, both the Circular Economy Action Plan and the Bioeconomy Strategy [1] are the cornerstones of European policy today. In particular, the circular economy package aims to close material cycles by promoting recovery and reducing environmental pressures [2]. The current EU strategy on municipal solid waste (MSW) management recommends prevention and reduction of waste, reuse of products, recycling and recovery of materials, energy recovery and finally landfilling. Besides, in order to reduce environmental impacts of landfill, the EU Landfill Directive [3] strives to reduce the amount of the biodegradable MSW disposed in landfills [4].
These policies have promoted the development of biological treatments as a suitable alternative for transforming organic waste into suitable agricultural products [5]. It is estimated that in 2018 about 43 million tons of MSW were treated in composting or anaerobic digestion plants, an increase of 3% of the quantity treated in 2017 [6]. Among the biological treatments, anaerobic digestion (AD) is frequently the most cost-effective due to the high energy recovery linked to the process and its limited environmental impact [7,8].
Whatever the technology used for the digestion, typically some pre-treatments are needed to remove contaminants from the inlet waste. Several systems can be used, depending on the inlet waste characteristics and digestion technology (dry or wet processes): Separation by gravity (pulper), separation by size (sieves) and separation in presses are usually used. Generally, light materials, such as plastic bags or packaging together with the organic fraction wrongly removed, are the major part of the residues from pre-treatments. As stated by Drennan and DiStefano [9] regarding the processing of solid-phase residue from the digesters, the management of the reject streams from the pre-treatment also brings additional initial and annual costs. However, despite the treatment of AD residues carrying a significant cost, limited reports on this issue exist.
Biodrying is a technology in which the thermal energy, generated by aeration degradation of organic matter in waste, is used to evaporate water [10] at the lowest possible residence time and with minimal biodegradation; hence, preserving most of the gross calorific value of the waste matrix [11]. Indeed, other research has demonstrated that biodrying can be useful in order to achieve a high reduction of volume and mass of solid waste, rendering it more suitable for short-term storage and transport, both partially biostabilizing the waste and by reducing its moisture below the necessary threshold for biodegradation to occur [12]. Despite biodrying remaining a relatively new technology and that published research is limited [13], full-scale and laboratory-scale applications were done testing several matrices: MSW [10,14,15,16]; landfilled waste [17]; gardening waste [12]; and sewage sludge from wastewater treatment, pulp and paper mixed sludge and dairy manure [18,19,20,21]. However, to our knowledge, this is the first study on this reject stream.
In the case of our study, a significant amount of light fraction (LF) is produced by an hydromechanical pre-treatment in an AD plant. This material, that is currently landfilled, is mainly composed of plastics, bioplastics and organic matter. In particular, the presence of bioplastics, that absorb more water during the treatment compared to normal plastic films, has led to significant increases in disposal cost [22]. The main aim of this work was to characterize this material and to evaluate suitable treatments to reduce disposal costs and enhance the overall efficiency of the AD plant with respect to the European priorities in waste management. After the LF characterization, some pilot-scale tests were carried out to assess if the LF can be biodried.
The main objective of the trials performed was to study if the LF can maintain biodrying processes, considering that the amount of biodegradable organics could be a limit [23] and that organic waste samples with moisture below 35% on a wet weight basis are biologically inactive [24]. In order to evaluate the possible efficiency of a Waste-to-Energy treatment for the biodried LF, the moisture and the low heating value (LHV) were evaluated [25] according to the definition of solid fuel prepared from non-hazardous waste to be utilized for energy recovery in incineration or co-incineration plants, and meeting the classification and specification requirements laid down by CEN TS 15359:2010, as a European standard on refuse-derived fuels (RDF) [26].

2. Materials and Methods

2.1. LF Characteristics and Sampling

LF was obtained from an AD plant in northern Italy. It was produced by a hydromechanical pre-treatment of source-sorted organic fraction and commercial residues (dairy and baking industry, food industry and processing of editable oils and fats). In the pulper the feedstock was added to the pre-filled process water and a high turbulence, created by a mixer, separated the waste mixture into fractions. In this way, non-soluble organic components were reduced to fibers and brought into suspension. The organic suspension was pumped through an internal sieve with a 10 mm mesh size toward further pre-treatments. Process water was added within the pulper to dilute and wash the contaminants, with those bigger than 10 mm remaining, creating a low viscosity suspension in which heavy materials settle on the bottom while light materials are skimmed off on the top. In this case study, it was estimated that the LF produced by the pre-treatment is about the 8% of the pulper inlet waste.
For this research, seven production lots of LF were sampled directly at the plant, for a total weight of about 760 kg. From the lots, for trial purposes about 350 kg were used. A sub-sample of about 50 kg was utilized for preliminary analysis.
In order to ensure the representativeness of the LF samples used in the research activities, the evolution of the total solid content (TS) of this material was studied for more than two years before the starting of the project (Figure 1). The analysis indicated an average TS of 45.54% weight/weight (w/w) and a standard deviation of 5.45%. Since the average TS of the samples collected for the research was in this range (48.68% ± 1.98% w/w), these samples were considered representative of the LF produced and have been used in the trials.

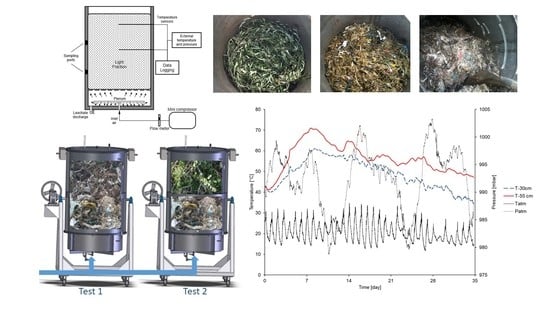
2.2. Experimental Equipment

The trials were performed using two pilot-scale stainless steel cylindrical reactors of 750 L capacity (height 148 cm, internal diameter 80 cm). The biodrying reactors were externally covered with elastomeric insulation sheets of 3 cm thick. Within the reactors, LF samples were carefully placed, limiting the material compaction on top of a perforated stainless-steel plate. Underneath this plate, there was a free volume (height 30 cm) for a more homogeneous air distribution and leachate drainage (Figure 2).
Since the aim of the trials were to test a relatively simple technology, the reactors were installed uncovered outside, under a roofing to protect the material from rains. The environmental conditions (atmospheric pressure and temperature) were monitored during the tests.
Two tests were performed: in Test 1, only LF was used; in Test 2, the LF was mixed with bulking agent (garden and pruning waste, chosen for its wide availability) with a volume ratio of 1:1. Bulking agent was used to promote the airflow through the wastes and facilitate the aerobic oxidation [12].
In Test 1, the reactor was filled with about 197 kg of LF while the reactor used in Test 2 was filled with 162 kg of the LF and 10 kg of the bulking agent. The samples were filled up to a height of about 100 cm, leaving 18–15 cm of headspace in both the reactors.
In both the trials, air was forced from the bottom by means of a mini compressor (FORTEK COMPR. FO 1/6, Bottarini, Varese, Italy) and variable area flow meters were used for flowrate control (FR2000, Clarck Solution, Hudson, MA, USA). Test 1 and Test 2 were conducted for 35 days. Since the study of the optimal process parameters was not of interest and the main objective of the research was to test the suitability of the biodrying process in the case of this study, in the tests continuous airflows were used (40–0.l/min) (Table 1).
The airflow rates were controlled even if, as observed by Velis et al. [13], the oxygen stoichiometric demand for aerobic decomposition is satisfied by oxygen provided by the high aeration necessary for effective drying. The composition of the gas in the reactors (concentrations of methane, carbon dioxide and oxygen) was periodically measured using a portable infrared gas analyzer (Ecoprobe 5, RS Dynamics, Praha, Czech Republic) integrated with an oxygen analyzer. During the trials, the measured oxygen concentrations were always above 10% (data not shown).

2.3. Data Acquisition and Samples Analysis

The temperature in the LF mass was monitored using two K-type thermocouples at 30 cm and 55 cm of depth. As the reactors were outside, the external temperature and atmospheric pressure were also measured (barometric pressure transducer, Delta Ohm-HD 9908 BARO, Padova, Italy). Data were logged every 5 min using a programmable automation controller (Compact Field Point, National Instrument Inc., Austin, TX, USA).
To estimate the volume reduction, the levels of LF from the top of the reactors were measured weekly. The weight reduction was calculated as the difference between the sample weight before and after the tests. The leachate production was also checked once a week, in order to collect and analyze possible drained water. However, in both the tests, no production of leachate occurred.
Additionally, LF samples were collected weekly from the reactor through sampling ports at 50 cm and 80 cm of depth, to measure TS, volatile solid content (VS) and pH. Since it was not possible to extract excess material during the tests, two equal aliquots of LF were collected from the sampling ports and mixed to obtain a single sample of about 120 g.
TS and water contents were measured following the standard method, by weighing the samples before and after drying at 105 °C for 24 h until a constant weight. VS was measured as loss of ignition at 550 °C. The pH of the water suspension of the samples was determined according to the method in ANPA 2001 [27]. TS, VS and pH were measured also before and after the biodrying tests, using three aliquots of about a kilogram each. At the end of the trials the LF was sampled from different heights in order to verify the presence of moisture gradients inside the reactors. For the determination of the efficiency of the simulated biodrying process, from the measurements of VS, the initial and the final carbon contents were calculated using a factor of 1.83, according to Barrington et al. [28].
In addition, the C:N ratio, the material compositions, the biological stability and the energy content of the initial and final LF were evaluated. The total organic carbon and the total nitrogen to calculate the C:N ratio were determined by an external laboratory according to an Italian and European analysis method for fertilizer (Ministerial Decree 19 July 1989, Second Part and Regulation 2003/2003, Annex IV, Method 2.3) [29]. For the material composition analysis, a sample of about 25 kg was sorted using a sieve with a 10 mm mesh into a fine fraction (<10 mm) and an over-screen fraction (<10 mm). The over-screen materials were further divided into textiles, compostable fractions (mainly residual food waste), plastics (e.g., food packaging and plastic bags), compostable plastics and non-compostable materials (e.g., rubber, glass and inerts).
As a measure of biological stability, both the Real Dynamic Respiration Index (RDRI) [30] and the biogas production (gas generation sum) under anaerobic conditions in 21 days (GB21) [31] were measured. The RDRI was determined according to the standard procedure UNI/TS 11184:2016, using an adiabatic dynamic respirometer (Respirometer 3024, Costech International, Milano, Italy). The GB21 analysis was done in duplicate using a modified manometric method [32]. More details on the GB21 determination method can be seen in Pecorini et al. [33,34,35].
The biodrying efficiency was determined according to Huiliñir et al. [20] from the following equation:
η = 1 T o t a l   c a r b o n   l o s s T o t a l   w a t e r   l o s s
where the total carbon loss is the difference between the initial and final carbon content in the sample (w/dw) and the total water loss is the difference between the initial and the final water content of the sample (w/w).
To assess the energy content variation, the low heating value (LHV) of the LF before and after the trials was measured, according to the standard UNI 9903-5:1992.

3. Results and Discussion

3.1. Biodrying Temperature Evolution

The results of some studies are in contrast regarding the optimal temperature range during drying. Some modeling studies indicate that the optimal range for maximum moisture removal is approximately the peak biodegradation rate temperature, while experimental studies indicate maximum drying for lower temperatures that slow down biodegradation. [13]. In the study case, considering the high presence of plastics (high LHV), the main goal of the simulated biodrying process was to maximally exploit temperature developed by the aerobic degradation of the organic fraction contained in the LF, in order to dry the other materials and reduce the sample weight as water loss. To do this, three airflow rates were set and the evolution of the matrix temperature and the reduction of moisture content of the samples were studied (Table 1).
In Test 1 (Figure 3) the internal temperature reached three peaks of 63 °C, 64 °C and 59 °C after 8, 14 and 20 days, respectively. After 20 days the temperatures gradually decreased, probably together with the microbial activity. The temperatures recorded by the upper probe (30 cm of depth) were lower than those recorded at the bottom (55 cm of depth) but showed a similar trend. A maximum difference of 8 °C was measured, lower than in other studies in which higher temperature gradients were found (about 30 °C) during the initial high-microbial activity phase [14,15]. Therefore, in the case of this study, it is supposed that the gradient of temperature was due to the external conditions on the upper temperature sensor rather than to the heterogeneity of the simulated biodrying processes. The temperatures measured in the reactor were affected by the day–night cycle of external temperature that caused tiny variation of the internal conditions.
In Test 2 (Figure 4), in which bulking agent was added to the LF, the temperature of the biomass reached a maximum of 71 °C after 8 days. After the first week, the temperatures slowly decreased. In this case, the presence of two different materials in the reactor led to higher heterogeneity and a higher temperature difference was measured between the top and the bottom of the reactor (maximum of 15 °C). In Test 2, the internal temperatures were also disturbed by the day–night cycles.
The daily average temperatures of the LF showed a similar evolution in Test 1 and Test 2: Significant increases were detected during the first 9 days followed by slow decreases in which temperatures ranged between 65 °C and 45 °C. However, in Test 2, the highest temperature (71 °C) in a shorter time (8 days) was reached (Figure 5). According to the classification proposed by Sharara et al. [21], the airflow rates used in the trials correspond to medium–low aeration levels. The temperatures reached in the tests confirmed the results of previous studies performed with other substrates, in which peaks of temperature were detected with the lower airflow rates, comparable to those used in this study [12,20,21]. However, the temperature evolution detected in this work was different from those reported in the literature. The biomass temperature in both the tests increased to higher values in a longer time: 8–9 days instead of 24 h [20,21,36] or a few days [12]. In addition, the temperatures decreased slowly, remaining high (65–45 °C) for a longer time, probably because of the airflow rate reduction done from the 14th day. Besides low airflow rates used, also the large amount of LF used in the trials and its characteristics could explain these differences.
In similar studies on biodrying of MSW, it has been demonstrated that a lower biomass temperature (45 °C) and higher flow rates (23 m3 Mg TS h−1) allowed fast biodrying, limiting VS degradation and saving energy content [16,30]. In the case studies cited above, the average airflow rates used to maintain the lower biodrying temperatures (45 °C) were similar to those used in this work, in which, however, the biomass temperatures achieved were higher. This lead to suppose that the characteristics of the LF, such as the content of the easily degradable organic fraction and initial moisture, allow to produce heat and to maintain the biodrying process.

3.2. Moisture, VS and Volume Reduction

The moisture content of the waste matrix is the single most important variable for evaluating the performance of biodrying processes [13]. As reported in Table 1, the TS increased during the simulated biodrying process. The average initial water content of the LF dropped from 51.51% w/w to 11.08% w/w in Test 1 and 20.03% w/w in Test 2. The high standard deviation of the final water content of the LF from Test 2 suggest the presence of moisture gradients in the rector, probably because of the heterogeneity of the tested material (LF and bulking agent), as confirmed by the internal temperatures. In particular, the LF sampled from the top of the reactor was more humid than the sample from the bottom, with a TS of 66.85% w/w and 93.09% w/w, respectively.
The values of the TS and VS of the samples collected during the trials did not allow identifying a clear trend, probably because only small samples of the LF from the fixed sampling ports could be collected. However, considering the average values, the initial and final TS showed a significant reduction in the water content of the samples; about 78% in Test 1 and 61% in Test 2. It should be underlined that, in both the tests, no production of leachate was detected. Similar moisture reduction rates were found in the literature, even if the final moisture content in Test 1 was lower compared to other studies, probably because of the longer duration of the trials and the presence of a higher temperature in the reactor for more days. In Zawadzka et al. [36] the initial moisture content of organic waste decreased by 50% while in Adani et al. [14] the total mass balance indicated water total losses from 40.9% to 66.7% in the MSW samples used in the trials. Comparing the results obtained in the two trials, suggests that the presence of the bulking agent in the LF samples led to the higher final water content, even if the variability of this data was already discussed. Colomer-Mendoza et al. [12], who studied the effect of airflow on biodrying of gardening waste, obtained opposite results, since a higher moisture decrease occurred in the reactors with a bulking agent.
The initial VS was 90.95% weight/dry weight (w/dw). Reductions of VS of about 2% (not statistically significant) and 12% were measured in Test 1 and Test 2, respectively, confirming that a higher temperature caused a higher decomposition of the organic matter [14]. Furthermore, as supposed by Sugni et al. [15] based on their results, the greatest decrease in VS in Test 2 probably occurred because of the lower water loss and so the preservation of microbial activity. Furthermore, since the goal of the biodrying process is a reduction of water with minimum VS reduction [20], it can be concluded that this was achieved mainly in Test 1. This result was confirmed by the calculation of the biodrying efficiency. The estimated efficiencies were 0.97 for Test 1 and 0.81 for Test 2, similar to values reported in the literature for biodrying processes [20,37].
The results of the study of the LF composition are shown in Table 2. In order to investigate the effect of the biodrying process on the several materials present in the LF, the material fraction analysis was repeated on a sample from Test 1, in which a higher water content reduction was detected.
The compostable fraction, in the most part residual food waste, was the predominant fraction, followed by the fine fraction. In these two fractions the highest water contents were detected (57.59% w/w and 51.76% w/w, respectively). Among the plastics, mainly packaging and plastic bags, a significant amount of compostable plastic was found (17% of the total sample), probably used for food waste collection. Contrary to expectation, no significant difference in terms of moisture content was found between conventional and compostable plastic. In the initial LF sample, the weight of the non-compostable fraction was negligible.
The highest moisture reduction due to biodrying was detected in the compostable fraction (40.94%). In addition to the compostable plastic, for the other fractions significant reductions were also found. Due to moisture evaporation and thus weight reduction, the LF composition changed after the trial. In particular, in the same amount of the analyzed sample, the weight of the plastics and of the fine fraction increased by 75% and the 59%, respectively, while the weight of the compostable fraction decreased by 53%. Contrary to the initial one, in the final sample a significant amount of non-compostable plastic was detected.
Comparing the composition of the LF on a dry basis before and after the test, a general reduction in the biodegradable fractions (compostable fraction and bioplastics) can be observed. This is probably due to degradation processes that led to mass loss (VS reduction) and size reduction, as confirmed by the increase in the fine fraction.
The most significant volume reduction (Figure 6), detected during the first 14 days in both the tests, was probably due to a natural auto-compaction effect. At the end of the trials, the volume of biomass was reduced by 28% in Test 1 and 29% in Test 2. In addition, a significant reduction in the sample weight, measured as the difference between the initial and final weight, occurred. A weight loss of 48%, probably due to moisture reduction, was estimated in Test 1. Despite the higher water content reduction achieved in Test 1, a similar weight loss was found in Test 2 (47%). These values were lower than the final weight loss reported by Colomer-Mendoza et al. [12] in trials with and without a bulking agent.

3.3. pH and C:N Ratio

The pH of the LF measured during the trials and the C:N ratio of the initial and final samples are presented in Table 1. The initial LF sample had a relatively low pH (4.47) probably due an anaerobic intermediate temporarily developing during storage and transport. In Test 1, the pH increased to 7.84 in the first 21 days then it remained constant, close to 7.5, a typical value for mature compost. In Test 2, a higher pH was measured (8.68), starting from the second week of aeration, while the pH of the final LF sample was also 7.51 in this case.
The C:N ratio decreased from 21.4 to 10.8 and 15.8 at the end of Test 1 and Test 2, respectively. Other authors also report a reduction in the C:N ratio during the biodrying process. Both the initial and the final C:N ratios were lower than those showed by Navaee-Ardeh et al. [18], who, however, used a different substrate (mixed sludge from a wastewater treatment plant). Similar C:N ratios are presented by Abdullahi et al. [38] in the study of aerobic post-treatment of the anaerobically digested waste.

3.4. Biological Stability

As expected, the values of the biological stability indicators of the final samples were lower than in the initial sample. In particular the RDRI decreased from 1900 mg O2 kg VS−1 h−1 to 1060 mg O2 kg VS−1 h−1 in Test 1 and 839 mg O2 kg VS −1 h−1 in Test 2. Similarly, the initial sample had a GB21 of 316 ± 74 NL kg VS−1, while a biogas production of 194 ± 12 NL kg VS−1 and 167 ± 16 NL kg VS−1 was measured for samples from Test 1 and Test 2, respectively. In both the trials, a high biological stability was achieved and in Test 2 a higher biomass decomposition occurred, since in Test 2 a lower RDRI and GB21 were measured.
The stabilization of the organic fraction in the LF obtained with the simulated biodrying process is an important result in order to effectively comply with the Landfill Directive, reducing landfill impacts such as biogas production, odors and greenhouse gas emissions, as well as leachate production.
In Tambone et al. [16], who investigated the effects of the biodrying process on MSW in a full-scale plant, compared to the RDRI of the initial LF sample measured in this work, lower values were detected for the untreated MSW sample, probably because the microbial activity was found to be limited by the initial moisture content. Regarding the samples after biodrying, the RDRI values of the final LF samples were higher than the values that they found for the treated MSW, but in the same range of the DRI determined under optimal conditions (Potential Dynamic Respiration index).

3.5. Lower Heating Value

The initial LHV of the LF was 10,455 ± 331 kJ/kg. A final LHV of 22,462 ± 661 kJ/kg was measured for Test 1, corresponding to an increase of 115%. Since in Test 2 a lower moisture reduction and higher organic fraction loss were detected, a lower LHV was found (18,041 ± 744 kJ/kg).
Comparing these results with the LHV of the untreated MSW and biodried samples collected directly from a full-scale plant [16], it can be noticed that despite a lower initial LHV, the final LHV achieved in this work was in the same range (18,700–25,800 kJ/kg). The initial and the final LHV of the garden waste measured in Colomer-Mendoza et al. [12] were lower than those presented in this work, but higher increases were obtained in their trials.
The LHV obtained after the biodrying treatment complies with the quality specification of the European standard on refuse-derived fuels (RDF). In particular, considering the LHV obtained, the LF may be considered as an RDF of Class 3 to 1 [39]. Furthermore, since the material fraction analysis showed that the LF is mostly composed of an organic fraction and plastic food packaging, it is possible to suppose that the concentrations of chlorine and mercury are negligible.

4. Conclusions

A significant amount of light fraction is produced by hydromechanical pre-treatment in an AD plant. This material is currently landfilled, leading to high disposal costs and impacts. Two pilot-scale tests were carried out to assess if biodrying could be an effective process to enhance the overall efficiency with respect to the European priorities in waste management. The result showed that a high weight reduction (47–48%) due to moisture loss and an increase in biological stability could be achieved. Moreover, the light fraction obtained after the biodrying process could be used for energy recovery as refuse-derived fuels; in fact, the low heating value obtained after the biodrying treatment complies with the quality specification of the European standard on refuse-derived fuels. In conclusion, drying proved to be a useful treatment applicable to the light fraction from pulper pre-treatment of the organic fraction of municipal solid waste. This first study on light fraction biodrying has demonstrated the feasibility of this process on this specific substrate and encourages future investigations that could investigate the quality of emissions produced by biodrying, or in energy terms the energy loss since the organic material converts to gases.

Author Contributions

Conceptualization, I.P. and D.B.; methodology, I.P.; software, I.P.; validation, I.P., D.B. and R.I.; formal analysis, I.P.; investigation, D.B.; resources, I.P.; data curation, I.P.; writing—original draft preparation, I.P.; writing—review and editing, I.P., D.B. and R.I.; visualization, I.P.; supervision, I.P.; project administration, I.P.; funding acquisition, I.P. All authors have read and agreed to the published version of the manuscript.

Funding

This research was co-funded by PIN s.c.r.l.

Acknowledgments

The authors would like to thank Biotec Sistemi S.r.l. and Biofor Energia S.r.l. for the valuable information and their support to allow this research.

Conflicts of Interest

The authors declare no conflict of interest.

References

  1. European Union. A Sustainable Bioeconomy for Europe: Strengthening the Connection between Economy, Society and the Environment: Updated Bioeconomy Strategy. Available online: https://op.europa.eu:443/en/publication-detail/-/publication/edace3e3-e189-11e8-b690-01aa75ed71a1/language-en (accessed on 6 February 2020).
  2. Baldi, F.; Pecorini, I.; Iannelli, R. Comparison of single-stage and two-stage anaerobic co-digestion of food waste and activated sludge for hydrogen and methane production. Renew. Energy 2019, 143, 1755–1765. [Google Scholar] [CrossRef]
  3. EUR-Lex -31999L0031 –EN. Available online: https://eur-lex.europa.eu/legal-content/EN/TXT/HTML/?uri=CELEX:31999L0031&from=EN (accessed on 6 February 2020).
  4. Scaglia, B.; Salati, S.; Di Gregorio, A.; Carrera, A.; Tambone, F.; Adani, F. Short mechanical biological treatment of municipal solid waste allows landfill impact reduction saving waste energy content. Bioresour. Technol. 2013, 143, 131–138. [Google Scholar] [CrossRef] [PubMed]
  5. Pognani, M.; Barrena, R.; Font, X.; Scaglia, B.; Adani, F.; Sánchez, A. Monitoring the organic matter properties in a combined anaerobic/aerobic full-scale municipal source-separated waste treatment plant. Bioresour. Technol. 2010, 101, 6873–6877. [Google Scholar] [CrossRef] [PubMed] [Green Version]
  6. Municipal Waste Statistics -Statistics Explained. Available online: https://ec.europa.eu/eurostat/statistics-explained/index.php/Municipal_waste_statistics (accessed on 6 February 2020).
  7. Mata-Alvarez, J.; Macé, S.; Llabrés, P. Anaerobic digestion of organic solid wastes. An overview of research achievements and perspectives. Bioresour. Technol. 2000, 74, 3–16. [Google Scholar] [CrossRef]
  8. Francini, G.; Lombardi, L.; Freire, F.; Pecorini, I.; Marques, P. Environmental and Cost Life Cycle Analysis of Different Recovery Processes of Organic Fraction of Municipal Solid Waste and Sewage Sludge. Waste Biomass Valorization 2019, 10, 3613–3634. [Google Scholar] [CrossRef]
  9. Drennan, M.F.; DiStefano, T.D. Characterization of the curing process from high-solids anaerobic digestion. Bioresour. Technol. 2010, 101, 537–544. [Google Scholar] [CrossRef]
  10. He, P.; Zhao, L.; Zheng, W.; Wu, D.; Shao, L. Energy Balance of a Biodrying Process for Organic Wastes of High Moisture Content: A Review. Dry. Technol. 2013, 31, 132–145. [Google Scholar] [CrossRef]
  11. Winkler, M.-K.H.; Bennenbroek, M.H.; Horstink, F.H.; van Loosdrecht, M.C.M.; van de Pol, G.-J. The biodrying concept: An innovative technology creating energy from sewage sludge. Bioresour. Technol. 2013, 147, 124–129. [Google Scholar] [CrossRef]
  12. Colomer-Mendoza, F.J.; Herrera-Prats, L.; Robles-Martínez, F.; Gallardo-Izquierdo, A.; Piña-Guzmán, A.B. Effect of airflow on biodrying of gardening wastes in reactors. J. Environ. Sci. 2013, 25, 865–872. [Google Scholar] [CrossRef] [Green Version]
  13. Velis, C.A.; Longhurst, P.J.; Drew, G.H.; Smith, R.; Pollard, S.J.T. Biodrying for mechanical–biological treatment of wastes: A review of process science and engineering. Bioresour. Technol. 2009, 100, 2747–2761. [Google Scholar] [CrossRef] [Green Version]
  14. Adani, F. The influence of biomass temperature on biostabilization–biodrying of municipal solid waste. Bioresour. Technol. 2002, 83, 173–179. [Google Scholar] [CrossRef]
  15. Sugni, M.; Calcaterra, E.; Adani, F. Biostabilization-biodrying of municipal solid waste by inverting air-flow. Bioresour. Technol. 2005, 96, 1331–1337. [Google Scholar] [CrossRef] [PubMed]
  16. Tambone, F.; Scaglia, B.; Scotti, S.; Adani, F. Effects of biodrying process on municipal solid waste properties. Bioresour. Technol. 2011, 102, 7443–7450. [Google Scholar] [CrossRef] [PubMed]
  17. Slezak, R.; Krzystek, L.; Ledakowicz, S. Biological drying of municipal solid waste from landfill. Dry. Technol. 2020, 38, 189–199. [Google Scholar] [CrossRef]
  18. Navaee-Ardeh, S.; Bertrand, F.; Stuart, P.R. Key variables analysis of a novel continuous biodrying process for drying mixed sludge. Bioresour. Technol. 2010, 101, 3379–3387. [Google Scholar] [CrossRef]
  19. Cai, L.; Chen, T.-B.; Gao, D.; Zheng, G.-D.; Liu, H.-T.; Pan, T.-H. Influence of forced air volume on water evaporation during sewage sludge bio-drying. Water Res. 2013, 47, 4767–4773. [Google Scholar] [CrossRef]
  20. Huiliñir, C.; Villegas, M. Biodrying of pulp and paper secondary sludge: Kinetics of volatile solids biodegradation. Bioresour. Technol. 2014, 157, 206–213. [Google Scholar] [CrossRef]
  21. Sharara, M.A.; Sadaka, S.; Costello, T.A.; VanDevender, K. Influence of Aeration Rate on the Physio-Chemical Characteristics of Biodried Dairy Manure -Wheat Straw Mixture. Appl. Eng. Agric. 2012, 28, 407–415. [Google Scholar] [CrossRef]
  22. Bioconversion of waste (water)/residues to bioplastics- A circular bioeconomy approach. Bioresour. Technol. 2020, 298, 122584. [CrossRef]
  23. Zhang, D.-Q.; He, P.-J.; Jin, T.-F.; Shao, L.-M. Bio-drying of municipal solid waste with high water content by aeration procedures regulation and inoculation. Bioresour. Technol. 2008, 99, 8796–8802. [Google Scholar] [CrossRef]
  24. Gómez, R.B.; Lima, F.V.; Ferrer, A.S. The use of respiration indices in the composting process: A review. Waste Manag. Res. 2006, 24, 37–47. [Google Scholar] [CrossRef] [Green Version]
  25. Pecorini, I.; Iannelli, R. Characterization of excavated waste of different ages in view of multiple resource recovery in a landfill mining. Sustainability (Switz.) 2020, 12, 1780. [Google Scholar] [CrossRef] [Green Version]
  26. Hemidat, S.; Saidan, M.; Al-Zu’bi, S.; Irshidat, M.; Nassour, A.; Nelles, M. Potential Utilization of RDF as an Alternative Fuel for the Cement Industry in Jordan. Sustainability 2019, 11, 5819. [Google Scholar] [CrossRef] [Green Version]
  27. AMPA 2001. Available online: http://www.isprambiente.gov.it/it/pubblicazioni/manuali-e-linee-guida/metodi-di-analisi-del-compost (accessed on 27 February 2020).
  28. Barrington, S. Effect of carbon source on compost nitrogen and carbon losses. Bioresour. Technol. 2002, 83, 189–194. [Google Scholar] [CrossRef]
  29. Gazzetta Ufficiale. Available online: https://www.gazzettaufficiale.it/atto/serie_generale/caricaDettaglioAtto/originario?atto.dataPubblicazioneGazzetta=1989-08-23&atto.codiceRedazionale=089A3532&elenco30giorni=false (accessed on 7 February 2020).
  30. Adani, F.; Ubbiali, C.; Generini, P. The determination of biological stability of composts using the Dynamic Respiration Index: The results of experience after two years. Waste Manag. 2006, 26, 41–48. [Google Scholar] [CrossRef]
  31. Cossu, R.; Raga, R. Test methods for assessing the biological stability of biodegradable waste. Waste Manag. 2008, 28, 381–388. [Google Scholar] [CrossRef]
  32. Pecorini, I.; Baldi, F.; Iannelli, R. Biochemical hydrogen potential tests using different inocula. Sustainability (Switz.) 2019, 11, 622. [Google Scholar] [CrossRef] [Green Version]
  33. Pecorini, I.; Olivieri, T.; Bacchi, D.; Paradisi, A.; Lombardi, L.; Corti, A.; Carnevale, E. Evaluation of Gas Production in a Industrial Anaerobic Digester by Means of Biochemical Methane Potential of Organic Municipal Solid Waste Components. In Proceedings of the 25th International Conference on Efficiency, Cost, Optimization, Simulation and Environmental Impact of Energy Systems, Perugia, Italy, 26–29 June 2012; Volume 5, pp. 173–184. [Google Scholar]
  34. Pecorini, I.; Baldi, F.; Carnevale, E.A.; Corti, A. Biochemical methane potential tests of different autoclaved and microwaved lignocellulosic organic fractions of municipal solid waste. Waste Manag. 2016, 56, 143–150. [Google Scholar] [CrossRef]
  35. Baldi, F.; Iannelli, R.; Pecorini, I.; Polettini, A.; Pomi, R.; Rossi, A. Influence of the pH control strategy and reactor volume on batch fermentative hydrogen production from the organic fraction of municipal solid waste. Waste Manag. Res. 2019, 37, 478–485. [Google Scholar] [CrossRef] [Green Version]
  36. Zhao, L.; Gu, W.-M.; He, P.-J.; Shao, L.-M. Effect of air-flow rate and turning frequency on bio-drying of dewatered sludge. Water Res. 2010, 44, 6144–6152. [Google Scholar] [CrossRef]
  37. Zawadzka, A.; Krzystek, L.; Stolarek, P.; Ledakowicz, S. Biodrying of Organic Fraction of Municipal Solid Wastes. Dry. Technol. 2010, 28, 1220–1226. [Google Scholar] [CrossRef]
  38. Abdullahi, Y.A.; Akunna, J.C.; White, N.A.; Hallett, P.D.; Wheatley, R. Investigating the effects of anaerobic and aerobic post-treatment on quality and stability of organic fraction of municipal solid waste as soil amendment. Bioresour. Technol. 2008, 99, 8631–8636. [Google Scholar] [CrossRef] [PubMed]
  39. UNI EN 15359:2011. Available online: http://store.uni.com/catalogo/uni-en-15359-2011?josso_back_to=http://store.uni.com/josso-security-check.php&josso_cmd=login_optional&josso_partnerapp_host=store.uni.com (accessed on 6 February 2020).
Figure 1. Annual evolution of the total solid contents of the light fraction (LF).
Processes 08 00276 g001
Figure 2. Scheme of the pilot-scale biodrying reactors.
Processes 08 00276 g002
Figure 3. The temperature and environmental conditions evolution in Test 1.
Processes 08 00276 g003
Figure 4. The temperature and environmental conditions evolution in Test 2.
Processes 08 00276 g004
Figure 5. Daily average environmental temperature and daily average biomass temperatures (at 55 cm of depth).
Processes 08 00276 g005
Figure 6. Volume reduction in Test 1 and Test 2.
Processes 08 00276 g006
Table 1. Summary of the airflow rates and LF samples’ physicochemical characteristics.
Test DaysAirflow RatesTSVSpHC/N
(L h−1 kg dw−1)(% w/w)(% w/dw) (% w/w)
Initial0-48.49 ± 1.9890.95 ± 3.514.4721.4
Test 10–724.951.5191.956.38
7–1424.964.0492.887.77
14–2118.665.4591.097.84
21–2812.460.8792.397.53
28–350.088.92 ± 5.7589.03 ± 4.807.5510.8
Test 20–728.547.7694.186.49
7–1428.543.7089.448.68
14–2121.482.5689.397.41
21–2814.275.7686.638.50
28–350.079.97 ± 13.1280.25 ± 5.487.5115.8
Table 2. Material composition analysis.
Material FractionLF Initial LF Final (Test 1)
CompositionTSComposition%TSComposition
(% w/w)(% w/w)(% w/dw)(w/w)(% w/w)(% w/dw)
Plastics471.366776.088
Compostable plastic1770.85241969.3120
Compostable fraction5142.31432465.9324
Non-compostable fraction---976.3411
Textiles652.476661.226
Fine fraction (<10 mm)2248.24213558.0331

