Article

Production of Protein Hydrolysate Containing Antioxidant and Angiotensin -I-Converting Enzyme (ACE) Inhibitory Activities from Tuna (Katsuwonus pelamis) Blood

by
Natthaphon Mongkonkamthorn
1,
Yuwares Malila
2,
Suthasinee Yarnpakdee
1,
Sakunkhun Makkhun
3,
Joe M. Regenstein
4 and
Sutee Wangtueai
1,5,*
1
Faculty of Agro-industry, Chiang Mai University, Chiang Mai 50100, Thailand
2
National Center for Genetic Engineering and Biotechnology, Khlong Nueng, Khlong Luang, Pathum Thani 12120, Thailand
3
Faculty of Agriculture and Natural Resources, University of Phayao, Phayao 56000, Thailand
4
Department of Food Science, College of Agriculture and Life Science, Cornell University, Ithaca, NY 14853-7201, USA
5
College of Maritime Studies and Management, Chiang Mai University, Samut Sakhon 74000, Thailand
*
Author to whom correspondence should be addressed.
Processes 2020, 8(11), 1518; https://doi.org/10.3390/pr8111518
Submission received: 10 November 2020 / Revised: 18 November 2020 / Accepted: 19 November 2020 / Published: 22 November 2020
(This article belongs to the Section Food Process Engineering)

Abstract

:
Tuna blood (TB) was subjected to enzymatic hydrolysis. The effects of the relationship of hydrolysis time (30–180 min) and enzyme concentration (0.5–3.0% w/w protein) on the degree of hydrolysis (DH), yield, antioxidant and angiotensin-I-converting enzyme (ACE) inhibitory activities were determined. The response surface methodology (RSM) showed that TB hydrolysis’s optimum conditions were hydrolysis for 180 min and Alcalase, Neutrase or Flavourzyme at 2.81%, 2.89% or 2.87% w/w protein, respectively. The hydrolysates with good DH (40–46%), yield (3.5–4.6%), the IC50 of DPPH (0.8–1.6 mg/mL) and ABTS (1.0–1.4 mg/mL) radical scavenging activity, ferric reducing antioxidant power (FRAP) value (0.28–0.65 mmol FeSO4/g) and IC50 of ACE inhibitory activity (0.15–0.28 mg/mL) were obtained with those conditions. The TB hydrolysate using Neutrase (TBHN) was selected for characterization in terms of amino acid composition, peptide fractions and sensory properties. The essential, hydrophobic and hydrophilic amino acids in TBHN were ~40%, 60% and 20% of total amino acids, respectively. The fraction of molecular weight <1 kDa showed the highest antioxidant and ACE inhibitory activities. Fishiness and bitterness were the main sensory properties of TBHN. Fortification of TBHN in mango jelly at ≤ 0.5% (w/w) was accepted by consumers as like moderately to like slightly, while mango jelly showed strong antioxidant and ACE inhibitory activities. TBHN could be developed for natural antioxidants and antihypertensive peptides in food and functional products.

1. Introduction

Tuna canning is a major fish processing industry. Over 75% of tuna captured in the world are supplied for canned tuna production with commercial species such as skipjack (Katsuwonus pelamis), albacore (Thunnus alalonga), yellowfin (Thunnus albacares) and bigeye (Thunnus obesus) [1]. Canned tuna processing leaves >60% byproducts such as 20–30% head, bones and gill, 10–13% dark meat, 7–12% blood and 5–7% viscera. Fresh tuna blood (TB) from bleeding and/or heading are normally released into the wastewater treatment system [2]. Hence, a large amount of blood is generated by the tuna canning industry. The utilization of TB could enhance the economic value and environmental sustainability. TB has ~5–6% crude protein [3] that might be recovered and used as a highly valued product. The utilization of animal blood for bioactive hydrolysates has been reported for chicken blood hydrolysate [4,5], pig hemoglobin and blood hydrolysates [6,7] and for deer, sheep, pig and cattle red blood hydrolysate [8].
Recently, bioactive fish protein hydrolysates (FPH) derived from various fish byproducts using enzymes hydrolysis have been studied [9,10] and shown to have beneficial health-promoting and nutritional functions. FPH has also been studied as food-derived biopeptides with bioactive compounds and essential nutrients [11,12]. Functional properties of hydrolysate depend on the source of protein substrate and employed protease [13]. Based on hydrolysate’s peptide characteristics including molecular weight (MW), amino acids composition and sequences and hydrophobic amino acids, various bioactive activities such as antibacterial, antihypertensive, antiproliferative, antioxidative, hypoglycemic and anti-inflammatory activities have been observed [10].
Antihypertensive properties of peptides are those able to inactivate the angiotensin-converting enzyme (ACE), which has an important role in regulating blood pressure. Hypertensive patients are currently treated with a synthetic drug such as captopril that acts by inhibiting ACE, but these may have side effects [11]. Antioxidants peptides can inhibit the formation of radicals by inhibiting the transition-metal-catalyzed free radical production from hydroperoxides or prevent the reaction of free radicals by hydrogen donation [14]. The prevention of oxidative stress may help prevent several diseases [15], while incorporating it into food matrices might retard oxidation processes [11].
In this study, fresh TB was collected from the heading process at a canned tuna processing plant. The functional properties of the TB proteins were modified using enzymatic hydrolysis. Therefore, the objectives of this study were to determine the optimum conditions for three commercial hydrolysis enzymes (Alcalase, Neutrase and Flavourzyme), to obtain TB hydrolysate with high antioxidant and ACE inhibitory activities and to partially purify them and begin to evaluate their sensory properties. In addition, another objective was to examine the potential application of the TB hydrolysate when applied in a food product, e.g., mango jelly.

2. Materials and Methods

2.1. Raw Materials and Preparation

TB (skipjack, Katsuwonus pelamis) was obtained from the heading process of canned tuna processing (Thai Union Group PCL, Samut Sakhon, Thailand). The 2 kg of TB was packed into a polyethylene plastic bag, kept in ice with the TB to ice ratio at 1:2 (w/w) and transported to the laboratory of the College of Maritime Studies and Management, Chiang Mai University, Samut Sakhon within 30 min. Upon arrival, the TB was transferred into a Ziploc plastic bag with 300 mL/bag and stored at −18 to −20 °C until further use (not exceeding 2 months). Proximate composition was done using the Association of Official Analytical Chemists (AOAC)methods [16]. The TB moisture, crude protein, ash and fat were 90.8% ± 0.1%, 5.72% ± 0.04%, 3.89% ± 0.02% and 0.48% ± 0.02% wet basis, respectively.

2.2. Enzymes and Chemicals

Alcalase (activity ≥2.4 U/g), Neutrase (activity ≥0.8 U/g), Flavourzyme (activity ≥500 U/g), hippuryl-L-histidyl-L-leucine (HHL), angiotensin-I-converting enzyme (ACE), 2,2-diphenyi-l-picrylhydrazyl radical (DPPH), 2,2′-azinobis-(3-ethylbenzthiazoline-6-sulfonic acid) (ABTS+), 2,4,6-tripyridyl-s-triazine (TPTZ) and ferric chloride hexahydrate (FeCl3·6H2O) were purchased from the Sigma-Aldrich Co. (St. Louis, MO, USA). Other chemicals and reagents used were analytical grade.

2.3. Preparation of TB Hydrolysate (TBH)

An amount of 300 mL of frozen TB was thawed at 4 °C–5 °C for 14–16 h and heated at 95 °C for 15 min to inactivate the endogenous enzymes. The pH of TB was adjusted to 7.0 using 0.1 M NaOH or 0.1 M HCl. TB hydrolysis using the three enzymes was carried out between 30 and 180 min and enzyme concentration between 0.5% and 3% (w/w crude protein in TB). The hydrolysis process was done in a shaking water bath (WNB Basic/Nenntemp, Schwabach, Germany) at 150 rpm at hydrolysis temperatures of 60, 50 and 50 °C for Alcalase, Neutrase and Flavourzyme, respectively. The mixture was heated at 95 °C for 15 min to terminate the enzyme reaction, cooled in running tap water and centrifuged (NF 400R, NUVE, Ankara, Turkey) at 4000× g at 4 °C for 20 min. The supernatant was then freeze-dried (7948030 Labconco, Kansas City, MO, USA) to obtain TBH powder.

2.4. Determination of Degree of Hydrolysis (DH) and Yield

The DH of TBH was determined using the method of Intarasirisawat et al. [17]. The appropriately diluted TBH (125 µL) was mixed with the 0.2 M sodium phosphate buffer, pH 8.2 (2 mL) and 0.01% TNBS solution (1.0 mL) and incubated at 50 °C for 30 min in the dark. The reaction was stopped by adding the 0.1 M Na2SO3 (2 mL). The mixture was left at 25 °C–26 °C for 15 min and the absorbance measured using a microplate reader (SpectraMax i3x/Molecular Devices, San Jose, CA, USA) at 420 nm and α-amino groups were expressed in term of L-leucine. The DH was determined using the following equation:
DH% = [(Lt − L0)/(Lmax − L0)] × 100
where Lt is the total number of α-amino groups measured at time. L0 is the total number of α-amino groups at t0. Lmax is the total number of α-amino groups obtained after hydrolysis using 6 N of HCl solution at 100 °C for 24 h.
The yield of TBH was calculated gravimetrically after freeze-drying. The proportion (%) of the dry weight of freeze-dried TBH was determined with the wet weight of TB. The yield of TB hydrolysates was calculated as follows:
Yield % = [weight of freeze − dried TBH (g)/weight of TB (g)] × 100

2.5. Antioxidant In Vitro Assays

2.5.1. DPPH Radical Scavenging Activity

The DPPH radical scavenging activity of TBH was determined using the method of Ahn et al. [18]. The TBH solution (20 µL) was mixed with 200 µL 0.05 mM DPPH in 95% ethanol and incubated in the dark for 30 min; then, the absorbance was measured at 517 nm. Deionized water (DI) (Polysci Service Co., Ltd., Bangkok, Thailand) was used instead of the sample as a control. The DPPH radical scavenging activity was determined using the following equation:
DPPH radical scavenging activity (%) = [(A517 control − A517 sample)/A517 control] × 100
where A517 control is the absorbance of a control and A517 sample is the absorbance of TBH. The DPPH scavenging activity was plotted against concentration and the IC50 (the TBH concentration providing 50% of DPPH radicals scavenging activity) was calculated from the graph using linear regression analysis.

2.5.2. ABTS Radical Scavenging Activity

The ABTS radical scavenging activity of TBH was determined using the method of Ahn et al. [18]. The ABTS stock solution was prepared by mixing 7 mM ABTS and 2.45 mM K2S2O8 and kept in the dark for 16–18 h at 4 °C, while the ABTS working solution was prepared by diluting ABTS stock solution with 95% ethanol to obtain an absorbance of 0.7 ± 0.02 at 734 nm. TBH (20 µL) was mixed with 200 µL ABTS working solution and kept in the dark for 8 min. The absorbance was measured at 734 nm. The DI water was used instead of the sample as a control. The ABTS radical scavenging activity was determined using the equation:
ABTS scavenging activity (%) = [(A734 control − A734 sample)/A734 control] × 100
where A734 control is the absorbance of a control and A734 sample is the absorbance of a sample. The ABTS scavenging activity was plotted against concentration and the IC50 (the TBH concentration providing 50% of ABTS radicals scavenging activity) was calculated as previously described.

2.5.3. Ferric Reducing Antioxidant Power (FRAP)

The FRAP assay for TBH used the method of Wangtueai et al. [19]. The FRAP solution contained 25 mL 300 mM acetate buffer (pH 3.6), 2.5 mL 10 mM TPTZ in 40 mM HCl and 2.5 mL 10 mM FeCl3·6H2O. This mixture was incubated in a water bath (Memmert GmbH, Schwabach, WNB, Germany) at 37 °C for 30 min. FRAP solution was always freshly prepared. TBH (10 µL) was added to 200 µL FRAP, incubated in the dark for 30 min and then measured at 595 nm. The FeSO4·7H2O was used to prepare a standard curve and the FRAP assay was expressed as mmol FeSO4/g TBH.

2.6. ACE Inhibitory Activity

The ACE inhibitory activity was determined using a slightly modified method of Kasiwut et al. [20]. TBH (50 µL) was mixed with 50 µL 25 mU/mL ACE solution and kept in the water bath at 37 °C for 10 min; then, 150 µL of substrate solution (8.3 mM hippuryl-L-histidyl-L-leucine in 50 mM sodium borate buffer containing 0.3 M NaCl at pH 8.3) was added and incubated in the water bath at 37 °C for 30 min and HCl (250 µL, 1.0 M) was added to terminate the reaction. Hippuric acid was extracted using 0.5 mL ethyl acetate. The mixture was centrifuged at 4000×g for 15 min at 25 °C. The supernatant was evaporated at 90 °C for 15 min using a hot air oven (R3-Controller, Binder, Tuttlingen, Germany). Hippuric acid was dissolved in 1.0 mL DI water and the absorbance at 228 nm was obtained using a spectrophotometer (SPECORD 50 PLUS, Analytikjena, Jena, Germany). The ACE inhibitory activity was determined using the following equation:
ACE inhibitory activity (%) = (Ec − Es)/(Ec − Eb) × 100
where Ec is the absorbance of the enzyme–substrate complex without a sample, Es is the absorbance of the enzyme–substrate complex and a sample and Eb is the absorbance of the enzyme and a sample without a substrate. The ACE inhibitory activity was plotted against concentration of TBH and the IC50 (the TBH concentration providing 50% of ACE inhibitory activity) was calculated as previously described.

2.7. Amino Acid Analysis

The determination of the amino acid composition of TBH was done according to AOAC official number 994.12 and 988.15 [16] with gas chromatography–mass spectrometry (GC–MS). Amino acids were compared with an amino acid standard (Phenomenex, Torrance, CA, USA). They are expressed in g amino acid/100 g of TBH.

2.8. Fractionation of Hydrolysates

Freeze-dried TBH was dissolved with DI water (10% w/v) and fractioned through ultrafiltration membranes of regenerated cellulose (Merck KGaA, Darmstadt, Germany) using a 200 mL Amicon® stirred cell (Merck KGaA). The MW cutoff membranes of 10, 3–10 and 1 kDa resulted in four fractions (MW >10, 3–10, 1–3 and <1 kDa). These were obtained and freeze-dried.

2.9. Sensory Evaluation of Hydrolysate and Fortified Fruit Jelly

The 0.5 and 1.0% (w/v) of TBH solutions were prepared for sensory evaluation. The samples were warmed (40 °C), placed in glass cups (10 mL) with a cover and presented to the panelists. Sensory evaluation was done using 10 trained panelists (graduated students ages 23–30) using a slightly modified method of Yarnpakdee et al. [21]. The TBH solutions were evaluated individually using a 15-cm-line-scale for the attributes of fishy odor, fishy flavor and bitterness with 10% (w/v) of TBH used to calibrate the line (highest score, 15).
Mango jellies (57.85% mango, 25% water, 2% agar, 5% sugar, 5% maltodextrin, 3% sorbitol, 2% calcium lactate, 0.1% salt and 0.05% ascorbic acid) with and without TBH were prepared. TBH was added into mango jellies at 0.5, 0.75 and 1.0% (w/w). The resulting jellies were subjected to biofunctional determination (antioxidant and ACE inhibitory activity) and sensory evaluation. The sensory evaluation of jellies was conducted using 50 untrained panelists; most of them were undergraduate and graduate students with the ages 20–30. The assessment was done for appearance, color, fishy odor, flavor, taste and bitterness using a nine-point hedonic scale. In addition, they were asked questions about the intensity level of fishy odor and bitterness and product acceptability. A five-point scale (1 = too light, 3 = just-about-right, 5 = too strong) was used to evaluate the intensity of fishy odor and bitterness.

2.10. Experimental Design and Statistical Analysis

The response surface methodology (RSM) with a central composite design (CCD) was used to determine the optimum conditions for TB hydrolysis using three commercial enzymes. The effects of hydrolysis time (X1, 30–180 min) and enzyme concentration (X2, 0.5–3.0%) on the degree of hydrolysis (DH) (%), yield (%), the IC50 of DPPH radical scavenging activity (mg/mL), the IC50 of ABTS radical scavenging activity (mg/mL), FRAP value (mmol FeSO4/g) and the IC50 of ACE inhibitory activity (mg/mL) were determined. Design Expert software (version 11, Stat-Ease Inc., Minneapolis, MN, USA) was used for experimental design, data analysis, model fitting and response surface plots. The experimental data were fitted to a quadratic model. The quadratic model equation is of the following form:
Yi = b0 + b1×x 1 + b2×x2 + b11×x12 + b22×x22 + b12×x1×x2 + ε
The function Yi represents response variables or dependent variables, x1 and x2 are independent variables, ε represents the random error, and b0, b1, b2, b11, b22 and b12 are the coefficients for the constant and the linear, quadratic and interaction terms. One-way analysis of variance (ANOVA) and Duncan’s new multiple range test (DMRT) for means comparison were conducted using SPSS software version 17 (SPSS Inc., Chicago, IL, USA). The significance level was set at p ≤ 0.05.

3. Results and Discussion

The TB was separately hydrolyzed using three commercial proteolytic enzymes, namely Alcalase, Neutrase and Flavourzyme for obtaining the optimum TB hydrolysate productions. Alcalase and Neutrase are endopeptidases capable of hydrolyzing proteins with broad specificity for peptide bonds and preference for the uncharged residue, whereas Flavourzyme is a mixture of endo- and exopeptidase, which can produce both free amino acids and peptides [13,22,23].

3.1. Fitting the Models

The optimization of TB hydrolysis conditions was conducted using RSM with CCD. The results of all 11 experimental runs and three replicates are shown in Table 1. The DH (Y1) ranged from 21.1% to 41.7%, yield (Y2) ranged from 2.04% to 4.48%, the IC50 of DPPH radical scavenging activity (DPPH, Y3) ranged from 0.81 to 3.42 mg/mL, the IC50 of ABTS radical scavenging activity (ABTS, Y4) ranged from 1.02 to 3.19 mg/mL, FRAP value (FRAP, Y5) ranged from 0.15 to 0.66 mmol FeSO4/g and the IC50 of ACE inhibitory activity (ACE, Y6) ranged from 0.14 to 0.94 mg/mL. The second-order response surface model, in terms of actual value, including linear (X1, X2), interaction (X1X2) and quadratic terms (X12, X22), was generated. ANOVA showed highly significant (p ≤ 0.05) results for all response models of each enzyme together with insignificant p > 0.05 values for the lack of fit. The coefficients of determination (R2) of all models were in the range of 0.89–0.99% (Table 2), which indicated that these models could adequately fit the experimental data for all the response variables as previously described by Wangtueai et al. [24].

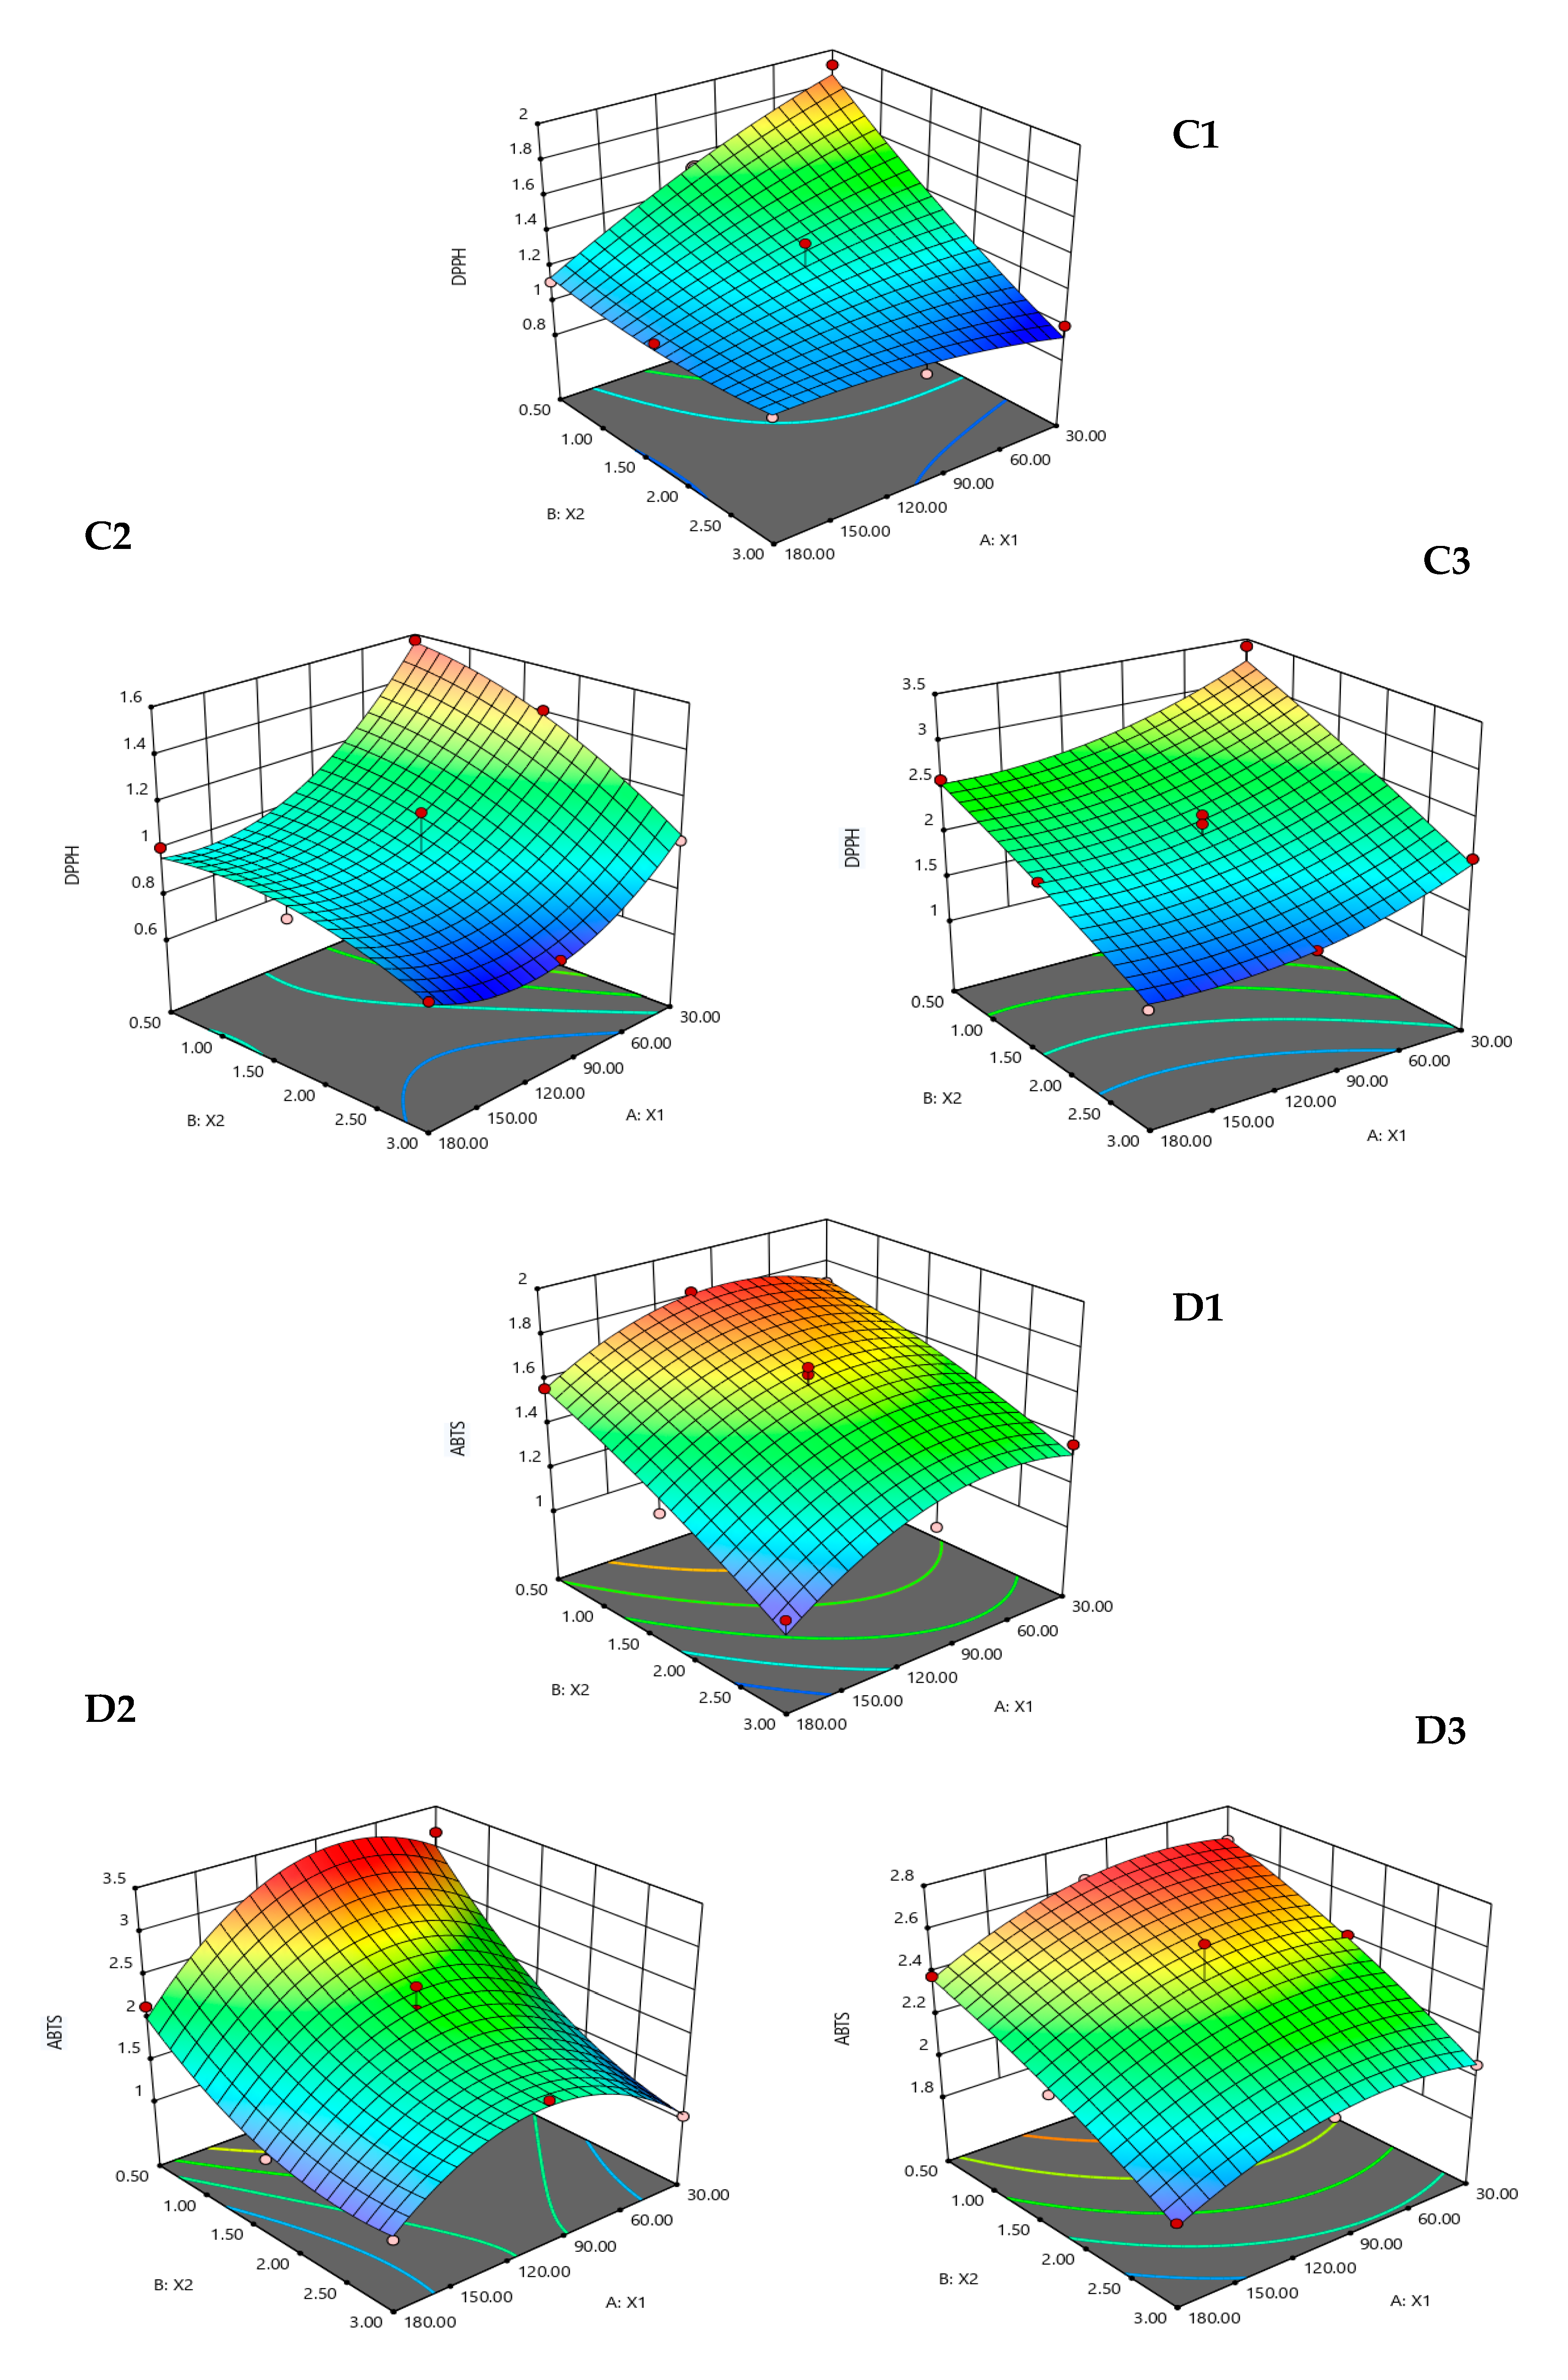
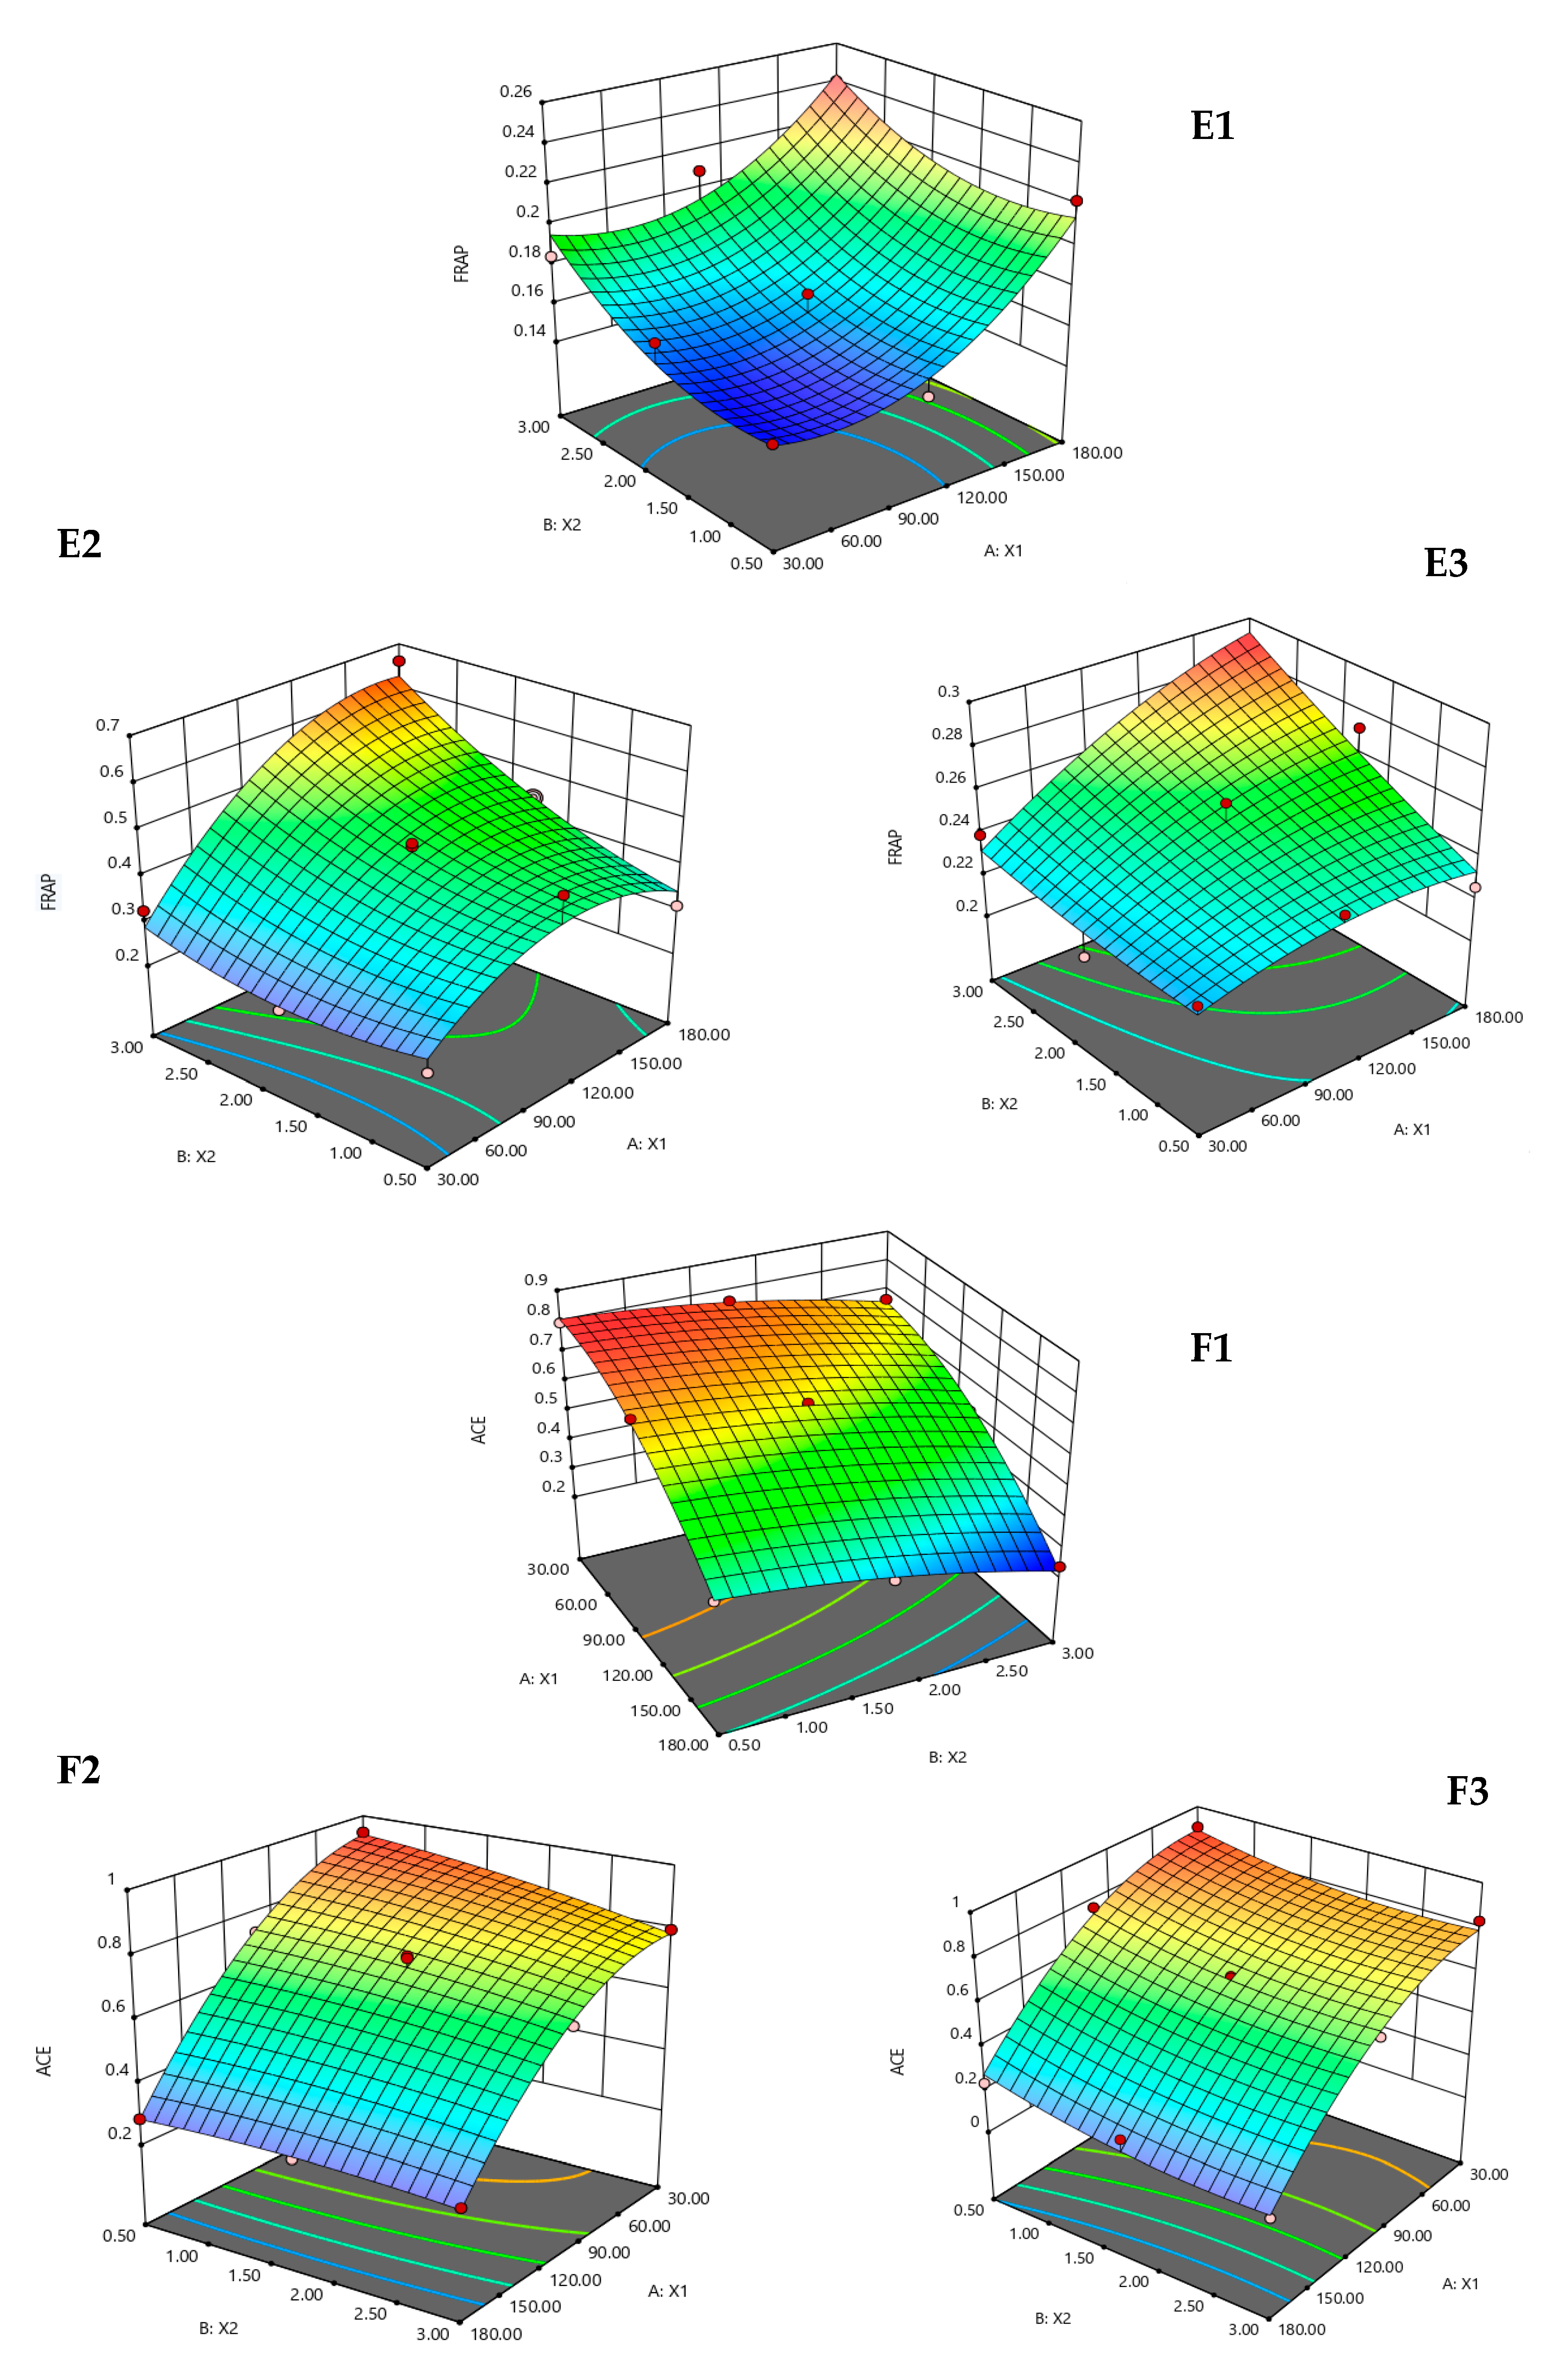
3.2. Effect of the Hydrolysis Conditions on the Responses

The independent variables’ effects on the DH are shown in Figure 1(A1–A3). The hydrolysis time (X1) and the concentration (X2) of each enzyme were the main effect on the DH (Figure 2), whereas both independent variables had no interaction effects on the DH (Figure 3). Increased hydrolysis time and concentration of each enzyme increased DH (Figure 2). DH is an indicator of the progress of the hydrolysis. It shows the ability of the enzyme to cleave the peptide bonds [25]. Higher enzyme concentration increases peptide breakdown, as does increasing hydrolysis time [26,27]. However, Li et al. [28] and Ghanbari et al. [29] reported that the DH increased but then dropped and became stable due to substrate depletion.
The results for the yield of TBH are shown in Figure 1(B1–B3). Both hydrolysis time and enzyme concentration were the main effects on yield (Figure 2), while interaction effects between the two independent variables are shown in Figure 3. The hydrolysate yield increased with time and concentration, noting that each peptide cleavage adds a water molecule to the yield [30]. Similar results have been reported for frame meat of striped catfish using Alcalase with a yield increase from 7.03% to 9.85% with increased enzyme concentration [31]. Moreover, the yield was influenced by type of substrate or protease, pH and incubation temperature [32].
The effect of independent variables on the antioxidant activity (DPPH, ABTS, and FRAP) of TBH are shown in Figure 1(C1–C3,D1–D3,E1–E3), respectively. The hydrolysis time and enzyme concentration were the main effects on the IC50 of DPPH and ABTS scavenging activity and FRAP value of TBH (Figure 2), while interaction effects of independent variables were not observed (Figure 3). The antioxidant activity of TBH increased significantly with time and enzyme concentration. Greater hydrolysis might yield lower MW peptides with a higher likelihood of being bioactive as metal chelating and/or effective proton or electron donors that could react with unstable DPPH or ABTS free radicals to transform to a stable form that leads to the termination of the radical reaction [33]. Nasri et al. [34] reported that a short chain peptide of goby muscle hydrolysate with higher antioxidative properties was produced by increasing DH from 15% to 64%. Ghanbari et al. [29] reported that increased hydrolysis time had a positive effect on DPPH scavenging activity of sea cucumber hydrolysates using Alcalase and Flavourzyme. These higher antioxidant activities might be related to an endopeptidase effect, leading to the breaking down of interior peptide bonds to generate short or medium chain oligopeptides with higher antioxidative activity. This is consistent with various reports showing that a small peptide from cobia and Raja clavata skin hydrolysates [35], hydrolysates from blood cockle (Tegillarca granosa) [36] and blue mussel (Mytilus edulis) [37] showed strong antioxidant activity.
The effects of the independent variables on the ACE inhibitory activity of TBH are shown in Figure 1(F1–F3). Both independent variables were the main effects on ACE inhibitory activity (Figure 2), while there was no interaction effect (Figure 3). THB had higher ACE inhibitory activity with time and concentration. This was consistent with Wu et al. [38], who reported that the ACE-inhibitory activity of lizardfish (Saurida elongata) muscle protein hydrolysates increased with time and the enzyme:substrate ratio. Maximum cleavage to small peptides was attributed to the increased DH and ACE inhibition activity [29,38]. Kasiwut et al. [20] reported that a tuna cooking juice hydrolysate using Alcalase with a high DH value contained low MW peptides and showed a high ACE inhibitory activity.

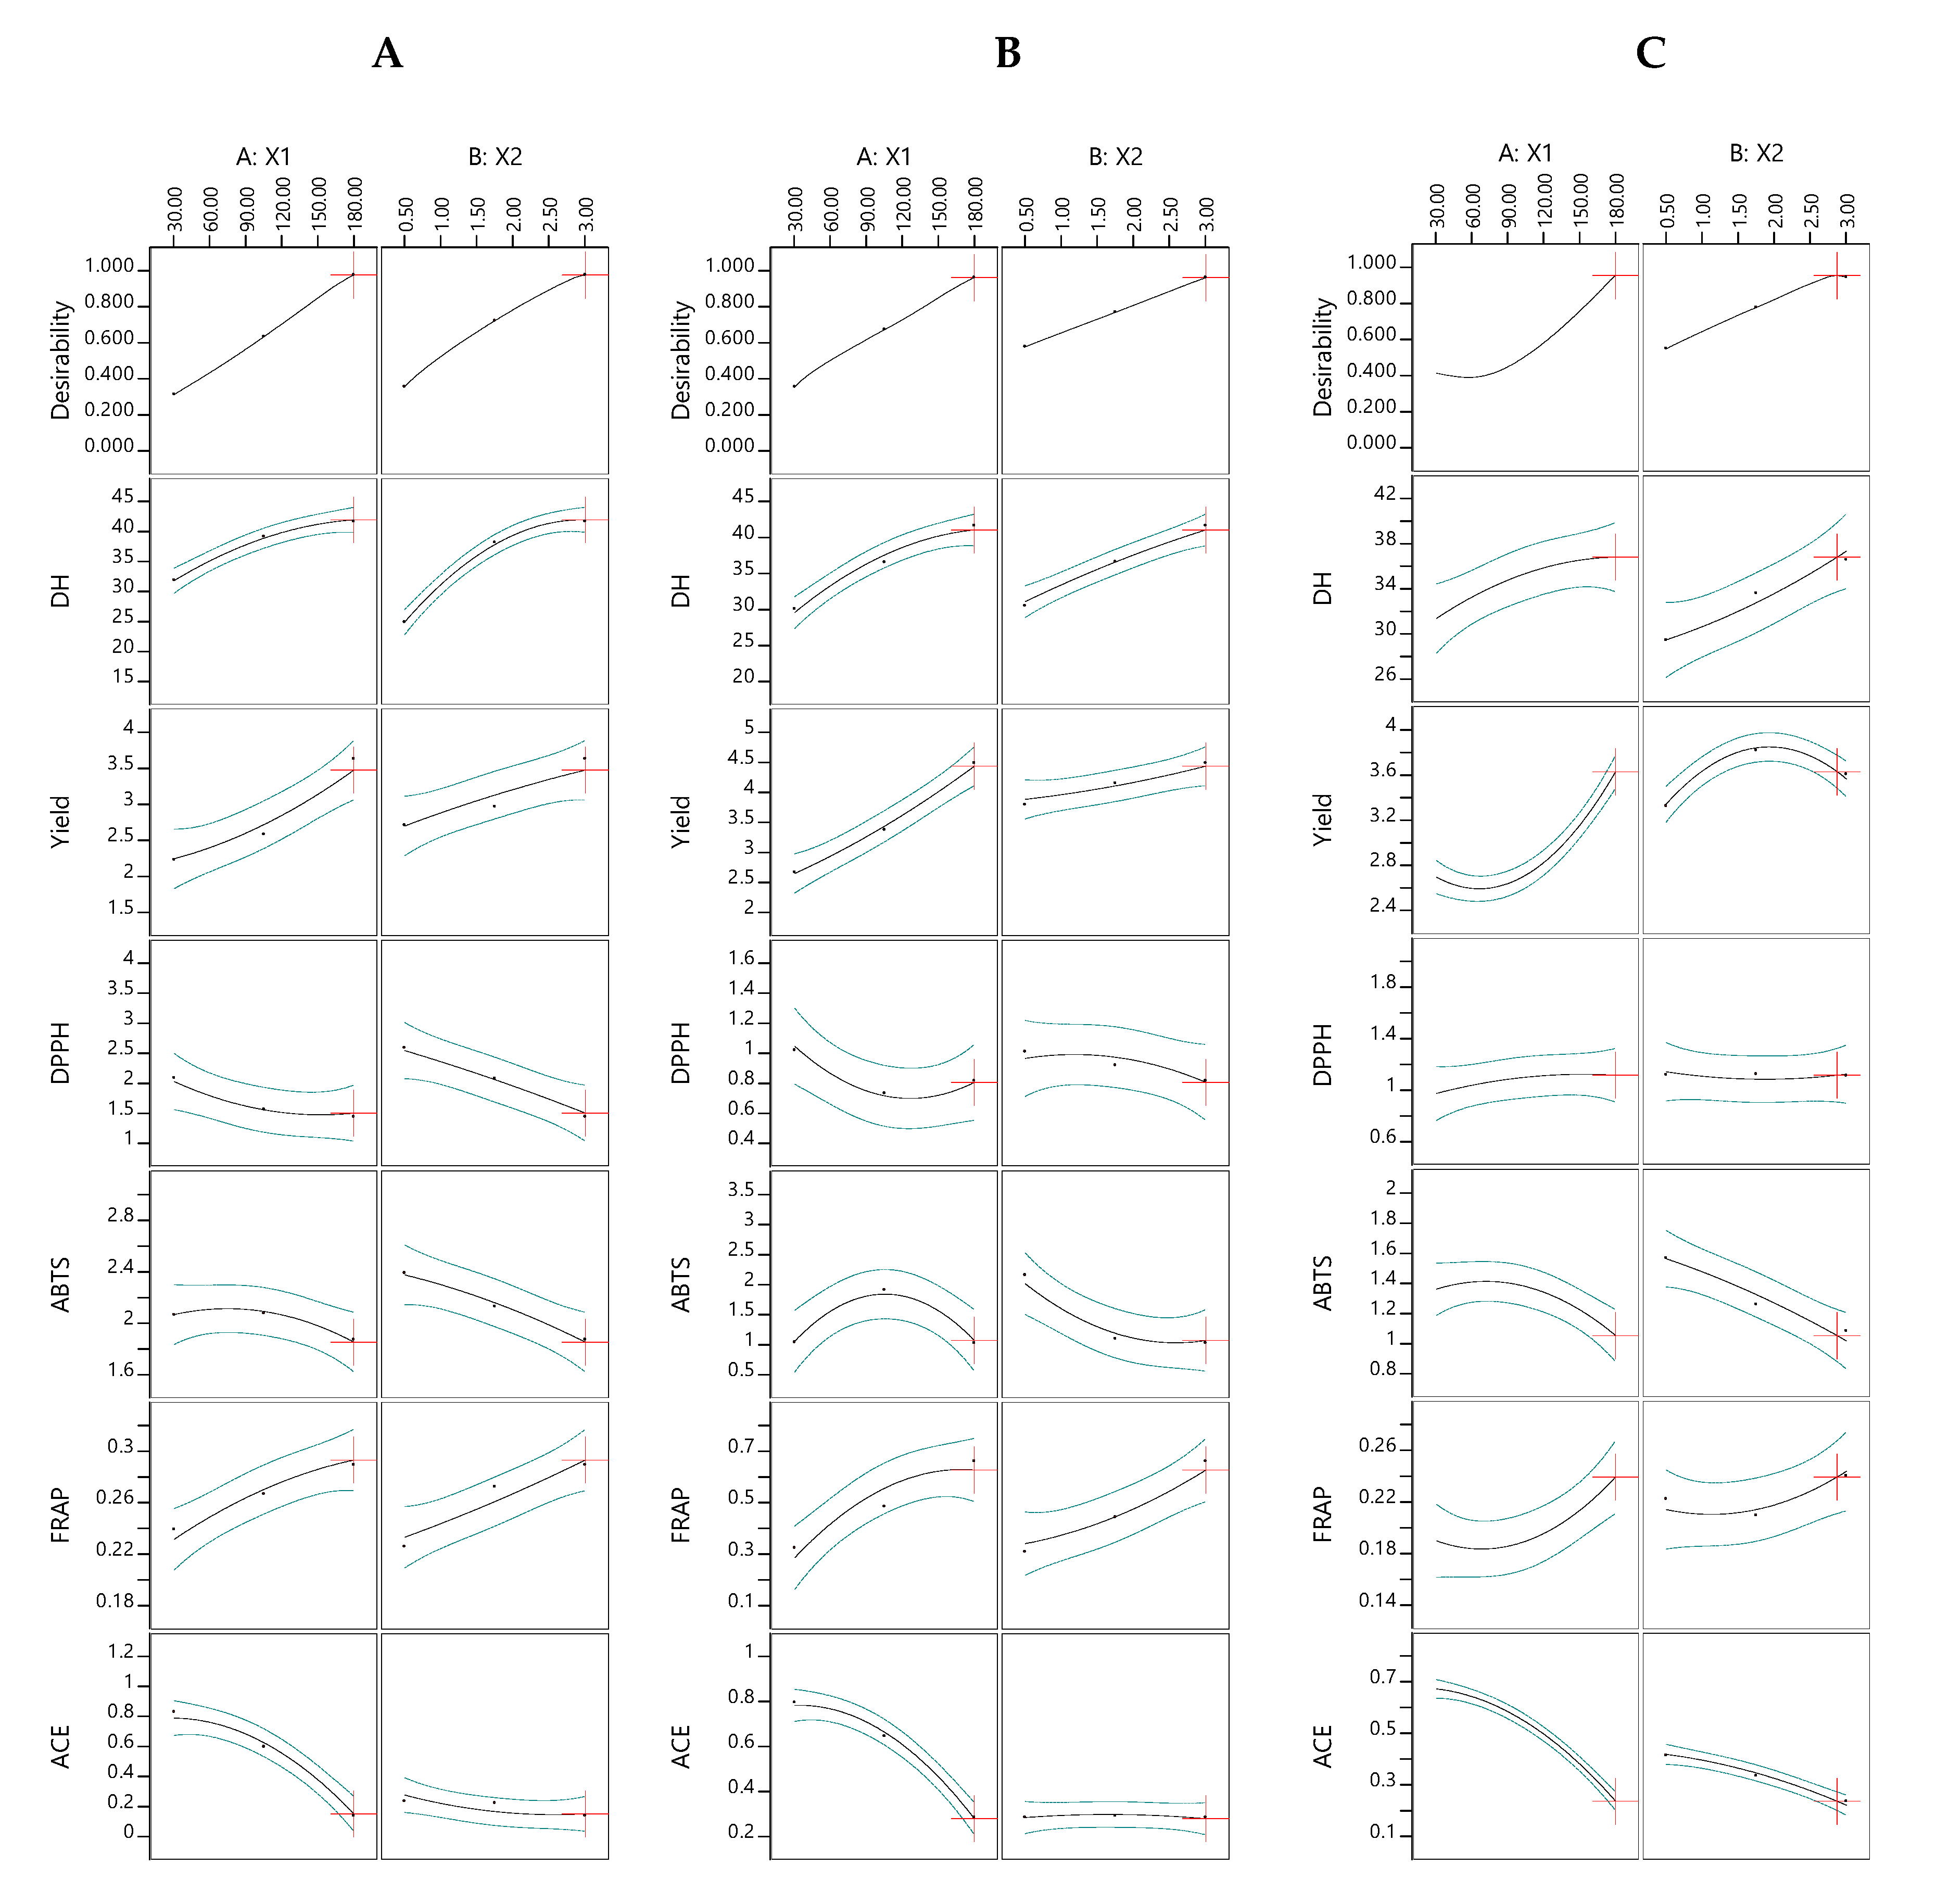
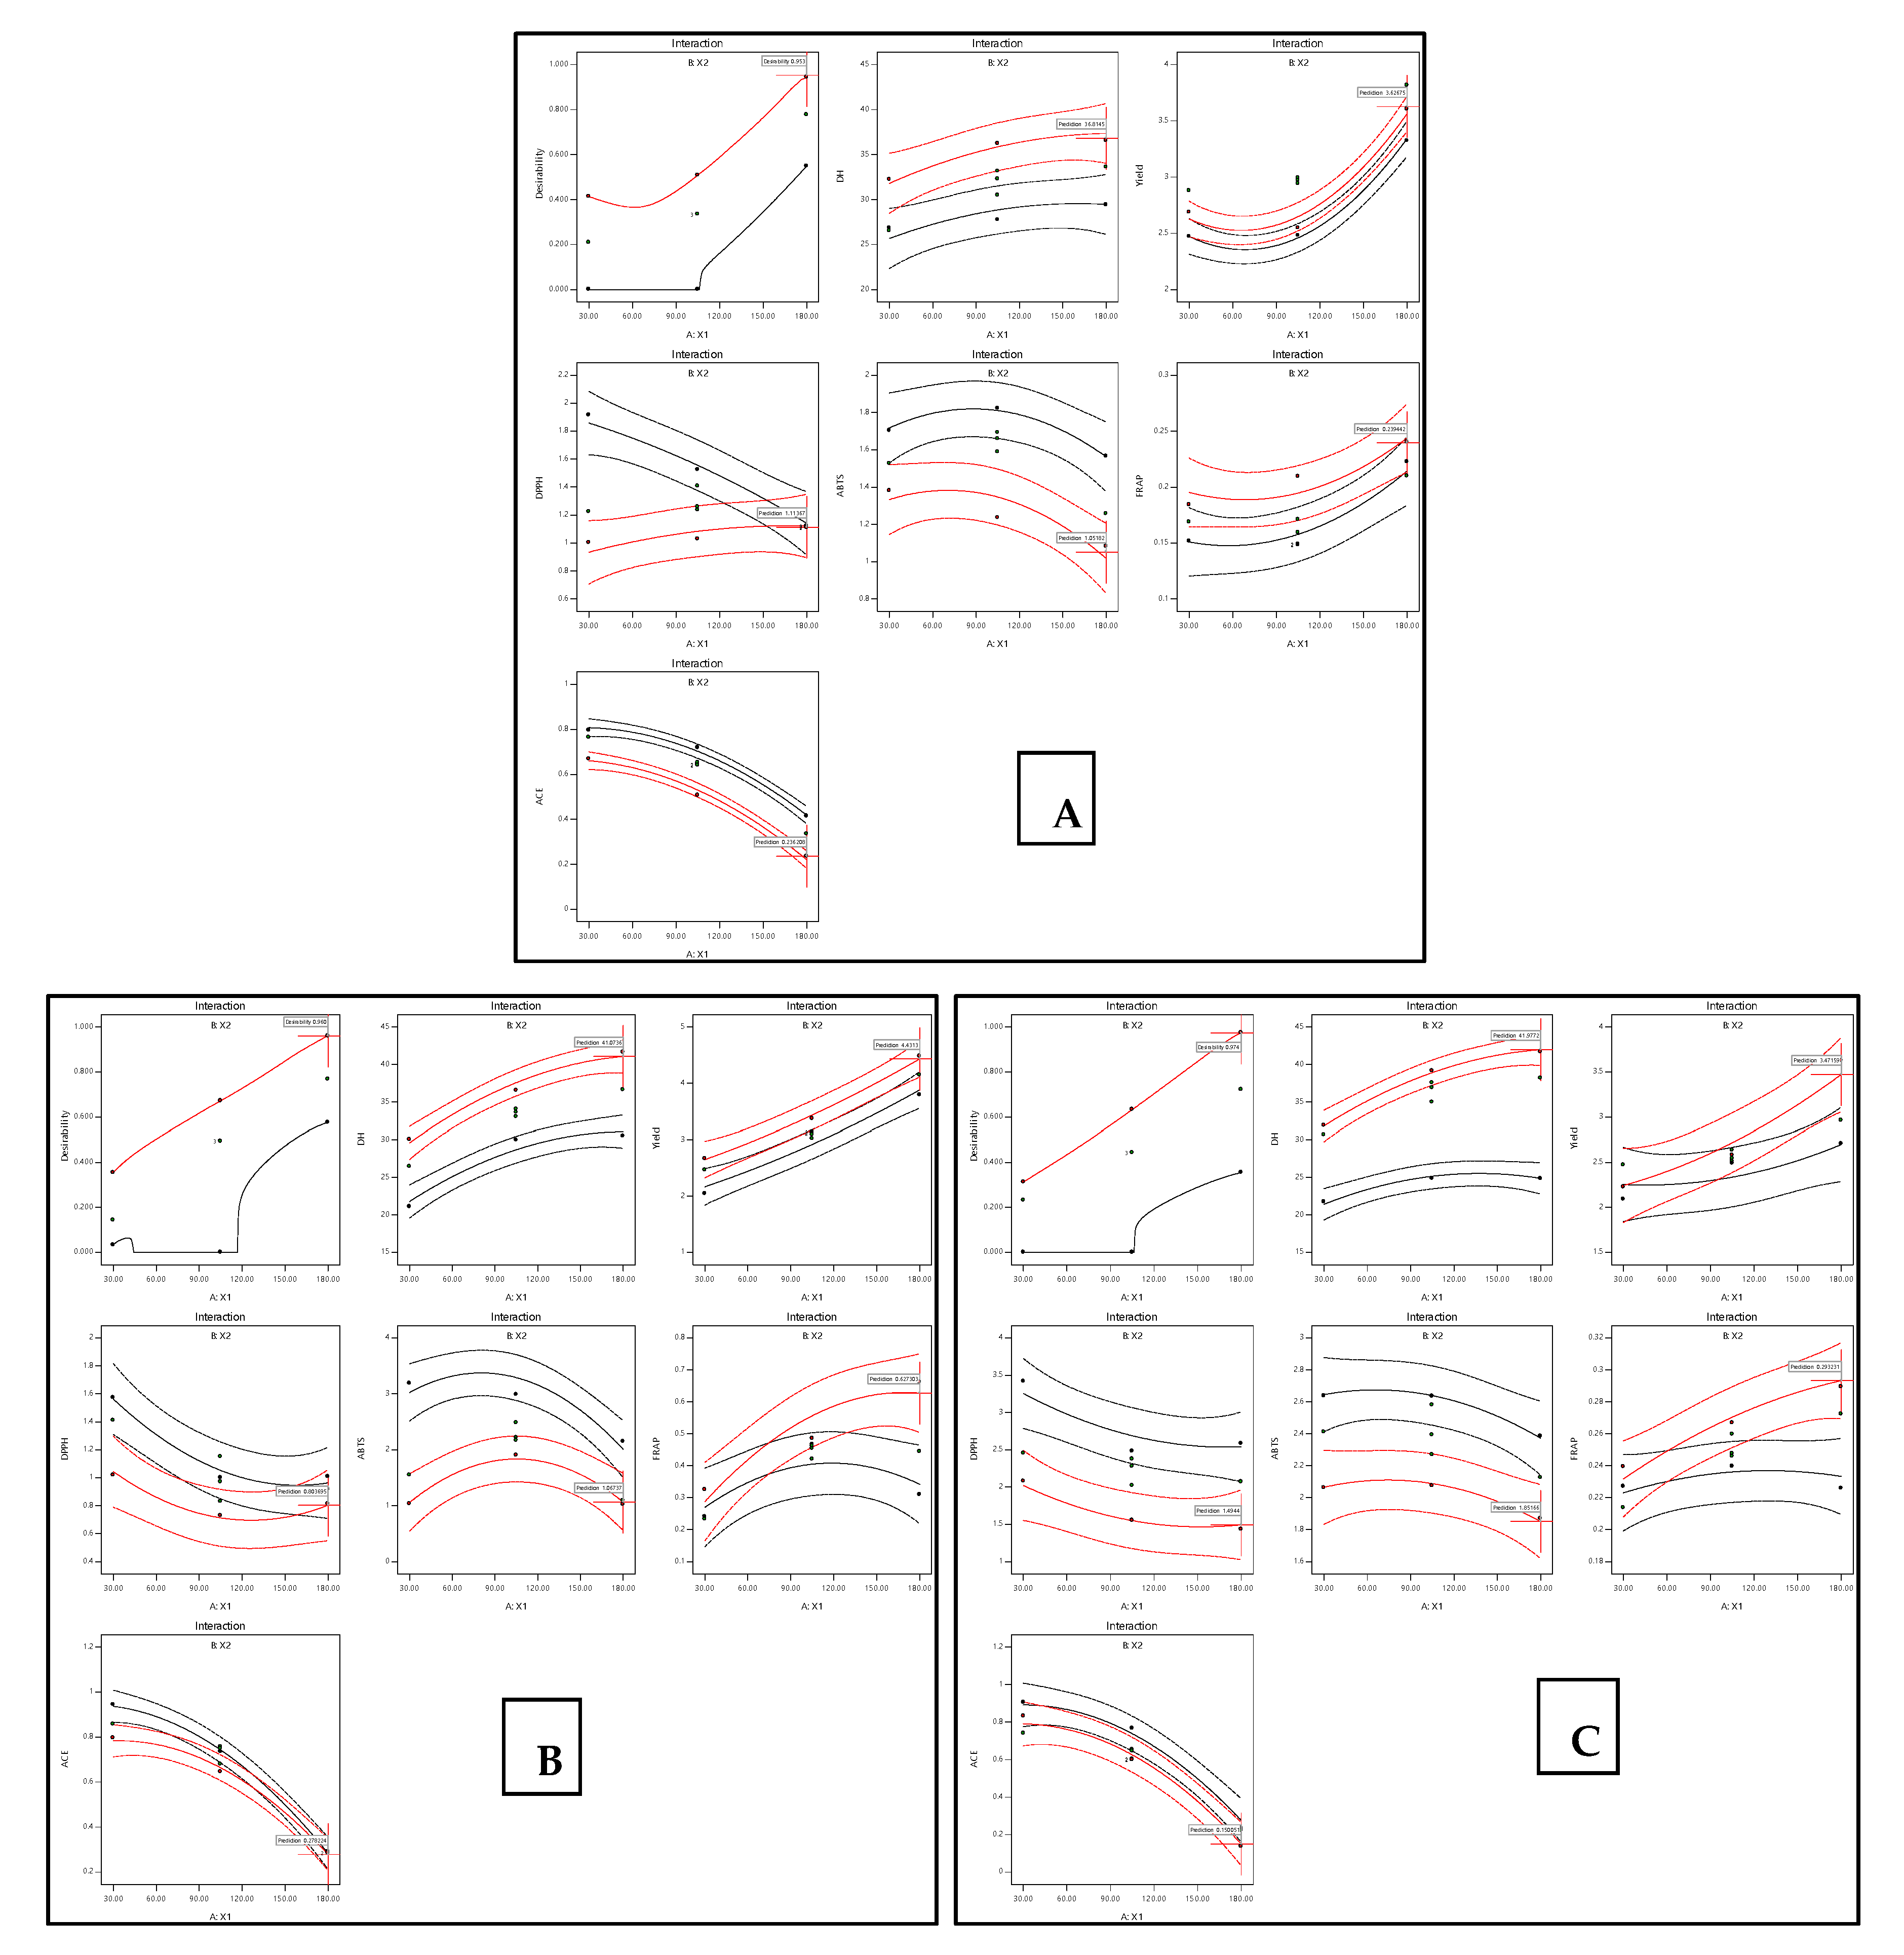
3.3. Optimization of TB Hydrolysis Conditions and Model Validation

Multiresponses optimization of TB hydrolysis was determined by maximizing the composite desirability using Design Expert software for maximum DH, yield and FRAP and minimum IC50 of DPPH, ABTS and ACE inhibitory activities. The optimal conditions were 180 min of hydrolysis time and 2.81% Alcalase, 2.89% Neutrase or 2.87% Flavourzyme. The desirability was in the range of 0.95–0.96. According to these models, the predicted value for all responses are shown in Table 3. Validation tests were done to determine the adequacy of the proposed models then an experiment was done using the optimal conditions; the experimental values of all responses were close to the predicted value (Table 3). Those experimented values suggested that Neutrase (TNHN) was the best choice for further study due to its higher yield with high antioxidant and ACE inhibitory activity.

3.4. Amino Acid Profile

The amino acid composition of TBHN is shown in Table 4. The essential amino acids of TBHN were ~40% of the total amino acids, i.e., lysine (9.25%), isoleucine (9.21%), valine (8.71%), leucine (6.5%) and phenylalanine (4.68%). The essential amino acid score was calculated using the recommended protein standard of the Food and Agriculture Organization/World Health Organization (FAO/WHO) [39] to evaluate the nutritional protein quality of TBHN. Methionine, threonine and tryptophan were limiting amino acids of TBHN. This was different from mussel meat hydrolysates that had limiting amino acids as histidine and leucine [40]. The hydrophobic and hydrophilic amino acid contents in TBHN were about 60% and 20% of total amino acids, respectively, which was consistent with a previous report of duck blood cell hydrolysates [41]. The hydrophobic amino acids of small peptides are believed to improve the efficiency of antioxidant and ACE inhibitory activities, i.e., methionine, histidine, tyrosine, lysine and tryptophan increase antioxidant activity [28,42]. Peptides containing tryptophan, proline or phenylalanine at the C-terminus or branched-chain aliphatics at the N-terminus had good ACE inhibitory activity [43]. Mirzaei et al. [44] and Sheih et al. [45] showed that the hydrophilic amino acids did not interact with the active site of ACE, so there was no inhibition. Auwa et al. [46] reported that the ratio between hydrophobic and hydrophilic amino acids impacted ACE inhibitory activity. The mechanism for the antioxidant activity of hydrophobic amino acids may be due to electron or proton donation to the peroxide radicals, hydroxyl and superoxide anion [34], while ACE inhibitory activity of hydrophobic amino acids positioned at the C-terminus binding active sites of ACE [47]. Note that the results suggested that the sample was relatively impure as the total yield should have been between 110 and 120 g.

3.5. Fractionation Using Ultrafiltration Membranes

The TBHN fractionation is shown in Table 5. The <1 kDa fraction had the strongest antioxidant and ACE inhibition activity (p ≤ 0.05), which was consistent with reports by Girgih et al. [48] and Chalamaiah et al. [49], who reported that the smaller peptides had strong antioxidant activity than the whole hydrolysate. Cheung and Li-Chan [50] also reported that a steelhead (rainbow trout) hydrolysate with MW <3 kDa had higher ACE inhibitory activity than whole hydrolysates, peptide <5 kDa from Chlorella sorokiniana hydrolysates showed the highest DPPH radical scavenging and ACE-inhibitory activity [51], the peptides <5 kDa of cobia skin and Raja clavata skin hydrolysates showed stronger antioxidant activity than the protein precursors [35] and peptides <1 kDa from tuna cooking juice hydrolysate [20] and small peptides of fish skin hydrolysates [52] showed higher ACE inhibition activity. The MW distribution of peptides influenced the antioxidant and ACE inhibitory activity of hydrolysates. Smaller peptides might absorb in the intestine more easily and react more effectively with free radicals interfering with normal oxidative processes [53,54].

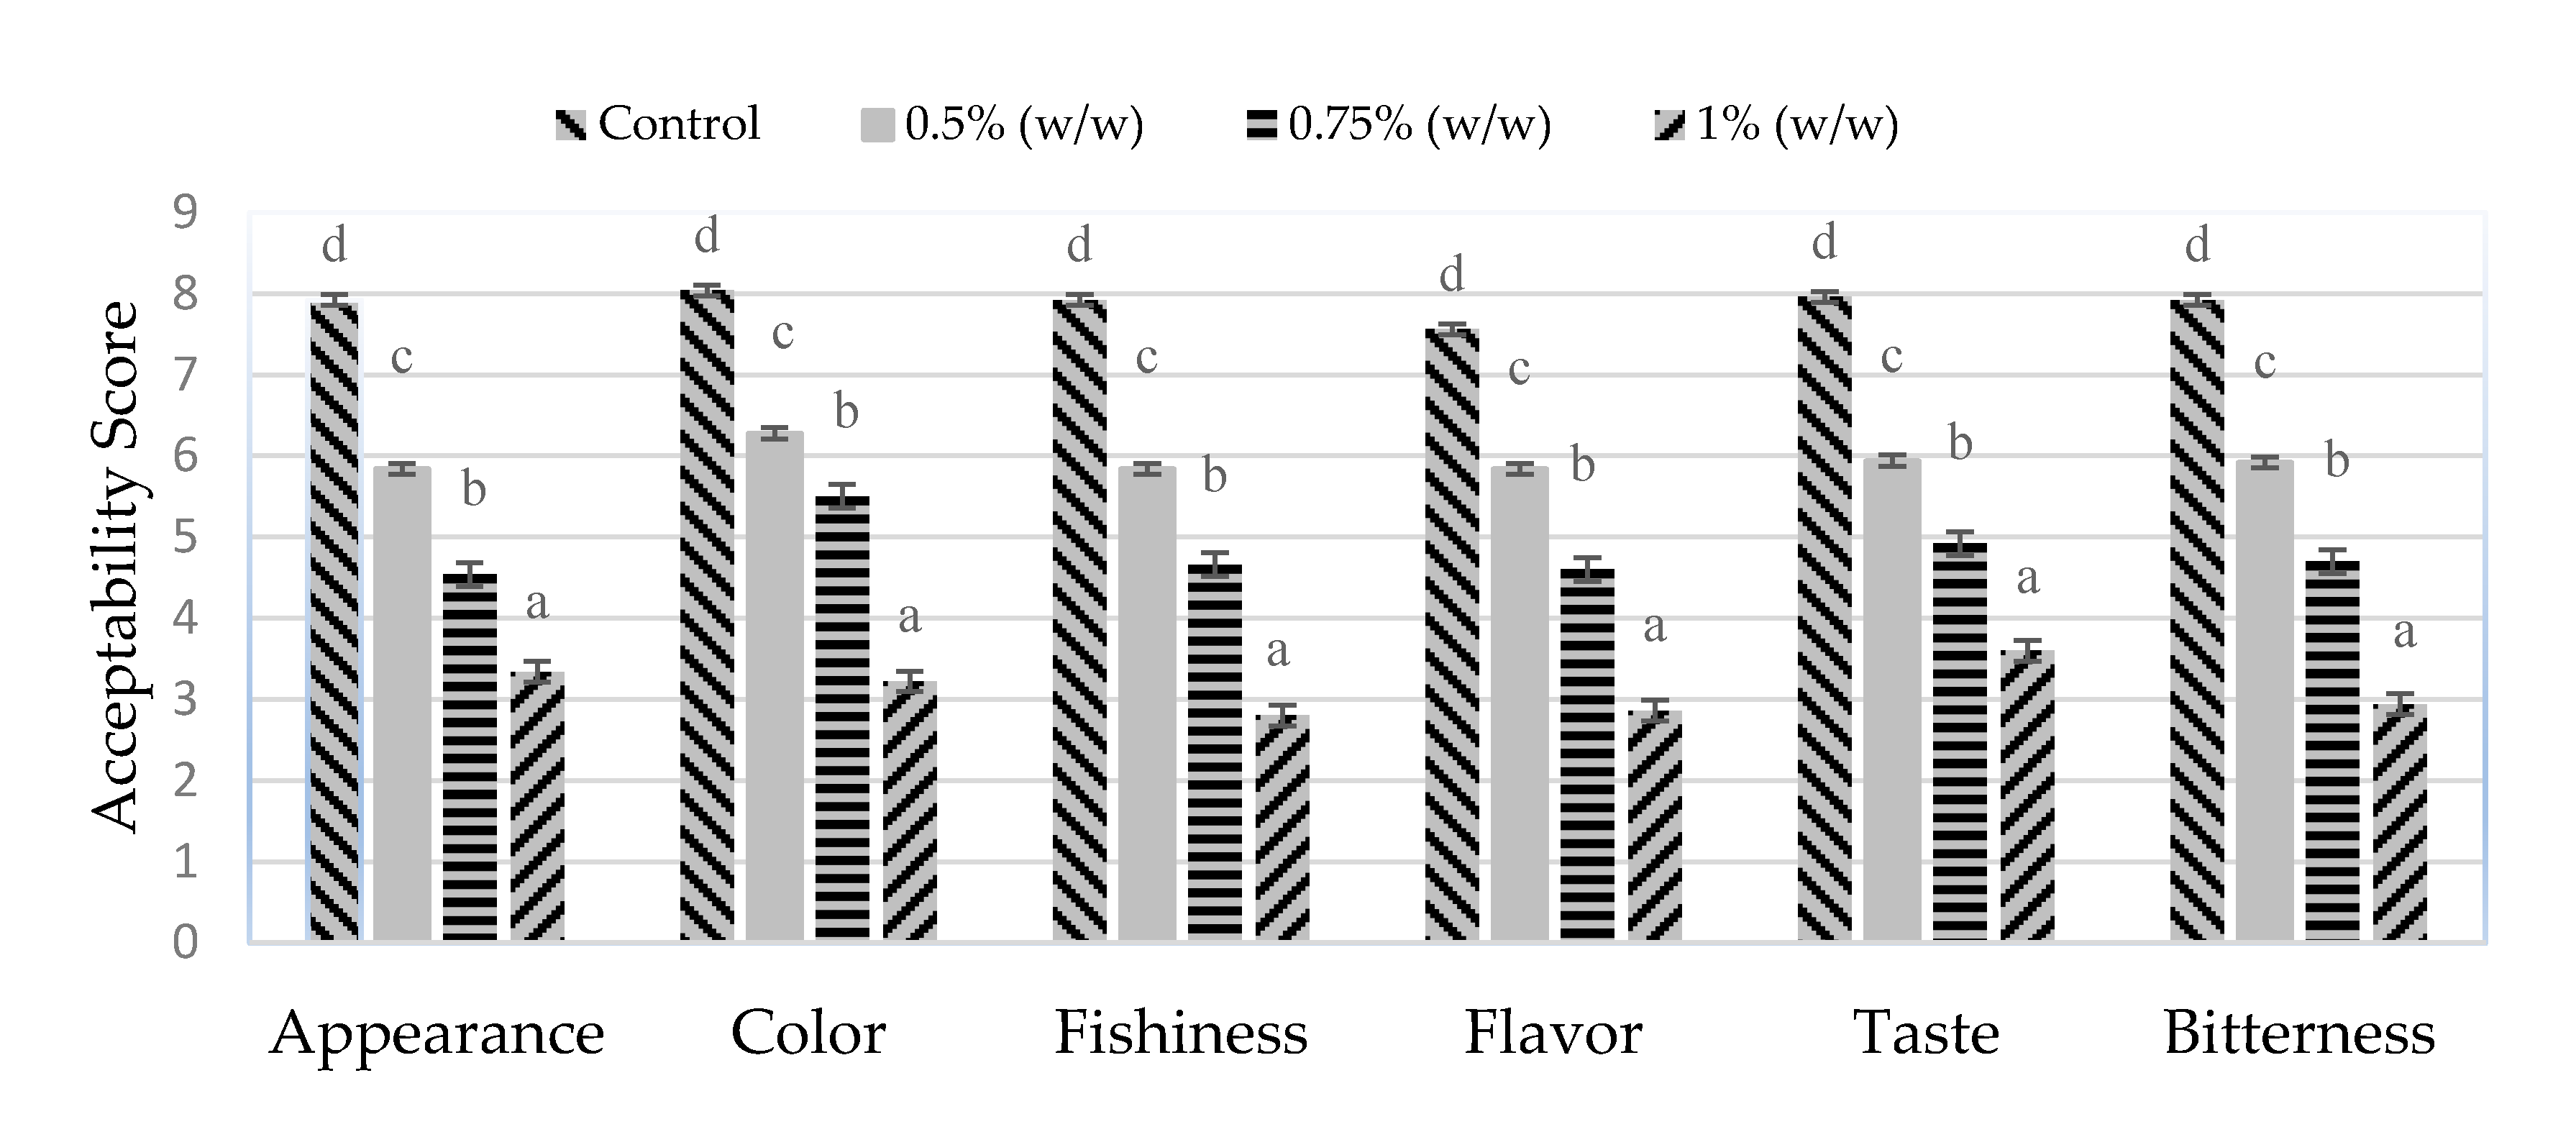
3.6. Sensory Evaluation of Hydrolysate and Fortified Mango Jelly

The sensory evaluations of the TBHN solution are shown in Table 6. The 0.5% (w/v) TBHN solution had significantly lower scores for fishy odor, fishy flavor and bitterness than the 1.0% (w/v) (p ≤ 0.05). Comparing both concentrations with the reference (10%, w/v), the intensity of fishy odor and flavor was 50% higher (range of 9–12) of the reference score (15), while the bitterness score was about 50% of the reference. Generally, the bitterness and fishiness are the major problems affecting the sensory acceptability of hydrolysate products [55]. The bitterness is associated with various factors such as hydrophobic amino acids, DH, MW, type of protease used and peptide sequences [23]. The hydrophobicity is an important factor affecting bitterness in protein hydrolysate [56], and peptide containing the 10 bitter amino acids a C- or N-terminal including alanine, valine, leucine, isoleucine, phenylalanine, tryptophan, proline, methionine, arginine and histidine may have a strong bitterness [57]. The fishiness might be caused by lipid oxidation of the fish material; Yarnpakdee et al. [58] reported that the stronger fishy odor/flavor in Nile tilapia hydrolysate powder was correlated with lipid oxidation. Moreover, fishiness had an influence on other factors, such as microbial metabolism and enzymatic reactions [23].
The addition of TBHN into mango jelly from 0–1.0% (w/w) was carried out, and the sensory acceptability score are shown in Figure 4. The mango jelly with 0.5% (w/w) TBHN had higher scores ranging from like moderately to like slightly for appearance, color, fishy odor, flavor, taste and bitterness. The intensity level of fishiness and bitterness for mango jelly with 0.5% (w/w) TBHN was at the just about right level, while 0.75% and 1.0% (w/w) TBHN were somewhat strong. Most consumers (94%) accepted mango jelly with 0.5% (w/w) TBHN. The antioxidant and ACE inhibitory activities of mango jelly with TBHN are shown in Table 7. The antioxidant and ACE inhibitory activity of mango jelly with TBHN were significantly increased compared with control (without TBHN). Bioactivities also increased with increasing TBHN concentration. Adding protein hydrolysates in foods could improve bioactivity and the properties of the products—for example, a fish gelatin hydrolysate in gluten-free noodles [24], fish muscle hydrolysate in milk [21] and sardine hydrolysate in fish soup and apple juice [11]. These results showed that a mango jelly with TBHN had good bioactivity. However, in terms of sensory acceptability, TBHN should not be added at >0.5% (w/w) for acceptability.

4. Conclusions

The optimum condition for TB hydrolysate production using enzyme hydrolysis were concentrations of Alcalase 2.81%, Neutrase 2.9% or Flavourzyme 2.87% and 180 min of hydrolysis time. The appropriated models were generated and verified as having a good fit to the model of experimental values. Neutrase was selected to produce TB hydrolysate as it had 43.7% DH, 4.59% yield, 0.84 mg/mL DPPH scavenging activity (IC50), 1.07 mg/mL ABTS scavenging activity (IC50), 0.65 mmol FeSO4/g FRAP assay and 0.28 mg/mL ACE inhibitory activity (IC50). Consequently, TB hydrolysate contained high amounts of hydrophobic amino such as lysine, isoleucine, valine, leucine and phenylalanine. Ultrafiltration membrane fractionation resulted in a peptide fraction with MW <1 kDa with the highest antioxidant and ACE inhibitory activities. Fortification with hydrolysate in mango jelly at 0.5% (w/w) was consumer acceptable with the range of scores of like moderately to like slightly, while mango jelly showed strong antioxidant and ACE inhibitory activities with increasing hydrolysate. Thus, the results indicated the potential of TB protein hydrolysates using Neutrase as appropriate for production hydrolysate with high antioxidants and antihypertensive and a potential application in foods, pharmaceutical and nutraceutical products. Further research cloud be undertaken in order to improve the effectiveness and economical hydrolysis processes rendered hydrolysate with better properties. Therefore, the uses of several proteases or immobilized proteases should be concerns due to various protease types most likely cleaving the peptide bonds in substrate protein chain at the different positions, resulting in different products with various bioactivities.

Author Contributions

Conceptualization, S.W.; Data curation, N.M.; Formal analysis, N.M.; Methodology, N.M., S.W.; Supervision, Y.M., S.Y., S.M., J.M.R., S.W.; Validation, Y.M., S.Y., S.M., J.M.R., S.W.; Writing-original draft, N.M, S.W.; Writing-review & editing, Y.M., J.M.R., S.W. All authors have read and agreed to the published version of the manuscript.

Funding

This study was supported by the National Research Council of Thailand (NRCT).

Acknowledgments

The authors gratefully acknowledge the financial support of the National Research Council of Thailand (NRCT). This research work also was partially supported by Chiang Mai University and the Thailand Graduate Institute of Science and Technology (TGIST), the National Science and Technology Development Agency (TGIST: SCA-CO-2560-4506-TH).

Conflicts of Interest

The authors declared that they have no conflicts of interest with this work.

References

  1. Mata, W.; Chanmalee, T.; Punyasuk, N.; Thitamadee, S. Simple PCR-RFLP detection method for genus-and species-authentication of four types of tuna used in canned tuna industry. Food Control. 2020, 18, 1211–1215. [Google Scholar] [CrossRef]
  2. Gamarro, E.G.; Worawattanamateekul, W.; Sentina, J.; Gopal, T.K.S. By-Products of Tuna Processing; GLOBEFISH Research Programme; FAO: Rome, Italy, 2013; Volume 112, 48p. [Google Scholar]
  3. Jelavic, K.M.; Stepanowska, K.; Grubisic, L.; Segvic Bubic, T.; Katavic, I. Reduced feeding effects to the blood and muscle chemistry of farmed juvenile bluefin tuna in the Adriatic Sea. Aquac. Res. 2012, 43, 317–320. [Google Scholar] [CrossRef]
  4. Hamzeh, A.; Wongngam, W.; Kiatsongchai, R.; Yongsawatdigul, J. Cellular and chemical antioxidant activities of chicken blood hydrolysates as affected by in vitro gastrointestinal digestion. Poult. Sci. 2019, 98, 6138–6148. [Google Scholar] [CrossRef] [PubMed]
  5. Wongngam, W.; Mitani, T.; Katayama, S.; Nakamura, S.; Yongsawatdigul, J. Production and characterization of chicken blood hydrolysate with antihypertensive properties. Poult. Sci. 2020, 99, 5163–5174. [Google Scholar] [CrossRef] [PubMed]
  6. Toldrà, M.; Parés, D.; Saguer, E.; Carretero, C. Hemoglobin hydrolysates from porcine blood obtained through enzymatic hydrolysis assisted by high hydrostatic pressure processing. Innov. Food Sci. Emerg. Technol. 2011, 12, 435–442. [Google Scholar] [CrossRef]
  7. Fu, Y.; Bak, K.H.; Liu, J.; Gobba, C.D.; Tøstesen, M.; Hansebn, E.T. Protein hydrolysates of porcine hemoglobin and blood: Peptide characteristics in relation to taste attributes and formation of volatile compounds. Food Res. Int. 2019, 121, 28–38. [Google Scholar] [CrossRef]
  8. Bah, C.S.F.; Carne, A.; McConnell, M.A.; Mros, S.; Bekhit, A.E.D.A. Production of bioactive peptide hydrolysates from deer, sheep, pig and cattle red blood cell fractions using plant and fungal protease preparations. Food Chem. 2016, 202, 458–466. [Google Scholar] [CrossRef]
  9. Ahn, C.; Lee, K.; Je, J. Enzymatic production of bioactive protein hydrolysates from tuna liver: Effects of enzymes and molecular weight on bioactivity. Int. J. Food Sci. Technol. 2010, 45, 562–568. [Google Scholar] [CrossRef]
  10. Hemker, A.M.; Nguyen, L.T.; Karwe, M.; Salvi, D. Effects of pressure-assisted enzymatic hydrolysis on functional and bioactive properties of tilapia (Oreochromis niloticus) by-product protein hydrolysates. LWT Food Sci. Technol. 2020, 122, 109003. [Google Scholar] [CrossRef]
  11. Rivero-Pino, F.; Espejo-Carpio, F.J.; Guadix, E.M. Evaluation of the bioactive potential of foods fortified with fish protein hydrolysates. Food Res. Int. 2020, 137, 109572. [Google Scholar] [CrossRef]
  12. Sila, A.; Bougatef, A. Antioxidant peptides from marine by-products: Isolation, identification and application in food systems. J. Funct. Foods. 2016, 21, 10–26. [Google Scholar] [CrossRef]
  13. Tacias-Pascacio, V.G.; Morellon-Sterling, R.; Siar, E.H.; Tavano, O.; Berenguer-Murcia, Á.; Fernandez-Lafuente, R. Use of Alcalase in the production of bioactive peptides: A review. Int. J. Biol. Macromol. 2020, 165, 2143–2196. [Google Scholar] [CrossRef] [PubMed]
  14. Slizyte, R.; Rommi, K.; Mozuraityte, R.; Eck, P.; Five, K.; Rusta, T. Bioactivities of fish protein hydrolysates from defatted salmon backbones. Biotechnol. Rep. 2016, 11, 99–109. [Google Scholar] [CrossRef] [PubMed] [Green Version]
  15. Kim, S.K.; Wijesekara, I. Development and biological activities of marine-derived bioactive peptides: A review. J. Funct. Foods. 2010, 2, 1–9. [Google Scholar] [CrossRef]
  16. AOAC. Official Methods of Analysis, Proximate Analysis, 17th ed.; The Association of Official Analytical Chemists: Gaithersburg, MD, USA, 2000. [Google Scholar]
  17. Intarasirisawat, R.; Benjakul, S.; Visessanguan, W.; Wu, J. Antioxidative and functional properties of protein hydrolysate from defatted skipjack (Katsuwonous pelamis) roe. Food Chem. 2012, 135, 3039–3048. [Google Scholar] [CrossRef]
  18. Ahn, C.B.; Kim, J.G.; Je, J.Y. Purification and antioxidant properties of octapeptide from salmon byproduct protein hydrolysate by gastrointestinal digestion. Food Chem. 2014, 147, 78–83. [Google Scholar] [CrossRef]
  19. Wangtueai, S.; Siebenhandl-Ehn, S.; Haltrich, D. Optimization of the preparation of gelatin hydrolysates with antioxidant activity from lizardfish (Saurida spp.) scales gelatin. Chiang Mai J. Sci. 2016, 43, 68–79. [Google Scholar]
  20. Kasiwut, J.; Youravong, W.; Sirinupong, N. Angiotensin I-converting enzyme inhibitory peptides produced from tuna cooking juice hydrolysate by continuous enzymatic membrane reactor. Food Biochem. 2019, 43, e13058. [Google Scholar] [CrossRef]
  21. Yarnpakdee, S.; Benjakul, S.; Kristinsson, H.G.; Maqsood, S. Effect of pretreatment on lipid oxidation and fishy odour development in protein hydrolysates from the muscle of Indian mackerel. Food Chem. 2012, 135, 2474–2482. [Google Scholar] [CrossRef]
  22. Phanturat, P.; Benjakul, S.; Visessanguan, W.; Roytrakul, S. Use of pyloric caeca extract from bigeye snapper (Priacanthus macracanthus) for the production of gelatin hydrolysate with antioxidative activity. LWT Food Sci. Technol. 2010, 43, 86–97. [Google Scholar] [CrossRef]
  23. Yarnpakdee, S.; Benjakul, S.; Kristinsson, H.G.; Kishimura, H. Antioxidant and sensory properties of protein hydrolysate derived from Nile tilapia (Oreochromis niloticus) by one-and two-step hydrolysis. J. Food Sci. Technol. 2015, 52, 3336–3349. [Google Scholar] [CrossRef] [PubMed] [Green Version]
  24. Wangtueai, S.; Phimolsiripol, Y.; Vichasilp, C.; Regenstein, J.M.; Schöenlechner, R. Optimization of gluten-free functional noodles formulation enriched with fish gelatin hydrolysates. LWT Food Sci. Technol. 2020, 133, 109977. [Google Scholar] [CrossRef]
  25. Forghani, B.; Bakar, J.; Ebrahimpour, A.; Hamid, A.A. Enzyme hydrolysates from Stichopus horrens as a new source for angiotensin-I converting enzyme inhibitory peptides. Evid. Based Complement. Altern. Med. 2012, 10, 1155. [Google Scholar]
  26. Auwal, S.M.; Zarei, M.; Hamid, A.; Saari, N. Response surface optimisation for the production of Antioxidant hydrolysates from stone fish protein using bromelain. Evid. Based Complement. Altern. Med. 2017, 2017(4), 1–10. [Google Scholar] [CrossRef] [PubMed]
  27. Bordbar, S.; Ebrahimpour, A.; Zarei, M.; Hamid, A.; Saari, N. Alcalase-generated proteolysates of stone fish (Actinopyga lecanora) flesh as a new source of antioxidant peptides. Int. Food Prop. 2018, 21, 1541–1559. [Google Scholar] [CrossRef] [Green Version]
  28. Li, X.; Shen, S.; Deng, J.; Li, T.; Ding, C. Antioxidant activities and functional properties of tea seed protein hydrolysates (Camellia oleifera Abel) influenced by the degree of enzymatic hydrolysis. Food Sci. Biotechnol. 2014, 23, 2075–2082. [Google Scholar] [CrossRef]
  29. Ghanbari, R.; Zarei, M.; Ebrahimpour, A.; Abdul-Hamid, A.; Ismail, A.; Saari, N. Angiotensin-I converting enzyme (ACE) inhibitory and anti-oxidant activities of sea cucumber (Actinopyga lecanora) hydrolysates. Int. J. Mol. Sci. 2015, 16, 28870–28885. [Google Scholar] [CrossRef] [Green Version]
  30. Ren, J.; Zhao, M.; Shi, J.; Wang, J.; Jiang, Y.; Cui, C.; Kakuda, Y.; Xue, S.J. Purification and identification of antioxidant peptide from grass carp muscle hydrolysates by consecutive chromatography and electrospray ionization-mass spectrometry. Food Chem. 2008, 108, 727–736. [Google Scholar] [CrossRef]
  31. Tanuja, S.; Haridas, A.; Zynudheen, A.A.; Joshy, C.G. Functional and antioxidative properties of fish protein hydrolysate (FPH) produced from the frame meat of striped cat fish Pangasianodon hypophthalmus (Sauvage, 1878) using alkaline protease alcalase. Indiam. J. Fish. 2014, 61, 82–89. [Google Scholar]
  32. Dai, Z.Y.; Zhang, Y.P.; Zhang, H.; Lu, Y.B. Preparation and characterization of mussel (Mytilus edulis) protein hydrolysates with angiotensin-I-converting enzyme (ACE) inhibitory activity by enzymatic hydrolysis. J. Food Biochem. 2010, 36, 66–74. [Google Scholar] [CrossRef]
  33. Wu, H.C.; Chen, H.M.; Shiau, C.Y. Free amino acids and peptides as related to antioxidant properties in protein hydrolysates of mackerel (Scomber austriasicus). Food Res. Int. 2003, 36, 949–957. [Google Scholar] [CrossRef]
  34. Nasri, R.; Jridi, M.; Lassoued, I.; Jemil, I.; Ben Slama-Ben Salem, R.; Nasri, M.; Karra-hâabouni, M. The influence of the extent of enzymatic hydrolysis on antioxidative properties and ACE-inhibitory activities of protein hydrolysates from goby (Zosterisessor ophiocephalus) muscle. Appl. Biochem. Biotechnol. 2014, 173, 1121–1134. [Google Scholar] [CrossRef] [PubMed]
  35. Lassoued, I.; Mora, L.; Nasri, R.; Jridi, M.; Toldrá, F.; Aristoy, M.C.; Barkia, A.; Nasri, M. Characterization and comparative assessment of antioxidant and ACE inhibitory activities of thornback ray gelatin hydrolysates. J. Funct. Foods. 2015, 13, 225–238. [Google Scholar] [CrossRef]
  36. Yang, X.R.; Qiu, Y.T.; Zhao, Y.Q.; Chi, C.F.; Wang, B. Purification and characterization of antioxidant peptides derived from protein hydrolysate of the marine bivalve mollusk Tergillarca granosa. Mar. Drugs 2019, 17, 251. [Google Scholar] [CrossRef] [Green Version]
  37. Oh, Y.; Ahn, C.B.; Nam, K.H.; Kim, Y.K.; Yoon, N.Y.; Je, J.Y. Amino acid composition, antioxidant, and cytoprotective effect of blue mussel (Mytilus edulis) hydrolysate through the inhibition of Caspase-3 activation in oxidative stress-mediated endothelial cell injury. Mar. Drugs 2019, 17, 135. [Google Scholar] [CrossRef] [Green Version]
  38. Wu, S.; Sun, J.; Tong, Z.; Lan, X.; Zhao, Z.; Liao, D. Optimization of hydrolysis conditions for the production of angiotensin-I converting enzyme-inhibitory peptides and isolation of a novel peptide from lizardfish (Saurida elongate) muscle protein hydrolysate. Mar. Drugs 2012, 10, 1066–1080. [Google Scholar] [CrossRef] [Green Version]
  39. FAO/WHO. Food and Agriculture Organization/World Health Organization; (FAO/WHO) Evaluation of Protein Quality; Joint Report; FAO Food Nutrition: Rome, Italy, 1991. [Google Scholar]
  40. Silva, V.M.; Park, K.J.; Hubinger, M.D. Optimization of the enzymatic hydrolysis of mussel meat. J. Food Sci. 2010, 75, C36–C42. [Google Scholar] [CrossRef]
  41. Zheng, Z.; Wei, X.; Shang, T.; Huang, Y.; Hu, C.; Zhang, R. Bioconversion of duck blood cell: Process optimization of hydrolytic conditions and peptide hydrolysate characterization. BMC Biotechnol. 2018, 18, 67. [Google Scholar] [CrossRef]
  42. He, X.Q.; Cao, W.H.; Pan, G.K.; Yang, L.; Zhang, C.H. Enzymatic hydrolysis optimization of Paphia undulata and lymphocyte proliferation activity of the isolated peptide fractions. J. Sci. Food Agric. 2015, 95, 1544–1553. [Google Scholar]
  43. Rho, S.J.; Lee, J.S.; Chung, Y.I.; Kim, Y.W.; Lee, H.G. Purification and identification of an angiotensin I-converting enzyme inhibitory peptide from fermented soybean extract. Process. Biochem. 2009, 44, 490–493. [Google Scholar] [CrossRef]
  44. Mirzaei, M.; Mirdamadi, S.; Ehsani, M.R.; Aminlari, M. Production of antioxidant and ACE-inhibitory peptides from Kluyveromyces marxianus protein hydrolysates: Purification and molecular docking. J. Food Drug Anal. 2017, 1–10. [Google Scholar] [CrossRef] [PubMed] [Green Version]
  45. Sheih, I.C.; Fang, T.J.; Wu, T.K. Isolation and characterization of a novel angiotensin I-converting enzyme (ACE) inhibitory peptide from the algae protein waste. Food Chem. 2009, 115, 279–284. [Google Scholar] [CrossRef]
  46. Auwa, S.M.; Abidin, N.Z.; Zarei, M.; Tan, C.P. Identification, structure-activity relationship and in silico molecular docking analyses of five novel angiotensin I-converting enzyme (ACE)-inhibitory peptides from stone fish (Actinopyga lecanora) hydrolysates. PLoS ONE 2019, 10, 1371. [Google Scholar]
  47. Gobbetti, M.; Ferranti, P.; Smacchi, E.; Goffredi, F.; Addeo, F. Production of angiotensin-I-converting-enzyme-inhibitory peptides in fermented milks started by Lactobacillus delbrueckii subsp. bulgaricus SS1 and Lactococcus lactis subsp. cremoris FT4. Appl. Environ. Microbiol. 2000, 9, 3898–3904. [Google Scholar] [CrossRef] [Green Version]
  48. Girgih, A.T.; Udenigwe, C.C.; Aluko, R.E. In vitro antioxidant properties of hemp seed (Cannabis sativa L.) potein hydrolysate fractions. J. Am. Oil Chem. Soc. 2011, 88, 381–389. [Google Scholar] [CrossRef]
  49. Chalamaiah, M.; Jyothirmayi, T.; Diwan, P.V.; Kumar, B.D. Antioxidant activity and functional properties of enzymatic protein hydrolysates from common carp (Cyprinus carpio) roe egg. J. Food Sci. Technol. 2015, 52, 5817–5825. [Google Scholar] [CrossRef] [Green Version]
  50. Cheung, Y.W.; Li-Chan, E.C.Y. Enzymatic production of protein hydrolysates from steelhead (Oncorhynchus mykiss) skin gelatin as inhibitors of dipeptidyl-peptidase IV and angiotensin-I converting enzyme. J. Funct. Foods 2017, 28, 254–264. [Google Scholar] [CrossRef] [Green Version]
  51. Tejano, L.A.; Peralta, J.P.; Yap, E.E.S.; Chang, Y.W. Bioactivities of enzymatic protein hydrolysates derived from Chlorella sorokiniana. Food Sci. Nutr. 2019, 7, 2381–2390. [Google Scholar] [CrossRef] [Green Version]
  52. Abuine, R.; Rathnayake, A.U.; Byun, H.G. Biological activity of peptides purified from fish skin hydrolysates. J. Fish. Aquat. Sci. 2019, 10, 1186. [Google Scholar] [CrossRef] [Green Version]
  53. Wang, B.; Li, Z.R.; Chi, C.F.; Zhang, Q.H.; Luo, H.Y. Preparation and evaluation of antioxidant peptides from ethanol-soluble proteins hydrolysate of Sphyrna lewini muscle. Peptides 2012, 36, 240–250. [Google Scholar] [CrossRef]
  54. Ko, J.Y.; Kanga, N.; Lee, J.H.; Kim, J.S.; Kim, W.S.; Park, S.J.; Kim, Y.T.; Jeona, Y.J. Angiotensin I-converting enzyme inhibitory peptides from anenzymatic hydrolysate of flounder fish (Paralichthys olivaceus) muscleas a potent anti-hypertensive agent. Process. Biochem. 2016, 51, 535–541. [Google Scholar] [CrossRef]
  55. Nilsang, S.; Lertsiri, S.; Suphantharika, M.; Assavanig, A. Optimization of enzymatic hydrolysis of fish soluble concentrate by commercial proteases. J. Food Eng. 2005, 70, 571–578. [Google Scholar] [CrossRef]
  56. Benjakul, S.; Yarnpakdee, S.; Senphan, T.; Halldorsdottir, S.M.; Kristinsson, H.G. Fish protein hydrolysates: Production, bioactivities and applications. In Antioxidants and Functional Components in Aquatic Foods; Kristinsson, H.G., Ed.; Matil Ltd.: Reykjavik, Iceland, 2014; pp. 237–282. [Google Scholar]
  57. Begum, N.; Raza, A.; Shen, D.; Song, H.; Zhang, Y.; Zhang, L.; Liu, P. Sensory attribute and antioxidant capacity of Maillard reaction products from enzymatic hydrolysate of bovine bone marrow extract. Int. J. Food Sci. Technol. 2019, 57, 1786–1797. [Google Scholar] [CrossRef] [PubMed]
  58. Yarnpakdee, S.; Benjakul, S.; Nalinanon, S.; Kristinsson, H.G. Lipid oxidation and fishy odour development in protein hydrolysate from Nile tilapia (Oreochromis niloticus) muscle as affected by freshness and antioxidants. Food Chem. 2012, 132, 1781–1788. [Google Scholar] [CrossRef]
Figure 1. Response surface plots for the effect of hydrolysis time (X1; min) and enzyme concentration (X2; %) on the DH, yield, DPPH radical scavenging activity, ABTS radical scavenging activity, FRAP assay and ACE inhibitory activity using Alcalase (A1F1), Neutrase (A2F2) and Flavourzyme (A3F3) hydrolysis.
Processes 08 01518 g001aProcesses 08 01518 g001bProcesses 08 01518 g001c
Figure 2. Main effect plot of hydrolysis time (X1) and enzyme concentration (X2) for DH, yield, DPPH radical scavenging activity, ABTS radical scavenging activity, FRAP assay and ACE inhibitory activity of TBH using Alcalase (A), Neutrae (B) and Flavourzyme (C).
Processes 08 01518 g002
Figure 3. Interaction plot of hydrolysis time (X1) and enzyme concentration (X2) for DH, yield, DPPH radical scavenging activity, ABTS radical scavenging activity, FRAP assay and ACE inhibitory activity of TBH using Alcalase (A), Neutrae (B) and Flavourzyme (C).
Processes 08 01518 g003
Figure 4. Sensory acceptability score of mango jelly product with and without TB hydrolysate. Different lowercase letters for the same attributes indicate significant differences (p ≤ 0.05).
Processes 08 01518 g004
Table 1. Experimental design and all responses of degree of hydrolysis (DH), yield, DPPH radical scavenging activity, ABTS radical scavenging activity, ferric reducing antioxidant power (FRAP) assay and angiotensin-I-converting enzyme (ACE) inhibitory activity of tuna blood (TB) hydrolyzed by Alcalase, Neutrase and Flavourzyme.
EnzymesTreatmentsFactorsResponses
X1 (min)X2 (%)%DH%YieldDPPH (IC50) (mg/mL)ABTS (IC50) (mg/mL)FRAP
(mmol FeSO4/g)
ACE (IC50) (mg/mL)
Alcalase 11800.5029.4 a ± 0.23.3 b ± 0.11.11 a ± 0.031.6 c,d ± 0.10.22 a,b ± 0.010.41 c ± 0.04
21051.7533.2 b ± 0.22.9 a,b ± 0.31.4 b,c ± 0.21.7 d,e ± 0.10.15 a ± 0.010.64 e ± 0.00
31053.0036.2 b ± 0.32.6 a ± 0.21.0 a ± 0.11.2 a,b ± 0.10.21 b ± 0.010.5 d ± 0.1
41051.7530.5 a,b ± 0.13.0 a,b ± 0.21.3 a,b ± 0.21.7 d,e ± 0.10.16 a ± 0.010.65 e ± 0.00
5303.0032.2 b ± 0.12.69 a ± 0.041.0 a ± 0.11.38 b,c ± 0.030.18 a,b ± 0.010.67 e ± 0.01
6300.5026.8 a ± 0.012.5 a ± 0.21.9 d ± 0.11.7 d,e ± 0.10.15 a ± 0.010.80 g ± 0.02
71051.7532.3 b ± 0.13.0 a,b ± 0.51.2 a,b ± 0.11.59 d ± 0.020.17 a ± 0.010.64 e ± 0.02
81803.0036.6 b ± 0.33.6 b ± 0.11.1 a ± 0.31.1 a ± 0.10.24 b ± 0.010.24 a ± 0.01
91801.7533.6 b ± 0.43.8 b,c ± 0.11.1 a ± 0.11.3 a,b ± 0.20.21 b ± 0.010.33 b ± 0.00
101050.5027.7 a ± 0.22.5 a ± 0.31.52 c ± 0.001.8 e ± 0.10.15 a ± 0.010.7 e,f ± 0.1
11301.7526.5 a ± 0.22.9 a ± 0.21.2 a,b ± 0.11.53 c,d ± 0.030.17 a ± 0.000.76 f,g ± 0.04
Neutrase11800.5030.5 b ± 0.23.8 b,c ± 0.21.0 b,c ± 0.12.2 d ± 0.20.31 b ± 0.010.28 a ± 0.00
21051.7533.6 b,c ± 0.23.1 b ± 0.10.8 a,b ± 0.12.2 d ± 0.20.42 c ± 0.040.76 c ± 0.00
31053.0036.6 b,c ± 0.13.4 b,c ± 0.60.7 a ± 0.11.9 c ± 0.20.49 c ± 0.000.65 b ± 0.01
41051.7533.1 b,c ± 0.23.1 b ± 0.21.0 a,b,c ± 0.12.5 f ± 0.10.5 c ± 0.10.68 b ± 0.00
5303.0030.0 b ± 0.22.7 a,b ± 0.11.0 b,c ± 0.11.04 a ± 0.020.3 b ± 0.10.80 d ± 0.03
6300.5021.1 a ± 0.32.0 a ± 0.31.57 d ± 0.043.2 g ± 0.10.24 a ± 0.010.94 f ± 0.00
71051.7534.0 b,c ± 0.13.0 b ± 0.11.2 c ± 0.12.2 d ± 0.10.46 c ± 0.010.75 c ± 0.03
81803.0041.7 d ± 0.34.5 c,d ± 0.10.8 a,b ± 0.31.0 a ± 0.10.66 d ± 0.020.28 a ± 0.00
91801.7536.6 b,c ± 0.14.1 c ± 0.30.9 a,b,c ± 0.11.09 a ± 0.030.44 c ± 0.030.29 a ± 0.00
101050.5030.0 b ± 0.33.1 b ± 0.61.0 b,c ± 0.13.0 g ± 0.10.47 c ± 0.040.74 c ± 0.00
11301.7526.5 b ± 0.22.5 a,b ± 0.21.4 d ± 0.11.6 b ± 0.10.23 a ± 0.040.9 e ± 0.1
Flavourzyme11800.5024.8 a ± 0.12.7 b,c ± 0.22.6 c ± 0.12.4 c,d,e ± 0.10.23 a,b ± 0.020.23 b ± 0.01
21051.7536.9 b ± 0.52.6 b,c ± 0.12.3 c ± 0.42.3 b,c,d ± 0.10.25 a,b,c ± 0.030.60 c ± 0.01
31053.0039.2 b,c ± 0.12.6 b,c ± 0.41.6 a ± 0.12.1 a,b ± 0.10.27 b,c ± 0.050.60 c ± 0.00
41051.7537.5 b,c ± 0.12.5 b,c ± 0.22.98 b,c ± 0.042.39 c,d,e ± 0.020.25 a,b,c ± 0.000.65 d ± 0.01
5303.0031.9 b ± 0.22.2 b ± 0.12.1 b ± 0.12.1 a,b ± 0.10.24 a,b ± 0.010.83 g ± 0.02
6300.5021.7 a ± 0.32.1 a ± 0.23.4 d ± 0.22.6 e ± 0.20.23 a,b ± 0.030.90 h ± 0.00
71051.7535 b ± 0.52.5 b,c ± 0.32.0 b ± 0.22.6 d,e ± 0.10.26 a,b,c ± 0.020.65 d ± 0.00
81803.0041.7 c ± 0.43.6 c ± 0.11.4 a ± 0.31.9 a ± 0.30.29 c ± 0.000.14 a ± 0.00
91801.7538.2 b,c ± 0.43.0 c ± 0.12.1 b ± 0.12.1 a,b ± 0.30.27 b,c ± 0.010.22 b ± 0.00
101050.5024.9 a ± 0.22.5 b,c ± 0.12.5 c ± 0.12.6 e ± 0.10.24 a,b ± 0.030.77 f ± 0.00
11301.7530.7 b ± 0.32.5 b,c ± 0.12.5 c ± 0.12.4 c,d,e ± 0.30.21 a ± 0.000.74 e ± 0.01
Note: Mean ± SD, X1: hydrolysis time (min), X2: enzyme concentration (%); different letters in the same column of each enzyme indicate statistical differences (p ≤ 0.05).
Table 2. Response surface model of TB hydrolysis using Alcalase, Neutrase and Flavourzyme.
HydrolysatesResponsesQuadratic Polynomial ModelR2p-Value
Alcalase%DHY1 = 23.1 + 0.07X1 + 0.88X2 − 0.0002X12 + 0.41X22 − 0.01X1X20.91320.0110
%Yield Y2 = 2.33 − 0.01X1 + 0.92X2 + 0.0001X12 − 0.25X22 + 0.0002X1X20.9881<0.0001
DPPH (IC50) (mg/mL)Y3 = 2.22 − 0.004X1 − 0.55X2 − 0.00001X12 + 0.03X22 + 0.002X1X20.93040.0064
ABTS (IC50) (mg/mL)Y4 = 1.62 + 0.01X1 − 0.06X − 0.00003X12 − 0.02X22 − 0.0004X1X20.93770.0049
FRAP (mmol FeSO4/g)Y5 = 0.17 − 0.001X1 − 0.01X2 + 0.000004X12 + 0.01X22 − 0.00004X1X20.91510.0104
ACE (IC50) (mg/mL)Y6 = 0.802 + 0.0008X1 + 0.004X − 0.00002X12 − 0.017X22 − 0.0001X1X20.9956<0.0001
Neutrase%DHY1 = 15.8 + 0.14X1 + 4.11X2 − 0.0004X12 − 0.33X22 + 0.01X1X20.98460.0002
%Yield Y2 = 1.88 + 0.01X1 + 0.07X2 + 0.00002X12 + 0.03X22 + 0.0002X1X20.98040.0003
DPPH (IC50) (mg/mL)Y3 =1.92 − 0.01X1 − 0.04X2 + 0.00004X12 − 0.06X22 + 0.001X1X20.90500.0136
ABTS (IC50) (mg/mL)Y4 = 3.26 + 0.02X1 − 1.66X2 − 0.0001X12 + 0.23X22 + 0.003X1X20.95580.0021
FRAP (mmol FeSO4/g)Y5 = 0.206 + 0.004X1 − 0.100X2 − 0.00002X12 + 0.025X22 + 0.0007X1X20.90740.0128
ACE (IC50) (mg/mL)Y6 = 0.96 + 0.0004X1 − 0.04X2 − 0.00002X12 − 0.01X22 + 0.0004X1X20.9915<0.0001
Flavourzyme%DHY1= 12.7 + 0.09X1 + 13.5X2 − 0.0004X12 − 2.83X22 + 0.02X1X20.99060.0001
%Yield Y2 = 2.29 − 0.003X1 + 0.03X2 − 0.00003X12 − 0.03X22 + 0.002X1X20.90070.0151
DPPH (IC50) (mg/mL)Y3 = 3.82 − 0.01X1 − 0.43X2 + 0.00004X12 − 0.02X22 + 0.001X1X20.92650.0073
ABTS (IC50) (mg/mL)Y4 = 2.65 + 0.003X1 − 0.14X2 − 0.00002X12 − 0.03X22 + 0.0002X1X20.92180.0085
FRAP (mmol FeSO4/g)Y5 = 0.216 + 0.0003X1 − 0.01X2 − 0.000001X12 + 0.001X22 + 0.0001X1X20.89270.0182
ACE (IC50) (mg/mL)Y6 = 0.93 + 0.002X1 − 0.15X2 − 0.00003X12 + 0.03X22 − 0.0001X1X20.98110.0003
Note: Mean ± SD, X1: hydrolysis time (min), X2: enzyme concentration (%), DPPH radical scavenging activity, ABTS radical scavenging activity, FRAP assay and ACE inhibitory activity.
Table 3. Optimum condition with predicated values and experimental values from the verification of optimum models for all responses of TBH using Alcalase (TBHA), Neutrase (TBHN) and Flavourzyme (TBHF) hydrolysis.
HydrolysatesValueResponses
X1 (min)X2 (%)%DH%YieldDPPH
(mg/mL)
ABTS (mg/mL)FRAP
(mmol FeSO4/g)
ACE (mg/mL)
TBHAPredicated value 36.583.651.111.070.240.24
Experimental value1802.8140.4 a ± 13.61 b ± 0.031.16 b ± 0.031.0 a ± 0.10.28 a ± 0.010.26 b ± 0.02
Composite desirability0.95
TBHNPredicated value 40.734.400.821.050.600.28
Experimental value1802.8944 b ± 34.6 c ± 0.10.84 a ± 0.011.07 a ± 0.030.65 c ± 0.010.28 b ± 0.01
Composite desirability0.96
TBHFPredicated value 41.963.441.561.890.290.15
Experimental value1802.8746 c ± 33.5 a ± 0.21.6 c ± 0.11.4 b ± 0.10.31 b ± 0.010.19 a ± 0.00
Composite desirability0.96
Note: Mean ± SD, X1: hydrolysis time (min), X2: enzyme concentration (%), DPPH: the IC50 value of DPPH radical scavenging activity, ABTS: the IC50 value of ABTS radical scavenging activity, FRAP: FRAP assay activity and ACE: the IC50 value of ACE inhibitory activity; different superscripts in the experimental values for the same column indicate significant difference (p ≤ 0.05).
Table 4. Amino acid composition of TB hydrolysate using Neutrase hydrolysis (TBHN).
Amino Acids g/100 g of TBHNEssential Amino Acid ScoreFAO/WHO (1991)
Alanine2.12--
Aspartic acid + Asparagine2.92--
Cystine<0.02--
Glutamic acid + Glutamine3.71--
Glycine1.20--
Histidine4.032.261.9
Hydroxylysine<0.02--
Hydroxyproline<0.02--
Isoleucine9.213.292.8
Leucine6.500.986.6
Lysine9.251.605.8
Methionine<0.02<0.012.5
Phenylalanine4.680.746.3
Proline1.62--
Serine0.54--
Threonine0.760.223.4
Tryptophan0.110.101.1
Tyrosine2.54--
Valine8.712.493.5
Hydrophobic amino acids35.6--
Hydrophilic amino acids22.4--
Total amino acids57.9--
Table 5. Molecular weight distribution of TB hydrolysate using membrane fractionation.
Molecular Weight (kDa)DPPH (IC50) (mg/mL)ABTS (IC50) (mg/mL)FRAP
(mmol FeSO4/g)
ACE (IC50) (mg/mL)Yield (%)
>10 39 c ± 80.51 d ± 0.030.40 a ± 0.042.7 d ± 0.139.7 d ± 0.2
3–10 14 b ± 20.37 c ± 0.030.45 a ± 0.042.0 c ± 0.130.0 c ± 0.1
1–3 12 b ± 10.29 b ± 0.020.64 b ± 0.000.73 b ± 0.0214 b ± 1
<1 6.0 a ± 0.30.13 a ± 0.010.70 b,c ± 0.010.37 a ± 0.015.23 a ± 0.01
Note: Mean ± SD, X1: hydrolysis time (min), X2: enzyme concentration (%); DPPH radical scavenging activity, ABTS radical scavenging activity, FRAP assay, and ACE inhibitory activity; different superscripts in the same column indicate significant differences (p ≤ 0.05).
Table 6. Intensity score fishiness and bitterness from the sensory evaluation.
EnzymesConcentration (%)Score
Fishy OdorFishy FlavorBitterness
Reference10151515
Alcalase0.59.5 b ± 1.09.4 a ± 0.66.8 a ± 3.3
1.09.9 c ± 3.611.2 e ± 0.87.3 b ± 3.9
Neutrase0.510 e ± 19.5 b ± 1.07.3 b ± 3.5
1.011 f ± 111 d ± 18.2 d ± 3.4
Flavourzyme0.59.4 a ± 1.49.9 c ± 1.47.6 c ± 3.1
1.011 d ± 212 f ± 18.8 e ± 3.2
Note: Means ± SD; values with different lowercase letters in the same column indicate significant differences (p ≤ 0.05).
Table 7. Antioxidant and ACE inhibitory activity of mango jelly with and without TB hydrolysate.
Concentration (%)DPPH (IC50) (mg/mL)ABTS (IC50) (mg/mL)FRAP
(mmol FeSO4/g)
ACE (IC50) (mg/mL)
Control8.7 d ± 0.39.7 c ± 0.40.15 d ± 0.00ND
0.54.54 c ± 0.020.48 b ± 0.030.65 a ± 0.033.7 c ± 0.1
0.754.1 b ± 0.10.46 b ± 0.020.72 b ± 0.022.7 b ± 0.1
13.9 a ± 0.10.37 a ± 0.010.77 c ± 0.011.3 a ± 0.1
Note: Means ± SD and values with different lowercase letters in the same column indicate significant differences (p ≤ 0.05) and ND is not detected.
Publisher’s Note: MDPI stays neutral with regard to jurisdictional claims in published maps and institutional affiliations.

