Article

Multi-Response Optimization of Nanofluid-Based I. C. Engine Cooling System Using Fuzzy PIV Method

1
Mechanical Engineering Department, Integral University, Lucknow 226026, India
2
Sustainable Energy & Acoustics Research Lab, Mechanical Engineering, Aligarh Muslim University, Aligarh 202002, India
3
Mechanical Engineering Department, College of Engineering, King Khalid University, Abha 61421, Saudi Arabia
4
Department of Mechanical Engineering, Jamia Millia Islamia (A Central University), New Delhi 110025, India
*
Authors to whom correspondence should be addressed.
Processes 2020, 8(1), 30; https://doi.org/10.3390/pr8010030
Submission received: 22 November 2019 / Revised: 23 December 2019 / Accepted: 23 December 2019 / Published: 25 December 2019
(This article belongs to the Special Issue Fluid Flow and Heat Transfer of Nanofluids)

Abstract

:
Effective cooling of the internal combustion (I. C.) engines is of utmost importance for their improved performance. Automotive heat exchangers used as radiator with low efficiency in the industry may pose a serious threat to the engines. Thus, thermal scientists and engineers are always looking for modern methods to boost the heat extraction from the engine. A novel idea of using nanofluids for engine cooling has been in the news for some time now, as they have huge potential because of better thermal properties, strength, compactness, etc. Nanofluids are expected to replace the conventional fluids such as ethylene glycol, propylene glycol, water etc. due to performance and environmental concerns. Overall performance of the engine cooling system depends on several input parameters and therefore they need to be optimised to achieve an optimum performance. This study is focussed on developing a nanofluid engine cooling system (NFECS) where Al2O3 nanoparticles mixed with ethylene glycol (EG) and water is used as nanofluid. Furthermore, it also explores the effect of four important input parameters of the NFECS i.e., nanofluid inlet temperature, engine load, nanofluid flow rate, and nanoparticle concentration on its five attributes (output responses) viz thermal conductivity of the nanofluid, heat transfer coefficient, viscosity of the nanofluid, engine pumping power required to pump the desired amount of the nanofluid, and stability of the nanofluid. Taguchi’s L18 orthogonal array is used as the design of experiment to collect experimental data. Weighting factors are determined for output responses using the Triangular fuzzy numbers (TFN) and optimal setting of the input parameters is obtained using a novel fuzzy proximity index value (FPIV) method.

1. Introduction

The performance of an automobile engine heavily depends on its cooling system. The radiator has its own importance on account of being a mandatory component of the cooling system. The performance of the radiator can be improved by using a working fluid that possesses better thermal properties. Nanofluid, an engineered colloidal solution, has been in the news for last one and a half decades which is expected to change the face of technology in near future. It is being researched and adopted by the automotive industry for cooling systems because of its better thermo-physical properties compared to ethylene glycol and water solution [1]. All the conventional fluids such as ethylene glycol, water, propylene glycol, etc. have sluggish responses to the system and environment. Thus, in near future, nanofluids are expected to replace all the conventional fluids. Researchers have used different types of nanofluids and investigated their cooling effectiveness. For instance, Leong et al. [2] used copper dispersed ethylene glycolnanofluid with ethylene glycol as the base fluid and used it for cooling of the automotive radiator system. They explored the effect of varying nanoparticles concentration (0–2%) on heat transfer rate and observed that the rate of heat transfer increases with concentration. Furthermore, they reported that maximum heat transfer of 45.2% was obtained corresponding to the 2% of Cu nanoparticle volume fraction. Naraki et al. [3] prepared nanofluid with suspension of CuO nanoparticles in water and experimentally investigated the effect of varying nanoparticles volume fraction (0–8%). The prepared nanofluids were stabilised by varying pH and using the suitable surfactant. It is reported that the heat transfer increased with increase in the volume fraction of the nanoparticles. However, the heat transfer coefficient decreased with increasing inlet temperature i.e., 50–80 °C. Hussein et al. [4] investigated the impact of SiO2 dispersed in water by preparing four different samples of nanofluid having different volume fraction (1–2.5%). The objective was to explore the effect of varying volume fraction as well as flow rate (2–8 lpm) of the nanofluid on the heat transfer characteristics. It was found that the Nusselt number was enhanced to 56% with 2% volume fraction and 2 lpm flow rate.
Hussein et al. [5] used two different nanoparticles namely TiO2 and SiO2 in pure water to prepare two nanofluids. In their experimental study, they investigated the effect of three input parameters i.e., varying flow rates (2–8 lpm), temperature range (60–80 °C) and varying concentrations (1–2%) on the Nusselt number. Significant increase in the rate of heat transfer was observed. Enhancement of 11% and 22.5% in the Nusselt number was recorded for TiO2 and SiO2 respectively. They found that increase in the Nusselt number depended on all the three input parameters but rate of heat transfer mainly depended on the concentration of nanoparticles. Suganthi et al. [6] used ZnO based two different nanofluids to be employed in EG and mixture of water-EG. Nanoparticles with size ranging from 25–40 nm were employed to prepare the nanofluid. Probe ultra-sonication was done and no surfactant was used. They observed that thermal properties such as thermal conductivity increased by 33.4% and 17.26% corresponding to the volume fraction of 4% and 2%. The increased property resulted in enhancing the heat transfer leading to better cooling as compared to base fluid alone. Ali et al. [7] analysed the effect of ZnO based nanofluids with varying concentration of 0.01%, 0.08%, 0.2% and 0.3% pertaining to the heat transfer in car radiator, where flow rates ranging from 7–11 lpm were maintained. They also noticed that heat transfer depended on the volume concentration of particles. Maximum heat transfer of 46% was achieved corresponding to 0.2% volume concentration. They reported that the nanofluid provided better results when compared with only base fluid. Khan and Hassaan [8] performed CFD analyses to ascertain the effects of different nanofluids on radiator performance. It was reported that ZnO and Al2O3 showed better thermal properties with an increase of 4.9 to 15%, while other two nanofluids (SiO2 and TiO2) had a very small increase in heat transfer from 0 to 4%. On contrary to this, pressure drop in the radiator increased with increase in the volume fraction. Sandhya et al. [9] prepared TiO2 based nanofluid with ethylene glycol and water as the base fluid in the ratio of 40:60 by volume. They conducted the experimental study of cooling performance in the automobile radiator. Three different samples of nanofluid were prepared with 0.1%, 0.3% and 0.5% volume fraction of nanoparticles. The range of Reynolds number was maintained from 4000 to 15,000. They reported that the heat transfer depended mainly on the fluid flow rate whereas inlet temperature to the radiator had little impact. Corresponding to the volume fraction of 0.5%, a maximum enhancement of 35% for the heat transfer was observed.
From the literature review presented above, it can be noticed that the thermal properties were influenced by different controllable parameters i.e., flow rate, concentration, temperature etc. It was also observed that friction factor of nanofluid at low concentration showed negligible effect on power consumption. Furthermore, it is also observed that when nanofluids are employed then heat transfer capability of the cooling systems enhances as compared to the case when only conventional fluids are used. Rate of heat transfer was found to increase with increasing concentration as well as volume flow rates in the experimental investigations presented above. In the previous nanofluid cooled radiator studies, researchers focused on the performance of one nanofluid by varying the volumetric concentration, Reynolds number, and particle size. However, it would be advantageous if the optimum input parameters are known to get the best outcome. Thus, the current study focuses on optimising the performance of cooling system; to derive the maximum benefits from the nanofluid based engine cooling. Among the various methods available in the literature, optimization may be explored to obtain the best solution using either the traditional methods or Multi Criteria Decision Making (MCDM) techniques [10]. Multi-Attribute Decision Making (MADM) methods such as Analytic Hierarchy Process (AHP) [11], Technique for Order Preference by Simulation of Ideal Solution (TOPSIS) [12], VIKOR (VlseKriterijuska Optimizacija I Komoromisno Resenje) [13] and gray relational analysis [14] can be used for the selection of optimum input parameters that yield optimum performance of a system or process. MADM techniques are best suited when selection problem involves attributes/criteria that are conflicting in nature. Literature reveals application of these techniques for solving decision problems pertaining to different knowledge domain [15,16,17,18,19]. For instance, Mufazzal and Muzakkir [20] proposed a novel MADM technique called Proximity Index Value (PIV) method to minimize the rank reversal problems arising due to either addition or deletion of alternatives. This method suggests that selection of the alternatives should be made on the basis of absolute dispersion from the positive ideal solutions only rather than relative dispersion from both positive and negative ideal solutions as in case of TOPSIS. It has been reported that real life multi criteria decision making (MCDM) problems get further complicated due to vagueness, uncertainty, and subjectivity associated with them [21]. To reduce vagueness of the data, researchers make use of the fuzzy set theory [22,23] where they use linguistic variables such as extremely low, low, high, extremely high etc. Different fuzzy number sets such as triangular, trapezoidal, and pentagonal, etc. can be used to represent mathematical equivalence of the linguistic variables. Fuzzy MCDM methods have been widely used by researchers to solve different types of decision problems [24,25,26,27].
The objective of this study is to develop a nanofluid based cooling system for I. C. Engines and to experimentally investigate the effect of crucial input parameters of the system on important response variables. Furthermore, the study also aims at determining the optimal combination of the input parameters that yields optimal performance of the system. Four input parameters of the system i.e., nanofluid inlet temperature, engine load, nanofluid flow rate, and nanoparticle concentration along with five attributes (output responses) viz thermal conductivity of the nanofluid, heat transfer coefficient, viscosity of the nanofluid, engine pumping power required to pump the desired amount of the nanofluid, stability of the nanofluid are considered in the study. Eighteen experiments as per Taguchi’s L18 orthogonal array are performed and the values of the response variables for each experiment are recorded. Weights of the response variables are determined using Triangular fuzzy numbers (TFN) and optimal setting of the input parameters is obtained using a novel fuzzy proximity index value (FPIV) method. It is observed from literature review that fuzzy based proximity index value i.e., FPIV method has not yet been used by the researchers for multi-response optimization of any process or system including nanofluid based engine cooling system. Therefore, this study carries a lot of significance and novelty due to application of the FPIV for the first time.

2. Experimental Methodology

2.1. Nanofluid Prepartion

In this work, a two-step methodology was adopted for the preparation of nanofluid. Al2O3 nanoparticle with an APS (Average Particle Size) of ~25 nm was procured from SRL lab India. The characteristic features of the Al2O3 nanoparticle are tabulated in Table 1. A combination of water and ethylene glycol 50:50 by volume is used as base fluid. Three distinct level of concentration by volume i.e., 0.2%, 0.6% and 1% of nanoparticle were selected and corresponding nanofluids were prepared. The quantity of nanoparticles by volume fraction was calculated [1] using Equation (1).
For homogeneous mixing of the colloidal solution, magnetic stirring followed by ultrasonication process at high frequency was carried out to make stable colloidal solution. Preparation of the nanofluid is illustrated through block diagram as shown in Figure 1. Thus, 1/10th weight of the nanoparticles, Surfactant SDBS (Sodium Dodecyl Benzene Sulfonate) was also used [7]. After complete cessation of sonication process, the final nanofluid was ready to be used for examination.
Volume concentration
φ = m p ρ p m p ρ p + m b f ρ b f

2.2. Experimental Setup

Experimental setup consisted of various components attached to the engine. A four stroke diesel engine of 3.75 kW rating along with 8 K-type thermocouples, 2 wire thermocouples, digital temperature display and a rotameter were used. The schematic representations of the investigational set up is shown in Figure 2. Two temperature gauges were installed on the flow line. One of them was used to measure inlet temperature to the radiator whereas other was employed to measure the outlet temperature. Just at the entry to the engine, a rotameter with control valve was installed to measure and control the flow rate of working fluid within the system. Since there were four staggered rows of tube in the radiator, in each row two wire thermocouples were installed so as to measure the wall temperature of radiator tubes. Average of all the eight tubes were taken to figure out the average wall temperature of the tubes. Also, a blower fan was installed to suck the atmospheric air from other side of the radiator which further picked up the heat from the wall of the tube and helped in cooling the flowing fluid within the tube. This resulted in a large temperature drop at the outlet of radiator.
The tube was made of highly conducting material (i.e., copper) and its thickness was so small that the temperature gradient between the inner and the outer periphery of the tube was negligible. Therefore, it was assumed that both of them were at the same temperature [28,29]. Advection of heat transfer from outer surface to the ambient air took place, which was further being sucked by fan. In this case, the overall heat transfer was calculated from the fluid to the surface of the tube. Here, the average ‘h’ played a vital role. This property ensured the amount of heat removal or absorption for a unit surface area in contact and for the unit temperature drop. Higher the heat transfer coefficient, higher will be the heat transfer [30].

2.3. Selection of the Input Parameters and Their Levels

In light of the available literature, four input parameters of the NFECS i.e., nanofluid inlet temperature, engine load, nanofluid flow rate, and nanoparticle concentration were considered in this study [28,29,30,31]. The viable range for the input parameters was set by varying the nanofluid inlet temperature from 40 to 60 °C, the engine load from 5 to 15 kW, the nanofluid flow rate from 1.25 to 2.25 L/min, and the concentration of nanoparticle was considered to be from 0.2 to 1.0% vol. Two levels of the first input parameter i.e., nanofluid inlet temperature and three levels each of the remaining three input parameters were selected. The input parameters and their levels are shown in Table 2.

2.4. Taguchi Design of Experiments

Taguchi proposed standard orthogonal arrays (OAs) which can be used to study the entire range of the selected input parameters with relatively small number of experiments leading to saving in cost, time, and other resources. An orthogonal array (OA) comprises of specified number of rows and columns where rows signify number of experiments and columns represent the number of input parameters and their interactions. Decision about the selection of a particular OA is made based on the number of input parameters and their levels considered in the study. An OA having degrees of freedom equal to or more than the total degrees of freedom of all input parameters and their interactions can be appropriately used for experimental investigations. The degrees of freedom of an OA are defined as total number of experiments minus one. The degrees of freedom of an input parameter are determined by subtracting one from the number of levels of that parameter. Four input parameters each at three levels, except the first one which is at two levels, are considered in the present study. Degrees of freedom of each of the three input parameter are 2 (3–1) and degrees of freedom of one input parameter is 1 (2–1). Thus, the total degrees of freedom of all four input parameters are 7. L18is a suitable OA for mixed level factors i.e., one factor at two levels and three factors each at three levels (21 × 33). In addition, the degrees of freedom of the L18 OA is 17 which is much higher than 7. Thus, L18 being an appropriate OA is used in the present study as the design of experiment to collect experimental data for further analysis. Further, five attributes (output responses) of the NFECS are selected in this study which are discussed in Section 2.5. The L18 OA and the values of five attributes of each experiment are shown in Table 3.

2.5. Output Responses and Their Measurement

In the current study, five attributes for 18 experimental runs were recorded to optimise the performance of cooling system at different input levels. Viscosity of nanofluid was measured using a programmable viscometer with an externally attached thermal bath to vary the temperature. The calibration was carried outbefore starting of experiments on the nanofluid sample with standard value of viscosity of pure water. At 25 °C, viscosity for pure water is measured; the estimated and standard values are found to be 0.8421 cP and 0.89 cP respectively.
A portable hand held KD2 pro (Decagon) device was used for measuring the thermal conductivity of nanofluid. The device uses transient wire phenomenon for estimating the thermal conductivity of liquid. Within the temperature range of 10–60 °C, this thermal analyzer has ±3% accuracy. Provision of temperature variation of nanofluid sample was provided using digital hot plate, with accuracy of 0.01 °C. KD2 pro (Decagon) calibration results were within ±3 accuracy for distilled water.
For the stability of nanofluid, the zeta sizer set up was used to conduct zeta potential test on the samples of prepared nanofluid. The colloids with high magnitude value of zeta potential from 40 to 60 mV are believed to be good and stable, and those with value of more than 60 mV are highly stable. The accuracy and uncertainty associated with Zeta sizer is ± 1.6% and ± 2.5% respectively.
In this study, a flat tube automobile radiator was used (see Figure 3) with a length (L = 307.34 mm) and hydraulic diameter (Dh = 3.92 mm). Hydraulic diameter of a flat tube [32] was defined by Equation (2).
D h =   4 × [ π 4 d 2 + ( D d ) × d ] π × d + 2 × ( D d )
where, Dh is the hydraulic diameter of the tube, D and d are the major and minor diameters of the flat tube, respectively.
Heat transfer through bulk mass of nanofluid was calculated using Equation (3).
Q = ṁ Cp ΔT = ṁ Cp (TinTout)
where, is the nanofluidmass flow rate (kg/s), Cp is the specific heat of nanofluidat constant pressure (J/kg-ºK), Tin is the inlet temperature to the radiator and Tout is the outlet temperature to the radiator. Also, heat transfer rate from radiator tube is given by Equation (4).
Q = h A ΔT = h A (TbTw)
where, h is the Convective Heat Transfer Coefficient of nanofluid, A is the Surface Area of the tube, Tb is the bulk temperature of the nanofluid and Tw is the wall temperature of the radiator tubes. The bulk mean temperature Tb of nanofluid was taken as average of Tin and Tout temperature of the radiator. Tw was calculated by taking the average temperature of eight different location on tube walls. In this way heat transfer coefficient h was determined for different set of experiments suggested by Taguchi design.
The following Equation (5) and Equation (6) are used to calculate the friction factor (f) and pumping power (PP).
f = 2 × D h × Δ P ρ × v 2 × L
P P = Δ P × v × A
where, ΔP represents the pressure drop across the flat tube taken from the experimental setup using U-tube manometer.

2.6. Optimization Using Fuzzy PIV

Before going into the detailed methodology of fuzzy PIV, the fuzzy sets/fuzzy numbers are briefly explained which provide the basic foundations for this method.

2.6.1. Fuzzy Sets/Fuzzy Numbers

Bellman and Zadeh [33] introduced fuzzy set theory in 1970 to deal with situations where available information is full of vagueness and uncertainty. The fuzzy approach uses linguistic variables such as low, medium, high etc. which are converted to equivalent fuzzy numbers. Different types of fuzzy numbers likewise trapezoidal fuzzy number (TrFN), triangular fuzzy number (TFN), pentagonal fuzzy numbers (PFN) are available, among which TFN and TrFN are generally used. Triangular Fuzzy Number (TFN) is represented by a triplet (l, m, u) formed by three real numbers called as the lower, mean and upper bounds, respectively. The membership function μ A ( y ) represents the degree of fuzziness in the data; to which any given element y in the domain Y belongs to the fuzzy number A and is described mathematically by Equation (7) [34]:
μ A ( y ) = { ( y l ) ( m l ) ; l y m ( u y ) ( u m ) ; m y u 0 ; o t h e r w i s e }
The Trapezoidal fuzzy number (TrFN) is characterized by a fuzzy set of four real numbers ( m 1 ,   m 2 ,   m 3 , m 4 ) in such a way that ( m 1 m 2 m 3 m 4 ), representing the smallest possible, most promising, and largest possible values, respectively. TrFN can accommodate higher level of uncertainty as compared to TFN. The membership function for trapezoidal fuzzy number A is mathematically described by Equation (8) [35]:
μ A ( y ) = { ( y m 1 ) ( m 2 m 1 ) ; m 1 y m 2 1 ; m 2 y m 3 ( m 4 y ) ( m 4 m 3 ) ; m 3 y m 4 0 ; o t h e r w i s e }

2.6.2. Fuzzy Proximity Index Value (FPIV) Method

In the FPIV method, first of all the major parameters/criteria are identified, and the potential alternatives are selected. The importance weights of criteria are collected from the experts/decision makers in linguistic terms which are subsequently converted into fuzzy sets to cover the uncertainty in their judgement. Subsequently, aggregation of expert opinions is done to obtain importance weights of the criteria. Method of FPIV involves the following steps:
STEP 1: Construction of Decision Matrix
Decision matrix (DM) is formulated, as shown in Table 4, by arranging alternatives/experiments (A1, A2, …., Am) in rows and criteria/the output responses (C1, C2, …, Cn) in columns. The element x i j of DM represents the decision value of alternative i corresponding to criteria j .
In the cases which involved more than one decision maker, the aggregated value is determined by taking weighted average of the decision values. This is done by taking into consideration the weight based on the significance of respective decision maker. Where all the Decision Makers are considered equally important, the aggregation is obtained by simply averaging the values given by all the Decision Makers.
STEP 2: Normalization
Normalization is done to bring the elements of DM on a common scale. Each element in the DM is normalized separately using the vector normalization, given by Equation (9):
r i j = x i j j = 1 m x i j 2 ;                       i = 1 ,   2 ,   ,   m ;     j = 1 ,   2 ,   ,   n
The normalized fuzzy sets ( r i j ) are used to construct the Normalized Decision Matrix (NDM), as shown in Table 5.
STEP 3: Formulation of Fuzzy Weighted Decision Matrix (FWDM):
In this step, elements of the normalized decision matrix are multiplied with corresponding elements of the fuzzy criteria weight vector ( w ˜ j ) to obtain Fuzzy Weighted Decision values v ˜ i j , and tabulated in Fuzzy Weighted Decision Matrix (FWDM) as shown in Table 6.
STEP4: Identification of Best Fuzzy Decision Values:
The best fuzzy decision values are identified as per the following rule:
v ˜ best = { v ˜ max ; for   benefitial   criteria v ˜ min ; for   non benefitial   criteria }
Each element of the fuzzy set ( v ˜ ij ) is considered separately for identification of the best values.
STEP 5: Calculation of Fuzzy Proximity Index ( u ˜ ij )
Now, in order to determine the deviation of each value from the corresponding best element, fuzzy proximity index, ( u ˜ ij ) for each normalized weighted element, ( v ˜ i ) is calculated by finding its linear distance from corresponding best value as given by Equation (11).
u ˜ ij = { v ˜ max v ˜ ij ( for   benefitial   attribute )   v ˜ ij v ˜ min   ( for   cost   attribute ) }
STEP 6: Determination of Fuzzy Overall Proximity Index d ˜ ij
The fuzzy proximity index values of each alternative are added together to obtain fuzzy overall proximity index d ˜ ij , as given in Equation (12) for each alternative:
d ˜ ij = j = 1 m u ˜ ij
STEP 7: Defuzzification of d ˜ ij
Defuzzification is the process in which defuzzification of the fuzzy elements ( d ˜ ij ) takes place to transform them into equivalent crisp values ( d i ) in order to get Overall Proximity Index (OPI). There are different methods available in literature, for converting fuzzy numbers into defuzzified values e.g. Mean-of-Maximum, Center-of-Area, α-cut Method, center of gravity method, graded mean integration representation and signed distance method. Graded Mean Integration Representation (GMIR) method of Chen and Hsieh [36] has been adopted in current study, due to its simplicity and powerful capability in solving problem [37]. In the GMIR method of defuzzification, the central components of the fuzzy set are assigned a higher weight compared to the exterior values.
The GMIR method for converting TFN ( d ˜ ij = a 1 ij , a 2 ij ,   a 3 ij ;   a 1 ij a 2 ij a 3 ij ) into equivalent crisp values ( d ij ), uses Equation (13) [37,38].
d i = a 1 ij + 4 a 2 ij + a 3 ij 6
For a TrFN defined by ( d ˜ ij = m 1 ,   m 2 ,   m 3 , m 4 ), the GMIR assigns double weights to the central values. Equation (14) can be used to determine the defuzzified values of TrFN [37,39]:
d i = m 1 ij + 2 ( m 2 ij + m 3 ij ) + m 4 ij 6
The OPI score ( d i ) , called Overall Proximity Index (OPI), reveals the degree of closeness of the alternative to the hypothetical best alternative and therefore, it forms the basis for ranking of alternatives. Lower the OPI score better is the alternative.

3. Results and Discussion

The linguistic equivalents such as Extremely low (EL), Very low (VL), Low (L), Medium (M), High (H), Very high (VH), and Extremely high (EH) were allotted to the importance weights of the output responses. The following triangular fuzzy numbers were used to describe the linguistic equivalents [17]: (0, 0, 0.1) for EL, (0, 0.1, 0.3) for VL, (0.1, 0.3, 0.5) for L, (0.3, 0.5, 0.7) for M, (0.5, 0.7, 0.9) for H, (0.7, 0.9, 1.0) for VH, and (0.9, 1.0, 1.0) for EH. A decision making panel comprising of four experts individually assessed the importance weight of each output response in linguistic equivalents. Table 7 shows the experts response and Table 8 shows the aggregated fuzzy weights of the output responses.
The decision matrix (DM) is shown in Table 3. Using Equations (9)–(13), d i value for each experimental run of the L18orthogonal array was computed and these are shown in Table 9. Based on the d i values, the experiments were ranked in such a way that the experiment having the lowest d i value was ranked first and the rank of the experiments decreased with increasing d i value. It is evident from Table 9 that rank of experiment number 16 is 1 as its d i value is minimum (0.0650). Thus, the combination of the input parameters used in experiment number 16 is the best for the multiple responses of the NFECs. However, this combination may or may not be the optimal combination for the optimal multiple responses.
A robust approach for assessment of the optimal combination of the input parameters was suggested by Taguchi. It involves the determination of the signal-to-noise (S/N) ratio of the multiple response index which in this case is the overall proximity index followed by analysis of means (ANOM). The computation process of the S/N ratio and ANOM analysis can be easily tracked in literature [40]. Table 10 shows the overall proximity index value of each experiment and the corresponding S/N ratio.
Table 11 shows ANOM results of the S/N ratio given in Table 10. Further, the S/N graph is shown in Figure 4.
From the ANOM results as shown in Table 11 and S/N graph displayed in Figure 4, it is found that the optimum multiple performance of the NFCES is obtained for 60 °C nanofluid inlet temperature (level 2 of A), 5 kW engine load (level 1 of B), 1.25 L/min flow rate of the nanofluid (level 1 of C), and 1.0% vol concentration of nanoparticle (level 3 of D) and thus, A2B1C1D3 is the optimum combination of the input parameters for multi-performance. As shown in Table 11, the difference between the maximum and the minimum value of the S/N ratio of the input parameters is as follow: 4.17 for nanofluid inlet temperature (A), 1.19 for engine load (B), 2.60 for nanofluid flow rate (C) and 4.84 for nanoparticle concentration (D). The most influential input parameter affecting multi performance characteristics of the NFECS is determined by comparing these values. This comparison reveals the degree of significance of the input parameters for affecting the multi-performance characteristics. The most influential input parameter is the one having maximum of these values. Therefore nanoparticle concentration with value of 4.84 indicates that among the four input parameters, it has the strongest effect on the multi-performance characteristics of the NFECS. The level of importance of the input parameters to the multi-performance characteristics of the NFECS in decreasing order is as follows: nanoparticle concentration, nanofluid inlet temperature, nanofluid flow rate and engine load. Results of the present study are discussed as follows: Among the three levels of nanoparticle concentration considered in the study, the highest level of 1% vol. has resulted in the optimum multi-responses of the NFECS. This result gets support from the previous experimental and numerical studies related to heat transfer enhancement of nanofluid [41,42]. The reason for enhancement is the seeding of nanoparticles in the base fluid which increases the thermal conductivity as well as heat transfer coefficient (h) of nanofluid circulating through the vertical flat tube radiator. The second most affecting parameter is the nanofluid inlet temperature. Results of multi-response optimisation of this study suggest that out of its two levels, the second level i.e., 60 °C provides optimum performance. This result is consistent with the numerical studies on flat tube conducted by Zhao et al. [43] and also study of Vajjha et al. [44] in which they found that at higher nanofluid inlet temperature heat transfer was better. The reason of heat transfer enhancement is increase in thermal conductivity of the nanofluid at elevated temperature. This observation might be due to thedecrement in the value of density and viscosity of the nanofluid at high inlet temperature which make the fluid stable demanding lesser pumping power for its circulation [43]. The next parameter in decreasing order of its importance is flow rate of nanofluid. The optimised results show that the low level of flow rate (i.e., 1.25 lpm) is responsible for better output performance in comparison to other two levels. This result is also supported by a previous study [45], which reported that low or medium flow rate was preferred for better heat transfer because at lower volume flow rate, coolant got maximum amount of time for heat exchange. It is to be noted that time also plays a significant role in the heat exchange process. If the heat exchange medium does not get adequate time to interact with the other medium, then there is a possibility of ineffective heat transfer. The last and the least influencing parameter is engine load. In this study the first level (i.e., 5 kW load) is found to be the optimum level for better multi-response. Since it is the least affecting parameter therefore, it merely influences the response variables. Lower the load smaller the heat generation from the engine. Hence, it will be easy for coolant to effectively remove heat via radiator of the engine.

3.1. Analysis of Variance (ANOVA)

Analysis of variance (ANOVA) is an important statistical method for determination of the significance of input parameters in affecting the multiple responses represented by S/N ratio of the overall proximity index in the present study. The principle of ANOVA is based on separating total variations in the values of S/N ratios into two components: (i) variation due to individual input parameter and interaction between them and (ii) variation due to random error. ANOVA begins with formulation of the competing hypotheses and then determines sum of squares, degrees of freedom, mean square, F-ratio, p-value, and percentage contribution. The F-ratio is used to test the hypothesis in ANOVA. Details about computational steps of ANOVA can be found in any standard text on Statistics [46] or in the available literature [
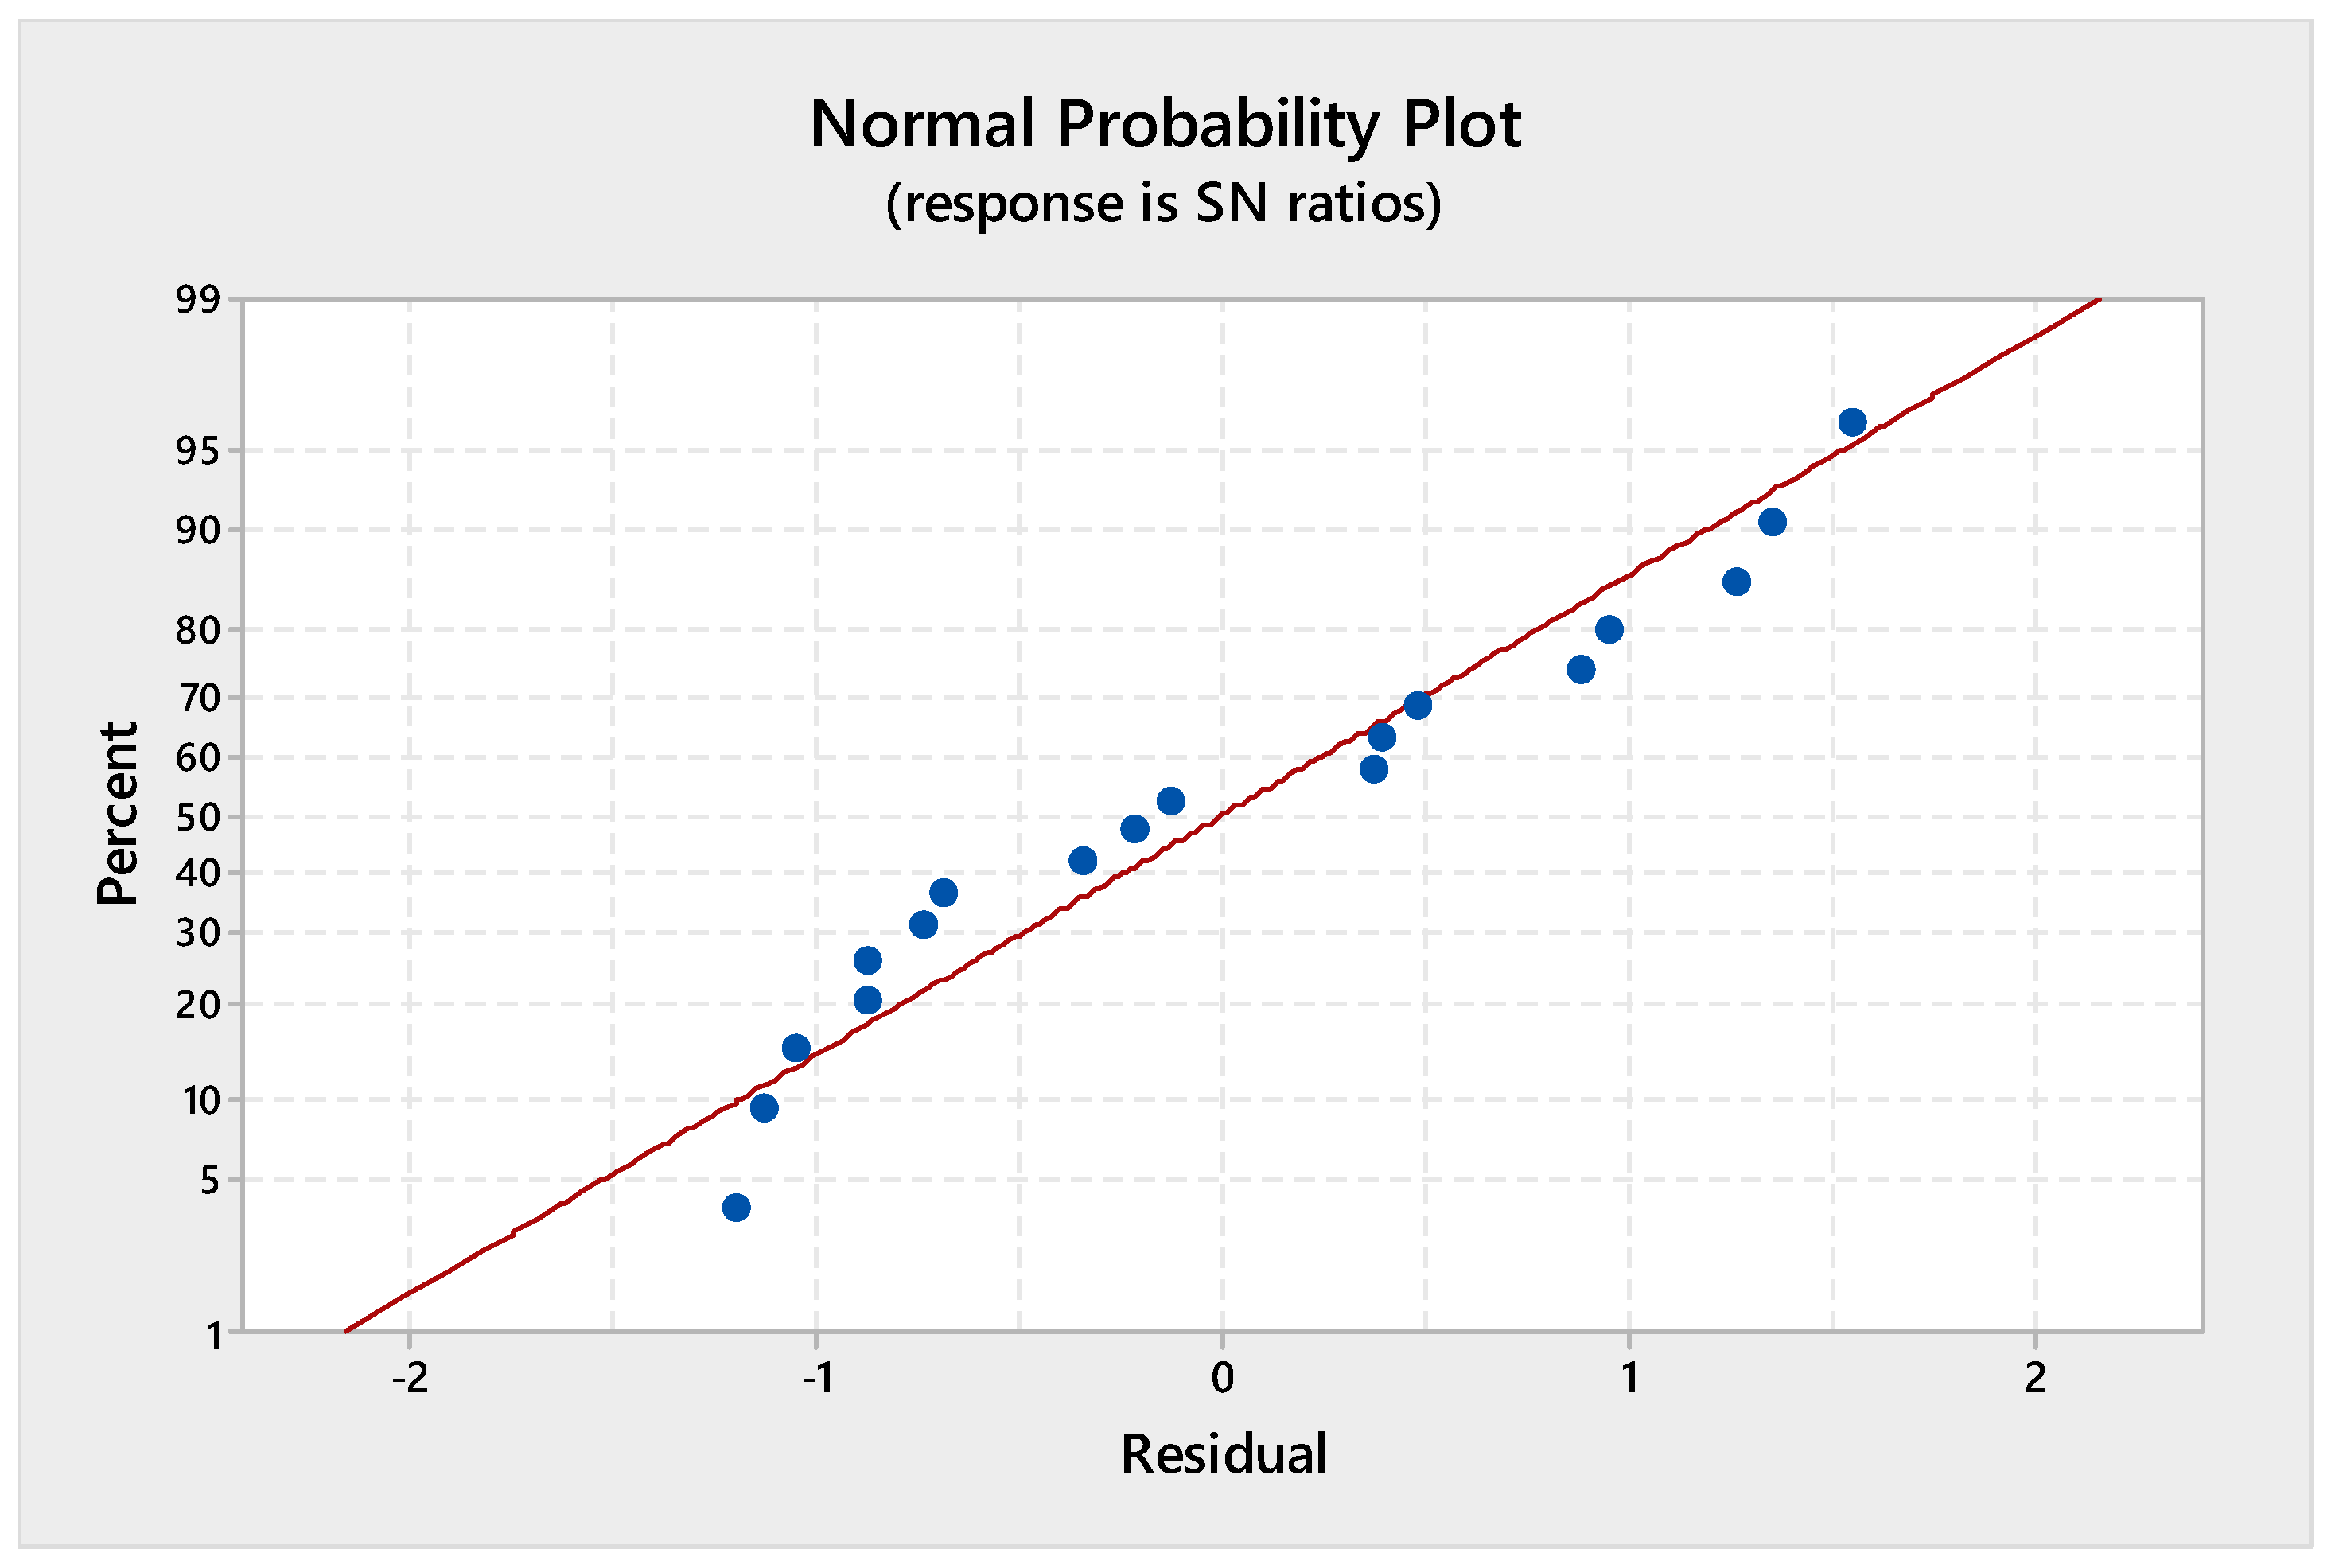
40]. ANOVA is a valid analysis technique for a data set which is normally distributed and therefore, it is necessary to check whether the data are normally distributed or not. The normality check was done through normal probability plot which is shown in Figure 5. It can be seen from Figure 5 that the points either fall on the straight line or are very close to it and therefore, it implies that the data set is almost normally distributed.
It may be noted that only significance of the individual input parameter in affecting the multiple responses is considered in the present study. The following hypotheses are constructed for the ANOVA:
  • H0: There is no significant effect of the input parameters on the multiple responses
  • H1: There is significant effect of the input parameters on the multiple responses
The hypothesis test was carried out at a significance level of 5% i.e., α = 0.05. The results of ANOVA results for the S/N ratios are shown in Table 12. It is evident from Table 12 that input parameters A, C, and D significantly affect the response variables as F-ratios are high (53.82, 7.73, and 29.56 respectively) and p-values are less than 0.05. From the percentage contribution shown in the last column of Table 9, it is clear that the most significant input parameter is D (41.72%) followed by A (37.98%), C (10.91%), and B (2.33%).

3.2. Regression Analysis

Regression analysis was carried out to develop a mathematical relationship between the input parameters and the S/N ratio. A linear regression model gave the relationship shown in Equation (15).
S/N = 6.87 + 0.2084 A − 0.119 B − 2.04 C + 6.05 D
Coefficient of determination (R2) for the regression model was found as 80.27% which signifies that 80.27% variation in the value of S/N ratio is explained by variation in the input parameters. For checking the significance of the linear model shown in Equation (15), ANOVA was carried out and the results of which are shown in Table 13.
From the results of ANOVA shown in Table 13, it is evident that linear regression model is significant and therefore, Equation (15) can be used to determine the value of S/N ratio for given values of input parameters A, B, C, and D.

3.3. Confirmatory Test

Another important and the final task after obtaining the optimal combination of the input parameters is to confirm the results obtained via confirmatory test. In the confirmatory test predicted value of the S/N ratio at the obtained optimal combination of the input parameters was determined using Equation (16).
η ^ = η m + ( η A 2 η m ) + ( η B 1 η m ) + ( η C 1 η m ) + ( η D 3 η m )
where, η ^ is the predicted S/N ratio, η m is the overall mean of the S/N ratios, η A 2 is the mean S/N ratio at level 2 of the input parameter A, η B 1 is the mean S/N ratio at level 1 of the input parameter B, η C 1 is the mean S/N ratio at level 1 of the input parameter C, and η D 3 is the mean S/N ratio at level 3 of the input parameter D. The predicted S/N ratio was compared with the experimental value of the S/N ratio at the optimal combination of the input parameters and if the predicted and experimental values were in close agreement then the optimal combination was validated. In the present study the optimal combination of the input parameters is A2B1C1D3 and this combination is available in experiment number 10 (Table 10) of the L18 orthogonal therefore the experimental value of the S/N ratio is 22.8883. Table 14 shows the results of the confirmatory test. It can be seen from Table 14 that the difference between the experimental and predicted values of the S/N ratio is very small i.e., only 3.04%. Thus, the confirmatory test validates that A2B1C1D3 is the optimal combination of the input parameters for optimum multi-performance characteristic of the NFECS.

4. Conclusions, Limitations and Scope for Future Research

4.1. Conclusions

For improved overall performance of the I. C. engines, it is necessary to use an effective and efficient cooling mechanism. In recent times, nanofluids are being used for this purpose due to their better thermal properties and stability. In this work a nanofluid was prepared by suspending Al2O3 nanoparticles in the mixture of water-EG and a mechanism for cooling the engine using this nanofluid known as NFECS was proposed. Furthermore, a combined Taguchi and fuzzy PIV method is also proposed to solve multi-response optimization problem as the performance of the NFECS is affected by several critical input parameters. Taguchi’s L18 OA which is indeed a mixed level design of experiment was used to explore effect of four input parameters on five output responses. Triangular fuzzy numbers were used to determine fuzzy weighting factors of the output responses. Fuzzy PIV was used to rank the eighteen experimental runs based on the overall proximity index values. S/N ratios for the overall proximity index values were subsequently calculated and ANOM was performed. Based on ANOM results, optimum combination of the input parameters and their levels was determined. The optimal performance of the NFECS was obtained for 60 °C nanofluid inlet temperature (level 2), 5 kW engine load (level 1), 1.25 l/m in nanofluid flow rate (level 1), and 1.0% vol concentration of the nanofluid (level 3). This set of input parameters gave better heat transfer performance along with lesser pumping power and high stability. The radiator effectiveness was increased by using the nanofluids and was inversely related with volume concentration. The effectiveness of radiator was higher at the lower volume concentrations, while at higher volume concentrations it reduced because of increase in pumping power and degradation of heat transfer performance. From the ANOVA results, it was observed that concentration of the nanofluid, nanofluid inlet temperature and nanofluid flow rate significantly affected the multi-responses of the NFECS, having contributions of 41.72%, 37.98% and 10.91% respectively. A linear relationship between the S/N ratio of the multi-responses and the input parameters was found to be significant. The confirmatory test validated the derived optimum combination of input parameters and their levels for optimum multi-responses of the NFECS. This paper demonstrated that Taguchi based fuzzy PIV method was quite efficient and effective in solving the multi-response optimization problem considered in this study. The improved heat transfer from the engine using the nanofluid based cooling mechanism may lead to development of smaller and lighter car radiators, which further lowers the capital and running cost.

4.2. Limitations of the Study

Every study is associated with certain limitations and therefore, it is essential to highlight them. Following are the limitations of the present study:
  • Flat tubes radiator was used in this study.
  • Only one type of nanofluid i.e., Al2O3/Water-EG was considered, for performance investigation.
  • It considered three input parameters each at three levels and one input parameter with two levels and five output responses pertaining to NFECS.
  • It only emphasized the main effect of the input parameters and did not consider the combined or interaction effect of the input parameters on the multi-performance of the NFECS.
  • It collected responses from only a few decision makers/experts to compute weighting factors of the output responses.

4.3. Scope for Future Research

As such, it is indeed difficult to suggest scope for future research because the scope does not have any limit. However, following suggestions are made to be incorporated in future studies:
  • Different designs of radiator tubes can be employed in the NFECS.
  • Different metallic, non-metallic and carbon-based nanoparticles can be used to prepare nanofluid.
  • More input parameters with more levels may be considered.
  • Multi-performance optimization considering interaction or combined effects of the input parameters may be carried out.
  • More numbers of input parameters and output responses may be considered.
  • Opinions from more decision makers or experts may be obtained to determine weighting factors of the output responses.
  • Other fuzzy based multi-attribute decision making methods such as fuzzy TOPSIS, fuzzy-VIKOR, fuzzy-PROMETHEE, fuzzy-ELECTRE etc. may be used.

Author Contributions

Conceptualization, S.M.Y., and Z.A.K.; Methodology, M.S., S.M.Y. and Z.A.K.; Software, I.A.B., A.E.A. and M.A.; Validation, I.A.B., A.E.A. and M.A.; Formal Analysis, S.M.Y., I.A.B., A.E.A., M.A. and Z.A.K.; Investigation, M.S. and S.M.Y.; Resources, S.M.Y. and Z.A.K.; Data Curation, M.S., S.M.Y., I.A.B., A.E.A., M.A. and Z.A.K.; Writing-Original Draft Preparation, M.S., S.M.Y., M.A. and Z.A.K.; Writing-Review & Editing, I.A.B. and A.E.A.; Visualization, S.M.Y. and Z.A.K.; Supervision, S.M.Y.; Project Administration, S.M.Y., I.A.B. and A.E.A.; Funding Acquisition, I.A.B. and A.E.A. All authors have read and agreed to the published version of the manuscript.

Funding

The project is funded by King Khalid University under the grant number R.G.P. 1/120/40.

Acknowledgments

The authors extend their appreciation to the Deanship of Scientific Research at King Khalid University for funding this work through research groups program under grant number (R.G.P. 1/120/40).

Conflicts of Interest

The authors declare no conflict of interest.

References

  1. Elbadawy, I.; Elsebay, M.; Shedid, M.; Fatouh, M. Reliability of nanofluid concentration on the heat transfer augmentation in engine radiator. Int. J. Automot. Technol. 2018, 19, 233–243. [Google Scholar] [CrossRef]
  2. Leong, K.; Saidur, R.; Kazi, S.; Mamun, A. Performance investigation of an automotive car radiator operated with nanofluid-based coolants (nanofluid as a coolant in a radiator). Appl. Therm. Eng. 2010, 30, 2685–2692. [Google Scholar] [CrossRef]
  3. Naraki, M.; Peyghambarzadeh, S.; Hashemabadi, S. Parametric study of overall heat transfer coefficient of CuO/water nanofluids in a car radiator. Int. J. Therm. Sci. 2013, 66, 82–90. [Google Scholar] [CrossRef]
  4. Hussein, A.; Bakar, R.; Kadirgama, K. Study of forced convection nanofluid heat transfer in the automotive cooling system. Case Stud. Therm. Eng. 2014, 2, 50–61. [Google Scholar] [CrossRef] [Green Version]
  5. Hussein, A.; Bakar, R.; Kadirgama, K. Heat transfer enhancement using nanofluids in an automotive cooling system. Int. Commun. Heat Mass Transf. 2014, 53, 195–202. [Google Scholar] [CrossRef]
  6. Suganthi, K.; Vinodhan, V.; Rajan, K. Heat transfer performance and transport properties of ZnO–ethylene glycol and ZnO–ethylene glycol–water nanofluid coolants. Appl. Energy 2014, 135, 548–559. [Google Scholar] [CrossRef]
  7. Ali, H.; Liaquat, H.; Maqsood, H.; Nadir, M. Experimental investigation of convective heat transfer augmentation for car radiator using ZnO–water nanofluids. Energy 2015, 84, 317–324. [Google Scholar] [CrossRef]
  8. Khan, T.A.; Hassaan, A. CFD-based comparative performance analysis of different nanofluids used in automobile radiators. Arab. J. Sci. Eng. 2019, 44, 5787–5799. [Google Scholar] [CrossRef]
  9. Devireddy, S.; Mekala, C.S.R.; Veeredhi, V.R. Improving the cooling performance of automobile radiator with ethylene glycol water based TiO2nanofluids. Int. Commun. Heat Mass Transf. 2016, 78, 121–126. [Google Scholar] [CrossRef]
  10. Lootsman, F.A. Multicriteria Decision Analysis via Ratio and Difference Judgement; Kluwer Academic Publisher: Dordrecht, The Netherlands, 1999. [Google Scholar]
  11. Saaty, T.L. The Analytic Hierarchy Process; McGraw-Hill: New York, NY, USA, 1980. [Google Scholar]
  12. Hwang, C.L.; Yoon, K. Multiple Attribute Decision Making, a State of the Art Survey; Springer: New York, NY, USA, 1981. [Google Scholar]
  13. Tong, L.I.; Chen, C.C.; Wang, C.H. Optimization of multi-response processes using the VIKOR method. Int. J. Adv. Manuf. Technol. 2007, 31, 1049–1057. [Google Scholar] [CrossRef]
  14. Deng, J.L. Introduction to grey system. J. Grey Syst. 1989, 1, 1–24. [Google Scholar]
  15. Kheybari, S.; Rezaie, F.M.; Naji, S.A.; Najafi, F. Evaluation of energy production technologies from biomass using analytical hierarchy process: The case of Iran. J. Clean. Prod. 2019, 232, 257–265. [Google Scholar] [CrossRef]
  16. Liu, J.; Wei, Q. Risk evaluation of electric vehicle charging infrastructure public-private partnership projects in China using fuzzy TOPSIS. J. Clean. Prod. 2018, 189, 211–222. [Google Scholar] [CrossRef]
  17. Sivapirakasam, S.P.; Mathew, J.; Surianarayanan, M. Multi-attribute decision making for green electrical discharge machining. Expert Syst. Appl. 2011, 38, 8370–8374. [Google Scholar] [CrossRef]
  18. Liu, H.-C.; You, J.-X.; You, X.-Y.; Shan, M.-M. A novel approach for failure mode and effects analysis using combination weighting and fuzzy VIKOR method. Appl. Soft Comput. 2015, 28, 579–588. [Google Scholar] [CrossRef]
  19. Muqeem, M.; Sherwani, A.F.; Ahmad, M.; Khan, Z.A. Taguchi based combined grey relational and principal component analyses for multi-response optimization of diesel engines. Grey Syst. Theory Appl. 2017, 7, 408–425. [Google Scholar] [CrossRef]
  20. Mufazzal, S.; Muzakkir, S.M. A new multi-criterion decision making (MCDM) method based on proximity indexed value for minimizing rank reversals. Comput. Ind. Eng. 2018, 119, 427–438. [Google Scholar] [CrossRef]
  21. Aiello, G.; Enea, M.; Galante, G.; La Scalia, G. Clean agent selection approached by fuzzy TOPSIS decision-making method. Fire Technol. 2009, 45, 405–418. [Google Scholar] [CrossRef]
  22. Zadeh, L.A. Fuzzy sets. Infect. Control 1965, 8, 338–353. [Google Scholar] [CrossRef] [Green Version]
  23. Bortolan, G.; Degami, R. A review of some methods for ranking fuzzy subset. Fuzzy Sets Syst. 1985, 15, 1–19. [Google Scholar] [CrossRef]
  24. Rani, P.; Mishra, A.R.; Pardasani, K.R.; Mardani, A.; Liao, H.; Streimikiene, D. A novel VIKOR approach based on entropy and divergence measures of Pythagorean fuzzy sets to evaluate renewable energy technologies in India. J. Clean. Prod. 2019, 238, 117936. [Google Scholar] [CrossRef]
  25. Lin, W.; Ren, H.; Ma, Z.; Yang, L. Using fuzzy clustering and weighted cumulative probability distribution techniques for optimal design of phase change material thermal energy storage. J. Clean. Prod. 2019, 233, 1259–1268. [Google Scholar] [CrossRef]
  26. Liou, J.J.H.; Chuang, Y.C.; Zavadskas, E.K.; Tzeng, G.H. Data-driven hybrid multiple attribute decision-making model for green supplier evaluation and performance improvement. J. Clean. Prod. 2019, 241, 118321. [Google Scholar] [CrossRef]
  27. Wang, Z.; Ren, J.; Goodsite, M.E.G.; Xu, G. Waste-to-energy, municipal solid waste treatment, and best available technology: Comprehensive evaluation by an interval valued fuzzy multi-criteria decision making method. J. Clean. Prod. 2018, 172, 887–899. [Google Scholar] [CrossRef]
  28. Ansari, S.; Hussain, T.; Yahya, S.M.; Chaturvedi, P.; Sardar, N. Experimental investigation of viscosity of nanofluids containing oxide nanoparticles at varying shear rate. J. Nanofluids 2018, 7, 1075–1080. [Google Scholar] [CrossRef]
  29. Oliveira, G.; Contreras, E. Experimental study on the heat transfer of MWCNT/water nanofluid flowing in a car radiator. Appl. Therm. Eng. 2017, 111, 1450–1456. [Google Scholar] [CrossRef]
  30. Sundar, L.S.; Farooky, M.H.; Sarada, S.N.; Singh, M.K. Experimental thermal conductivity of ethylene glycol and water mixture based low volume concentration of Al2O3 and CuOnanofluids. Int. Commun. Heat Mass Transf. 2013, 41, 41–46. [Google Scholar] [CrossRef]
  31. Peyghambarzadeh, S.; Hashemabadi, S. Experimental study of heat transfer enhancement using water/ethylene glycol based nanofluids as a new coolant for car radiators. Int. Commun. Heat Mass Transf. 2011, 38, 1283–1290. [Google Scholar] [CrossRef]
  32. Elsebay, M.; Elbadawy, I.; Shedid, M.H.; Fatouh, M. Numerical resizing study of Al2O3 and CuOnanofluids in the flat tubes of a radiator. Appl. Math. Model. 2015, 40, 6437–6450. [Google Scholar] [CrossRef]
  33. Bellman, R.E.; Zadeh, L.A. Decision-making in a fuzzy environment. Manag. Sci. 1970, 17, 141–164. [Google Scholar] [CrossRef]
  34. Vahidnia, M.H.; Alesheikh, A.A.; Alimohammadi, A. Hospital site selection using fuzzy AHP and its derivatives. J. Environ. Manag. 2009, 90, 3048–3056. [Google Scholar] [CrossRef] [PubMed]
  35. Girubha, R.J.; Vinodh, S. Application of fuzzy VIKOR and environmental impact analysis for material selection of an automotive component. Mater. Des. 2012, 37, 478–486. [Google Scholar] [CrossRef]
  36. Chen, S.H.; Hsieh, C.H. Representation, ranking, distance, and similarity of L-R type fuzzy number and application. Aust. J. Intell. Process. Syst. 2000, 6, 217–229. [Google Scholar]
  37. Liao, M.S.; Liang, G.S.; Chen, C.Y. Fuzzy grey relation method for multiple criteria decision-making problems. Qual. Quant. 2013, 47, 3065–3077. [Google Scholar] [CrossRef]
  38. Guo, S.; Zhao, H. Fuzzy best-worst multi-criteria decision-making method and its applications. Knowl. Based Syst. 2017, 121, 23–31. [Google Scholar] [CrossRef]
  39. Rojas-Mora, J.; Gil-Lafuente, J.; Josselin, D. On the absolute value of trapezoidal fuzzy numbers and the manhattan distance of fuzzy vectors. In Proceedings of the International Conference on Evolutionary Computation Theory and Applications, Paris, France, 24–26 October 2011; pp. 399–406, ISBN 978-989-8425-83-6. [Google Scholar] [CrossRef] [Green Version]
  40. Yahya, S.M.; Asjad, M.; Khan, Z.A. Multi-response optimization of TiO2/EG-water nano-coolant using entropy based preference indexed value (PIV) method. Mater. Res. Express 2019, 6, 0850a1. [Google Scholar] [CrossRef]
  41. Chen, H.; Yang, W.; He, Y.; Ding, Y.; Zhang, L.; Tan, C.; Lapkin, A.A.; Bavykin, D.V. Heat transfer and flow behaviour of aqueous suspensions of titanate nanotubes (nanofluids). Powder Technol. 2008, 183, 63–72. [Google Scholar] [CrossRef]
  42. Wen, D.; Ding, Y. Experimental investigation into convective heat transfer of nanofluids at the entrance region under laminar flow conditions. Int. J. Heat Mass Transf. 2004, 47, 5181–5188. [Google Scholar] [CrossRef]
  43. Zhao, N.; Yang, J.; Li, H.; Zhang, Z.; Li, S. Numerical investigations of laminar heat transfer and flow performance of Al2O3-water nanofluids in a flat tube. Int. J. Heat Mass Transf. 2016, 92, 268–282. [Google Scholar] [CrossRef]
  44. Vajjha, R.S.; Das, D.K.; Ray, D.R. Development of new correlations for the Nusselt number and the friction factor under turbulent flow of nanofluids in flat tubes. Int. J. Heat Mass Transf. 2015, 80, 353–367. [Google Scholar] [CrossRef]
  45. Zarringhalam, M.; Karimipour, A.; Toghraie, D. Experimental study of the effect of solid volume fraction and Reynolds number on heat transfer coefficient and pressure drop of CuO-Water nanofluid. Exp. Therm. Fluid Sci. 2016, 76, 342–351. [Google Scholar] [CrossRef]
  46. Krishnaiah, K.; Shahabudeen, P. Applied Design of Experiments and Taguchi Methods; Prentice Hall of India Learning Private Limited: New Delhi, India, 2012; ISBN 978-81-203-4527-o. [Google Scholar]
Figure 1. Block diagram for the development of nanofluid.
Processes 08 00030 g001
Figure 2. Schematic line diagram of the experimental setup.
Processes 08 00030 g002
Figure 3. Flat tube of radiator
Processes 08 00030 g003
Figure 4. S/N graph.
Processes 08 00030 g004
Figure 5. Normal probability plot.
Processes 08 00030 g005
Table 1. Characteristic features of Al2O3 nanoparticles.
ParameterValue
Average particle size (nm)20
AppearanceWhitish
Specific surface area (m2/g)200
Purity (%)99.96
Thermal conductivity (W/mK)25
Density (kg/m3)3895
Table 2. Input parameters and their levels.
Input ParametersSymbolUnitLevel 1Level 2Level 3
Nanofluid inlet temperatureA°C4060-
Engine loadBkW51015
Nanofluid flow rateCL/min1.251.752.25
Nanoparticle concentrationD%vol0.20.61.0
Table 3. L18 orthogonal array (OA) along with values of output responses.
Experiment. No.Input ParametersOutput Responses
ABCDThermal Conductivity (W/mK)Heat Transfer Coefficient
(W/m2K)
Viscosity (cP)Engine Pumping Power (W)Stability (mV)
14051.250.20.6521950.700.1735
24051.750.60.6825600.790.1824
34052.251.00.7232400.990.2230
440101.250.20.6322530.710.2032
540101.750.60.6725880.800.2422
640102.251.00.7428951.010.2831
740151.250.60.6926660.810.2525
840151.751.00.7530221.000.3431
940152.250.20.6120920.680.2329
106051.251.00.7934400.750.2233
116051.750.20.6625100.510.1628
126052.250.60.7430250.590.2030
1360101.250.60.7631630.610.2126
1460101.751.00.8035220.740.2531
1560102.250.20.6824800.500.1930
1660151.251.00.8137050.760.3033
1760151.750.20.6923500.520.2729
1860152.250.60.7429420.620.2627
Table 4. Decision Matrix (DM).
Decision AlternativesDecision Criteria
C 1 C 2 C j C n
A 1 x 11 x 12 x 1 j x 1 n
A 2 x 21 x 22 x 2 j x 2 n
A i x i 1 x i 2 x i j x i n
A m x m 1 x m 2 x m j x m n
Table 5. Normalized Decision Matrix (NDM).
Decision AlternativesDecision Criteria
C 1 C 2 C j C n
A 1 r 11 r 12 r 1 j r 1 n
A 2 r 21 r 22 r 2 j r 2 n
A i r i 1 r i 2 r i j r i n
A m r m 1 r m 2 r m j r m n
Table 6. Fuzzy Weighted Decision Matrix (FWDM).
Decision Alternatives v ˜ i j = w ˜ j · r i j
C 1 C 2 C j C m
A 1 v ˜ 11 v ˜ 12 v ˜ 1 j v ˜ 1 n
A 2 v ˜ 21 v ˜ 22 v ˜ 2 j v ˜ 2 n
A i v ˜ i 1 v ˜ i 2 v ˜ i j v ˜ i n
A m v ˜ m 1 v ˜ m 2 v ˜ m j v ˜ m n
Table 7. Importance of output responses.
Output ResponseExperts
E1E2E3E4
Thermal conductivity of the nanofluidVHHVHEH
Heat transfer coefficientEHHHEH
Viscosity of the nanofluidLVLLL
Engine pumping powerLVLVLL
Stability of the nanofluidVHVHEHEH
Table 8. Fuzzy weights.
Output ResponsesFuzzy Weight
Thermal conductivity of the nanofluid(0.70, 0.875, 0.975)
Heat transfer coefficient(0.70, 0.85, 0.95)
Viscosity of the nanofluid(0.075, 0.25, 0.45)
Engine pumping power(0.05, 0.20, 0.40)
Stability of the nanofluid(0.80, 0.95, 1.00)
Table 9. Overall proximity index (di).
Experiment No.Nanofluid Inlet Temperature (°C)Engine Load (kW)Nanofluid Flow Rate (L/min)Nanoparticle Concentration (% vol)Overall Proximity Index (di)Rank
14051.250.20.16889
24051.750.60.226516
34052.251.00.14736
440101.250.20.199914
540101.750.60.255618
640102.251.00.172211
740151.250.60.224915
840151.751.00.172210
940152.250.20.243117
106051.251.00.07172
116051.750.20.179012
126052.250.60.12024
1360101.250.60.13855
1460101.751.00.08363
1560102.250.20.16598
1660151.251.00.06501
1760151.750.20.197813
1860152.250.60.16337
Table 10. Overall proximity index value and corresponding S/N ratio.
Experiment No.Nanofluid Inlet Temperature (°C)Engine Load (kW)Nanofluid Flow Rate (L/min)Nanoparticle Concentration (%vol)Overall Proximity Index (di)S/N Ratio (dB)
14051.250.20.168815.4527
24051.750.60.226512.8993
34052.251.00.147316.6337
440101.250.20.199913.9819
540101.750.60.255611.8479
640102.251.00.172215.2769
740151.250.60.224912.9584
840151.751.00.172215.2775
940152.250.20.243112.2843
106051.251.00.071722.8883
116051.750.20.179014.9423
126052.250.60.120218.4012
1360101.250.60.138517.1692
1460101.751.00.083621.5607
1560102.250.20.165915.6043
1660151.251.00.065023.7388
1760151.750.20.197814.0756
1860152.250.60.163315.7393
Table 11. ANOM results for S/N ratio.
Input ParametersLevel 1Level 2Level 3Max-MinRank
A14.0718.24-4.172
B16.8715.9115.681.194
C17.7015.1015.662.603
D14.3914.8419.234.841
Table 12. Analysis of variance (ANOVA) results for S/N ratios.
Source of VariationSum of Squares (SS)Degrees of Freedom (df)Mean Square (MS)F-Ratiop-ValueWhether Significant or NotPercentage Contribution (%)
A78.156178.15653.820.000Significant37.98
B4.79322.3961.650.240Not significant2.33
C22.450211.2257.730.009Significant10.91
D85.837242.91929.560.000Significant41.72
Error14.521101.452---7.06
Total205.75717----100
Table 13. ANOVA results for regression.
Source of VariationSum of Squares (SS)Degrees of Freedom (df)Mean Square (MS)F-Ratiop-ValueWhether Significant or Not
Regression165.165441.29113.220.000Significant
A78.156178.15625.030.000Significant
B4.25314.2531.360.264Not significant
C12.504112.5044.000.067Not significant
D70.252170.25222.500.000Significant
Error40.592133.122---
Total205.75717----
Table 14. Results of the confirmatory test.
Optimum Combination of the Input ParametersPredicted S/N RatioExperimental S/N RatioDifference (%)
A2B1C1D323.584622.88833.04%

