Study of the Lamellar and Micellar Phases of Pluronic F127: A Molecular Dynamics Approach

 , , and
Abstract
:
1. Introduction
2. Methodology
3. Results and Discussions
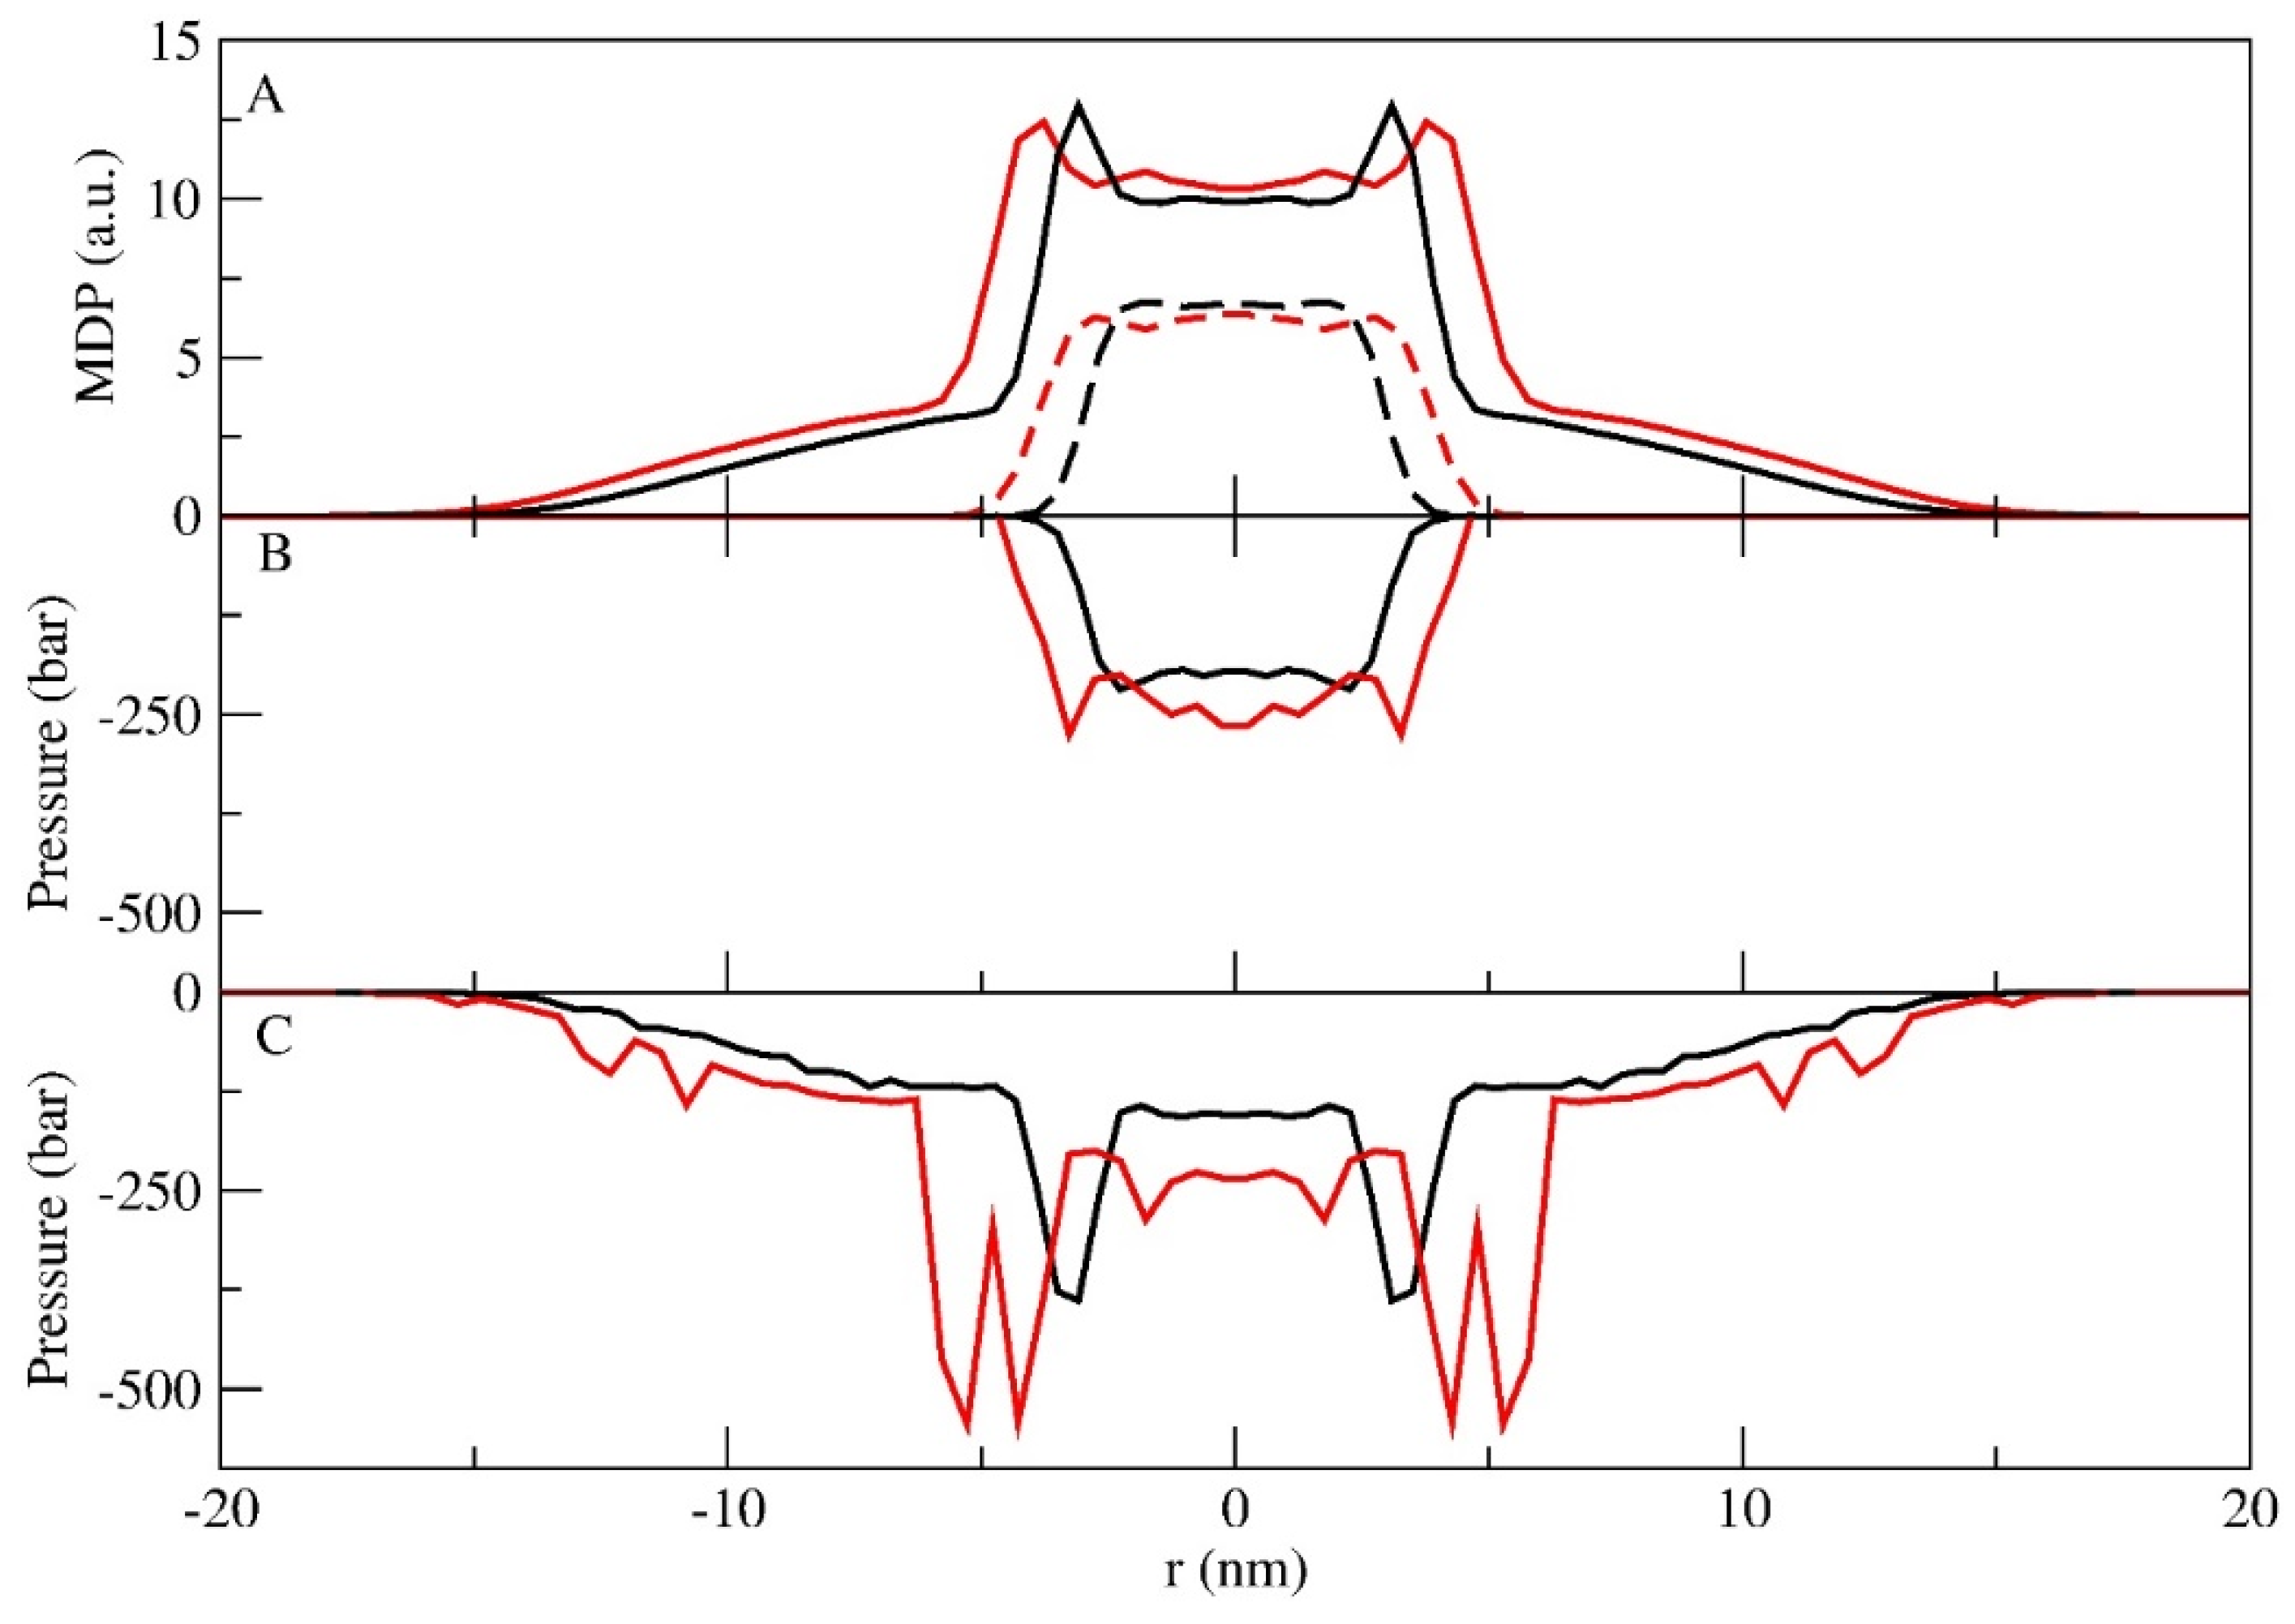
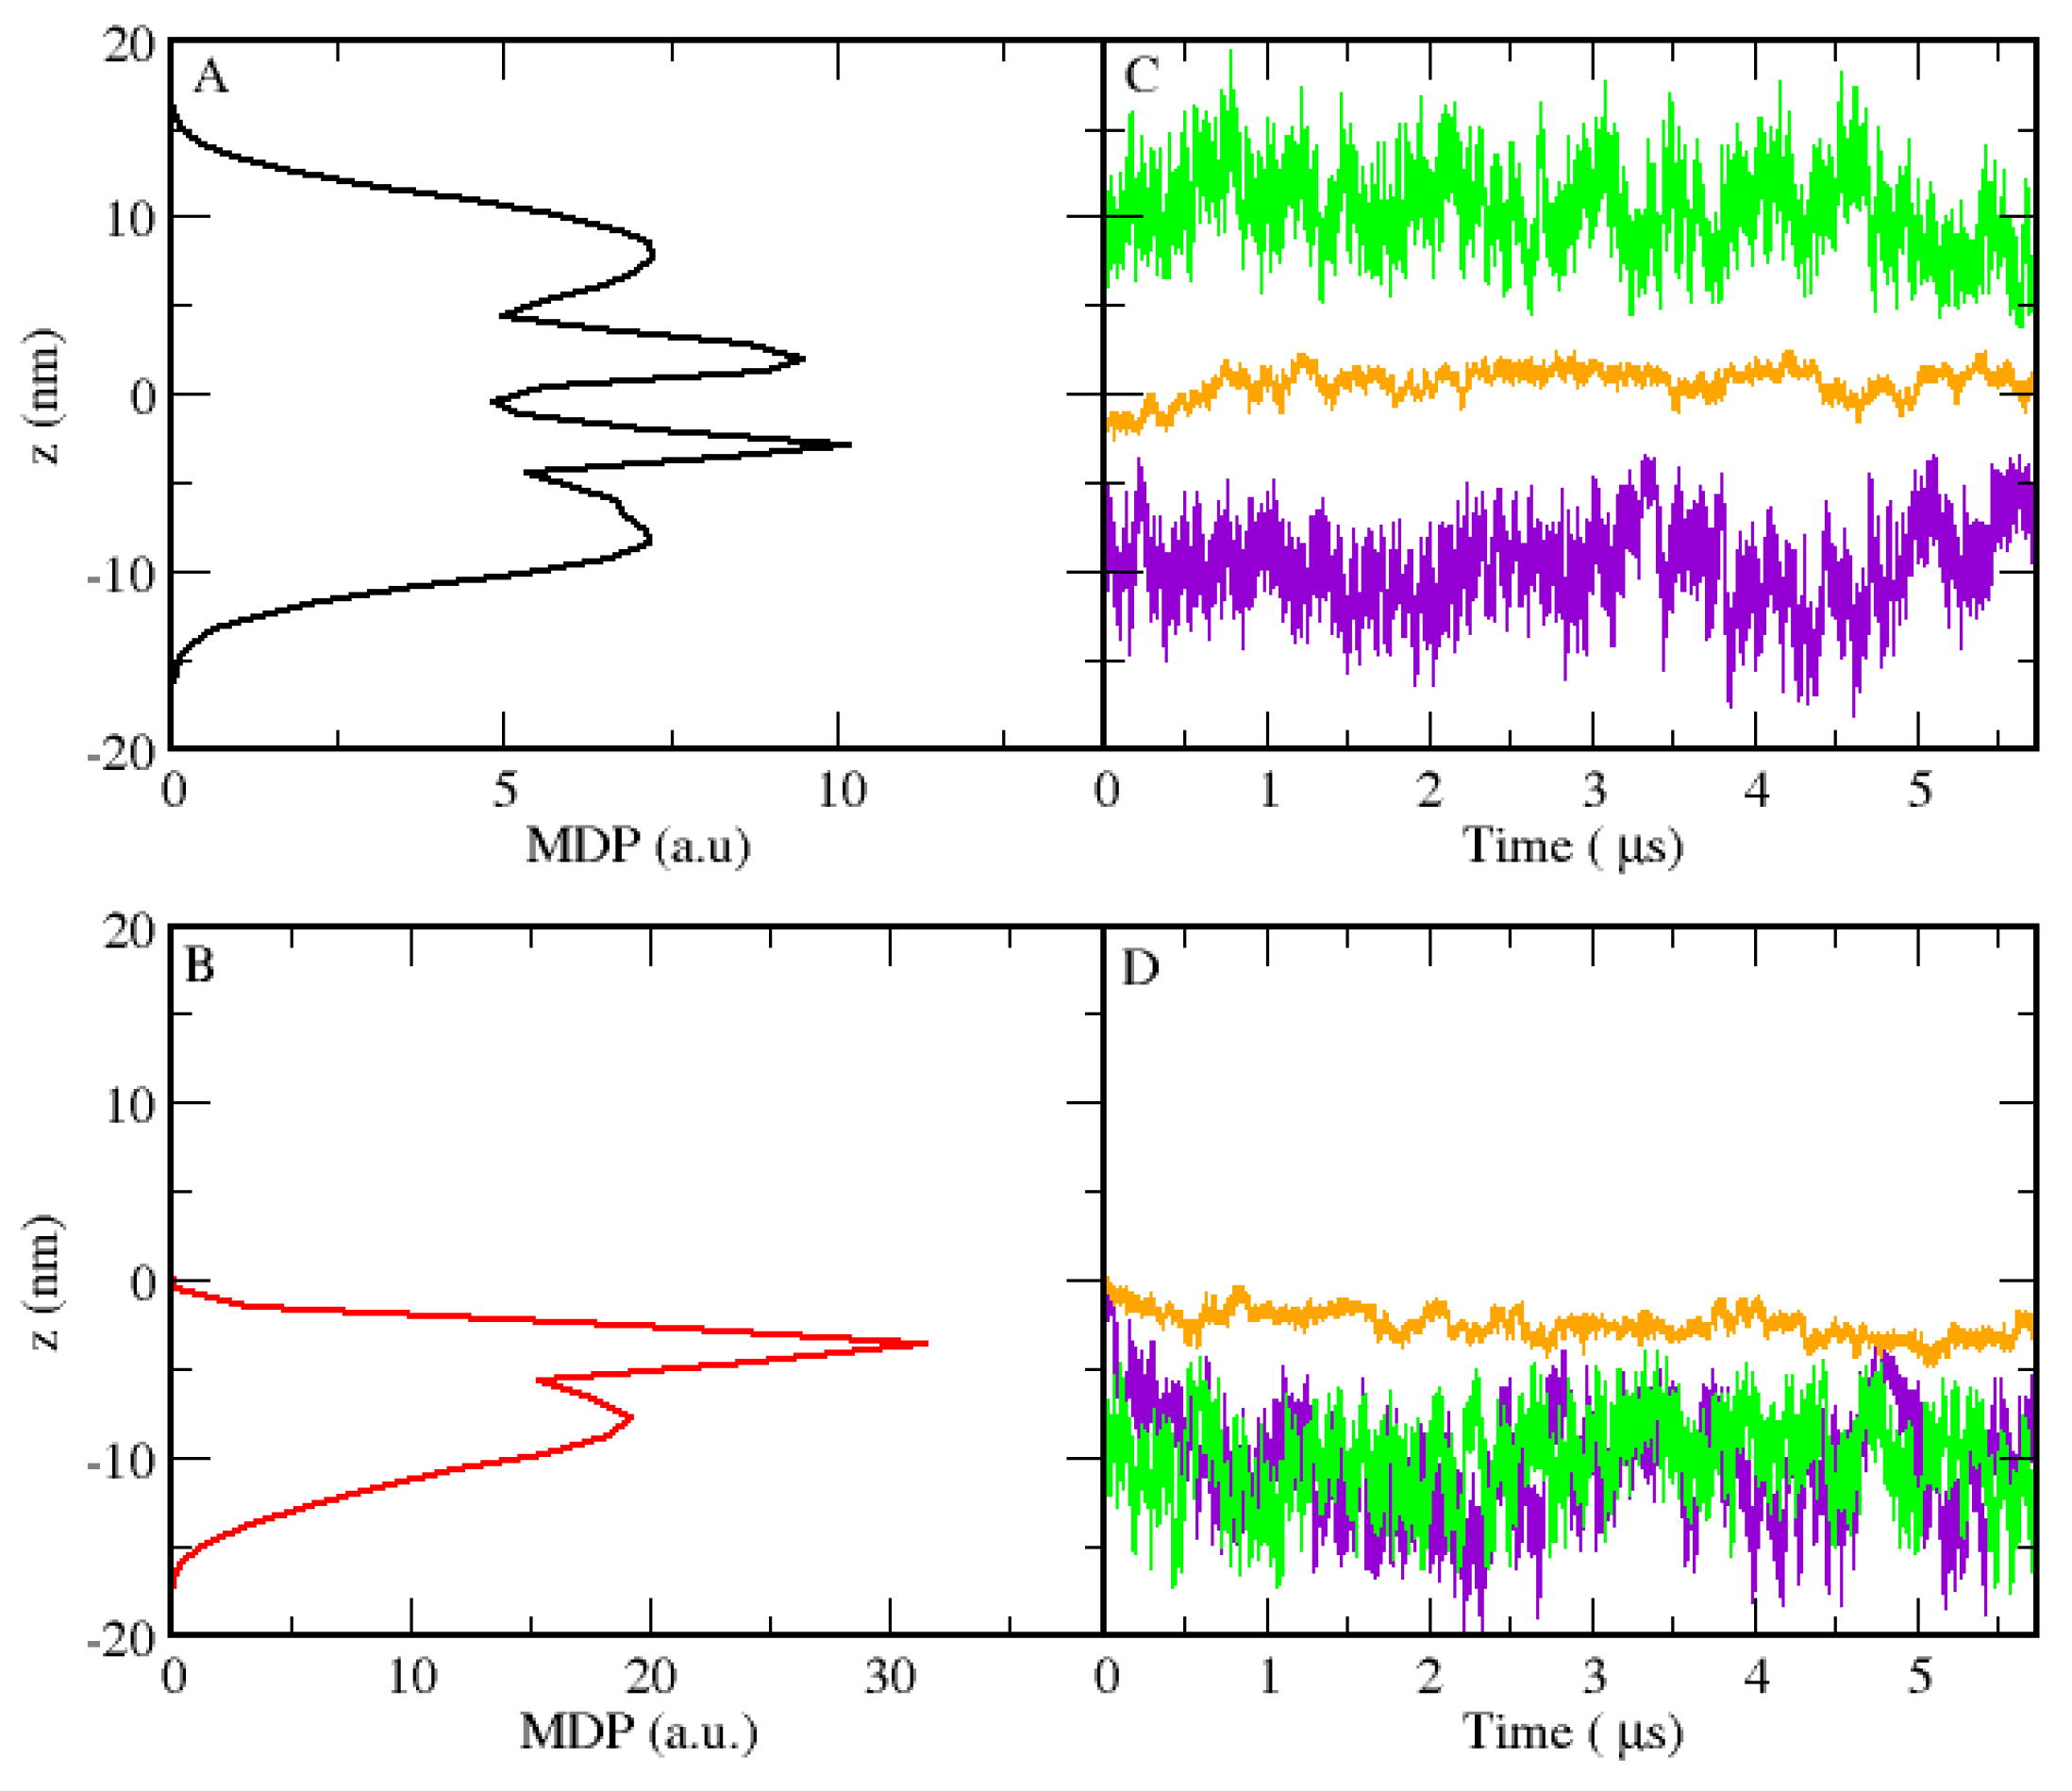
3.1. Micellar Phase
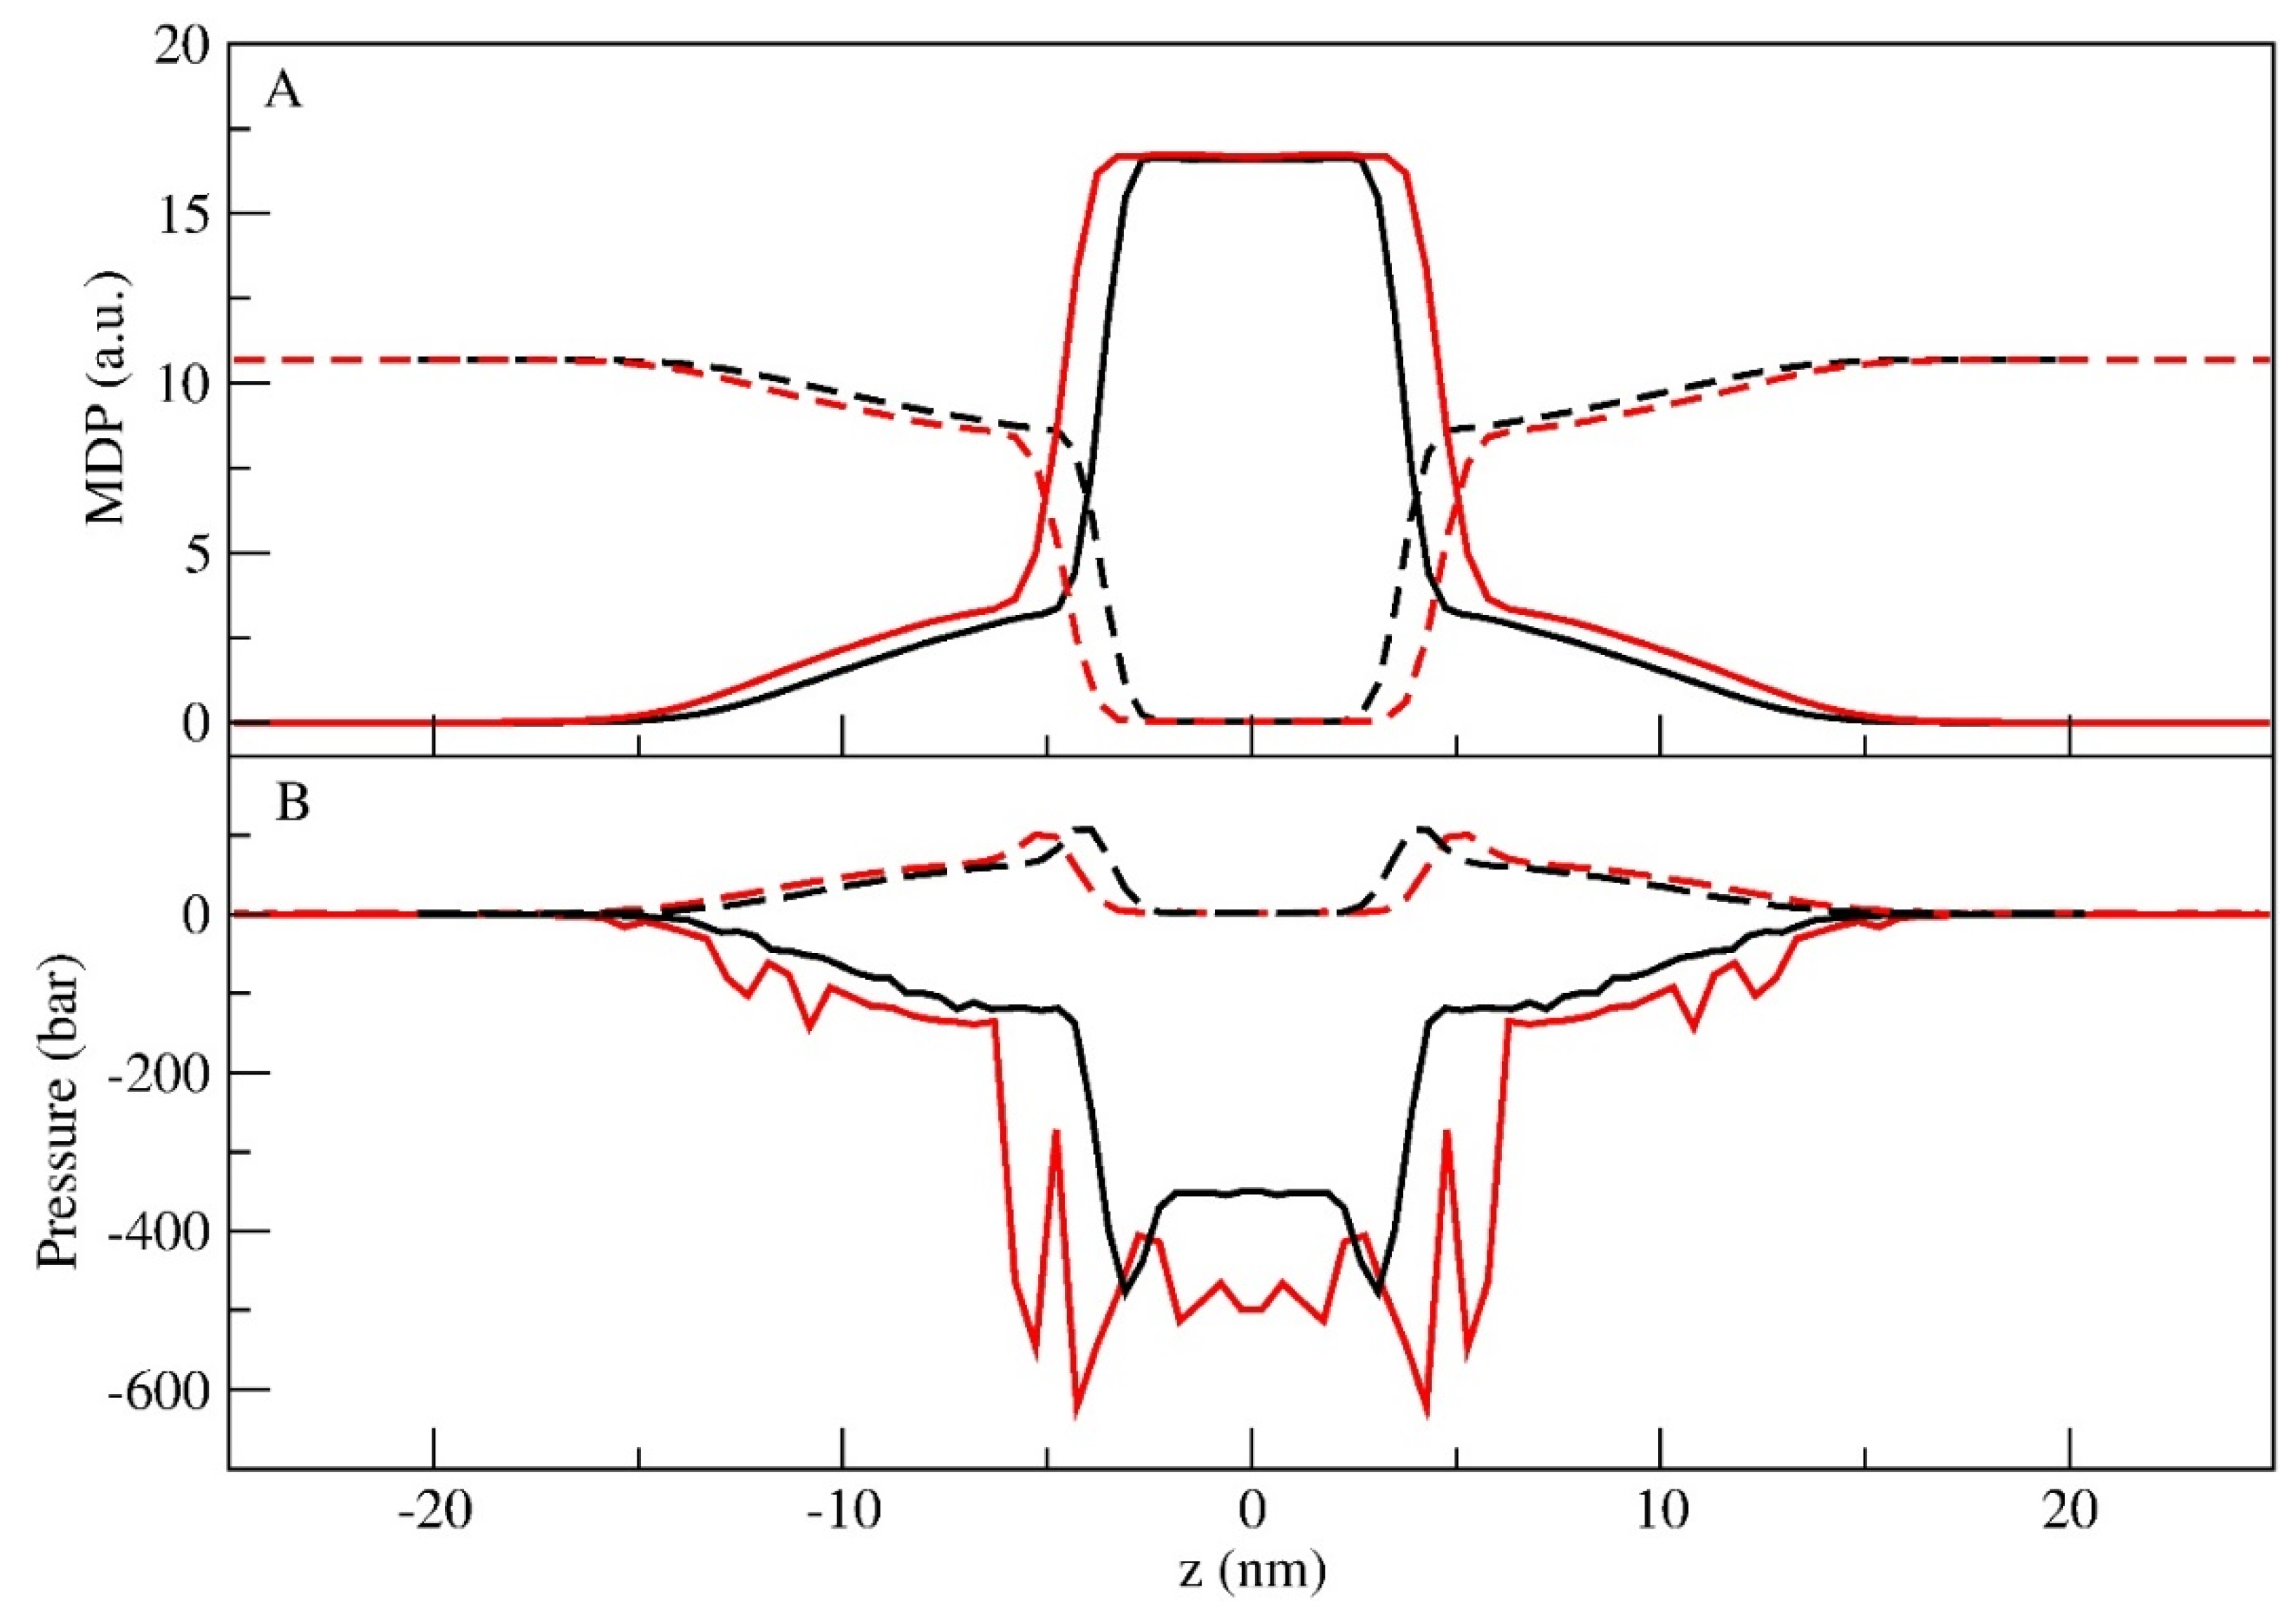
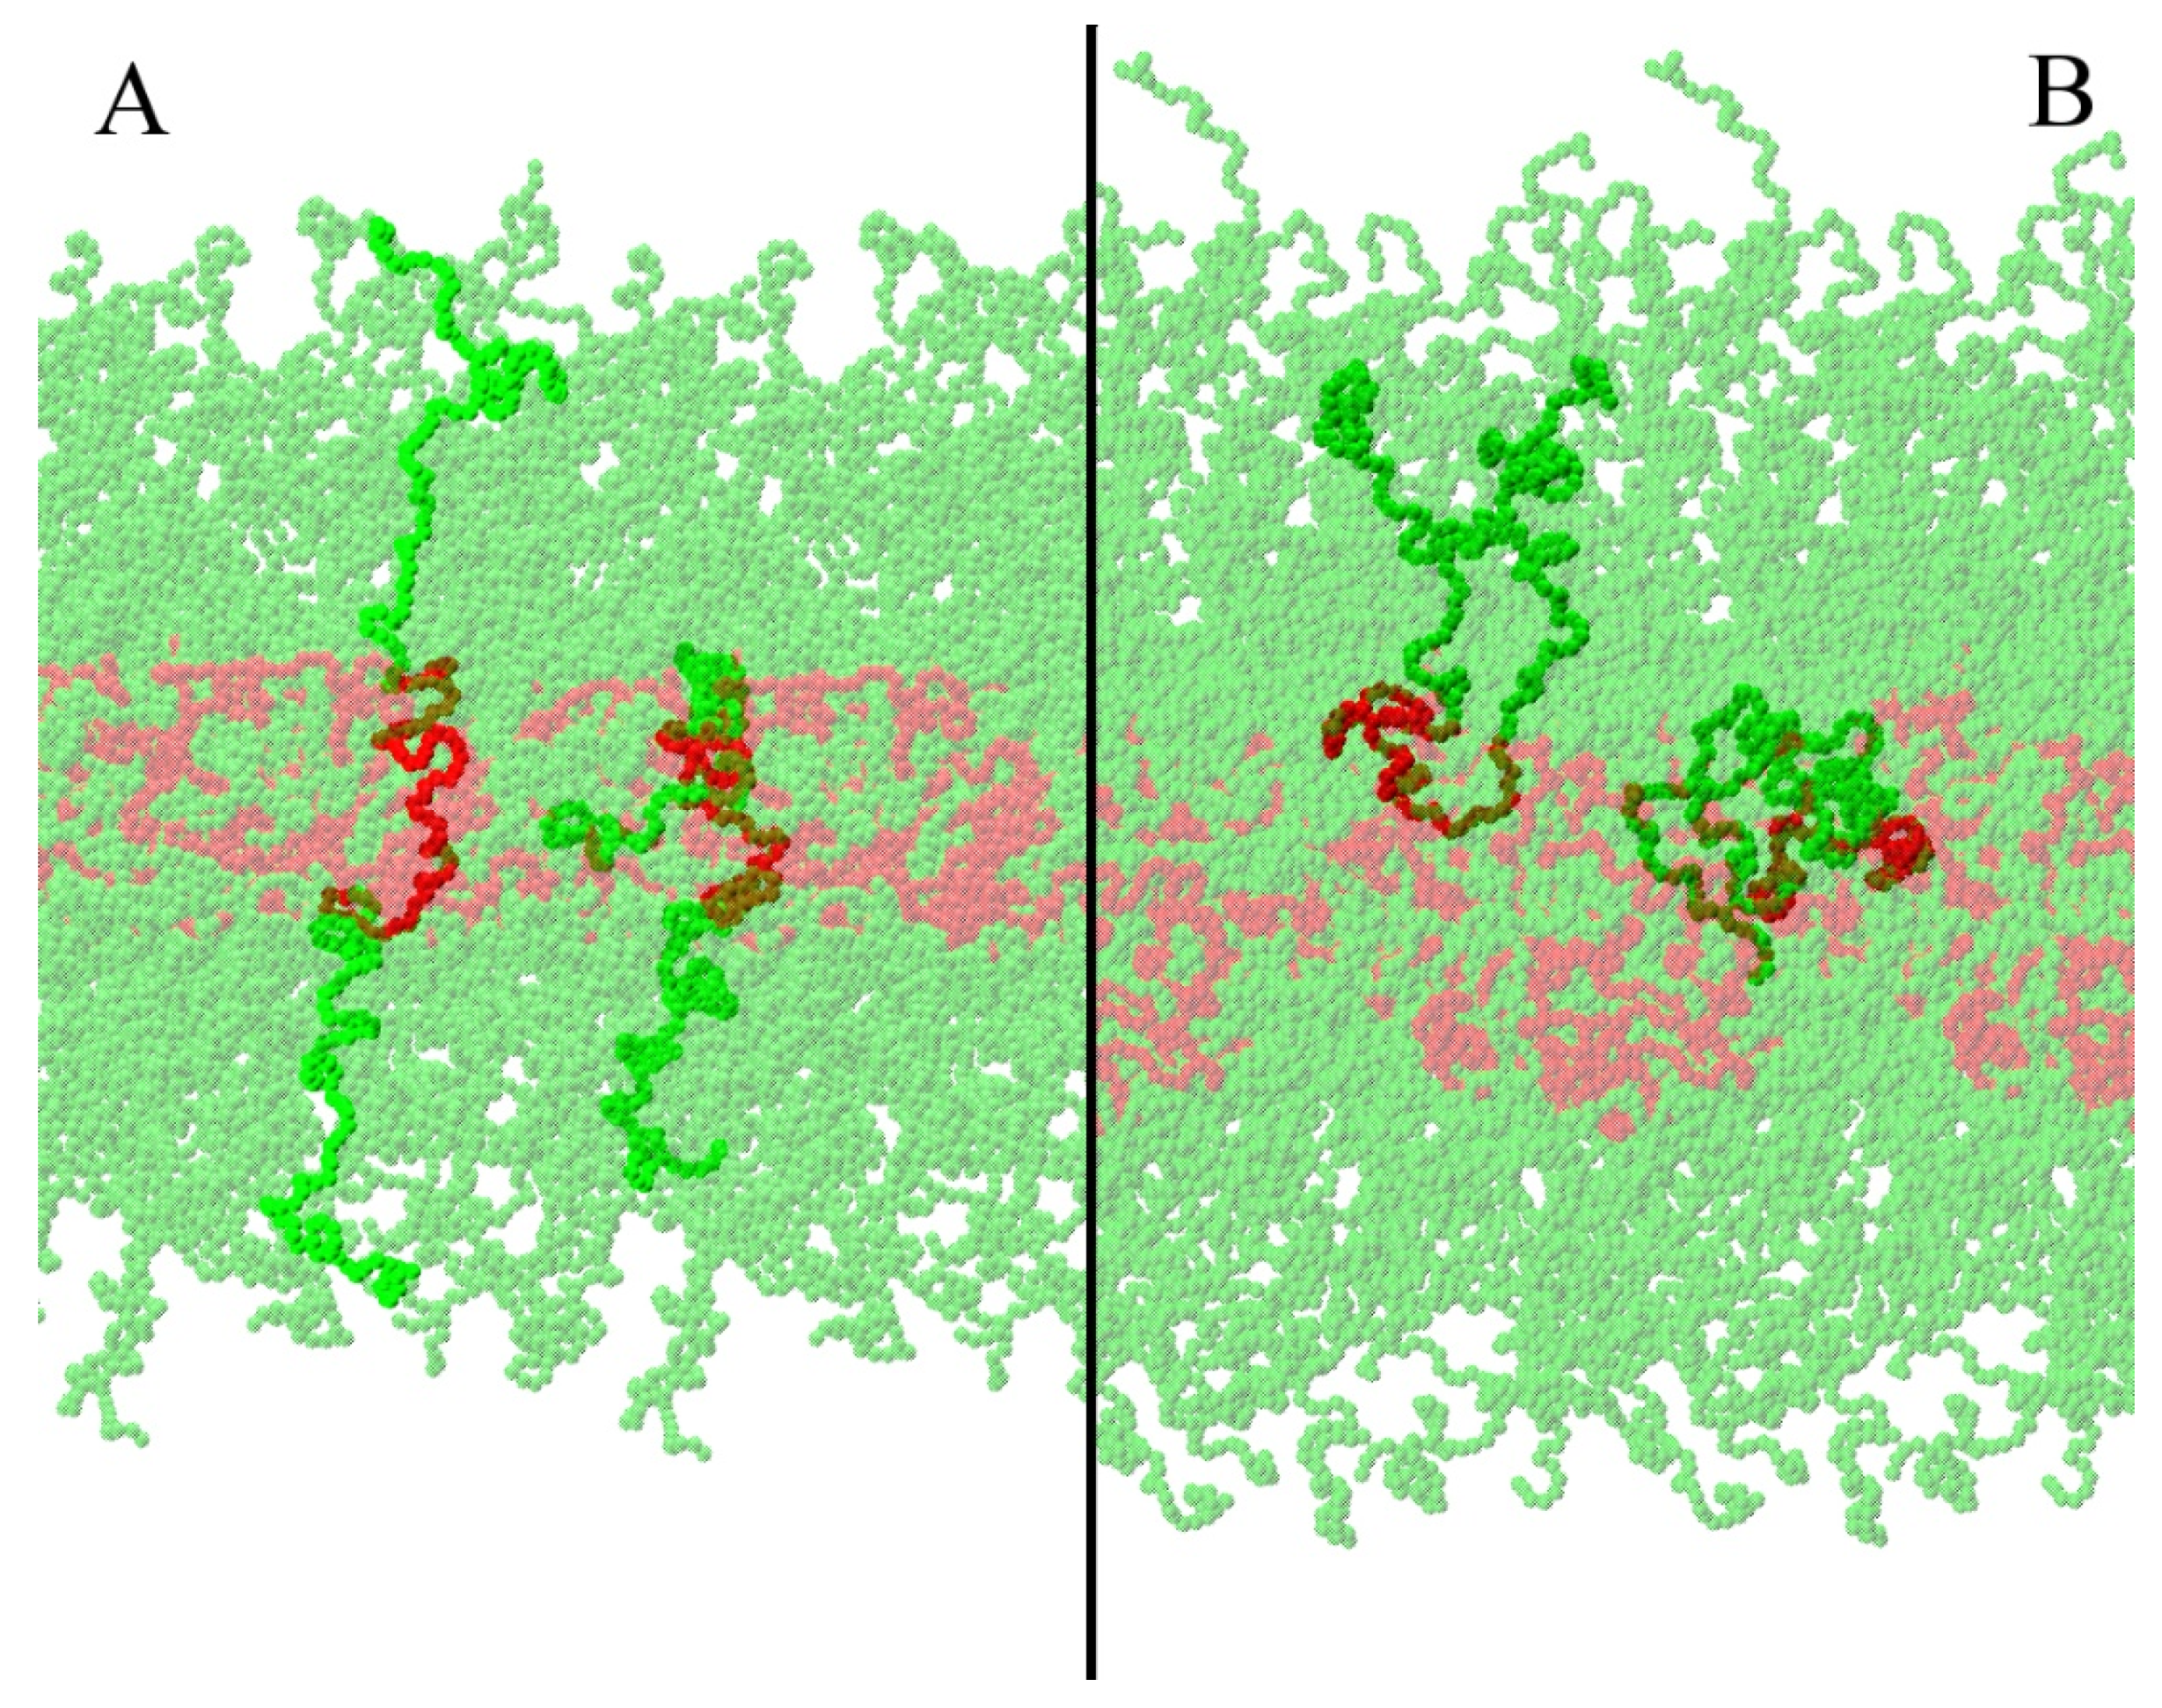
3.2. Lamellar Phase
4. Conclusions
Author Contributions
Funding
Conflicts of Interest
References
- Schott, H. Hydrophilic-lipophilic balance, solubility parameter, and oil-water partition coefficient as universal parameters of nonionic surfactants. J. Pharm. Sci. 1995, 84, 1215–1222. [Google Scholar] [CrossRef] [PubMed]
- Jansson, J.; Schillen, K.; Olofsson, G.; Cardoso, R.; Loh, W. The Interaction between PEO-PPO-PEO Triblock Copolymers and Ionic Surfactants in Aqueous Solution Studied Using Light Scattering and Calorimetry. J. Phys. Chem. B 2004, 108, 82–92. [Google Scholar] [CrossRef]
- Sosnik, A. Reversal of multidrug resistance by the inhibition of ATP-binding cassette pumps employing “Generally Recognized As Safe” (GRAS) nanopharmaceuticals: A review. Adv. Drug Deliv. Rev. 2013, 65, 1828–1851. [Google Scholar] [CrossRef] [PubMed]
- Alakhova, D.Y.; Kabanov, A.V. Pluronics and MDR Reversal: An Update. Mol. Pharm. 2014, 11, 2566–2578. [Google Scholar] [CrossRef] [PubMed]
- FDA. Lnactive Lngredient Search for Approved Drug Products; 2019; U.S. Food and Drug Administration. Maryland, USA. Available online: https://www.accessdata.fda.gov/scripts/cder/iig/getiigWEB.cfm. (accessed on 20 August 2019).
- Jeong, B.; Bae, Y.H.; Lee, D.S.; Kim, S.W. Biodegradable block copolymers as injectable drug-delivery systems. Nature 1997, 388, 860–862. [Google Scholar] [CrossRef] [PubMed]
- Coeshott, C.M.; Smithson, S.L.; Verderber, E.; Samaniego, A.; Blonder, J.M.; Rosenthal, G.J.; Westerink, M.A.J. Pluronic® F127-based systemic vaccine delivery systems. Vaccine 2004, 22, 2396–2405. [Google Scholar] [CrossRef]
- Bleul, R.; Thiermann, R.; Marten, G.U.; House, M.J.; St Pierre, T.G.; Häfeli, U.O.; Maskos, M. Continuously manufactured magnetic polymersomes—A versatile tool (not only) for targeted cancer therapy. Nanoscale 2013, 5, 11385–11393. [Google Scholar] [CrossRef]
- Kwon, S.H.; Kim, S.Y.; Ha, K.W.; Kang, M.J.; Huh, J.S.; Im, T.J.; Kim, Y.M.; Park, Y.M.; Kang, K.H.; Lee, S.; et al. Pharmaceutical evaluation of genistein-loaded pluronic micelles for oral delivery. Arch. Pharm. Res. 2007, 30, 1138–1143. [Google Scholar] [CrossRef]
- Oh, K.T.; Bronich, T.K.; Kabanov, A.V. Micellar formulations for drug delivery based on mixtures of hydrophobic and hydrophilic Pluronic® block copolymers. J. Control. Release 2004, 94, 411–422. [Google Scholar] [CrossRef]
- Albano, J.M.; de Morais Ribeiro, L.N.; Couto, V.M.; Barbosa Messias, M.; Rodrigues da Silva, G.H.; Breitkreitz, M.C.; de Paula, E.; Pickholz, M. Rational design of polymer-lipid nanoparticles for docetaxel delivery. Colloids Surf. B Biointerfaces 2019, 175, 56–64. [Google Scholar] [CrossRef]
- Pitto-Barry, A.; Barry, N.P.E. Pluronic® block-copolymers in medicine: From chemical and biological versatility to rationalisation and clinical advances. Polym. Chem. 2014, 5, 3291–3297. [Google Scholar] [CrossRef]
- Basak, R.; Bandyopadhyay, R. Encapsulation of Hydrophobic Drugs in Pluronic F127 Micelles: Effects of Drug Hydrophobicity, Solution Temperature, and pH. Langmuir 2013, 29, 4350–4356. [Google Scholar] [CrossRef] [PubMed] [Green Version]
- Atkin, R.; De Fina, L.M.; Kiederling, U.; Warr, G.G. Structure and self assembly of pluronic amphiphiles in ethylammonium nitrate and at the silica surface. J. Phys. Chem. B 2009, 113, 12201–12213. [Google Scholar] [CrossRef] [PubMed]
- Oshiro, A.; Silva, D.C.; De Mello, J.C.; De Moraes, V.W.R.; Cavalcanti, L.P.; Franco, M.K.K.D.; Alkschbirs, M.I.; Fraceto, L.F.; Yokaichiya, F.; De Rodrigues, T.; et al. Pluronics F-127/L-81 Binary Hydrogels as Drug-Delivery Systems: In fl uence of Physicochemical Aspects on Release Kinetics and Cytotoxicity. Langmuir 2014, 30, 13689–13698. [Google Scholar] [CrossRef] [PubMed]
- Li, Z.; Huang, Y.; Peng, S.; Chen, X.; Zou, L.; Liu, W.; Liu, C. Liposomes consisting of pluronic F127 and phospholipid: Effect of matrix on morphology, stability and curcumin delivery. J. Dispers. Sci. Technol. 2019, 1–7. [Google Scholar] [CrossRef]
- Pickholz, M.; Giupponi, G. Coarse grained simulations of local anesthetics encapsulated into a liposome. J. Phys. Chem. B 2010, 114, 7009–7015. [Google Scholar] [CrossRef]
- Pickholz, M.; Saiz, L.; Klein, M.L. Concentration Effects of Volatile Anesthetics on the Properties of Model Membranes: A Coarse-Grain Approach. Biophys. J. 2005, 88, 1524–1534. [Google Scholar] [CrossRef] [Green Version]
- Wood, I.; Martini, M.F.; Albano, J.M.R.; Cuestas, M.L.; Mathet, V.L.; Pickholz, M. Coarse grained study of pluronic F127: Comparison with shorter co-polymers in its interaction with lipid bilayers and self-aggregation in water. J. Mol. Struct. 2016, 1109, 106–113. [Google Scholar] [CrossRef]
- Wood, I.; Albano, J.M.R.; Filho, P.L.O.; Couto, V.M.; de Farias, M.A.; Portugal, R.V.; de Paula, E.; Oliveira, C.L.P.; Pickholz, M. A sumatriptan coarse-grained model to explore different environments: Interplay with experimental techniques. Eur. Biophys. J. 2018, 47, 561–571. [Google Scholar] [CrossRef]
- Li, J.; Chu, M.K.; Lu, B.; Mirzaie, S.; Chen, K.; Gordijo, C.R.; Plettenburg, O.; Giacca, A.; Wu, X.Y. Enhancing thermal stability of a highly concentrated insulin formulation with Pluronic F-127 for long-term use in microfabricated implantable devices. Drug Deliv. Transl. Res. 2017, 7, 529–543. [Google Scholar] [CrossRef]
- Monticelli, L.; Kandasamy, S.K.; Periole, X.; Larson, R.G.; Tieleman, D.P.; Marrink, S.J. The MARTINI coarse grained force field: Extension to proteins. J. Chem. Theory Comput. 2008, 4, 819–834. [Google Scholar] [CrossRef] [PubMed]
- Yesylevskyy, S.O.; Schäfer, L.V.; Sengupta, D.; Marrink, S.J. Polarizable water model for the coarse-grained MARTINI force field. PLoS Comput. Biol. 2010, 6, e1000810. [Google Scholar] [CrossRef] [PubMed]
- Ingólfsson, H.I.; Lopez, C.A.; Uusitalo, J.J.; de Jong, D.H.; Gopal, S.M.; Periole, X.; Marrink, S.J. The power of coarse graining in biomolecular simulations. Wiley Interdiscip. Rev. Comput. Mol. Sci. 2014, 4, 225–248. [Google Scholar] [CrossRef] [PubMed]
- Martinez, L.; Andrade, R.; Birgin, E.G.; Martínez, J.M. PACKMOL: A package for building initial configurations for molecular dynamics simulations. J. Comput. Chem. 2009, 30, 2157–2164. [Google Scholar] [CrossRef] [PubMed]
- Albano, J.M.R.; Mussini, N.; Toriano, R.; Facelli, J.C.; Ferraro, M.B.; Pickholz, M. Calcium interactions with Cx26 hemmichannel: Spatial association between MD simulations biding sites and variant pathogenicity. Comput. Biol. Chem. 2018, 77, 331–342. [Google Scholar] [CrossRef] [PubMed] [Green Version]
- Albano, J.M.R.; Facelli, J.C.; Ferraro, M.B.; Pickholz, M. Magnesium interactions with a CX26 connexon in lipid bilayers. J. Mol. Model. 2019, 25, 232. [Google Scholar] [CrossRef]
- Albano, J.M.R.; Jara, G.E.; Fernández, M.L.; Facelli, J.C.; Ferraro, M.B.; Pickholz, M. The Effects of Calcium on Lipid–Protein Interactions and Ion Flux in the Cx26 Connexon Embedded into a POPC Bilayer. J. Membr. Biol. 2019. [Google Scholar] [CrossRef]
- Abraham, M.J.; Murtola, T.; Schulz, R.; Páll, S.; Smith, J.C.; Hess, B.; Lindah, E. Gromacs: High performance molecular simulations through multi-level parallelism from laptops to supercomputers. SoftwareX 2015, 1–2, 19–25. [Google Scholar] [CrossRef]
- Evans, D.J.; Holian, B.L. The Nose-Hoover thermostat. J. Chem. Phys. 1985, 83, 4069–4074. [Google Scholar] [CrossRef]
- Parrinello, M.; Rahman, A. Polymorphic transitions in single crystals: A new molecular dynamics method. J. Appl. Phys. 1981, 52, 7182–7190. [Google Scholar] [CrossRef]
- Hess, B.; Bekker, H.; Berendsen, H.J.C.; Fraaije, J.G.E.M. LINCS: A linear constraint solver for molecular simulations. J. Comput. Chem. 1997, 18, 1463–1472. [Google Scholar] [CrossRef]
- Grillo, D.A.; Albano, J.M.R.; Mocskos, E.E.; Facelli, J.C.; Pickholz, M.; Ferraro, M.B. Diblock copolymer bilayers as model for polymersomes: A coarse grain approach. J. Chem. Phys. 2017, 146, 244904. [Google Scholar] [CrossRef] [PubMed]
- Braun, A.R.; Sachs, J.N. Determining Structural and Mechanical Properties from Molecular Dynamics Simulations of Lipid Vesicles. J. Chem. Theory Comput. 2014, 10, 4160–4168. [Google Scholar] [CrossRef] [PubMed] [Green Version]
- Marrink, S.J.; Mark, A.E. Molecular Dynamics Simulation of the Formation, Structure, and Dynamics of Small Phospholipid Vesicles. J. Am. Chem. Soc. 2003, 125, 15233–15242. [Google Scholar] [CrossRef] [PubMed] [Green Version]
- Nakamura, T.; Shinoda, W.; Ikeshoji, T. Novel numerical method for calculating the pressure tensor in spherical coordinates for molecular systems. J. Chem. Phys. 2011, 135, 094106. [Google Scholar] [CrossRef] [PubMed]
- Grillo, D.A.; Albano, J.M.R.; Mocskos, E.E.; Facelli, J.C.; Pickholz, M.; Ferraro, M.B. Mechanical properties of drug loaded diblock copolymer bilayers: A molecular dynamics study. J. Chem. Phys. 2018, 148, 214901. [Google Scholar] [CrossRef] [PubMed]
- Lindahl, E.; Edholm, O. Spatial and energetic-entropic decomposition of surface tension in lipid bilayers from molecular dynamics simulations. J. Chem. Phys. 2000, 113, 3882–3893. [Google Scholar] [CrossRef] [Green Version]
- Sonne, J.; Hansen, F.Y.; Peters, G.H. Methodological problems in pressure profile calculations for lipid bilayers. J. Chem. Phys. 2005, 122, 124903. [Google Scholar] [CrossRef] [PubMed] [Green Version]
- Pickholz, M.; Fraceto, L.F.; de Paula, E. Preferential location of prilocaine and etidocaine in phospholipid bilayers: A molecular dynamics study. Synth. Met. 2009, 159, 2157–2158. [Google Scholar] [CrossRef]


| Structure | Initial | Case | F127 | PW | Total Beads | Run Time |
|---|---|---|---|---|---|---|
| Micelle | U | MU | 100 | 591,204 | 617,704 | 3 µs |
| S | MS | 100 | 593,910 | 620,410 | 3 µs | |
| Lamella | U | LU | 100 | 191,500 | 218,000 | 7 µs |
| S | LS | 100 | 191,500 | 218,000 | 7 µs |
| Property | LS | LU |
|---|---|---|
| Energy (kJ/mol) | −1,762,565 | −1,762,192 |
| (3093) | (3043) | |
| Volume (nm3) | 8045 | 8041 |
| (6) | (5) | |
| Area (nm2) | 198.8 | 160.9 |
| (3.4) | (1.9) | |
| Lz (nm) | 40.5 | 50.1 |
| (0.7) | (0.5) |
© 2019 by the authors. Licensee MDPI, Basel, Switzerland. This article is an open access article distributed under the terms and conditions of the Creative Commons Attribution (CC BY) license (http://creativecommons.org/licenses/by/4.0/).
Share and Cite
Albano, J.M.R.; Grillo, D.; Facelli, J.C.; Ferraro, M.B.; Pickholz, M. Study of the Lamellar and Micellar Phases of Pluronic F127: A Molecular Dynamics Approach. Processes 2019, 7, 606. https://doi.org/10.3390/pr7090606
Albano JMR, Grillo D, Facelli JC, Ferraro MB, Pickholz M. Study of the Lamellar and Micellar Phases of Pluronic F127: A Molecular Dynamics Approach. Processes. 2019; 7(9):606. https://doi.org/10.3390/pr7090606
Chicago/Turabian StyleAlbano, Juan M. R., Damian Grillo, Julio C. Facelli, Marta B. Ferraro, and Mónica Pickholz. 2019. "Study of the Lamellar and Micellar Phases of Pluronic F127: A Molecular Dynamics Approach" Processes 7, no. 9: 606. https://doi.org/10.3390/pr7090606