Spectroscopic Examination and Chemometric Analysis of Essential Oils Obtained from Peppermint Herb (Mentha piperita L.) and Caraway Fruit (Carum carvi L.) Subjected to Pulsed Electric Fields

 ,
,  , and
, and
Abstract
:1. Introduction
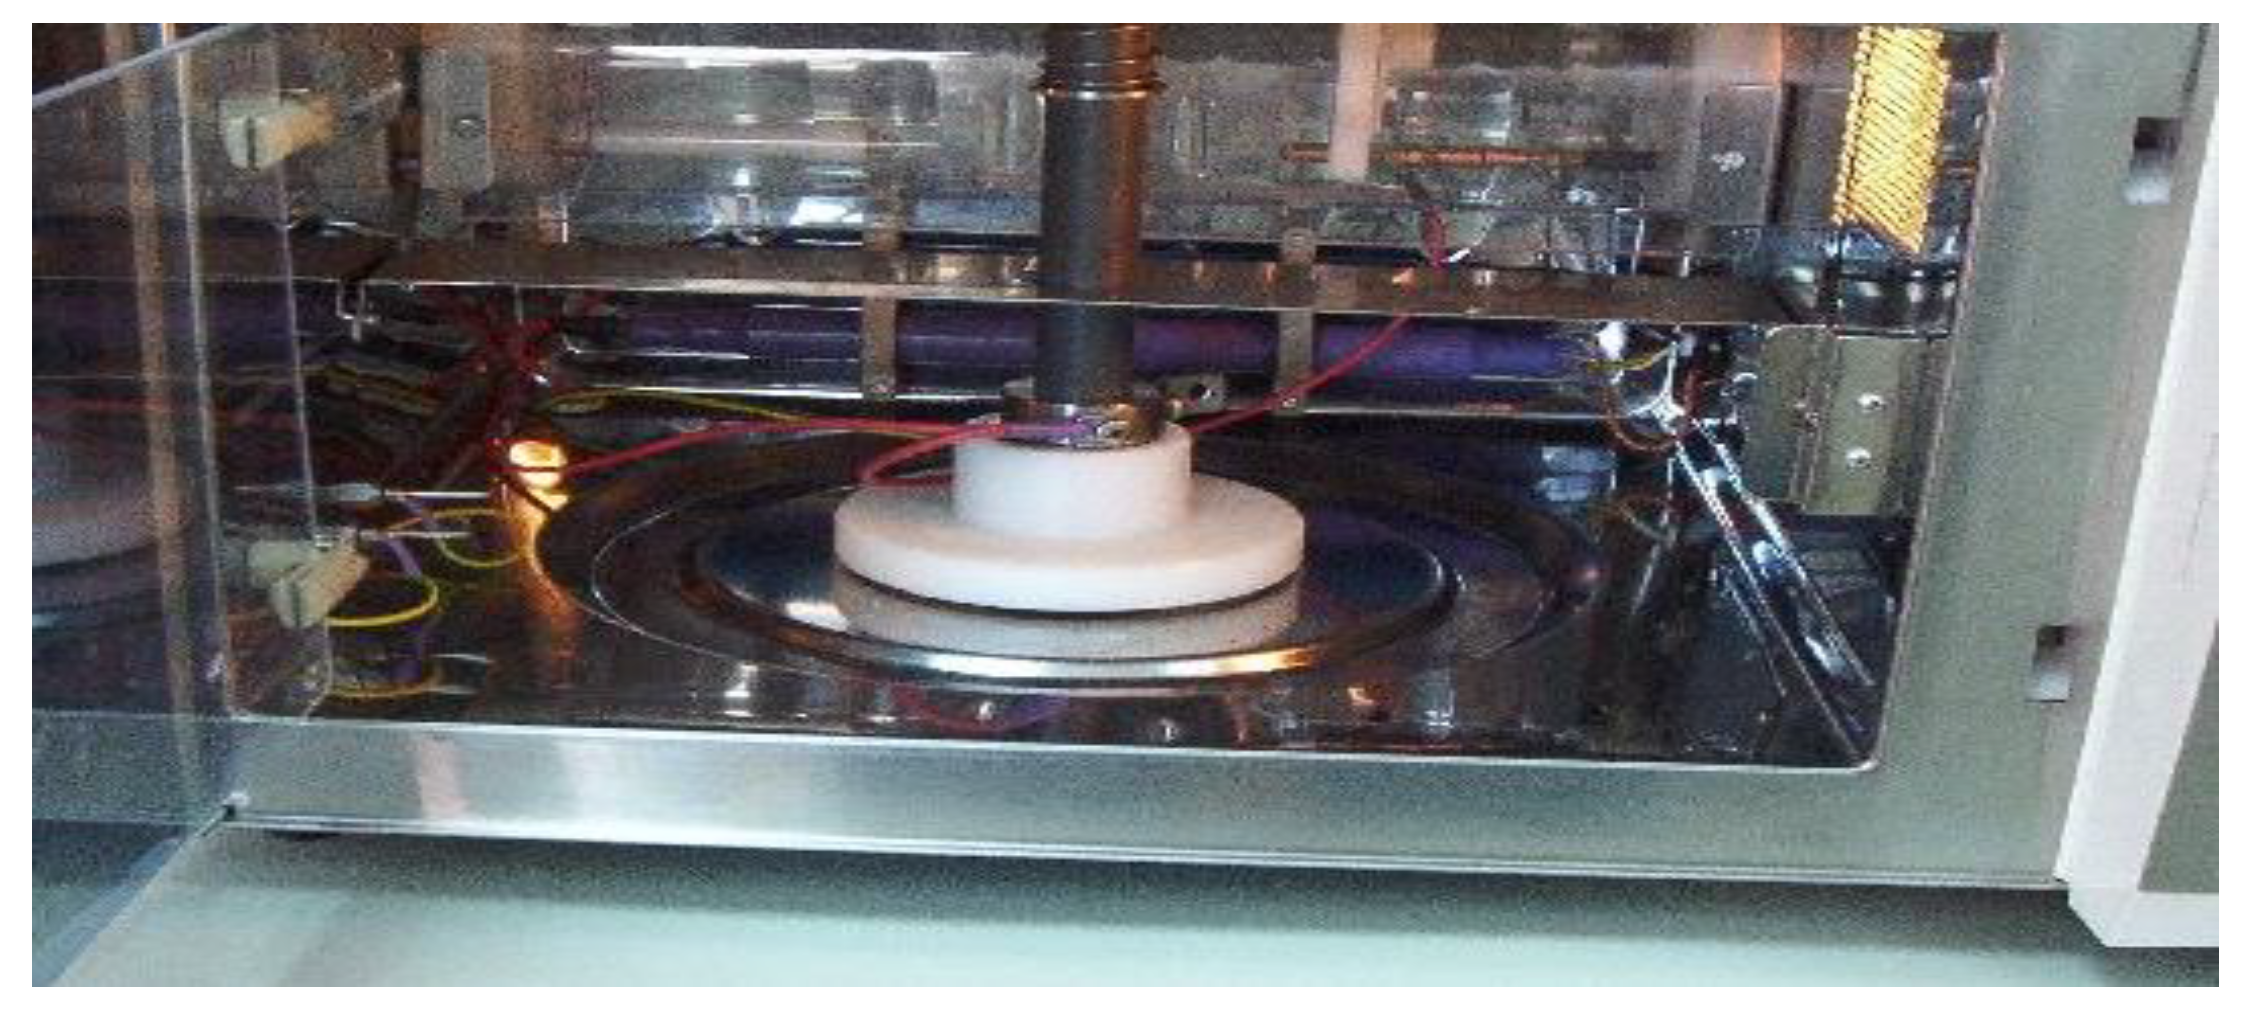
2. Materials and Methods
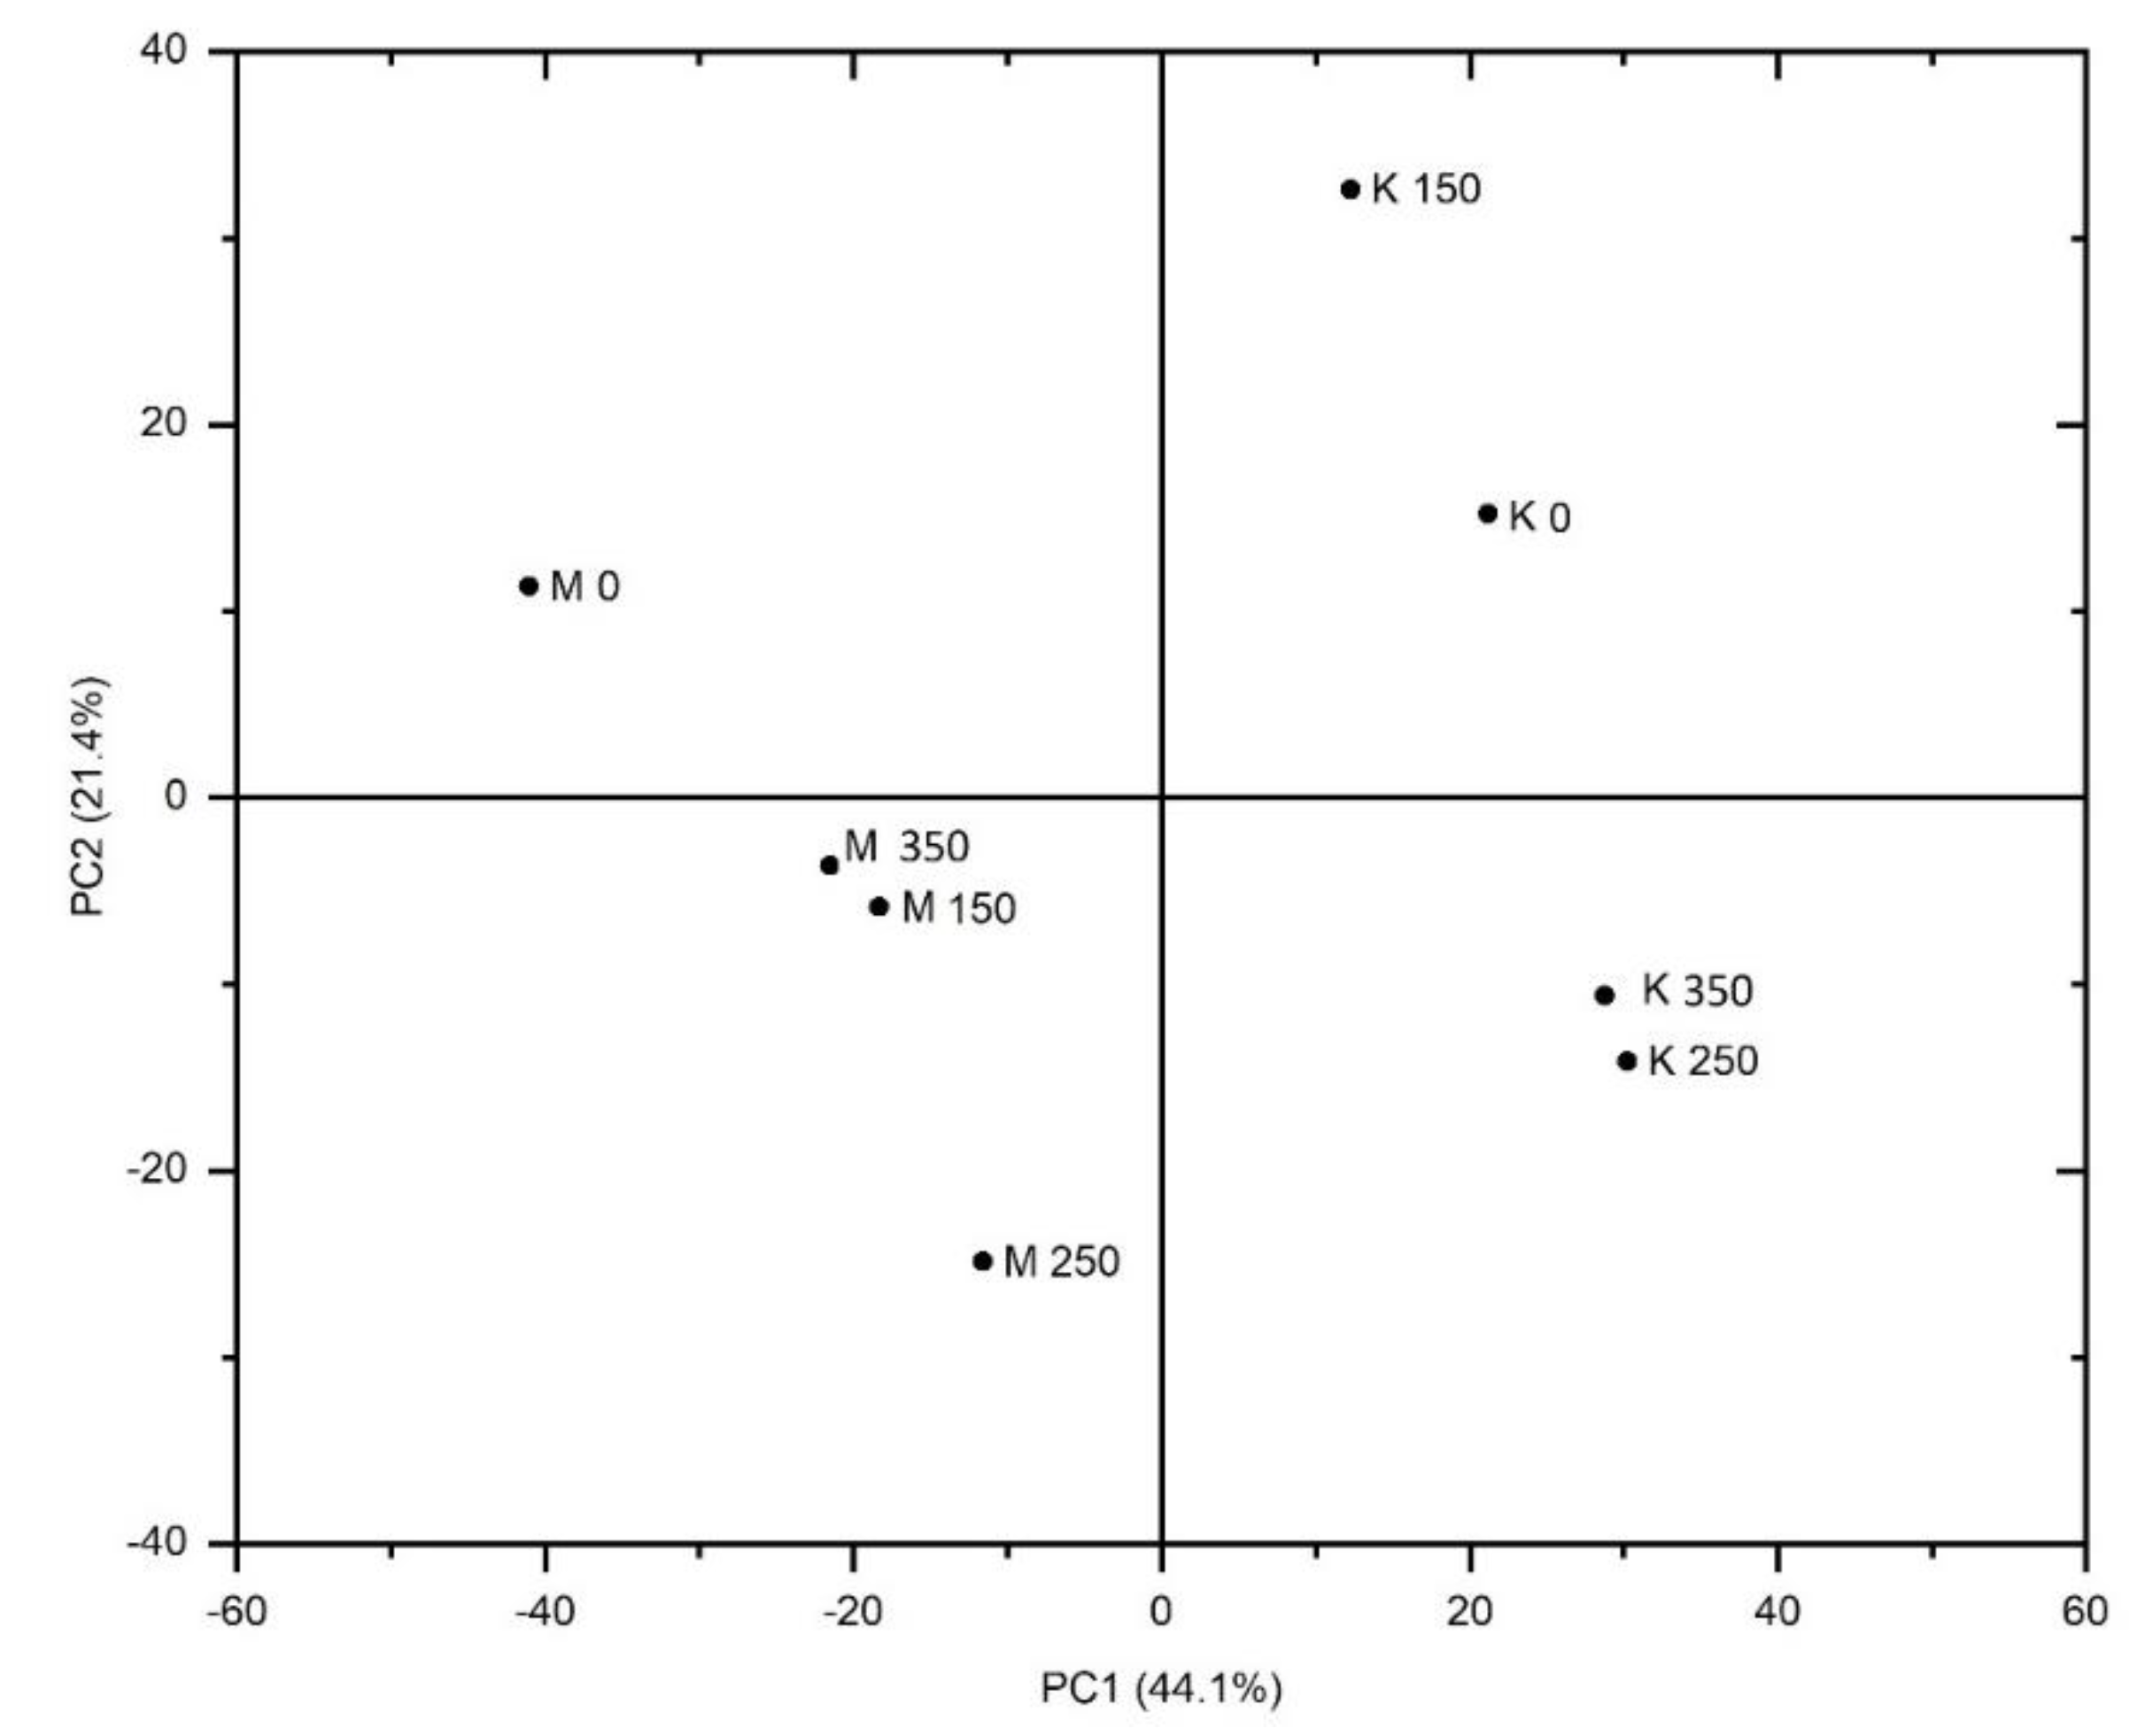
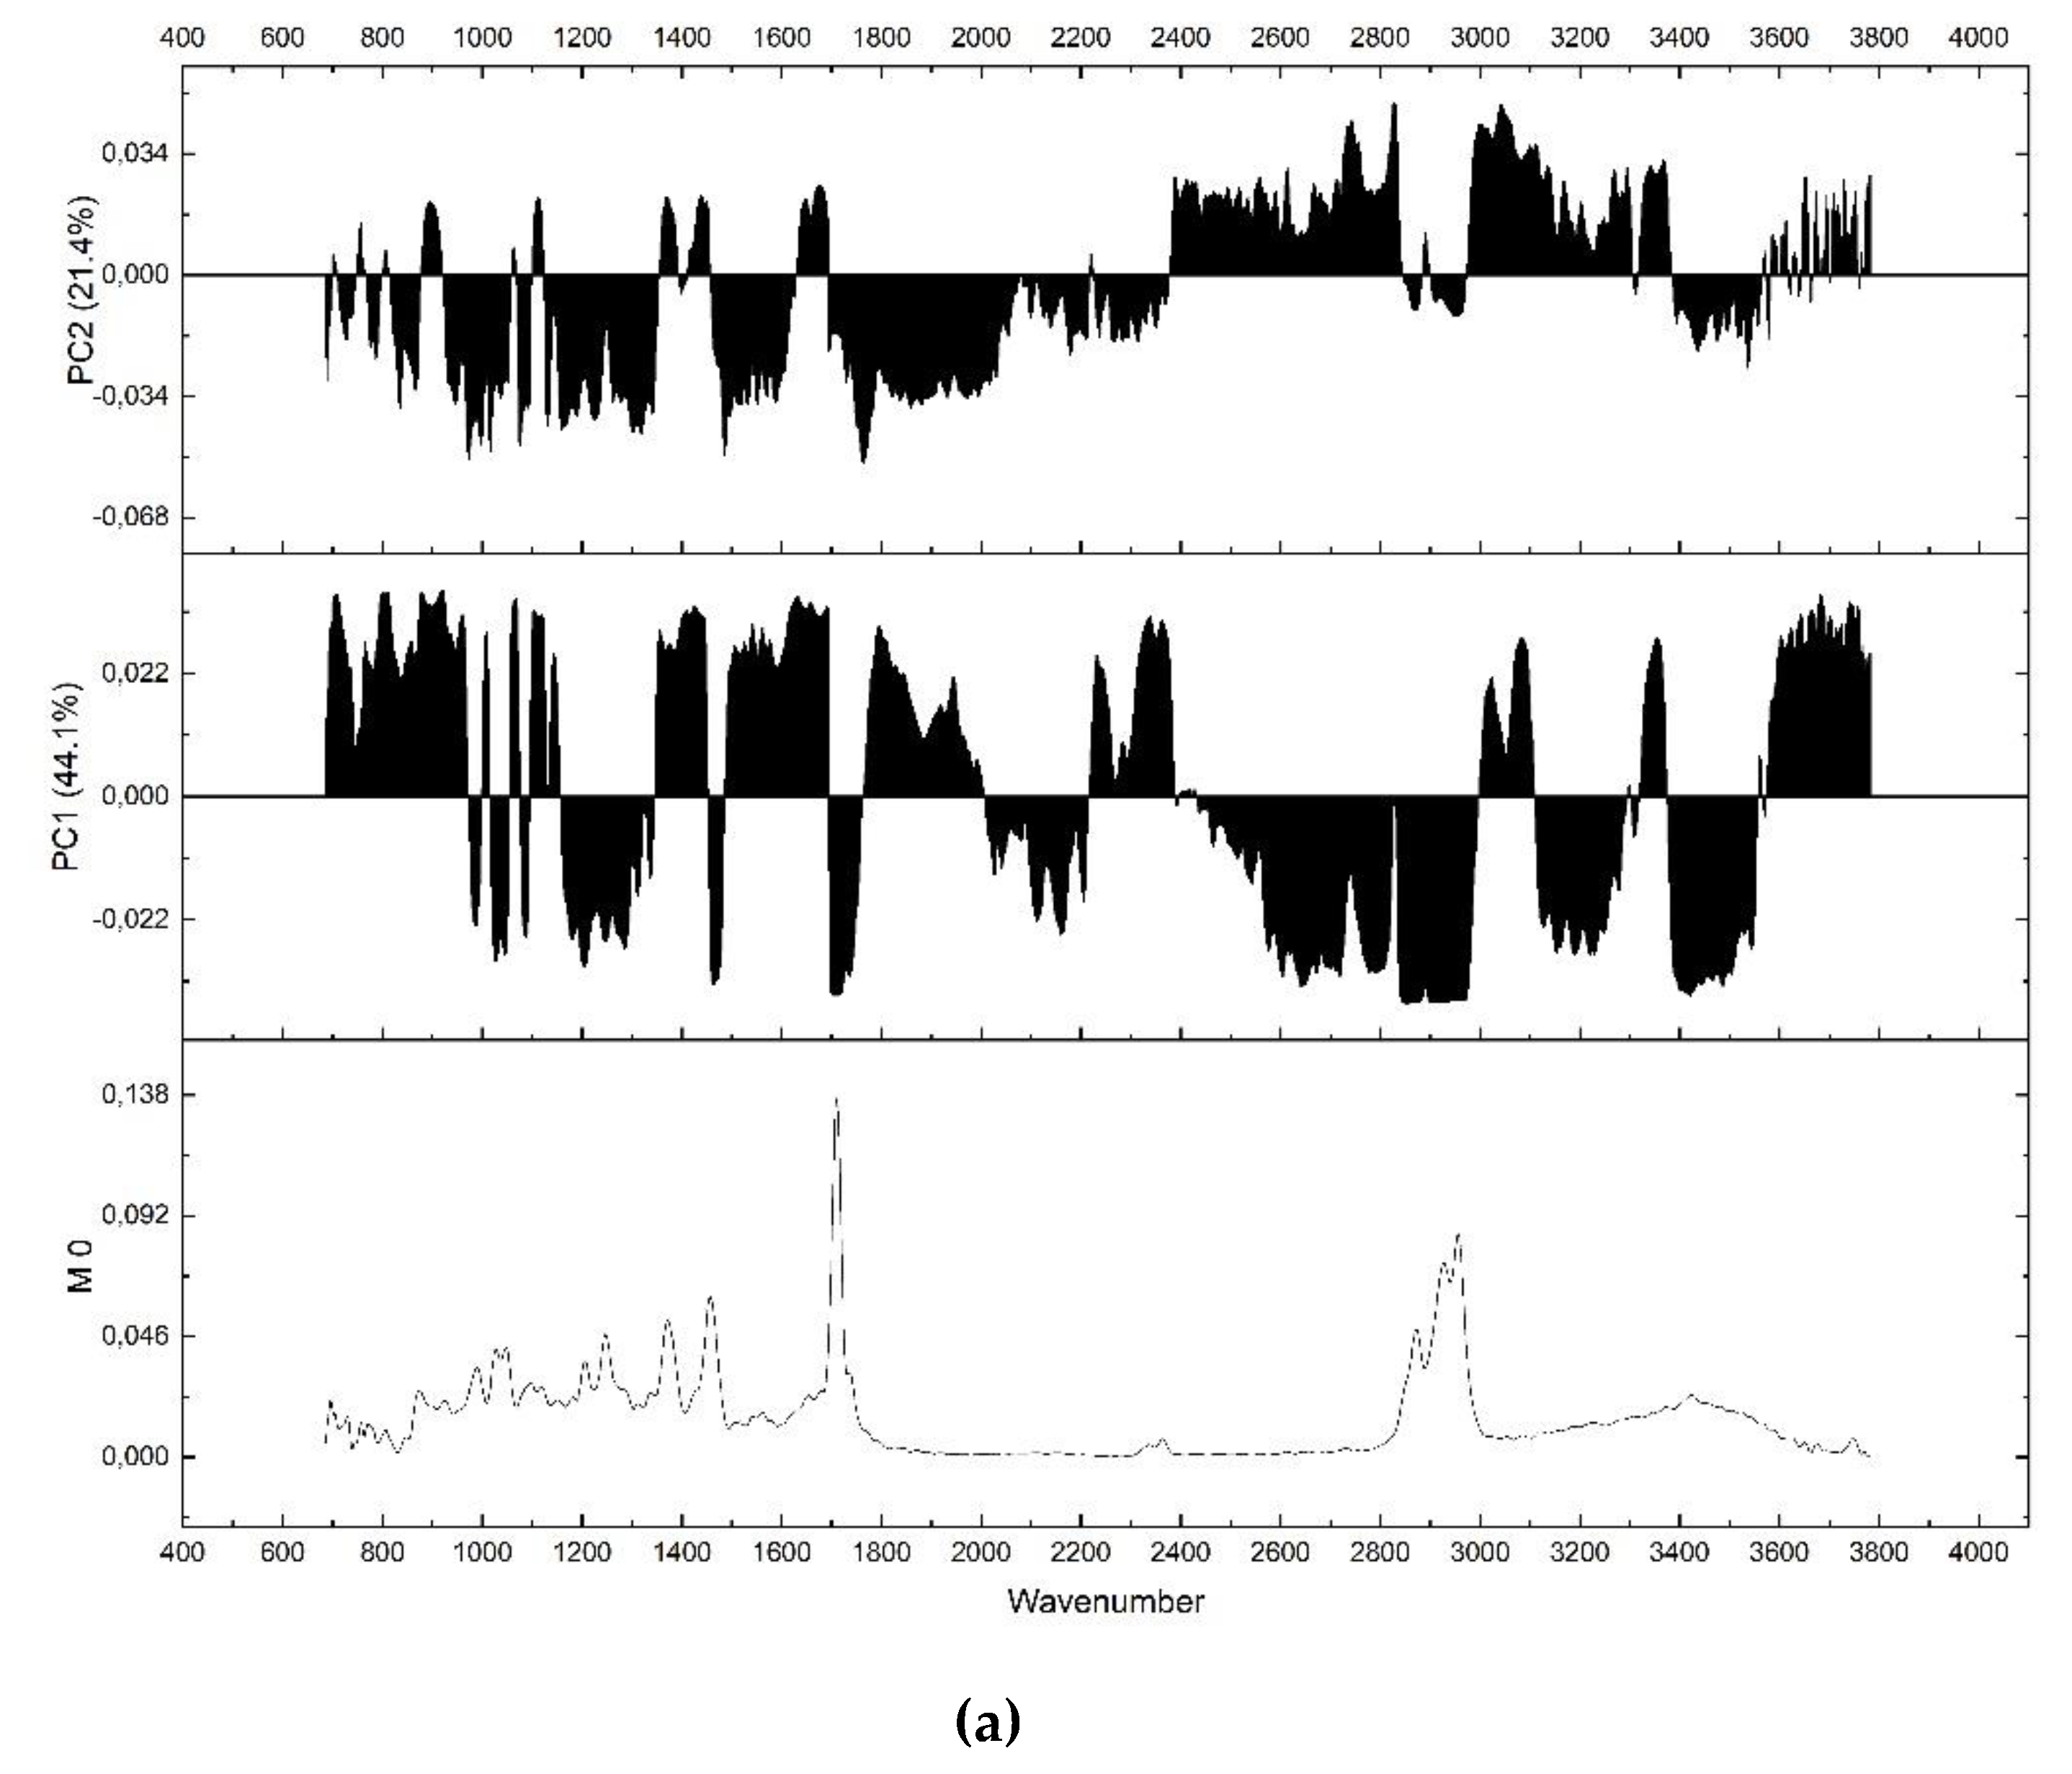
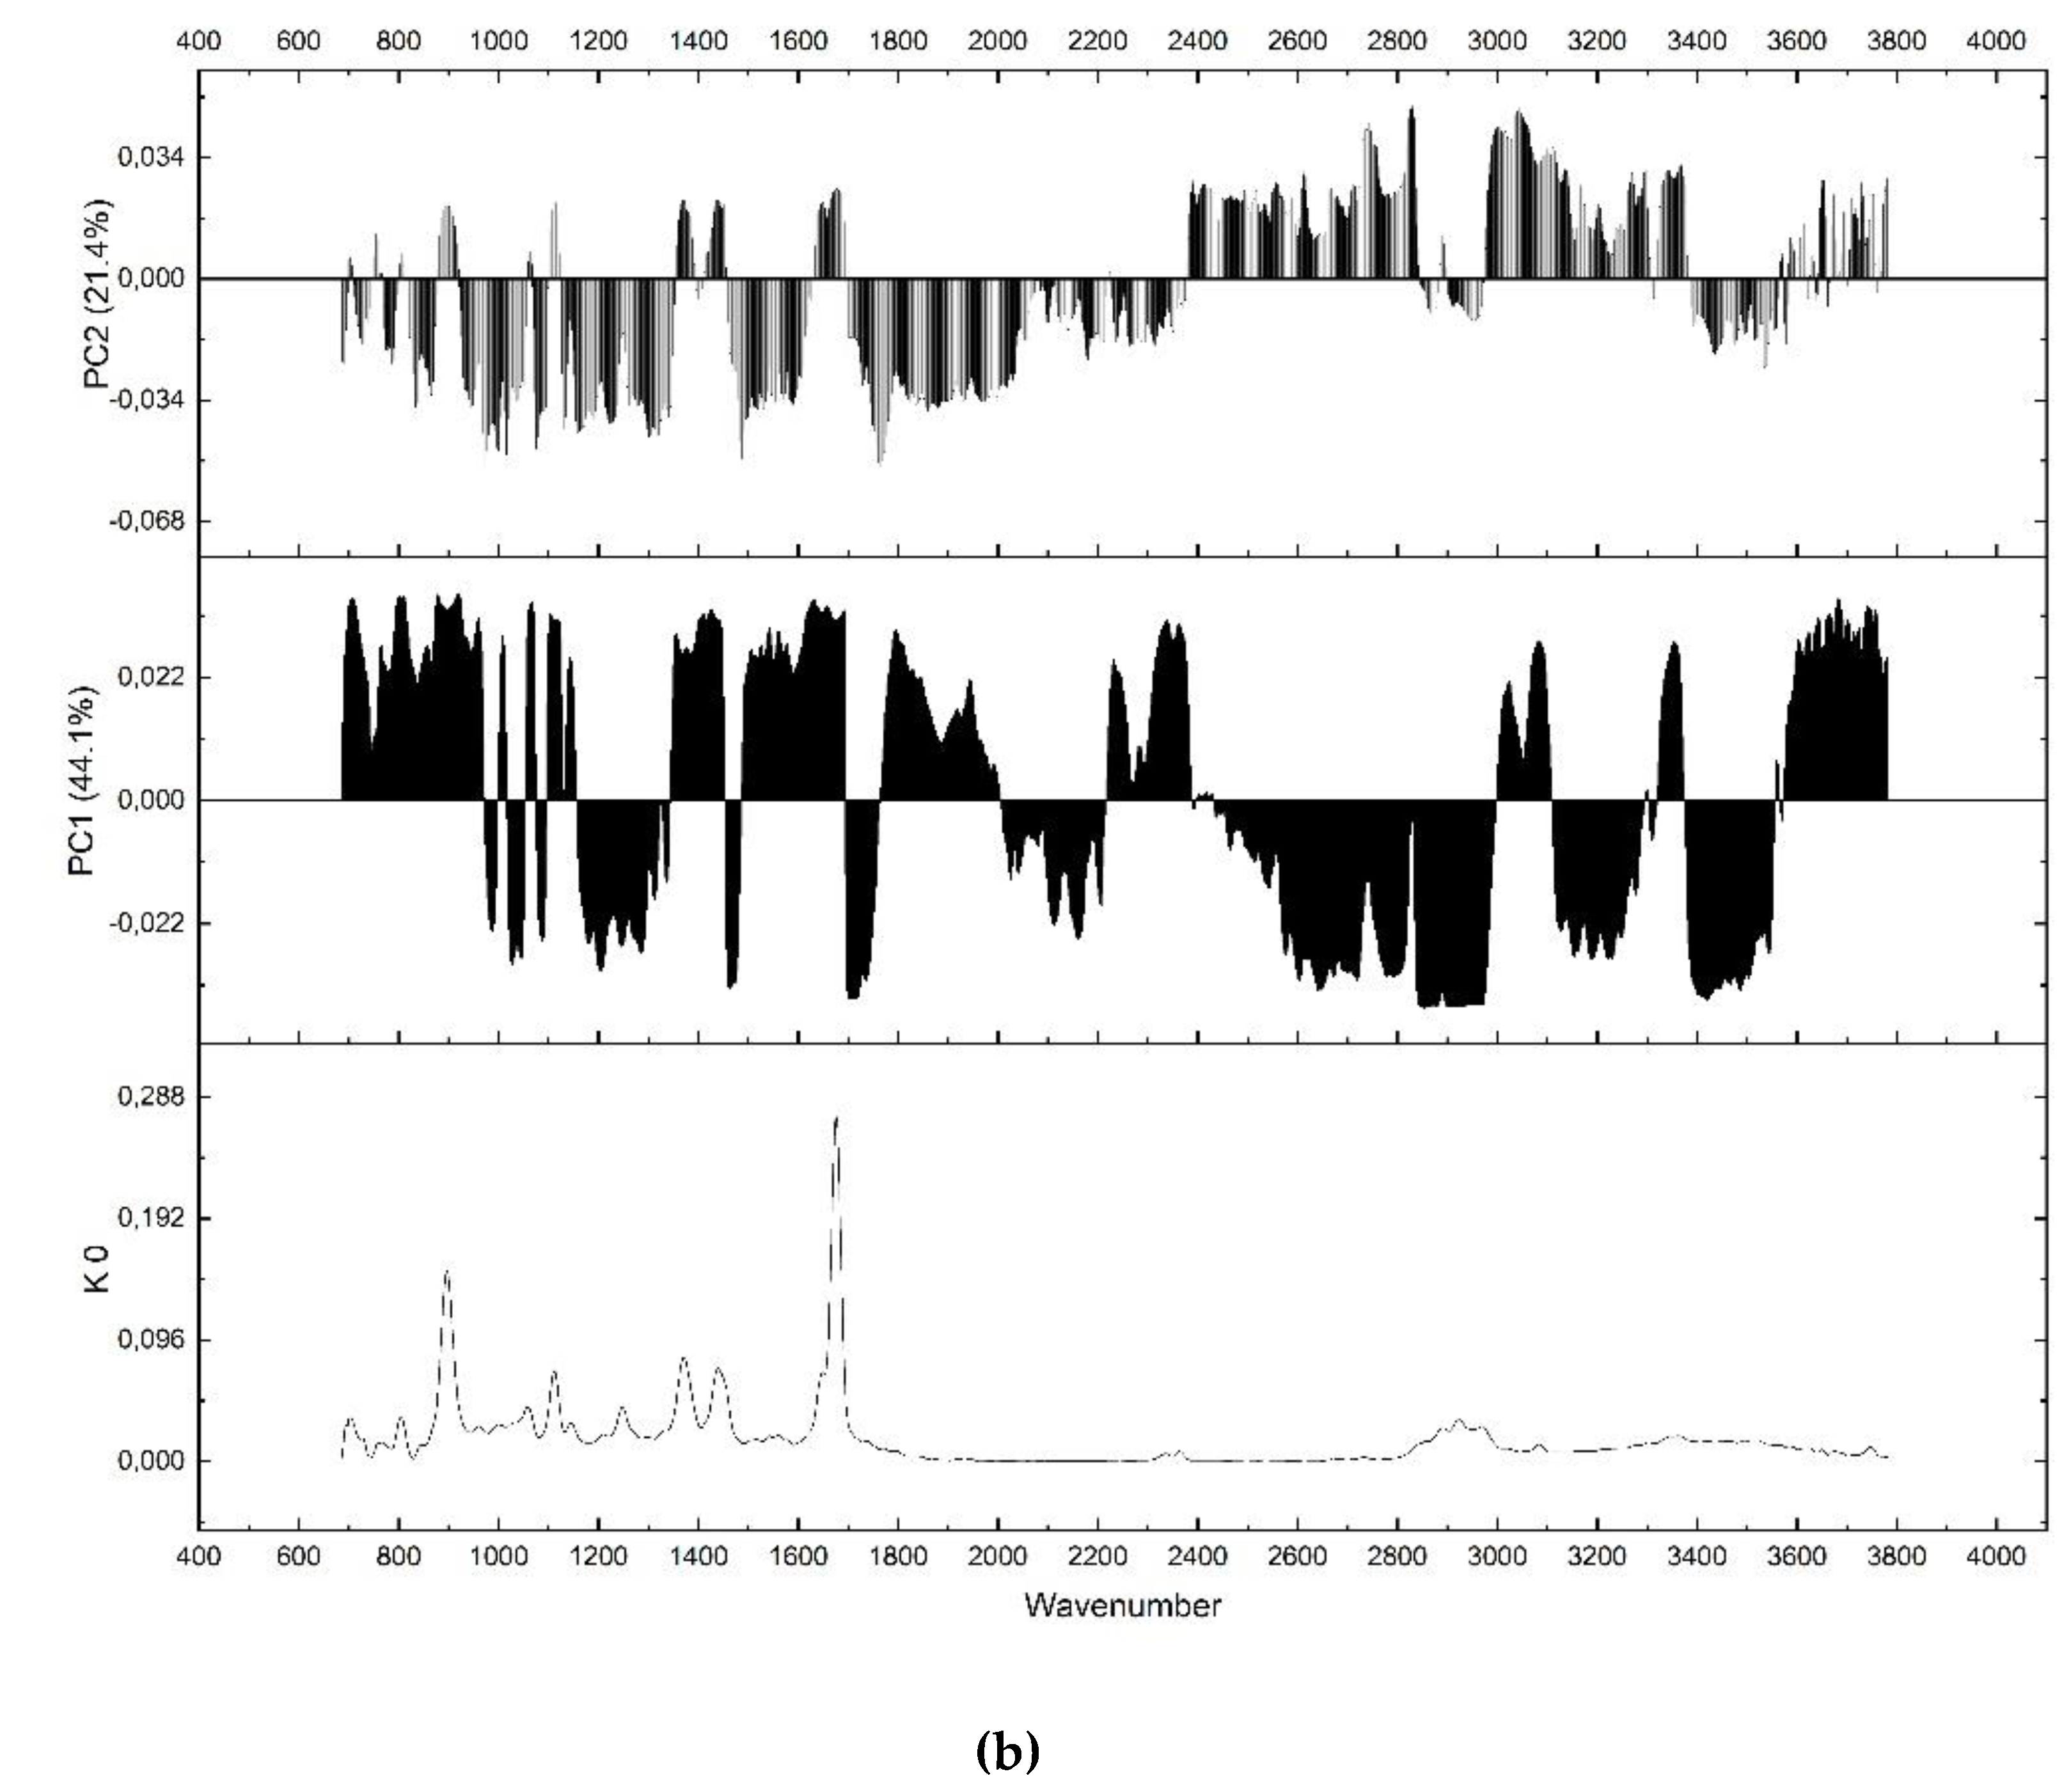
3. Results and Discussion
4. Conclusions
Author Contributions
Acknowledgments
Conflicts of Interest
References
- Mikołajczyk-Grzelak, N. Produkcja roślin zielarskich w Polsce. Roczniki Naukowe Stowarzyszenia Ekonomistów Rolnictwa i Agrobiznesu 2008, 10, 270–273. (In Polish) [Google Scholar]
- Seidler-Łożykowska, K.; Król, D.; Bocianowski, J. Content of essential oil and its composition in fruit originated from caraway (Carum carvi L.) collection. Rośl. Oleiste—Oilseed Crops 2010, 31, 145–158. (In Polish) [Google Scholar]
- European Pharmacopoeia 7; Council of Europe Publishing: Strasbourg, France, 2011.
- Bhat, S.V.; Nagasampagi, B.A.; Sivakumar, M. Chemistry of Natural Products; Narosa Publishing House: New Delhi, India, 2006; p. 115. [Google Scholar]
- Iscan, G.; Kirimer, N.; Kürkcüoglu, M.; Baser, H.C.; Demirci, F. Antimicrobial screening of Mentha piperita essential oils. J. Agric. Food Chem. 2002, 50, 3943–3946. [Google Scholar] [CrossRef] [PubMed]
- Edris, A.E.; Farrag, E.S. Antifungal activity of peppermint and sweet basil essential oils and their major aroma constituents on some plant pathogenic fungi from the vapor phase. Nahrung 2003, 47, 117–121. [Google Scholar] [CrossRef] [PubMed]
- Gupta, C.; Garg, A.P.; Uniyal, R.C.; Kumari, A. Antimicrobial activity of some herbal oils against common food-borne pathogens. Afr. J. Microbiol. Res. 2008, 2, 258–261. [Google Scholar]
- Soković, M.; Glamočlija, J.; Marin, P.D.; Brkić, D.; van Griensven, L.J. Antibacterial effects of the essential oils of commonly consumed medicinal herbs using an in vitro model. Molecules 2010, 15, 7532–7546. [Google Scholar] [CrossRef]
- Skrinjar, M.M.; Mandic, A.I.; Misan, A.C.; Sakac, M.B.; Šaric, L.C.; Zec, M.M. Effect of mint (Mentha piperita L.) and caraway (Carum carvi L.) on the growth of some toxigenic Aspergillus species and aflatoxin B1 production. Proc. Nat. Sci. Matica Srpska Novi Sad 2009, 116, 131–139. [Google Scholar] [CrossRef]
- Kumar, P.; Mishra, S.; Malik, A.; Satya, S. Insecticidal properties of Mentha species: A review. Ind. Crop. Prod. 2011, 34, 802–817. [Google Scholar] [CrossRef]
- Bazhal, M.I.; Lebovka, N.I.; Vorobiev, E. Pulsed electric field treatment of apple tissue during compression for juice extraction. J. Food Eng. 2001, 50, 129–139. [Google Scholar] [CrossRef]
- Praporscic, I.; Shynkaryk, M.V.; Lebovka, N.I.; Vorobiev, E. Analysis of juice colour and dry matter content during pulsed electric field enhanced expression of soft plant tissues. J. Food Eng. 2007, 79, 662–670. [Google Scholar] [CrossRef]
- Bouzrara, H.; Vorobiev, E. Beet juice extraction by pressing and pulsed electric field. Int. Sugar J. 2000, 102, 194–200. [Google Scholar]
- Soković, M.D.; Vukojević, J.; Molecules, M. Chemical composition of essential oils of Thymus and Mentha species and their antifungal activities. Molecules 2009, 14, 238–249. [Google Scholar] [CrossRef] [PubMed]
- Derwich, E.; Benziane, Z.; Taouil, R.; Senhaji, O.; Touzani, M. Aromatic Plants of Morocco: GC/MS Analysis of the Essential Oils of Leaves of Mentha piperita. Adv. Environ. Biol. 2010, 4, 80–85. [Google Scholar]
- Stanojević, L.; Marjanović-Balaban, Ž.D.; Kalaba, V.; Stanojević, J.; Cvetkovic, D.; Cakic, M.; Gojkovic, V. Chemical Composition and Antibacterial Activity of the Essential Oil of Menthae piperitae L. Qual. Life (Banja Luka) 2018, 16, 1–2. [Google Scholar]
- Stanojevic, L.J.; Marjanovic-Balaban, Ž.; Kalaba, V.; Stanojevic, J.; Cvetkovic, D. Chemical Composition, Antioxidant and Antimicrobial Activity of Chamomile Flowers Essential Oil (Matricaria chamomilla L.). J. Essent. Oil-Bear. Plants 2016, 19, 2017–2028. [Google Scholar] [CrossRef]
- Schmidt, E.; Bail, S.; Buchbauer, G.; Stoilova, I.; Atanasova, T.; Stoyanova, A.; Krastanov, A.; Jirovetz, L. Chemical Composition, Olfactory Evaluation and Antioxidant Effects of Essential Oil from Mentha x piperita. Nat. Prod. Res. 2009, 4, 1107–1112. [Google Scholar] [CrossRef]
- Sadowska, U.; Żabiński, A.; Szumny, A.; Dziadek, K. An effect of peppermint herb (Mentha piperita L.) pressing on physico-chemical parameters of the resulting product. Ind. Crop. Prod. 2016, 94, 909–919. [Google Scholar] [CrossRef]
- Seidler-Łożykowska, K.; Król, D.; Bocianowski, J. Zawartość olejku eterycznego i jego skład w owocach pochodzących z kolekcji kminku zwyczajnego (Carum carvi L.). Rośl. Oleiste—Oilseed Crops 2010, 31, 147–160. [Google Scholar]
- Seidler-Łożykowska, K.; Barańska, M.; Barański, R.; Krol, D. Raman Analysis of Caraway (Carum carvi L.) Single Fruits. Evaluation of Essential Oil Content and Its Composition. J. Agric. Food Chem. 2010, 58, 5271–5275. [Google Scholar] [CrossRef]
- Bosko, R.; Vagnerova, L.; Pluhackova, H.; Sofrova, J.; Smirous, P. The variability of caraway (Carum carvi L.) essential oils. MendelNet 2016, 23, 30–34. [Google Scholar]
- Sellami, I.H.; Rebey, I.B.; Sriti, J.; Rahali, F.Z.; Limam, F.; Marzouk, B. Drying sage (Salvia officinalis L.) plants and its effects on content, chemical composition, and radical scavenging activity of the essential oil. Food Bioprocess. Technol. 2012, 5, 2978–2989. [Google Scholar] [CrossRef]
- Sadowska, U.; Kopeć, A.; Kourimska, L.; Zarubova, L.; Kloucek, P. The effect of drying methods on the concentration of compounds in sage and thyme. J. Food Process. Preserv. 2017, 41, 1–11. [Google Scholar] [CrossRef]
- Vega-Mercado, H.; Pothakamury, U.R.; Chang, F.J.; Barbosa-Cànovas, G.V.; Swanson, B.G. Inactivation of Escherichia coli by combining pH, ionic strength and pulsed electric fields hurdles. Food Res. Int. 1996, 29, 117–121. [Google Scholar] [CrossRef]
- Ngadi, M.O.; Bazhal, M.I.; Raghaven, G.S.V. Engineering aspects of pulsed electroplasmolysys of vegetable tissues. Agric. Eng. Int. 2003, 5, 1–10. [Google Scholar]
- Shanker, S.; Ajaykumar, P.V.; Sangwan, N.S.; Kumar, S.; Sangwan, R.S. Essential oil gland number and ultrastructure Turing Mentha arvensis leafonkogeny. Biol. Plant. 1999, 42, 379–387. [Google Scholar] [CrossRef]
- Díaz-Maroto, M.C.; Pérez-Coello, M.S.; González, M.A.V.; Cabezudo, M.D. Influence of drying on the flavor quality of spearmint (Mentha spicata L.). J. Agric. Food Chem. 2003, 51, 1265–1269. [Google Scholar] [CrossRef] [PubMed]
- Raut, J.S.; Karuppayil, S.M. A status review on the medicinal properties of essential oils. Ind. Crop. Prod. 2014, 62, 250–264. [Google Scholar] [CrossRef]
- Assami, K.; Pingret, D.; Chemat, S.; Meklat, B.Y.; Chemat, F. Ultrasound induced intensification and selective extraction of essential oil from Carum carvi L. seeds. Chem. Eng. Process. 2012, 62, 99–105. [Google Scholar] [CrossRef]
- Gandolfi, M.; Taddei, P.; Pondrelli, A.; Zamparini, F.; Prati, C.; Spagnuolo, G. Demineralization, Collagen Modification and Remineralization Degree of Human Dentin after EDTA and Citric Acid Treatments. Materials 2019, 12, 25. [Google Scholar] [CrossRef]
- Alosmanov, R.; Imanova, J.; Wolski, K.; Ziemmermann, R.; Fiejdasz, S.; Przewoźnik, J.; Goc, K.; Kapusta, C.; Zapotoczny, S.; Szuwarzyński, M. Fabrication of Functional Carbon/Magnetic Nanocomposites as A Promising Model of Utilization of Used Crosslinked Polymers. Materials 2018, 11, 2595. [Google Scholar] [CrossRef]
- Guillen, M.D.; Cabo, N. Infrared spectroscopy in the study of edible oils and fats. J. Sci. Food Agric. 1997, 75, 1–11. [Google Scholar] [CrossRef]
- Guillén, M.D.; Cabo, N. Fourier transform infrared spectra data versus peroxide and anisidine values to determine oxidative stability of edible oils. Food Chem. 2002, 77, 503–510. [Google Scholar] [CrossRef]
- Rohman, A.; Che Man, Y.B. Monitoring of virgin coconut oil (VCO) adulteration with palm oil using Fourier transform infrared spectroscopy. J. Food Lipids 2009, 16, 618–628. [Google Scholar] [CrossRef]
- Tapp, H.S.; Defernez, M.; Kemsley, E.K. FTIR spectroscopy and multivariate analysis can distinguish the geographic origin of extra virgin olive oils. J. Agric. Food Chem. 2003, 51, 6110–6115. [Google Scholar] [CrossRef] [PubMed]
- Scholze, B.; Meier, D. Characterization of the water-insoluble fraction from pyrolysis oil (pyrolytic lignin). Part I. PY–GC/MS, FTIR, and functional groups. J. Anal. Appl. Pyrolysis 2001, 60, 41–54. [Google Scholar] [CrossRef]
- Gurdeniz, G.; Ozen, B. Detection of adulteration of extra-virgin olive oil by chemometric analysis of mid-infrared spectral data. Food Chem. 2009, 116, 519–525. [Google Scholar] [CrossRef] [Green Version]
- García, M.J.L. Introduction. In Characterization and Authentication of Olive and Other Vegetable Oils; Springer: Berlin/Heidelberg, Germany, 2012; pp. 1–43. [Google Scholar]
- Yang, D.; Ying, Y. Applications of Raman spectroscopy in agricultural products and food analysis: A review. Appl. Spectrosc. Rev. 2011, 46, 539–560. [Google Scholar] [CrossRef]
- Cozzolino, D.; Smyth, H.E.; Gishen, M. Feasibility study on the use of visible and near-infrared spectroscopy together with chemometrics to discriminate between commercial white wines of different varietal origins. J. Agric. Food Chem. 2003, 51, 7703–7708. [Google Scholar] [CrossRef] [PubMed]
- Vlachos, N.; Skopelitis, Y.; Psaroudaki, M.; Konstantinidou, V.; Chatzilazarou, A.; Tegou, E. Applications of Fourier transform-infrared spectroscopy to edible oils. Anal. Chim. Acta 2006, 573, 459–465. [Google Scholar] [CrossRef] [PubMed]
- Bendini, A.; Cerretani, L.; Di Virgilio, F.; Belloni, P.; Bonoli-Carbognin, M.; Lercker, G. Preliminary evaluation of the application of the FTIR spectroscopy to control the geographic origin and quality of virgin olive oils. J. Food Qual. 2007, 30, 424–437. [Google Scholar] [CrossRef]
- Anderson, T.W. An Introduction to Multivariate Statistical Analysis; Wiley: New York, NY, USA, 2003. [Google Scholar]
- Bonnier, F.; Byrne, H.J. Understanding the molecular information contained in principal component analysis of vibrational spectra of biological systems. Analyst 2012, 137, 322–332. [Google Scholar] [CrossRef] [PubMed]


| Peak Name | Time (min) | Kovats Retention Index | The Volatile Compounds % | |
|---|---|---|---|---|
| Exp. | Lit. | |||
| 2-(E)-Hexenal | 4.304 | 830 | 827 | tr. |
| 1-Hexanol | 4.346 | 861 | 854 | tr. |
| 3-Heptanol | 5.242 | 889 | 884 | 0.02 |
| α-Pinene | 6.279 | 938 | 932 | 0.29 |
| Sabinene | 7.450 | 981 | 969 | 0.21 |
| β-Pinene | 7.575 | 984 | 974 | 0.12 |
| Myrcene | 7.967 | 998 | 988 | 0.19 |
| 3-Octanol | 8.079 | 1001 | 989 | 0.40 |
| Limonene | 9.333 | 1032 | 1024 | tr. |
| Eucalyptol | 9.433 | 1035 | 1026 | 3.13 |
| Ocimene, (Z)-β | 9.625 | 1040 | 1032 | 0.24 |
| Ocimene, (E)-β | 10.029 | 1050 | 1044 | 0.04 |
| trans-Sabinene hydrate | 10.790 | 1069 | 1065 | 0.03 |
| Linalool | 12.104 | 1100 | 1095 | 0.19 |
| 2-Methylbutyl-3-methyl butyrate | 12.450 | 1109 | 1111 | 0.07 |
| 3-Octyl acetate | 13.121 | 1124 | 1123 | 0.06 |
| trans-Sabinol | 13.817 | 1140 | 1137 | 0.07 |
| cis-p-Mentha-2.8-dien-1-ol | 13.925 | 1142 | 1140 | tr. |
| neo-Isopulegol | 14.142 | 1147 | 1144 | 0.21 |
| Menthone | 14.629 | 1152 | 1148 | 38.19 |
| Menthofurane | 15.008 | 1164 | 1159 | 11.44 |
| Menthol | 15.479 | 1172 | 1167 | 28.35 |
| Isomenthol | 15.813 | 1185 | 1179 | 0.50 |
| neo-Isomenthol | 16.033 | 1190 | 1183 | 0.19 |
| Myrtenol | 16.367 | 1198 | 1194 | 0.04 |
| cis-Piperitol | 16.492 | 1202 | 1195 | tr. |
| trans-Piperitol | 16.808 | 1210 | 1207 | tr. |
| Isopipetitenol | 17.171 | 1220 | 1228 | 0.10 |
| Isovaleric acid cis-3-hexenyl ester | 18.100 | 1237 | 1238 | 0.10 |
| Pulegone | 18.250 | 1240 | 1240 | 0.24 |
| Piperitone | 18.925 | 1254 | 1249 | 1.42 |
| neo-Menthyl acetate | 19.879 | 1276 | 1271 | 0.18 |
| Perilla alcohol | 20.513 | 1289 | 1294 | 0.08 |
| Menthyl acetate | 20.775 | 1297 | 1304 | 8.39 |
| p-Menth-1-en-9-ol | 20.875 | 1298 | 1294 | tr. |
| iso – Menthyl acetate | 21.379 | 1310 | 1304 | 0.20 |
| Dihydrocarveol acetateτ | 21.571 | 1314 | 1310 | tr. |
| α-Copaene | 24.413 | 1374 | 1378 | tr. |
| β-Bourbonene | 24.817 | 1386 | 1387 | 0.32 |
| β-Elemene | 25.121 | 1392 | 1389 | 0.26 |
| Caryophyllene(E)-β | 26.337 | 1420 | 1417 | 1.52 |
| β-Copaene | 26.737 | 1432 | 1430 | tr. |
| Himachalene | 27.413 | 1443 | 1449 | 0.04 |
| unknown sesquiterpene | 27.479 | 1447 | - | 0.12 |
| Humulene | 27.783 | 1456 | 1452 | 0.16 |
| E-β-Farnesene | 27.862 | 1458 | 1454 | 0.08 |
| cis-Muurola-4(15).5-dieneτ | 28.183 | 1466 | 1465 | tr. |
| Germacrene D | 28.979 | 1482 | 1484 | 1.81 |
| Bicyclogermacrene | 29.612 | 1500 | 1499 | 0.10 |
| γ-Cadinene | 29.975 | 1508 | 1512 | 0.14 |
| δ-Cadinene | 30.696 | 1525 | 1522 | 0.08 |
| Germacrene D-4-ol | 32.846 | 1576 | 1574 | tr. |
| Sapathulenol | 32.925 | 1580 | 1577 | tr. |
| Caryophyllene oxide | 33.167 | 1585 | 1582 | 0.18 |
| Viridiflorol | 33.517 | 1594 | 1592 | 0.24 |
| epi-Cubenol τ | 34.429 | 1625 | 1627 | 0.04 |
| neo-Intermedol τ | 35.971 | 1653 | 1658 | 0.16 |
| Peak Name | Time (min) | % Composition |
|---|---|---|
| Carvone | 45.17 | 65.60 |
| Limonene | 15.69 | 30.27 |
| Dihydro-carvone | 38,04 | 0.04 |
| Dihydro-carveol | 45.50 | 0.04 |
| Carveol | 49.91 | 0.16 |
| α-thujone | 25.25 | 0.01 |
| α-pinene | 9.16 | 0.05 |
| β-pinene | 11.83 | 0.02 |
| Species | Number of Pulses | Essential Oils (mL∙100g−1) ± SD | Temperature (°C) ± SD |
|---|---|---|---|
| Peppermint | 0 | 2.25 ± 0.017 a * | 25.00 ± 1.00 d |
| 150 | 2.03 ± 0.006 b | 34.06 ± 3.26 c | |
| 250 | 2.02 ± 0.006 b | 44.80 ± 1.93 a | |
| 350 | 1.95 ± 0.01 b | 40.40 ± 2.06 b | |
| Carway | 0 | 1.67 ± 0.006 a | 25.00 ± 1.00 c |
| 150 | 1.73 ± 0.025 a | 38.00 ± 1.00 b | |
| 250 | 1.73 ± 0.006 a | 41.00 ± 1.00 a | |
| 350 | 1.77 ± 0.006 a | 42.33 ± 0.58 a |
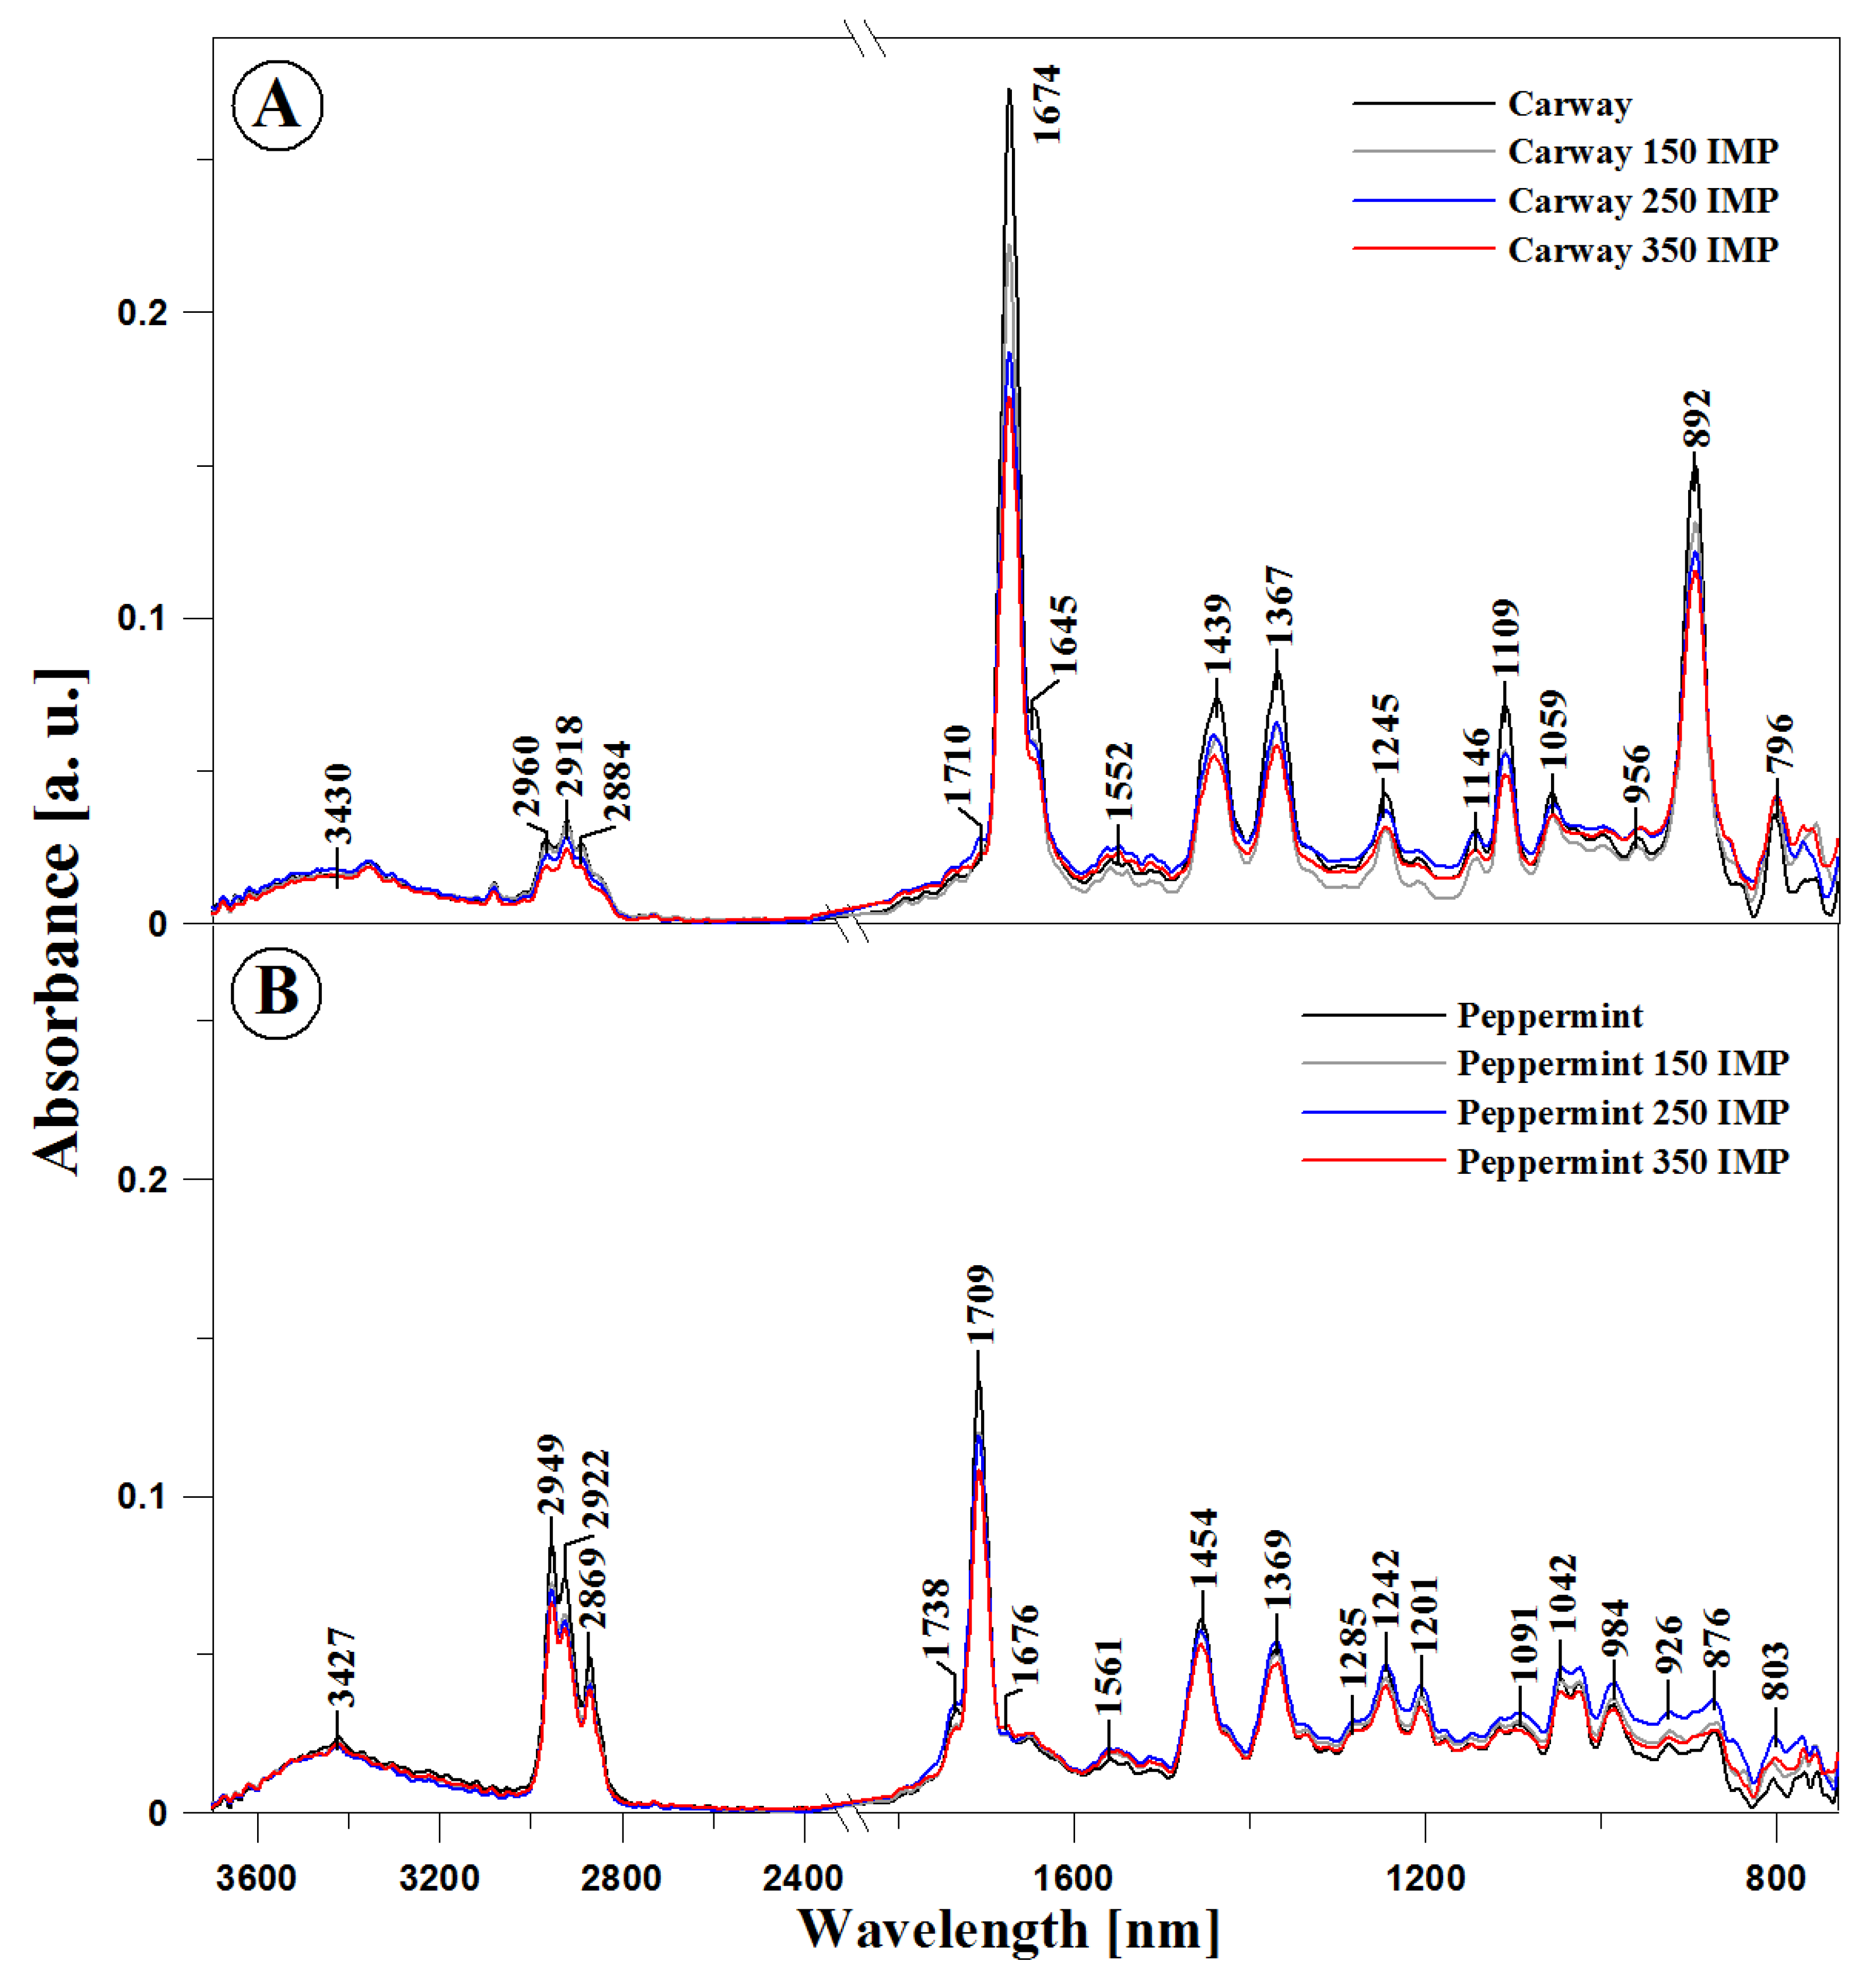
| FTIR | Type and Origin of Vibrations | |||||||
|---|---|---|---|---|---|---|---|---|
| Position of Bands (cm−1) | ||||||||
| a | b | c | d | e | f | g | h | |
| 3434 | 3427 | 3431 | 3423 | 3416 | 3428 | 3420 | 3432 | –C=Ow (overtone) and ν(=C–Hvw, trans-) or ν(–OH) |
| 2973 | 2968 | 2972 | 2965 | 2950 | 2950 | 2950 | 2954 | νas(–C–Hm, –CH3, –CH2) |
| 2924 | 2923 | 2923 | 2920 | 2923 | 2926 | 2926 | 2918 | νas(–C–Hvst, –CH2) and νs(–C–Hvst, –CHa) (alifatyczne grupy w trigricerydach) |
| 2886 | 2889 | 2886 | 2886 | 2875 | 2817 | 2871 | 2871 | |
| 2845 | 2848 | 2852 | 2844 | - | - | - | - | |
| - | - | - | - | 1737 | 1737 | 1735 | 1733 | ν(–C=Ovst) in ester |
| 1705 | 1707 | 1707 | 1707 | 1708 | 1708 | 1706 | 1706 | ν(–C=Ovw) in acid |
| 1674 | 1674 | 1676 | 1676 | 1675 | 1675 | 1675 | 1675 | νvw(–C=C–, cis-) |
| 1649 | 1645 | 1639 | 1645 | 1648 | 1648 | 1650 | 1648 | νvw(–C=C–, cis-) and δ(–OH) |
| 1557 | 1559 | 1551 | 1551 | 1559 | 1557 | 1562 | 1562/1510 | δvw(–C–H) in CH2 and CH3 group, bending (scissoring) or νvw(–C–H, cis-) bending (rocking) |
| 1438 | 1440 | 1440 | 1440 | 1458 | 1454 | 1454/1421 | 1454/1415 | |
| 1372 | 1368/1329 | 1368/1320 | 1368/1324 | 1372/1337 | 1368/1281 | 1372/1331 | 1372/1335 | νw, m, vw(–C–H, –CH3), banding |
| 1246 | 1246 | 1246 | 1246 | 1285/1244 | 1246 | 1281/1246 | 1281/1246 | νm(–C–O) or δm(–CH2-) |
| 1205 | 1213 | 1203 | 1217 | 1203 | 1207 | 1205 | 1203 | |
| 1141 | 1143 | 1143 | 1143 | 1116 | 1116 | 1178 | 1112 | νst(–C–O) or δst(–CH2–) |
| 1108 | 1109 | 1109 | 1108 | 1094 | 1091 | 1149 | 1094 | νm(–C–O) |
| 1055 | 1059 | 1059 | 1057 | 1044/1023 | 1048/1028 | 1091/1044 | 1046/1026 | νm,vw(–C–O) |
| 999 | 999 | 958 | 954 | 991/923 | 986/923 | 1030 | 982 | δw(–HC=CH–, trans-) bending out of plane |
| 958 | 960 | 891 | 891 | 873 | 869 | 986/925 | 925 | |
| 893 | 893 | 798 | 802 | 805 | - | 871 | 867 | δvw(–HC=CH–, cis-) bending out of plane |
| 798 | 820 | - | - | - | 805 | 801 | 799 | δ(–(CH2)n– and –HC=CH– (cis-) bending (rocking) |
| 761 | - | 767 | 769 | 770 | 756 | 770/758 | 768/756 | |
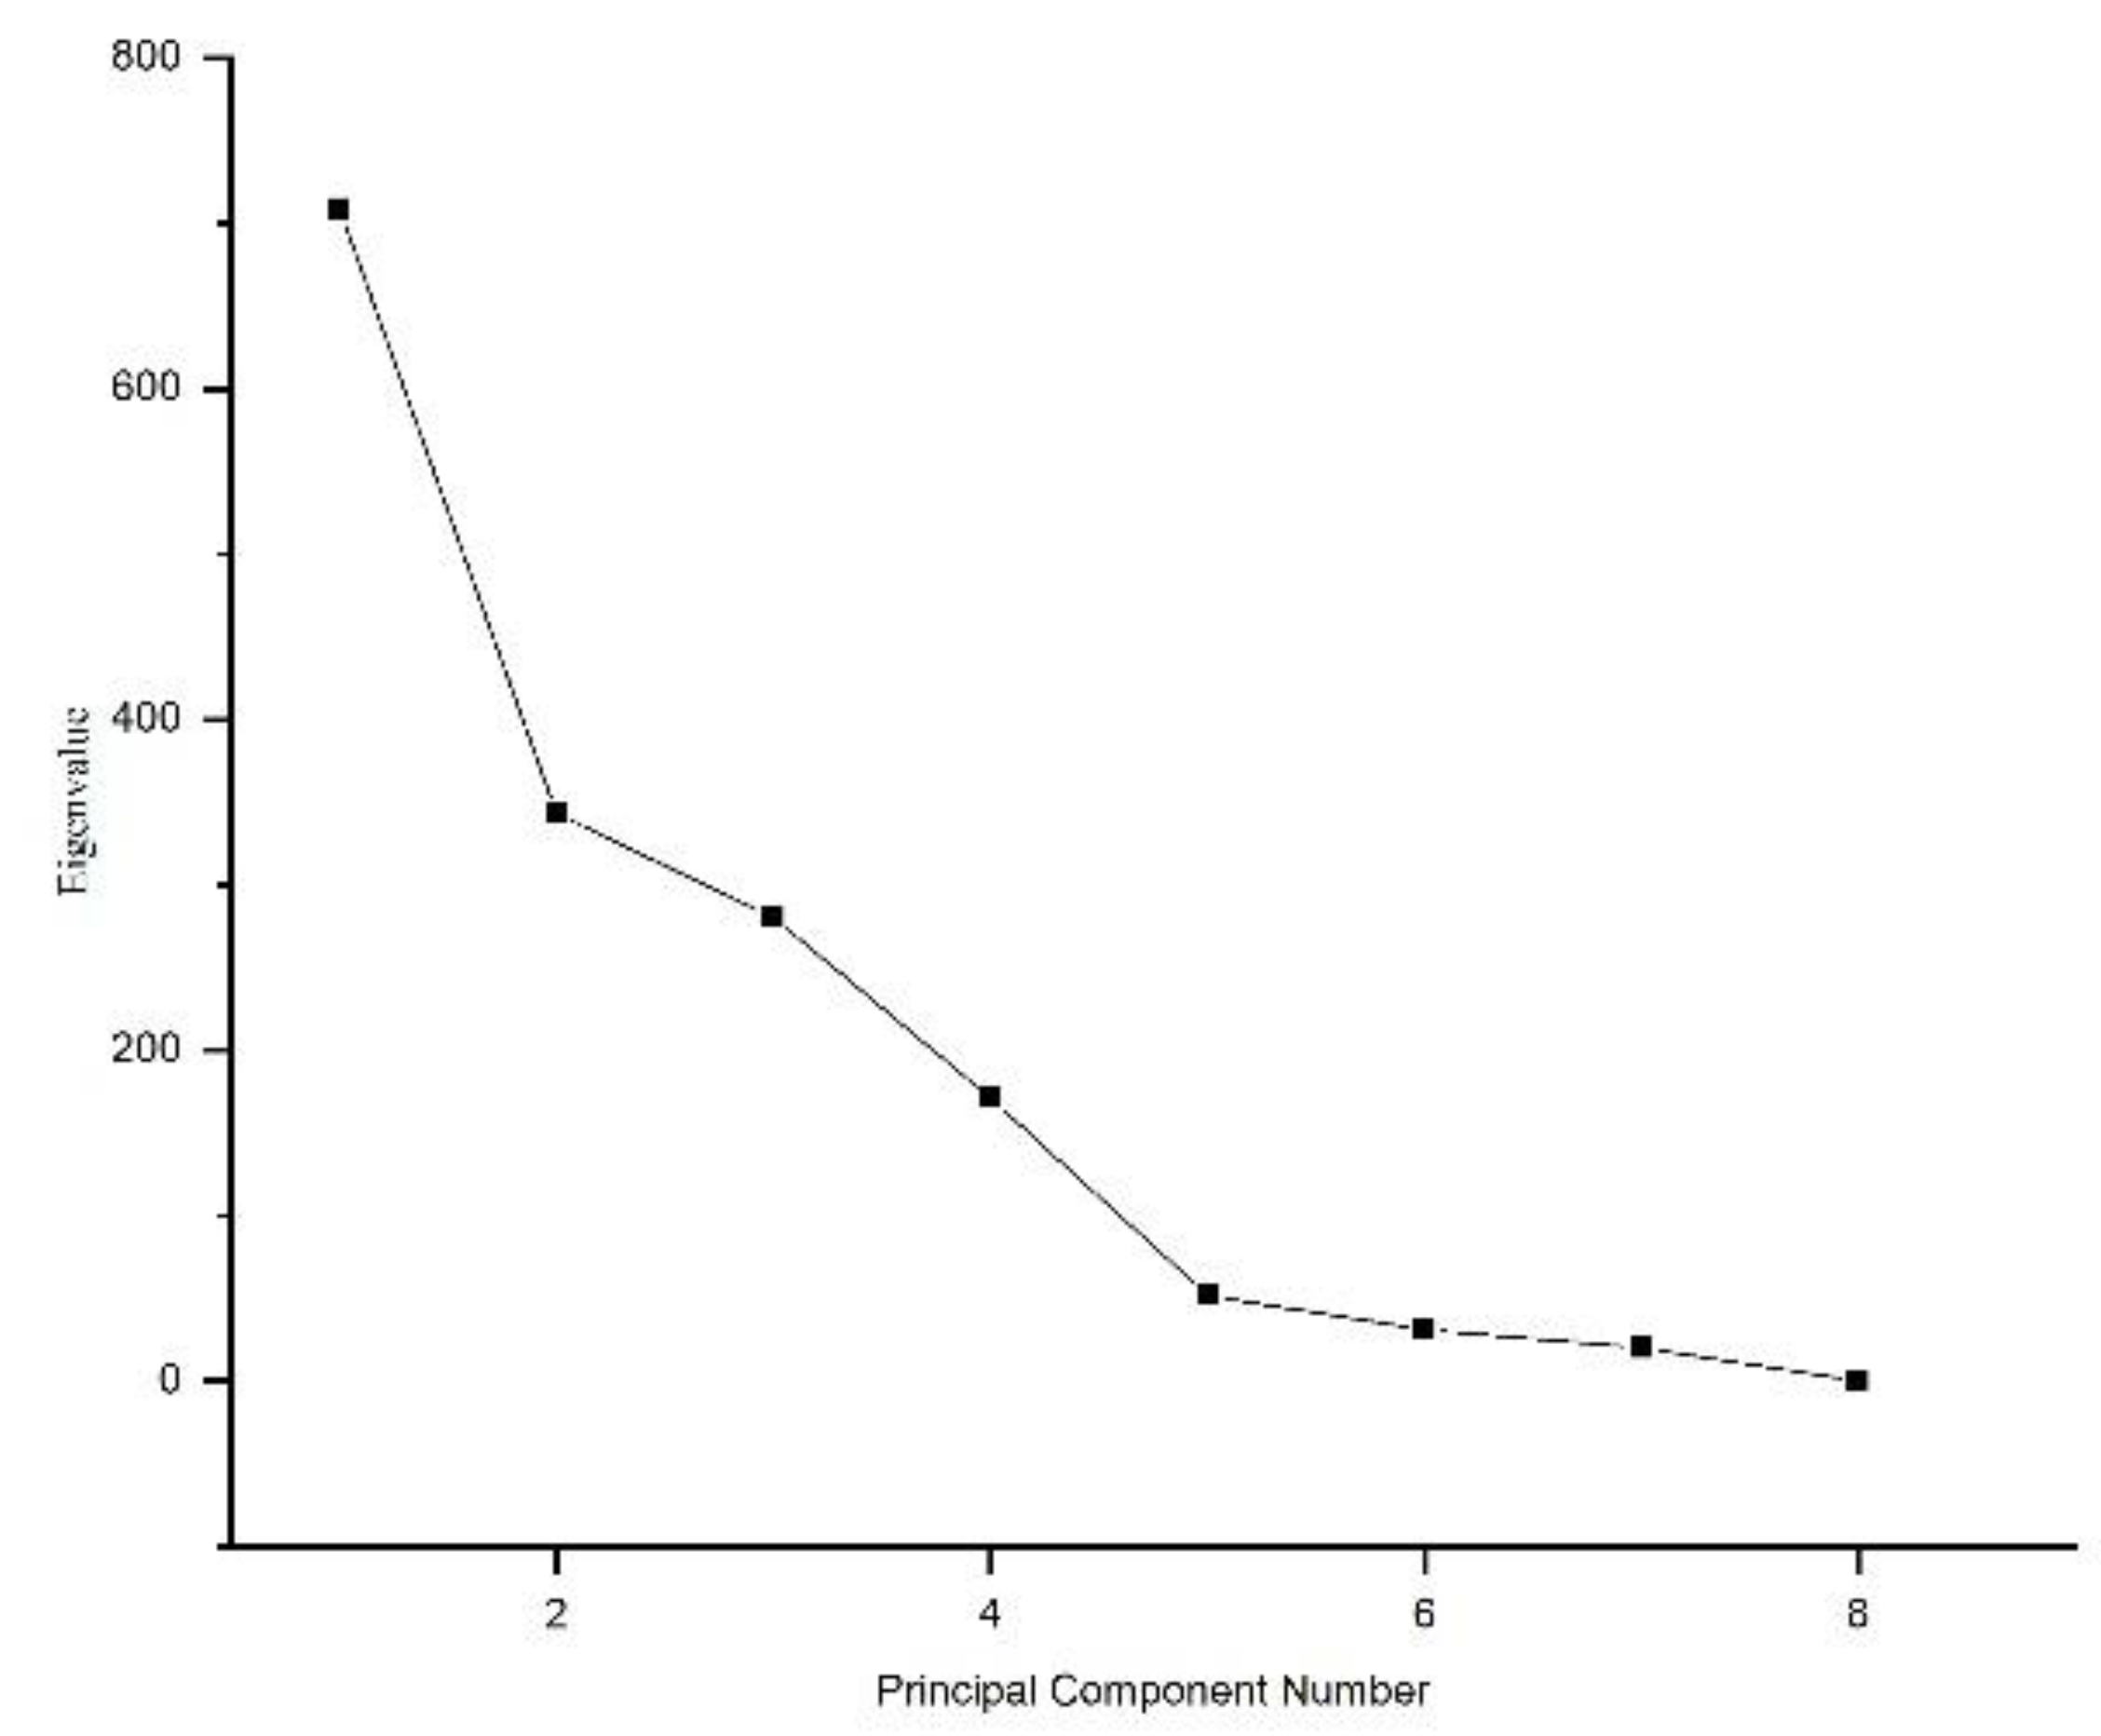
| Principal Component Number | Eigenvalue | Percentage of Explained Variance (%) | Cumulative Percentage of Explained Variance (%) |
|---|---|---|---|
| 1 | 708.81 | 44.14 | 44.14 |
| 2 | 343.05 | 21.36 | 65.50 |
| 3 | 280.25 | 17.45 | 82.95 |
| 4 | 171.05 | 10.65 | 93.60 |
| 5 | 51.65 | 3.22 | 96.81 |
| 6 | 31.25 | 1.95 | 98.76 |
| 7 | 19.94 | 1.24 | 100 |
| 8 | 5.29 × 10⁻²⁸ | 3.29 × 10⁻²⁹ | 100 |
© 2019 by the authors. Licensee MDPI, Basel, Switzerland. This article is an open access article distributed under the terms and conditions of the Creative Commons Attribution (CC BY) license (http://creativecommons.org/licenses/by/4.0/).
Share and Cite
Sadowska, U.; Matwijczuk, A.; Niemczynowicz, A.; Dróżdż, T.; Żabiński, A. Spectroscopic Examination and Chemometric Analysis of Essential Oils Obtained from Peppermint Herb (Mentha piperita L.) and Caraway Fruit (Carum carvi L.) Subjected to Pulsed Electric Fields. Processes 2019, 7, 466. https://doi.org/10.3390/pr7070466
Sadowska U, Matwijczuk A, Niemczynowicz A, Dróżdż T, Żabiński A. Spectroscopic Examination and Chemometric Analysis of Essential Oils Obtained from Peppermint Herb (Mentha piperita L.) and Caraway Fruit (Carum carvi L.) Subjected to Pulsed Electric Fields. Processes. 2019; 7(7):466. https://doi.org/10.3390/pr7070466
Chicago/Turabian StyleSadowska, Urszula, Arkadiusz Matwijczuk, Agnieszka Niemczynowicz, Tomasz Dróżdż, and Andrzej Żabiński. 2019. "Spectroscopic Examination and Chemometric Analysis of Essential Oils Obtained from Peppermint Herb (Mentha piperita L.) and Caraway Fruit (Carum carvi L.) Subjected to Pulsed Electric Fields" Processes 7, no. 7: 466. https://doi.org/10.3390/pr7070466