Article

Direct Observation of Growth Rate Dispersion in the Enzymatic Reactive Crystallization of Ampicillin

by
Matthew A. McDonald
1,2,
Andreas S. Bommarius
1,2,3,
Martha A. Grover
1,2 and
Ronald W. Rousseau
1,*
1
Georgia Institute of Technology, School of Chemical & Biomolecular Engineering, Atlanta, GA 30332, USA
2
Petit Institute for Bioengineering and Bioscience, Atlanta, GA 30332, USA
3
Georgia Institute of Technology, School of Chemistry and Biochemistry, Atlanta, GA 30332, USA
*
Author to whom correspondence should be addressed.
Processes 2019, 7(6), 390; https://doi.org/10.3390/pr7060390
Submission received: 13 May 2019 / Revised: 11 June 2019 / Accepted: 19 June 2019 / Published: 22 June 2019
(This article belongs to the Special Issue Modeling and Control of Crystallization)

Abstract

:
Prediction and control of crystal size distributions, a prerequisite for production of consistent crystalline material in the pharmaceutical industry, requires knowledge of potential non-idealities of crystal growth. Ampicillin is one such medicine consumed in crystal form (ampicillin trihydrate). Typically it is assumed that all crystals of the same chemical and geometric type grow at the same rate, however a distribution of growth rates is often observed experimentally. In this study, ampicillin produced enzymatically is crystallized and a distribution of growth rates is observed as individual crystals are monitored by microscopy. Most studies of growth rate dispersion use complex flow apparatuses to maintain a constant supersaturation or imprecise measurements of size distributions to reconstruct growth rate dispersions. In this study, the controllable enzyme reaction enables the same information to be gathered from fewer, less complicated experiments. The growth rates of individual ampicillin trihydrate crystals were found to be normally distributed, with each crystal having an intrinsic growth rate that is constant in time. Differences in the individual crystals, such as different number and arrangement of dislocations and surface morphology, best explain the observed growth rates. There is a critical supersaturation below which growth is not observed, thought to be caused by reactants adsorbing to the crystal surface and pinning advancing growth steps. The distribution of critical supersaturation also suggests that individual crystals’ surface morphologies cause a distribution of growth rates.

1. Introduction

β-lactam antibiotics represent the most important class of antibiotics, as measured by global consumption [1]. Ampicillin, the first synthetic β-lactam, is a model compound for the development towards more clinically relevant antibiotics such as amoxicillin and cephalexin [2,3]. As the pharmaceutical industry (and chemical industry as a whole) embraces biocatalysis as a means of more environmentally friendly API (active pharmaceutical ingredient) production, the synthesis of β-lactams by the enzyme penicillin G acylase (PGA) has become increasingly attractive [4]. A further optimization of β-lactam production comes from coupling the synthesis and separation of the API by reactive crystallization, which has been shown to increase the selectivity and productivity of PGA [5].
Growth rate dispersion (GRD) is a deviation from the McCabe ΔL law, which states that “geometrically similar (i.e., those with the same morphology) crystals of the same material suspended in the same solution grow at the same rate” [6]. Past research has yielded a number of mechanisms that can lead to or explain GRD [7]. One explanation is size dependent growth, whereby larger crystals grow faster because of their size. This, however, has been shown to be a manifestation of GRD as crystals with faster growth rates necessarily become larger [8]. Another model states that crystals undergo random fluctuations in growth rate but all have the same time-average growth rate [9]. The constant crystal growth model states that nuclei are created with an intrinsic growth rate based on surface features [10]. Still other models contend that different rates of attrition of different sized crystals [11] and different crystal faces explains GRD [12], surface charge distributions can cause GRD [13], or the presence of additives or adsorbing species can enhance or inhibit growth, leading to growth oscillations and GRD [14]. In this study we show that GRD observed in ampicillin trihydrate is most easily explained by the constant crystal growth model and that surface morphology and crystal imperfections (such as dislocations) are likely the cause, although the influence of additives, in this case the ampicillin precursors 6-aminopenicillanic acid (6-APA) and D-phenylglycine methyl ester (PGME), may have an important influence.
In this study, the growth rates of individual ampicillin trihydrate crystals were measured by optical microscopy as ampicillin was generated by the PGA-catalyzed condensation of 6-APA and PGME. The PGA-catalyzed generation of supersaturation enabled precise control over the supersaturation of ampicillin [15]. The catalyst and reactants were homogenous and the reactants were initially present, eliminating mass transfer effects and inhomogeneity that complicate the analysis of reactive crystallizations and anti-solvent crystallizations involving the volumetric addition of different species [16,17]. The entire experiment was isothermal, eliminating the heat transfer and subsequent inhomogeneity that complicate analysis of cooling crystallization [18,19]. The control over supersaturation also obviated the need for complex flow apparatuses used to maintain a supersaturation set point in other single crystal growth experiments [10,20]. One recent study used simulation to look at GRD with these simplified conditions (homogeneous, isothermal, non-nucleating batch) [21]; here a unique experimental system enables us to probe GRD experimentally with these simplifications. Rather than reconstruct the growth rate distribution from crystal size distributions (CSDs), which requires assumptions about the form of the distribution [22,23], the growth rate distribution in the present work is observed directly, enabling simple determination of the mechanism of GRD. Up to ~100 crystals can be analyzed in a single small-volume experiment (<20 microliters) requiring only a microscope and camera.

2. Materials and Methods

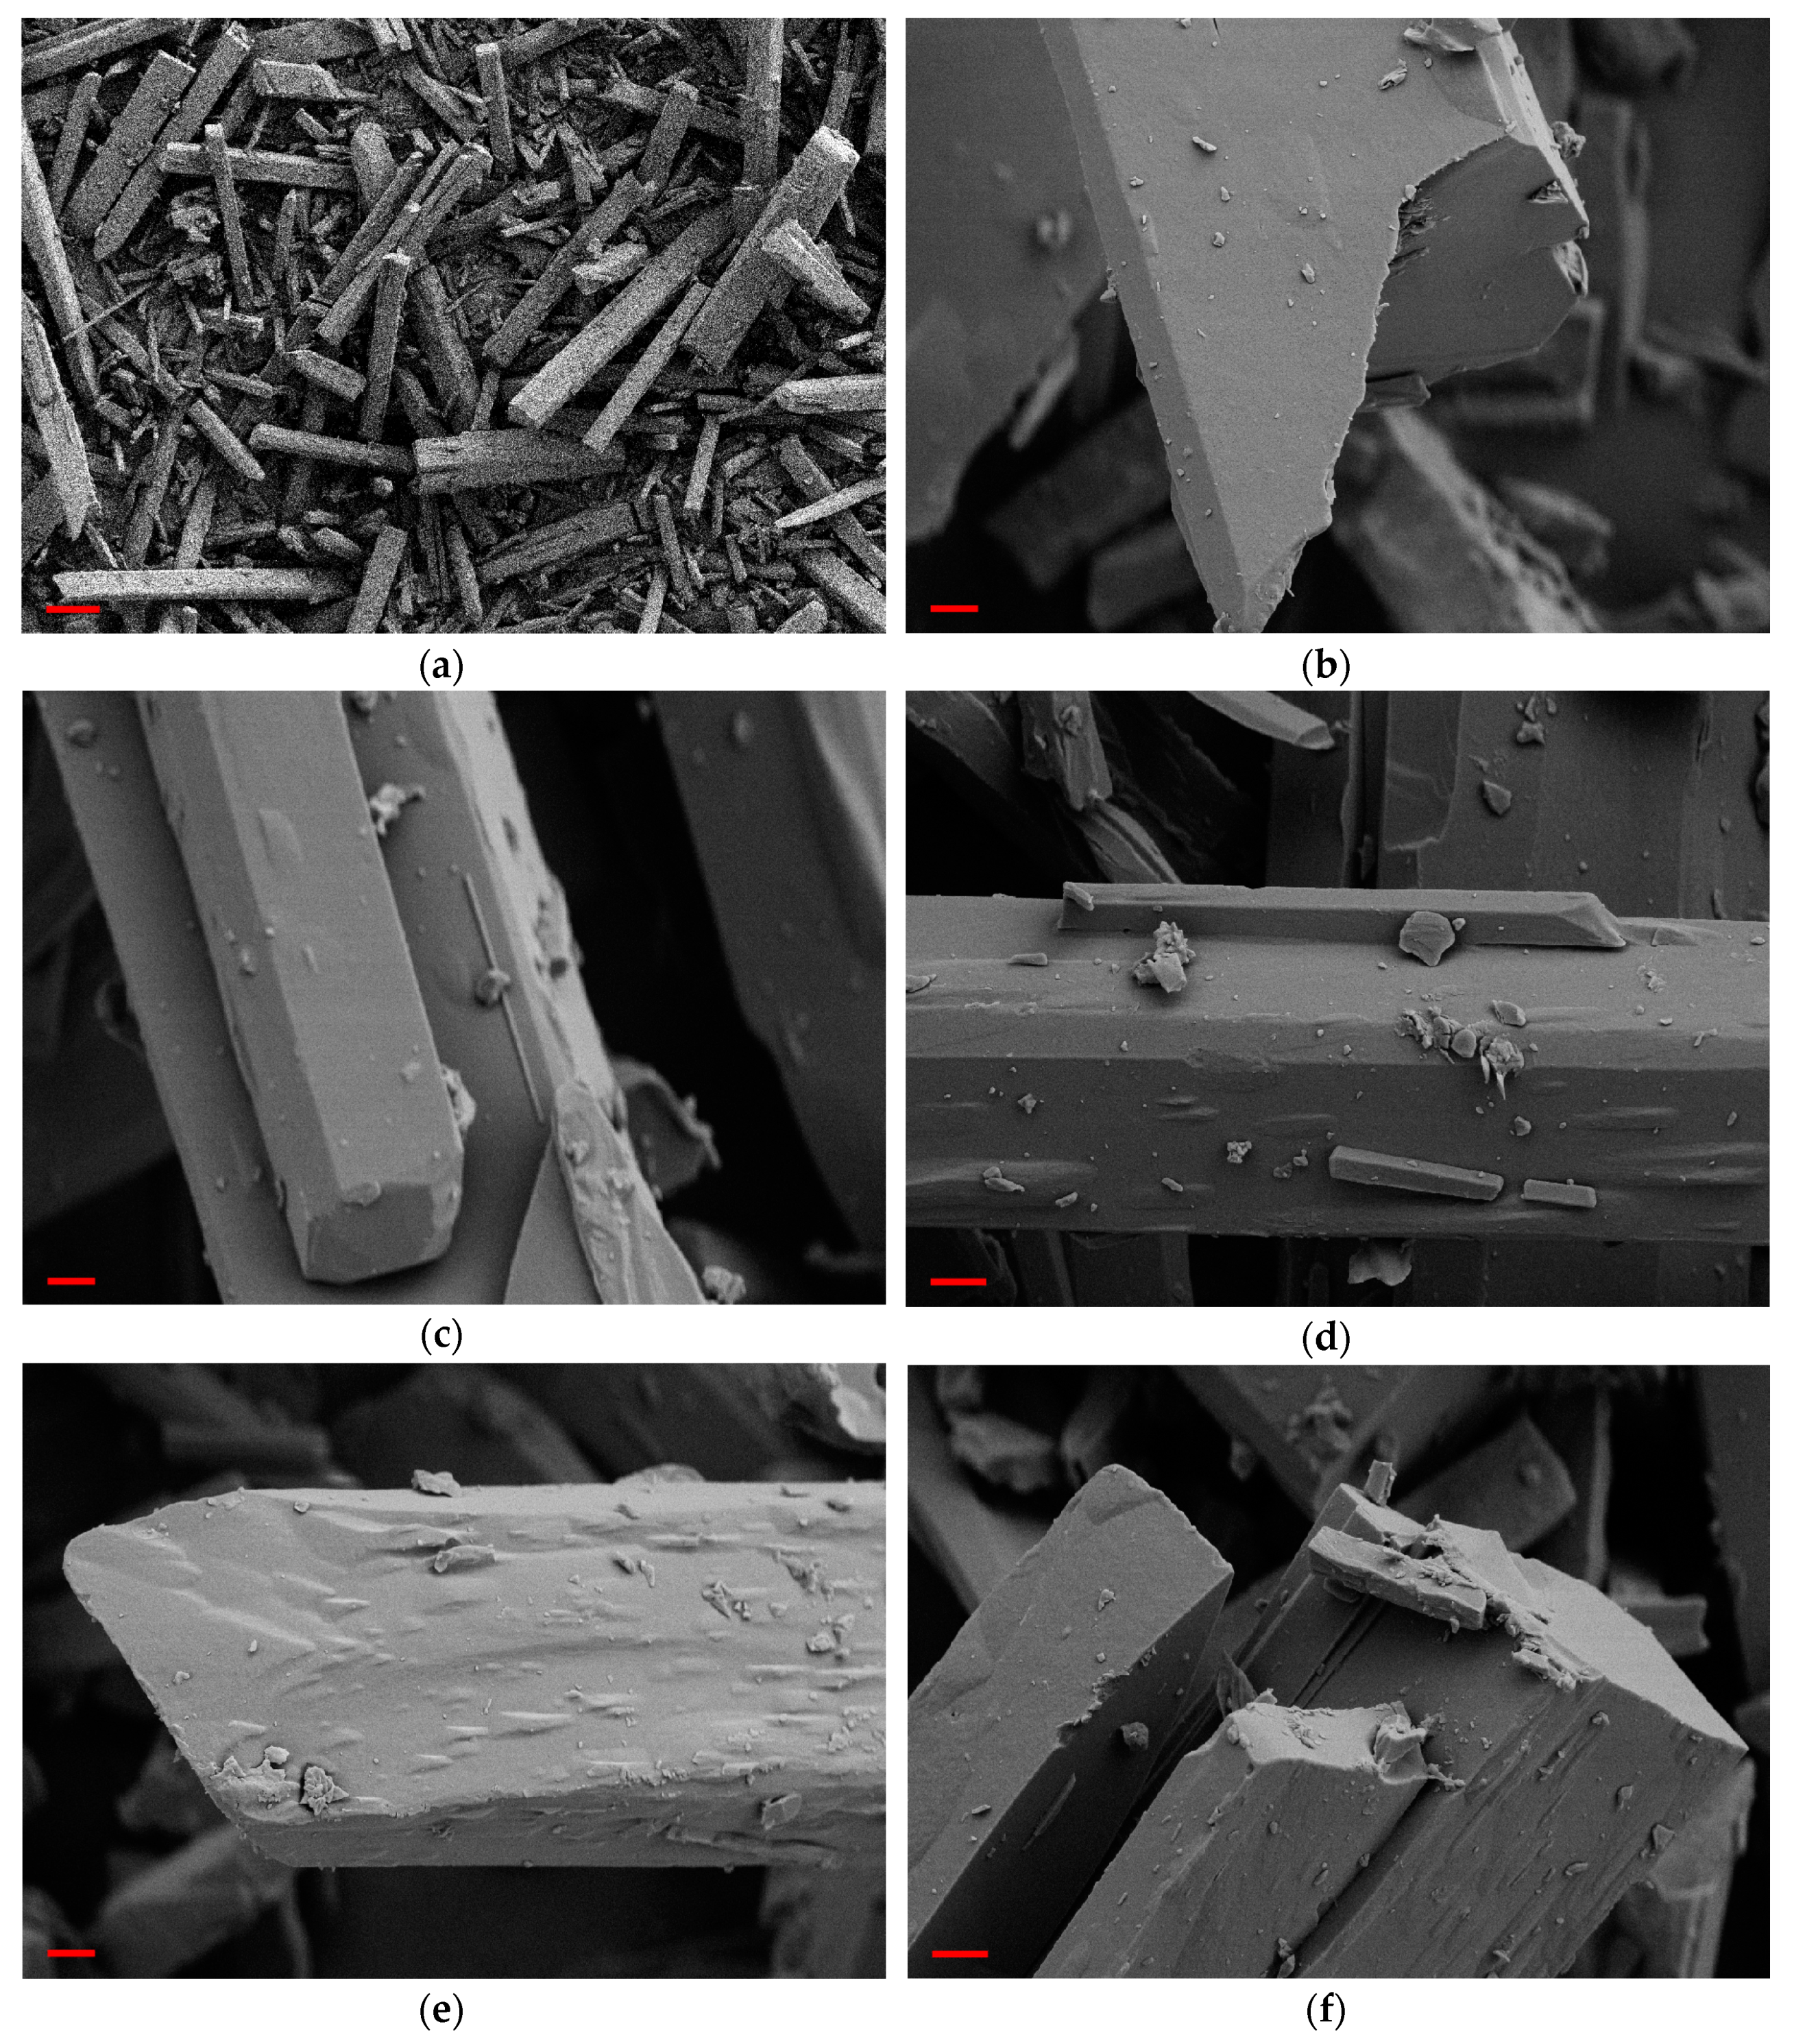
Seed crystals were prepared as follows. Ampicillin trihydrate crystals were formed at room temperature by dissolving ampicillin sodium salt (>99%, Fischer Scientific, Geel, Belgium) and neutralized by adding concentrated hydrochloric acid. All seed crystals were grown in the same batch, which was unseeded. Crystals were sieved and the 212- to 300-μm fraction was used as seed crystals. Breakage occurred during sieving and most of the seed crystals were smaller than 212 μm, demonstrating the difficulty in sieving needle shaped crystals (their small cross section allows them to slip through the sieve despite having a long characteristic size). Seeding sometimes connotes addition of a small amount of crystals to breed a large population of crystals via secondary nucleation. As nucleation is suppressed in this study, the seed crystals are from here on referred to as initial crystals. Scanning electron micrographs of the initial crystals are shown in Figure A1 of Appendix A.
Growth experiments were prepared as follows: 0.111 grams of 6-aminopenicillanic acid (6-APA, >98% purity, TCI America, Portland, OR, USA, 200 mmol/L) was suspended in 1766 μL of DI water. To dissolve the 6-APA, 634 μL of 1.0 M sodium hydroxide (>98%, Sigma Aldrich, St. Louis, MO, USA, 250 mmol/L) was added to the 6-APA suspension. To the now clear 6-APA solution, 0.103 grams of phenylglycine methyl ester hydrochloride (PGME, >95%, Sigma Aldrich, St. Louis, MO, USA 200 mmol/L) was added. The PGME•HCl dissolved immediately. To this solution, 0.01 to 0.05 grams of ampicillin trihydrate initial crystals were added, and the suspension was then incubated at 25.0 °C for 15 min with agitation to allow the ampicillin to partially dissolve and saturate. The addition of these crystals saturates the solution and provides initial crystals for observation of growth; at 0.01 g 57% of this initial charge dissolves, at 0.05 g only 11% of the initial charge dissolves. The suspension was divided into three aliquots of 665 μL allowing three repeats of each experiment. To a single aliquot, 35.0 μL of PGA stock solution (10.0 mg/mL, Assemblase®, DSM-SinoChem, Delft, Netherlands) was added. Once the PGA was added, the suspension was mixed with a magnetic stir-bar, 15.0 μL of suspension was rapidly pipetted with a wide-bore pipette tip (to avoid classifying particles by size) onto a glass microscope slide, the droplet was covered with a glass cover slip, the cover slip was sealed with silicon oil, and the microscope began recording images. The entire process from addition of PGA to beginning of data collection took approximately one minute. Images were collected with a temperature-controlled microscope, set at 25.0 °C, at a rate of one frame every two minutes, totaling two hours. The initial conditions for each experiment, based on this procedure, are listed in Table 1.
A Leica DM LM microscope with a temperature controlled stage was used with incident lighting and 200x total magnification (20x Leica PL Fluotar objective lens and 10x eyepiece magnification). A CoolSNAP-Pro CF camera with 36-bit color imaging was attached to the TV port; the field of view was 1040-by-1392 pixels, corresponding to 1100-by-1480 microns. Images were collected with Image-Pro Plus and exported to MATLAB for analysis.
The images collected were analyzed with GT Fiber [24,25]. GT Fiber is a program designed to measure the lengths of fibers in images and has the advantage that it can distinguish when two fibers (or crystals) overlap or cross, an issue which has rendered image analysis of other needle-like crystals difficult [26,27]. As there was no convection during the experiment, individual crystals did not move substantially between frames and could be tracked over the course of the entire experiment. With the initial frame, individual crystals to be tracked were selected, by hand, and their length and width calculated with GT Fiber. 
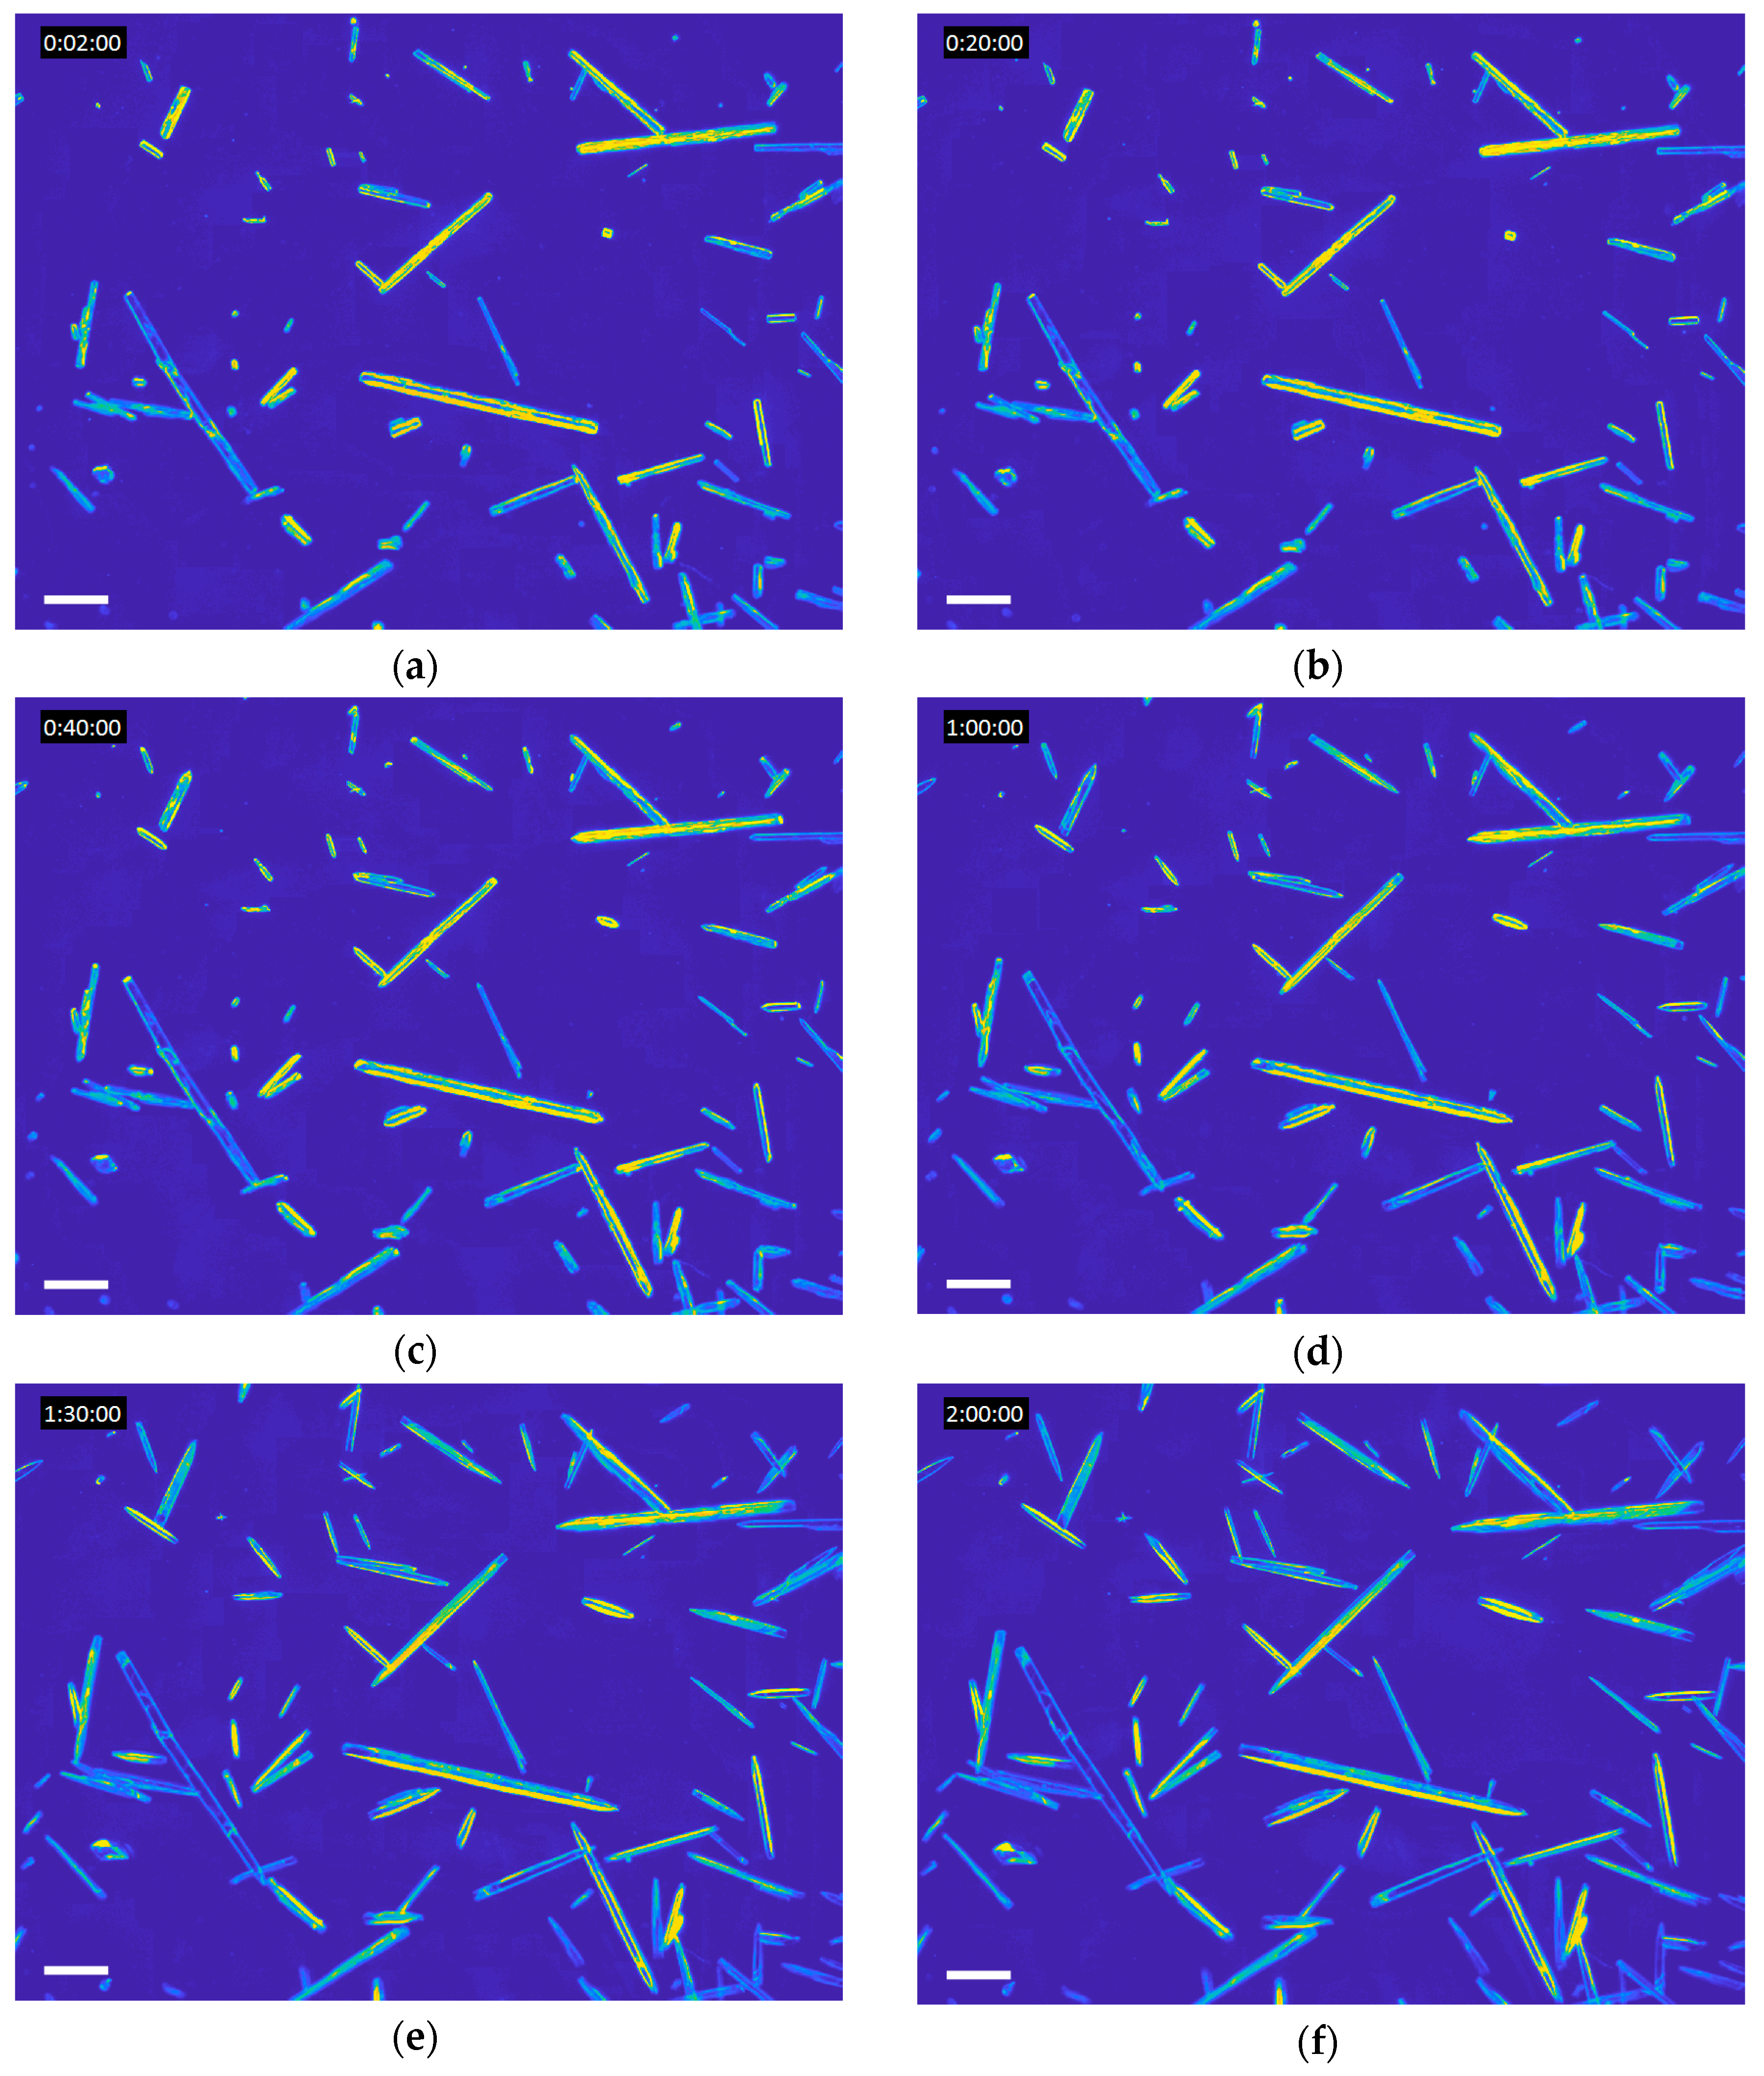
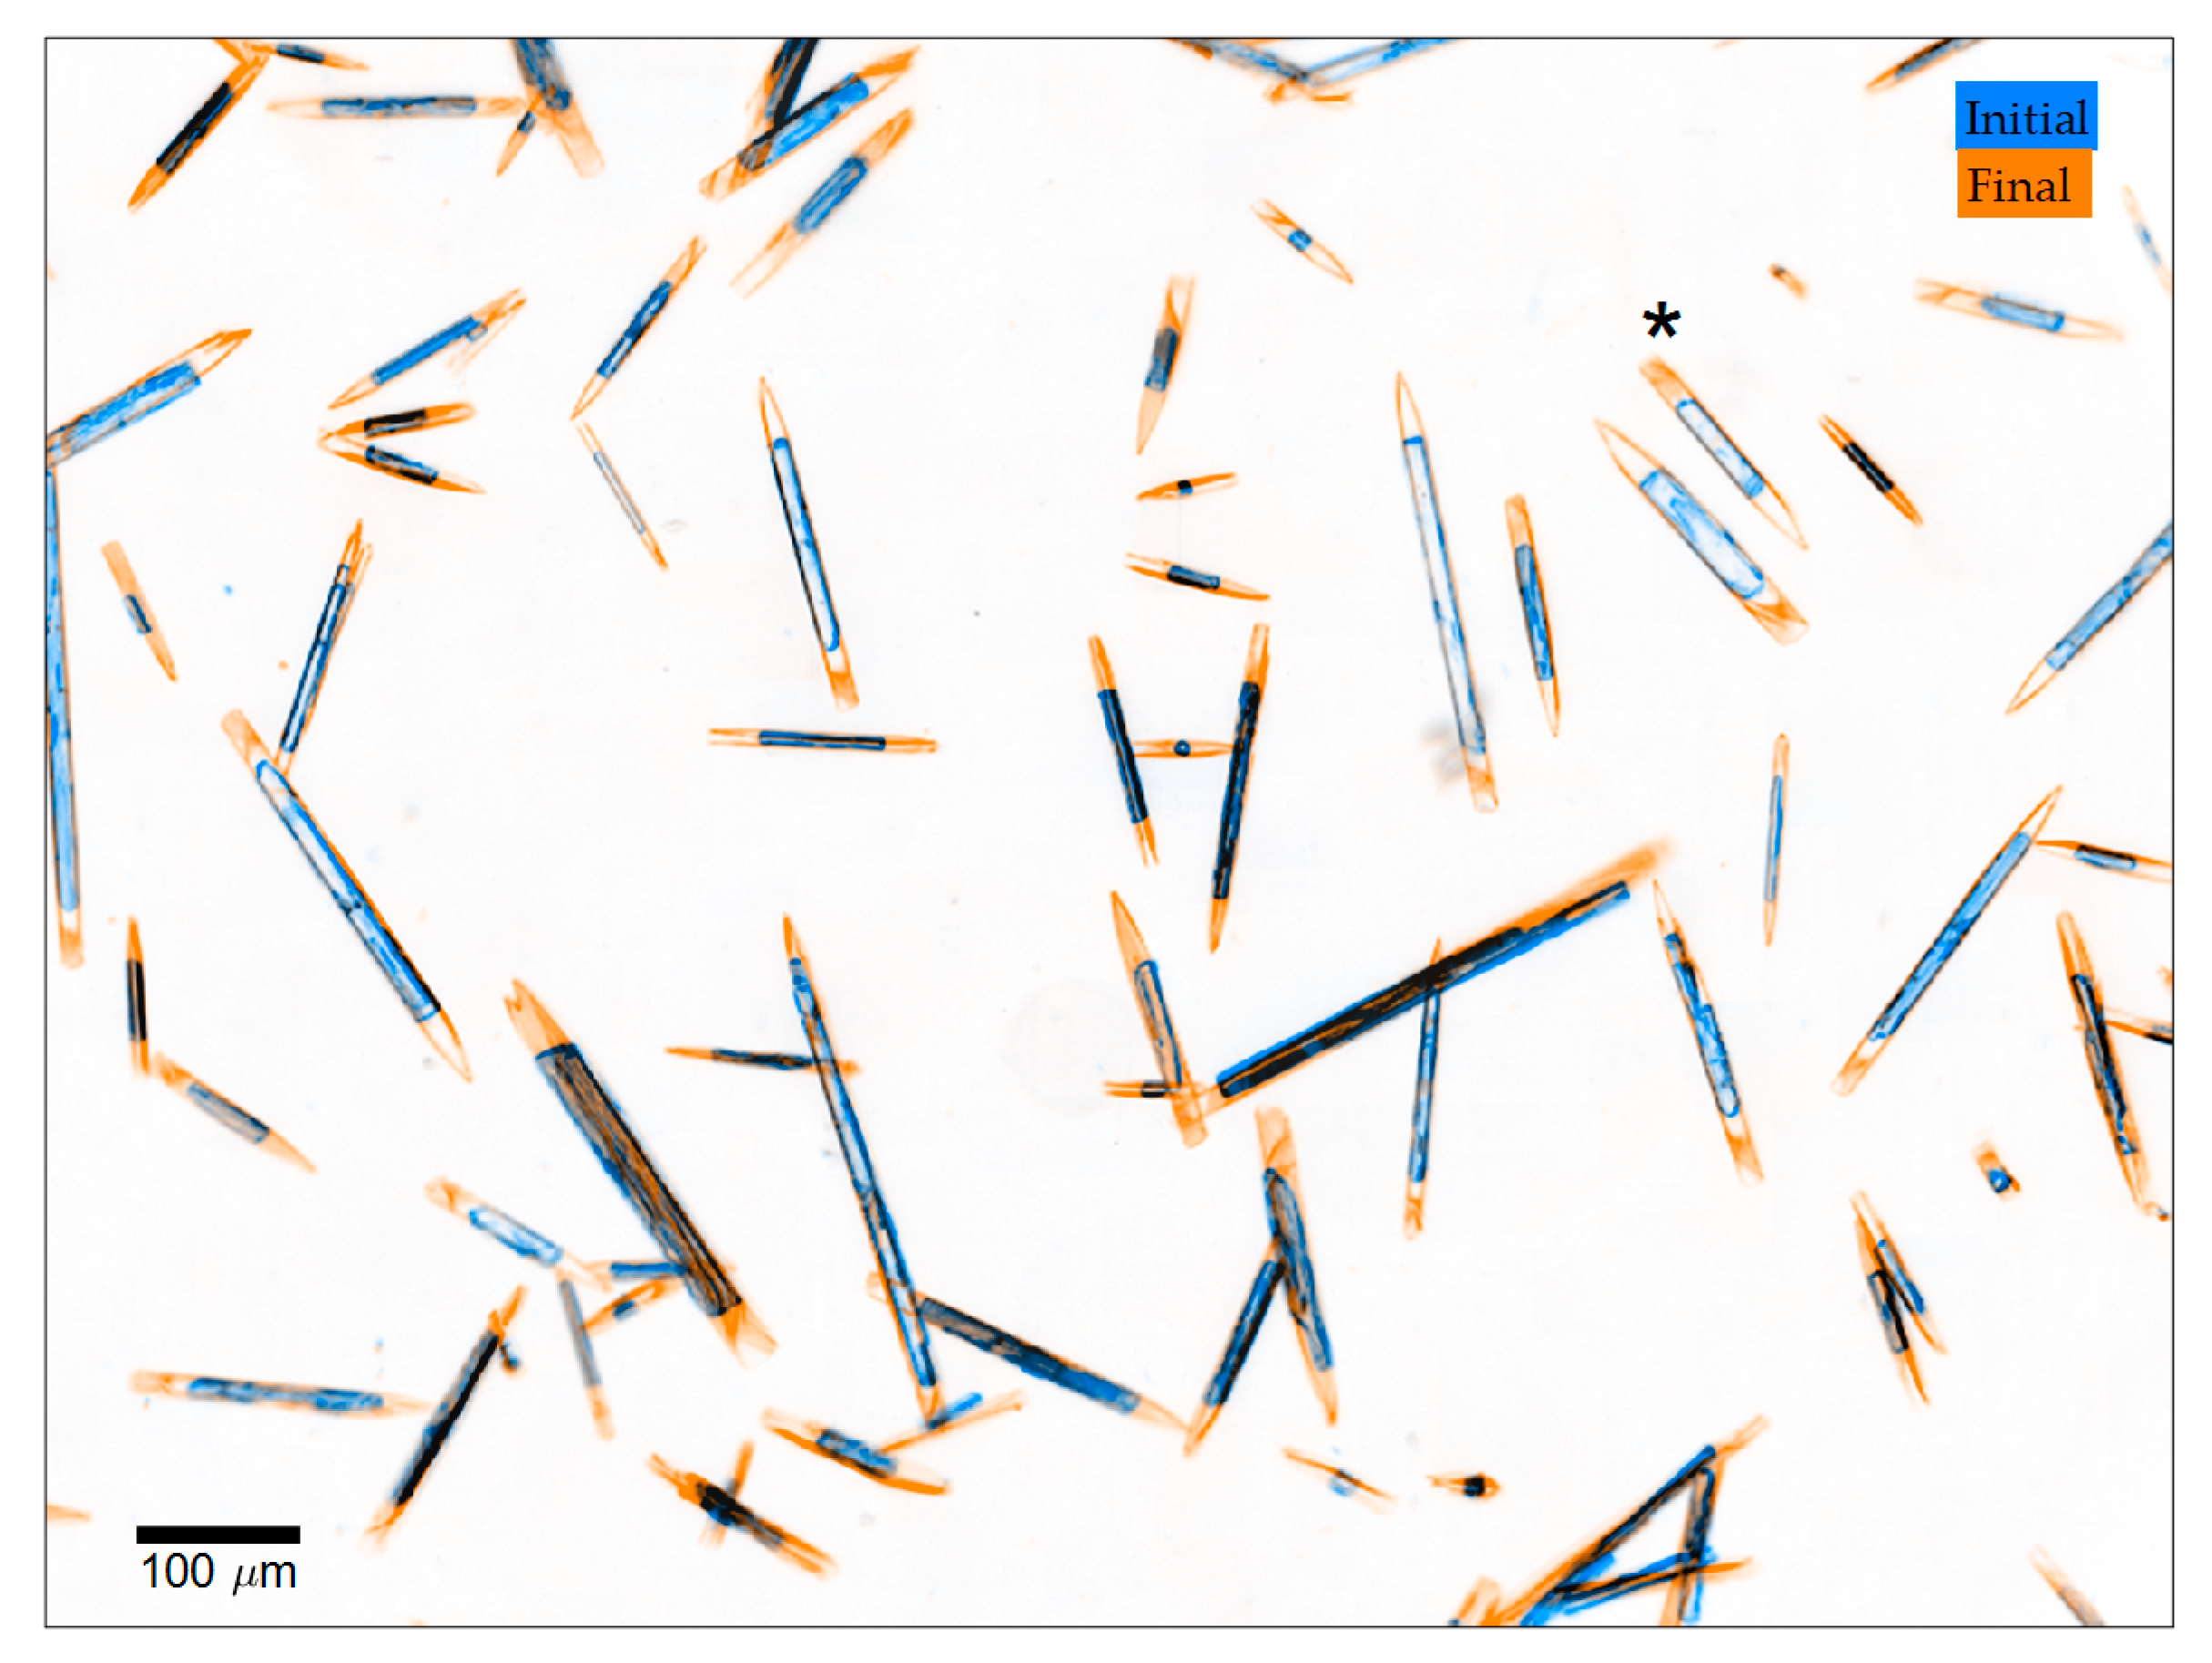
Figure 1a shows the initial frame from a single experiment; every additional frame was fit with GT Fiber, using the previous frame to identify the crystals of interest. Figure 1b–f shows the same experiment over 2 h of growth. The lengths and widths of each individual crystal over time were extracted, from which growth rates could be determined. While the length calculation is robust, the width measurement is more uncertain; the crystals are transparent (only their edges are visible, see Figure 1) so there is no obvious edge along which to measure the width. In total, 1003 ampicillin trihydrate crystals were observed by this method. Occasionally, two crystals would grow end to end (confusing the image analysis) or out of the image frame (resulting in unobservable growth); these crystals were removed from the dataset, giving a working set of 887 crystals. Videos of growing crystals, including the video Figure 1 was taken from, are Figures S1–S3 in the Supplemental Material.
To make inferences about the properties of the entire population of crystals, as well as the properties of ampicillin trihydrate itself, from this sample of 887 crystals, required the use of several different statistical tools. A discussion of those tools is included here to enable the reader to quickly understand the coming results. The Lilliefors statistical test tests the null hypothesis that the data are sampled from a normally distributed population without specifying the mean or variance of the population. The test statistic is the maximum distance between the sample cumulative distribution and the cumulative normal distribution with mean equal to the sample mean and variance equal to the sample variance. Tables of critical values have been computed by Monte Carlo methods and are widely available [
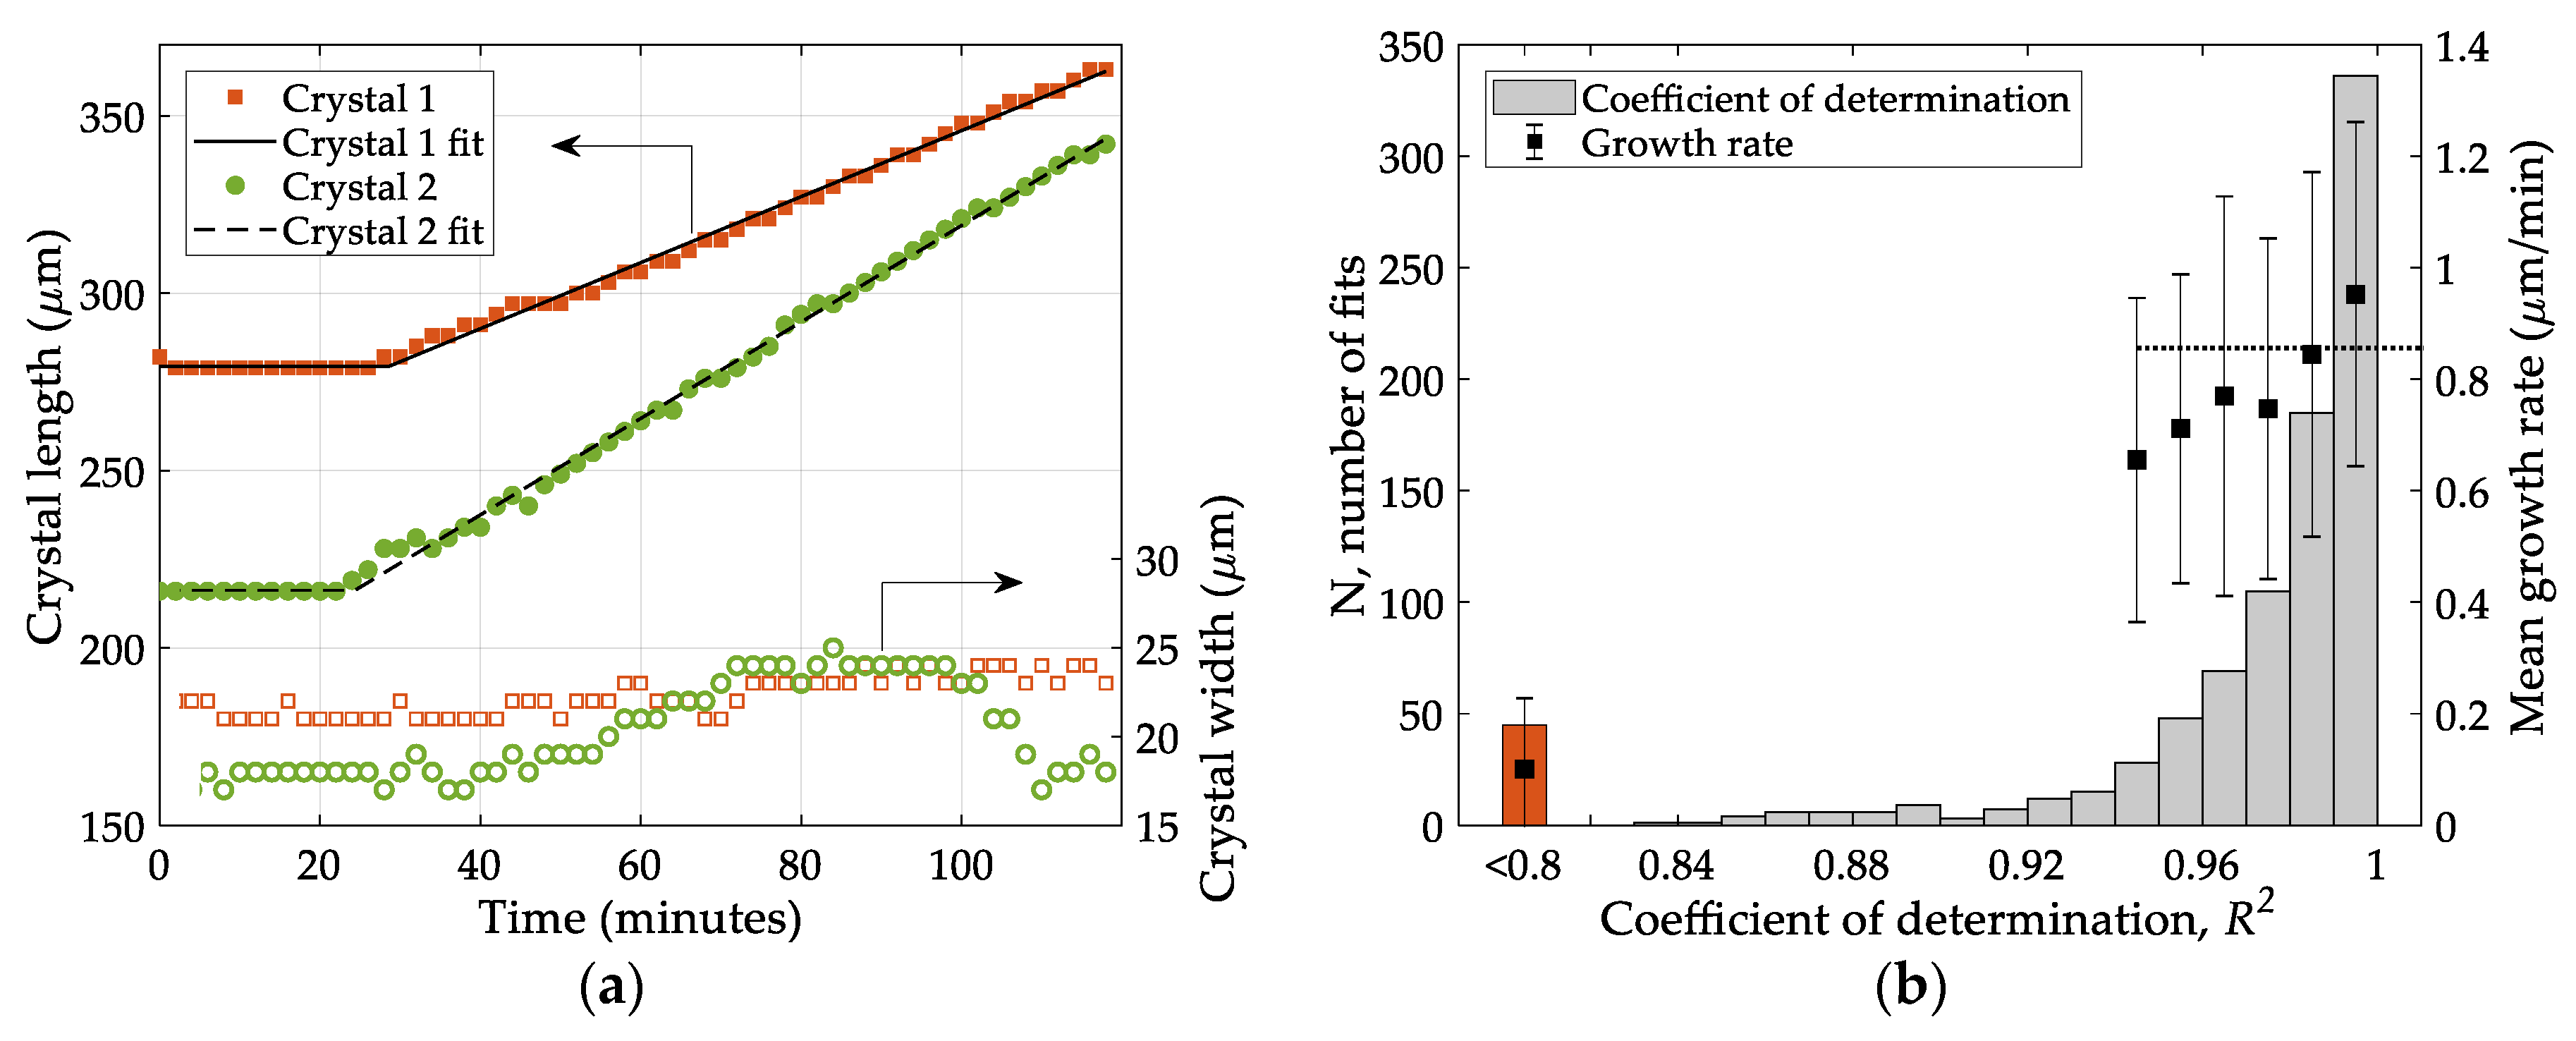
28]. The coefficient of determination, R2, is a measure of the amount of variance explained by the model. R2 will be close to unity when there is little noise (compared to signal) and the model has high predictive power; when there is significant noise (compared to signal) R2 will be close to zero regardless of the model. The root mean squared error, RMSE, measures the differences between estimated values and observed values, making it more robust against noise compared to R2. However, RMSE is scale dependent, and therefore is not used to compare an estimator’s predictions on different sets of observed values; rather it should be used to compare different estimator’s performance on a single set of observed values. A t-test can be used to assess if the means of two sets of data are significantly different, given that the means come from a normally distributed population. Spearman’s rho, ρS, is a rank correlation coefficient that assesses whether or not a monotonic (i.e., one-to-one) functional relationship exists between two variables. When ρS is zero, there is no monotonic relationship between the variables and when ρS is unity, there is a perfect monotonic relationship; a t-test can be used to determine if ρS is significantly different from zero, thus assessing the significance of the correlation between two variables. Finally, the results are reported as 95% confidence intervals, meaning that if the study was repeated multiple times on different sample crystals, 95% of the calculated confidence intervals would cover the true value. Higher confidence levels will give larger confidence interval widths, 95% confidence is common and was therefore chosen to be the level used in this study.

3. Results

3.1. Growth rate dispersion at the population level

Previous studies on growth rate dispersion have predominately focused on changes in the crystal size distribution that could not be explained by nucleation or growth. The evolution of the CSD was examined in this study as well to enable simple comparison to past studies. Figure 2a shows how the CSD widened over the course of 2 h, in this case for the experiments with an initial loading of 0.03 grams. Lognormal fits to the initial and 2-h CSD are included. A Lilliefors statistical test, which tests for normality without prior knowledge of the mean or standard deviation, failed to reject the null hypothesis that the log-transformed CSDs came from a normally distributed population at the 99% confidence level. Figure 2b shows the cumulative distribution of growth rates from the same loading (0.03 grams, the combined results from 10 repetitions of the same experiment) and a normal distribution for reference. Here, a Lilliefors statistical test failed to reject the null hypothesis that the growth rate distribution came from a normally distributed population at the 99% confidence level. This is consistent with the central limit theorem which suggests the growth rates should be distributed normally, given that the growth rate is the combination of many distinct processes (such as bulk diffusion, surface diffusion, and solute attachment), each of which may be randomly, but not necessarily normally, distributed.

3.2. Growth rate dispersion at the individual level

The growth of a single crystal was described by the piecewise equation below, where tcr is the time required for a critical supersaturation to be generated, Linit is the length of the initial crystal, and G is the growth rate after reaching the critical supersaturation.
L = { L i n i t 0 < t t c r L i n i t + G ( t t c r ) t > t c r
Figure 3a shows the result of fitting two crystals, both from the same experiment under the same conditions, to Equation (1). At the same time, the widths of the crystals, also shown in Figure 3a, follow no obvious trend; the challenge of measuring the width is illustrated by ‘Crystal 2’ apparently widening and then thinning between 50 and 110 min. For ‘Crystal 2,’ the aberrant widening appears to be the result of a change in the optical properties of the crystal surface. Initially the surface is rough and opaque, the surface smoothens and becomes transparent during growth, but surface healing is not uniform in time or space. Here, the transient optical behavior led to an apparent increase in crystal width, which then appeared to thin as the optical properties became more uniform across the crystal.
Equation (1) fits the data remarkably well; Figure 3b shows an analysis of the goodness of fit for the entire data set in the form of a histogram of coefficient of determination values (R2). Of the crystals examined (i.e., did not grow end-to-end or out of frame), 84% have R2 > 0.95 (the five rightmost bins), but there is a significant population with low R2, indicated by the leftmost, red bin in Figure 3b. On the right-hand axis of Figure 3b, the mean and one standard deviation of the growth rates for all the crystals in that R2 bin are shown, the slow mean growth rate for the poorly fit crystals explains why the R2 is small. R2 measures the amount of variance explained by the model; when the growth rate is zero, none of the variance in length can be explained by growth, rather signal noise dominates, and R2 = 0. Other measures of goodness of fit, such as RMSE, are not skewed by low growth rate, but RMSE is not scale invariant and will indicate a worse fit for a large crystal than a small crystal with the same R2.
Upon close inspection of Figure 3a the model does not capture the transition from no growth to growth with perfect accuracy. In many crystals, an initial burst of growth occurs when the ends of the initial crystals (which have been blunted by breakage during solids handling) grow into facets (the equilibrium shape). Figure 1 shows blunt-ended crystals initially, and pointed growing crystals later. The accelerated initial growth can be seen in Figure 3a, particularly for ‘Crystal 2’, which also shows that the initially smaller crystal grows faster. However, this trend is not found when all crystals are viewed in aggregate. The growth rate does not increase with time as might be expected in a system with size-dependent growth (SDG) or randomly fluctuate as would be expected with random fluctuations (RF).
In considering all crystals, the growth rate shows a large amount of variation. Figure 4 shows the growth rate of crystals versus the initial length for five different initial loadings, and a linear regression has an R2 = 0.07, indicating the initial length explains very little of the observed variation in growth rate. The slope of the linear correlation between Linit and G is positive, with a 95% confidence interval of 0.9 × 10⁻³ to 1.4 × 10⁻³, demonstrating that longer initial crystals do in fact grow faster, as is expected with the size dependent and constant crystal growth models. Breakage of the initial crystals can explain the weakness of the correlation between Linit and G, assuming that broken crystals inherit their parent’s intrinsic growth rate, but it does not account for the large scatter of growth rates. Rather, in the constant crystal growth model the dispersion of growth rates is attributed to intrinsic properties of individual crystals, not any easily measured quality like length.
The normalized empirical histogram of the growth rates is shown next to the y-axis and the normalized empirical histogram of the initial lengths is shown beneath the x-axis. The distributions are divided between five initial loadings; it can be seen that the highest loading (shown in purple) had the largest population of small crystals initially and lowest average growth rate, while the smallest loading (shown in red) had a wider distribution of crystal lengths initially and the fastest average growth rate.

4. Discussion

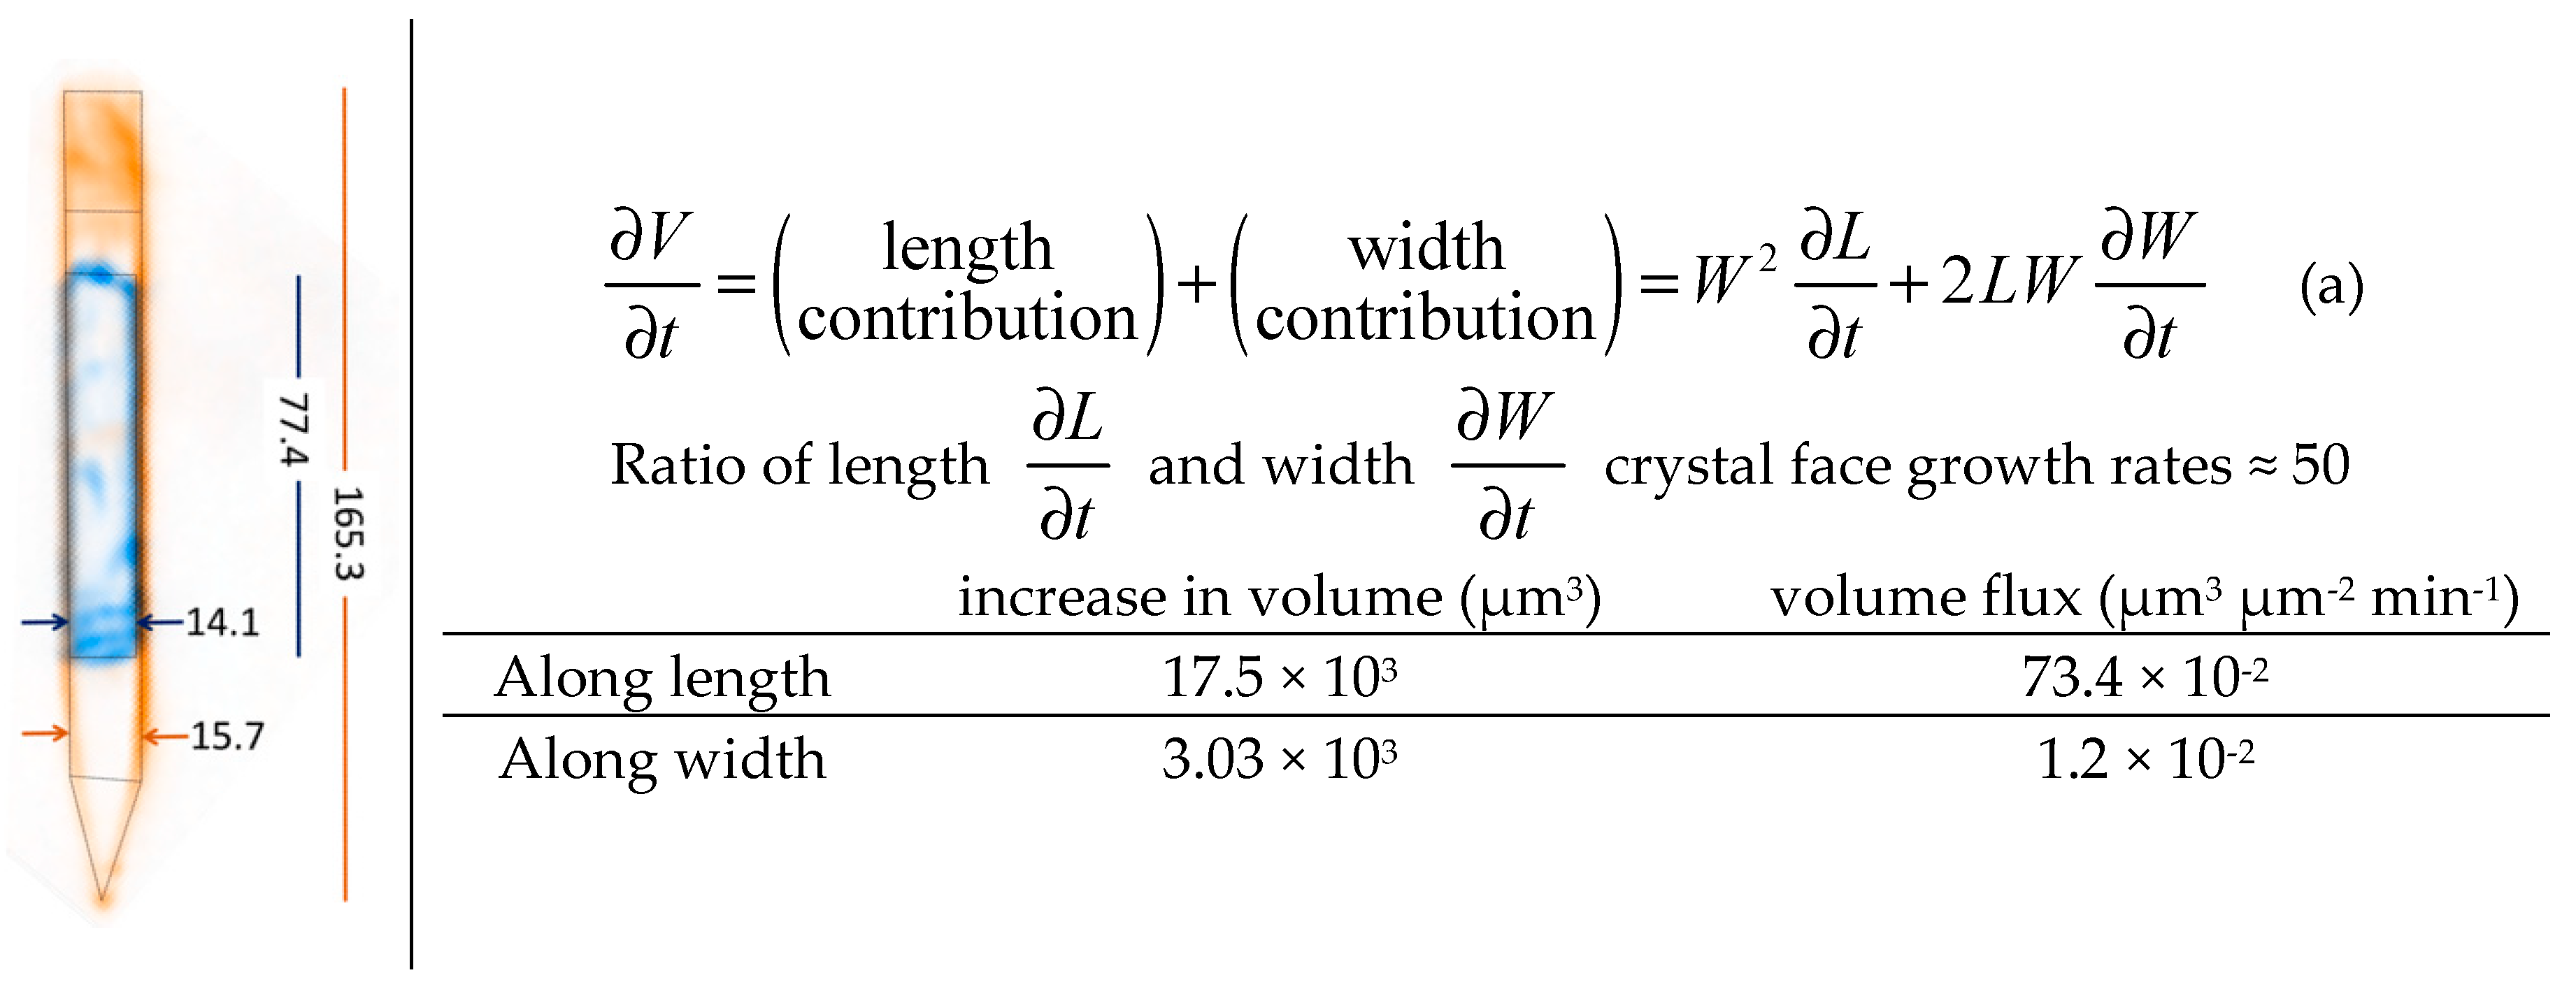
Over the course of 2 h, the mean crystal width increased from 18.9 μm to 21.5 μm. This change in width corresponds to an increase of approximately two pixels. All measurements are discretized by the camera making it impossible to measure accurate width trends for individual crystals, but for the population the two pixel change in width is significant at the 99% confidence level. As the width change is so small, it is assumed most of the growth occurs at the ends of the needles. Equation (2) characterizes the rate of accumulation of dissolved ampicillin c as solute is generated by the reaction R and consumed by the ends of the crystals.
d c d t = R ρ A G
where ρ is the density of the crystal, A is cross-sectional area of the crystal, and G is growth rate of the crystal.
Shortly after the critical time, 
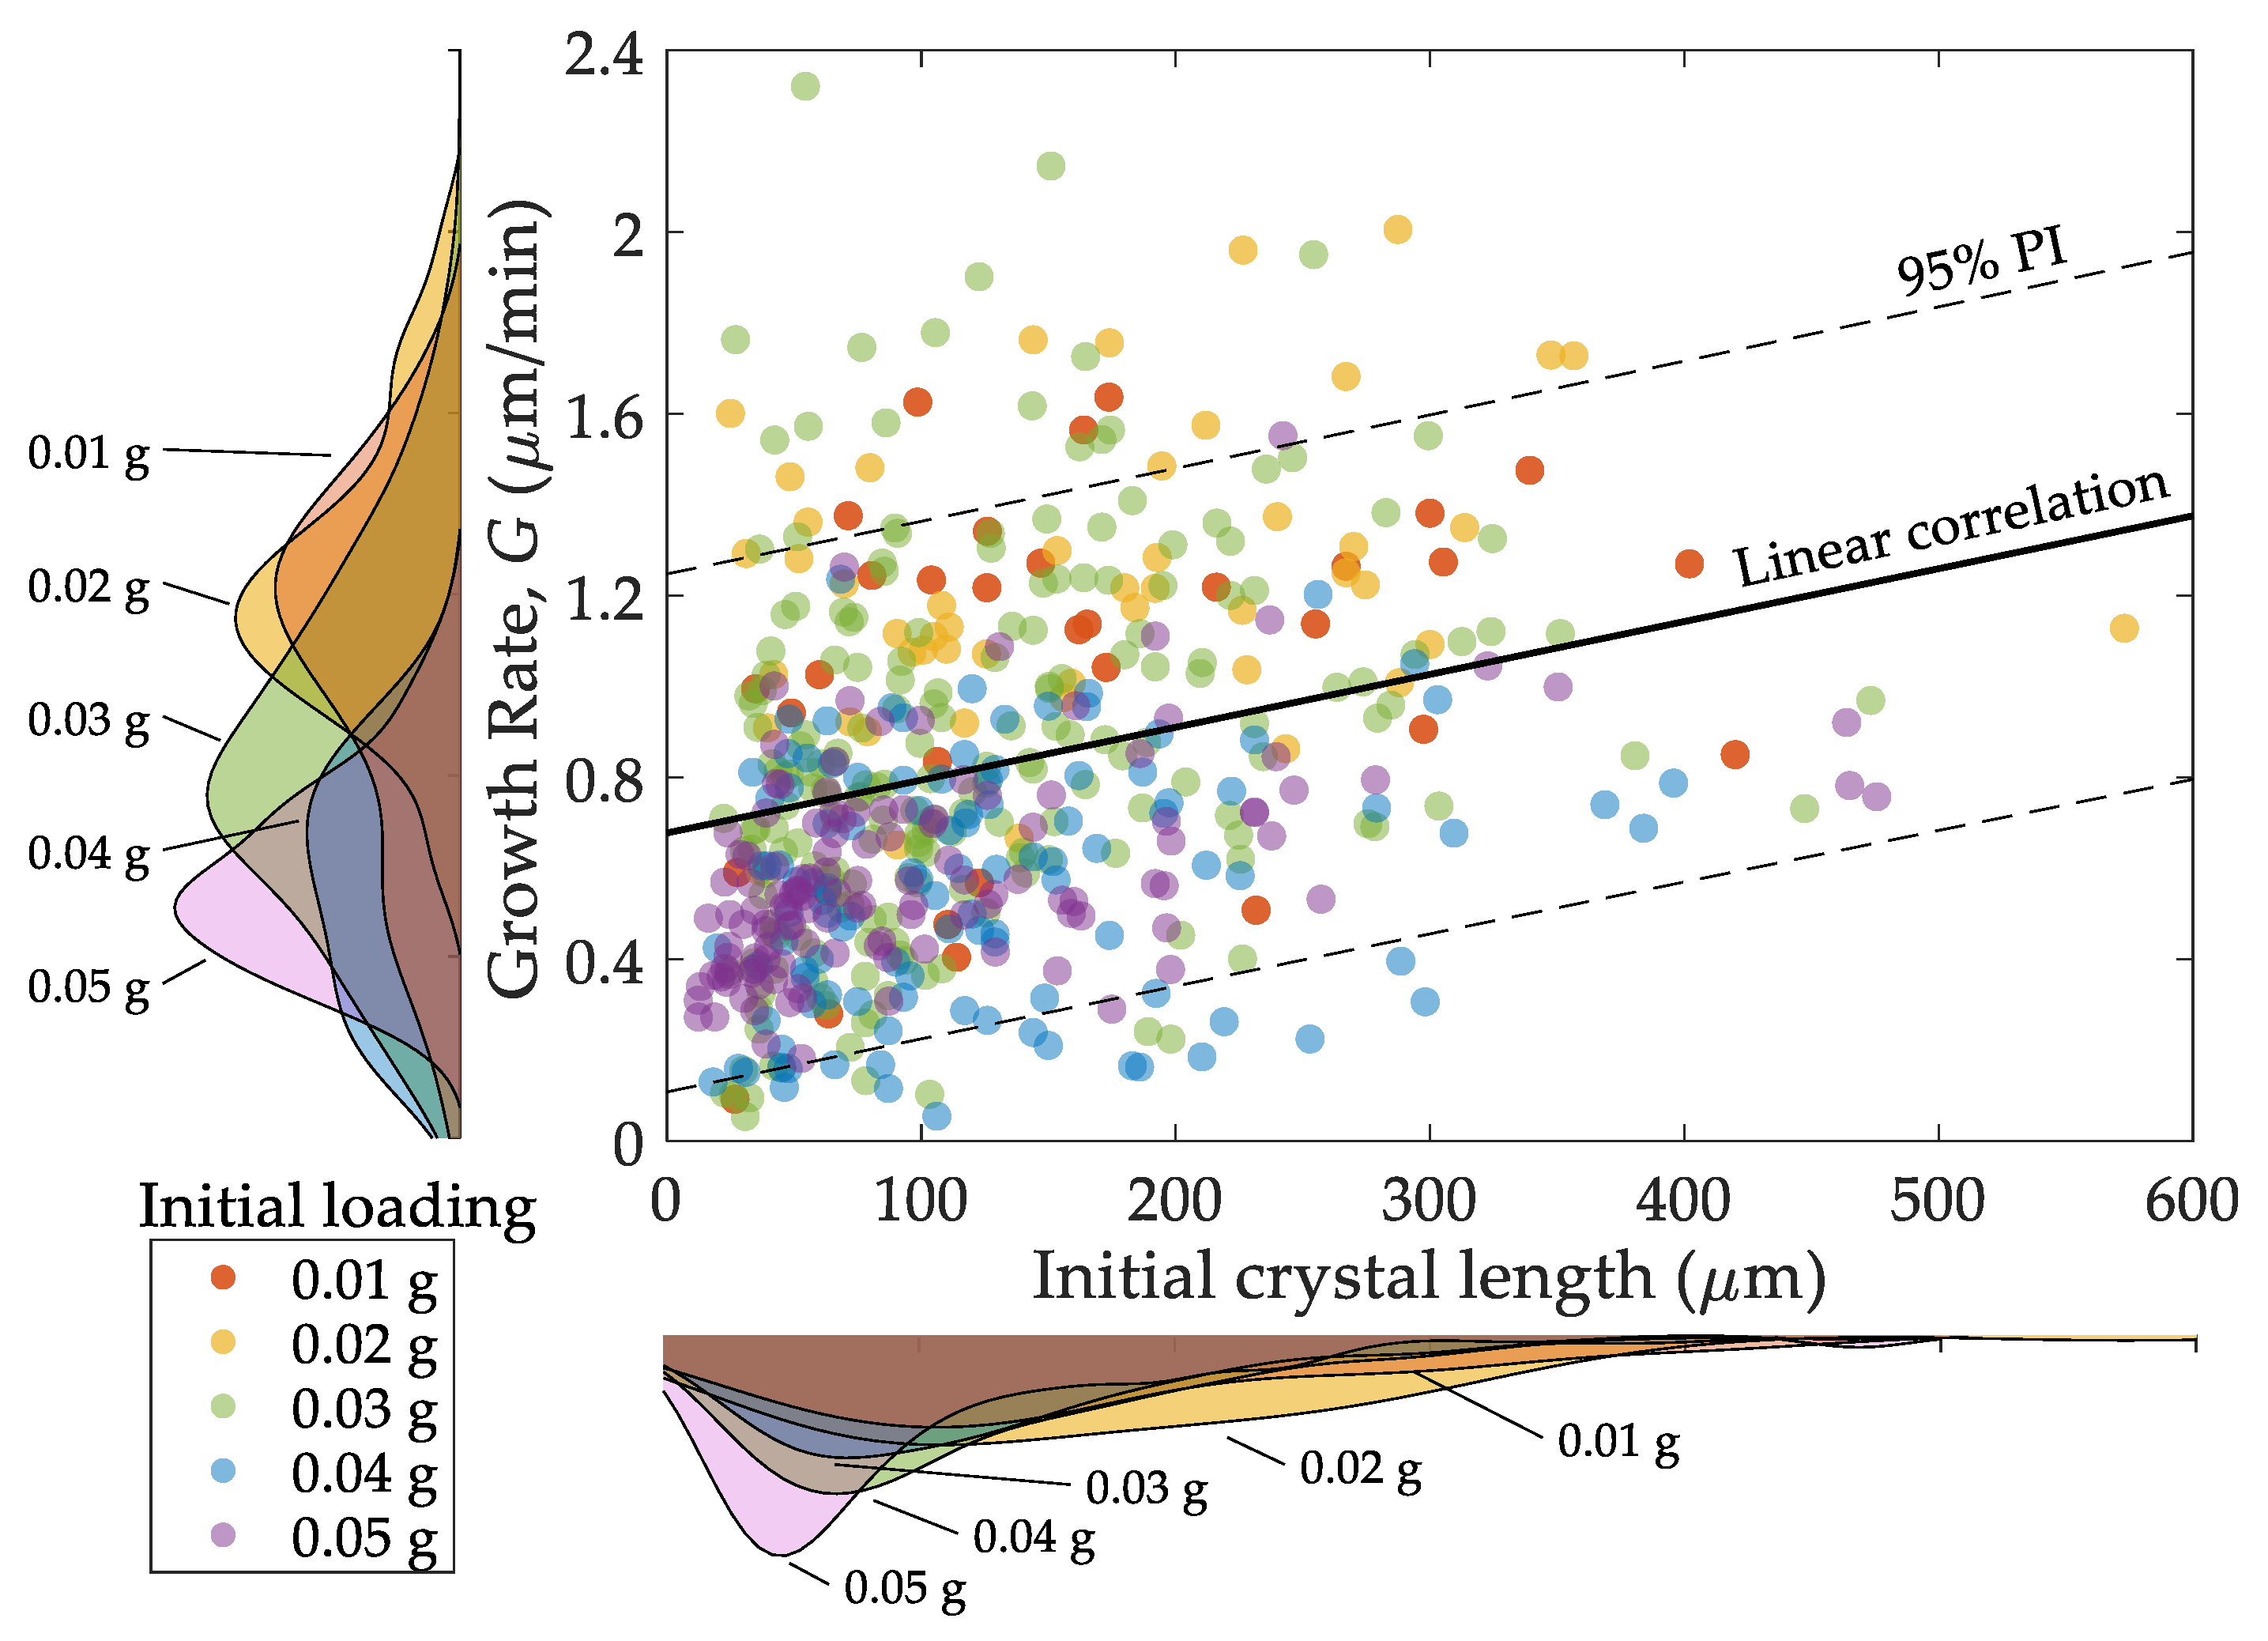
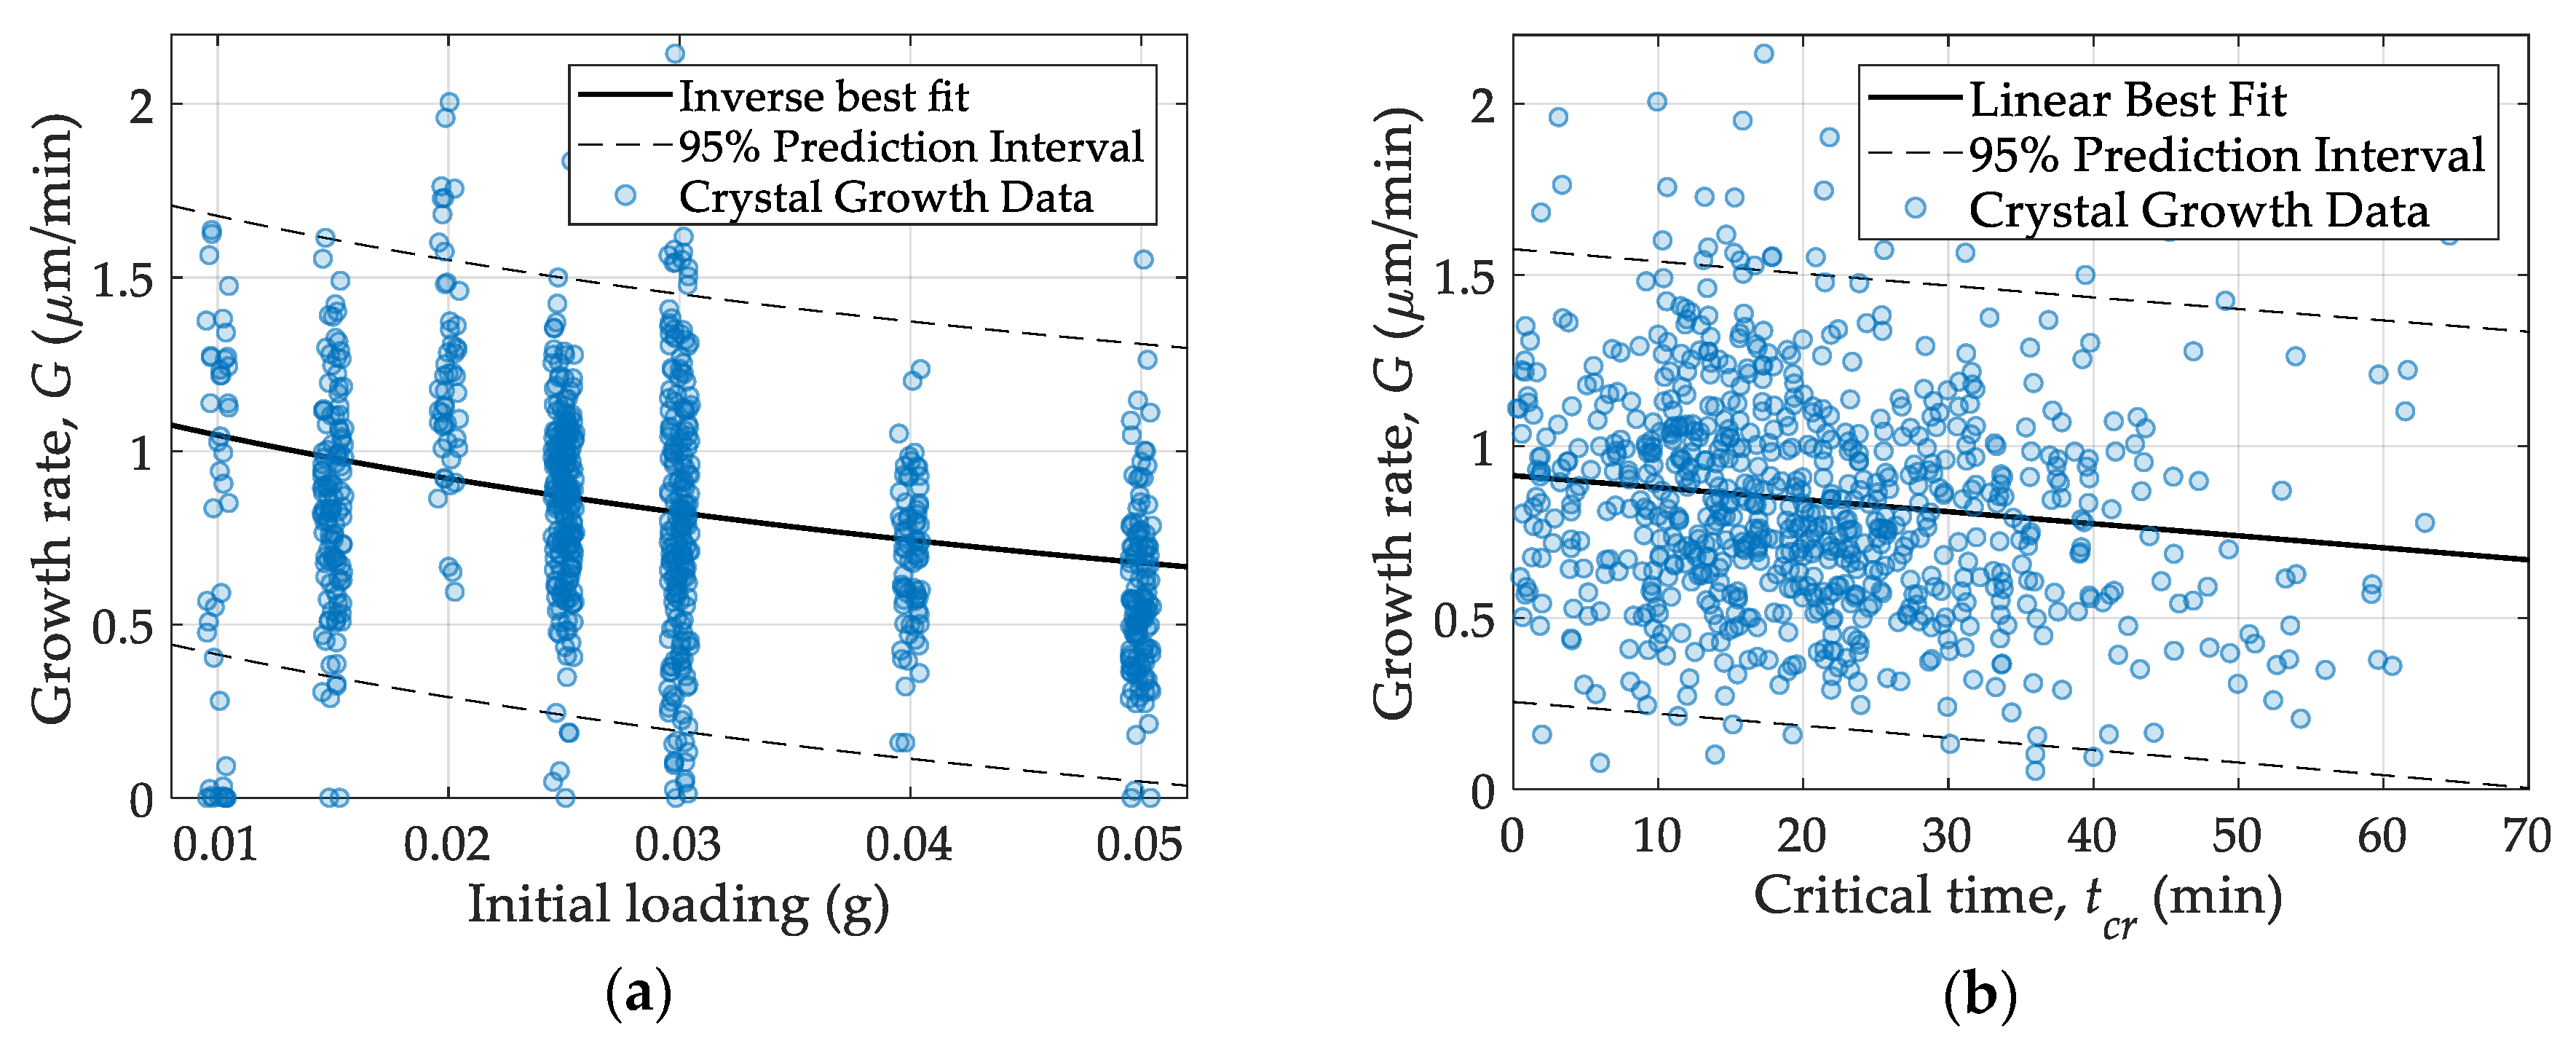
tcr, the linear increase in length over time suggests that the concentration reaches a pseudo steady state such that the left-hand side of Equation (2) goes to zero. As the reaction rate is constant across experiments, the product of area and growth rate must be constant. At higher loadings there is more area, therefore, one expects to observe a decrease in growth rate. The relationship between area and initial loading is not obvious. At a loading of 0.01 g, 57% of the initial crystal mass dissolved during the initial dissolution step to form a saturated solution (see Methods). Many small crystals may have dissolved entirely, leaving mostly large crystals, evidenced by the broader distribution of initial sizes in Figure 4. At a loading of 0.05 g, only 11% of the initial crystal mass dissolved. Less dissolution of each crystal was required to saturate the solution; many of the small crystals that would have entirely dissolved in the 0.01 g loading were observable in the growth phase of the 0.05 g loading experiments.
Figure 5a shows that the growth rate is negatively correlated with the initial loading, but that initial loading is a poor predictor for growth rate given the large scatter in the data and the low R2 = 0.10. The 95% prediction interval given by the dashed curves are correspondingly wide to capture the variance in the growth rate. It is also possible that the simple hyperbolic relationship, G = a / ( x + b ) , may not be appropriate for the aforementioned reasons.
There also exists a weak but statistically significant (at the 95% confidence level) correlation between critical time and growth rate. Longer critical times are correlated with slower growth rates, independent of initial loading, as can be seen in Figure 5b where the 95% confidence interval on the slope is −8.1 × 10⁻³ to −5.9 × 10⁻³. There is evidence that the presence of other species, in this case the reactants 6-APA and PGME, can inhibit the growth of ampicillin crystals [29,30], which may lead to lack of growth below a critical supersaturation. The lack of growth is postulated to arise from the other species adsorbing to the edge of growth steps and preventing the step from advancing; halting the layer-by-layer growth mechanism [31,32,33]. The advance of edges along the length of the crystal is visible on some crystals in the videos provided with the Supplemental Material, although to be visible at this magnification they must be groups or bunches of growth steps.
Again, the scatter in the data is large, R2 = 0.15, making critical time only weakly predictive of growth rate, however both are affected by similar surface phenomena. An underlying property of the crystal surface could be affecting both growth rate and critical time but by different mechanisms, resulting in the observed correlation and providing evidence that the distribution of growth rates results from a distribution of crystal properties (the spacing of the adsorbed species on the edge of advancing growth steps determines the critical supersaturation required to overcome the impinging adsorbed molecule [31]). The distance between adsorbed molecules on the edge should follow a geometric distribution (assuming each adsorption site is identical), as the length and number of edges increases the probability of gaps between adsorbed molecules large enough to support growth also increases, even with the same fractional coverage of sites. Therefore, in this experimental procedure, crystals with longer growth step edges are expected to have shorter critical times and higher growth rates. Different numbers and arrangements of dislocations in the crystal can lead to different lengths of growth step edges as well as different growth rates [10,34].
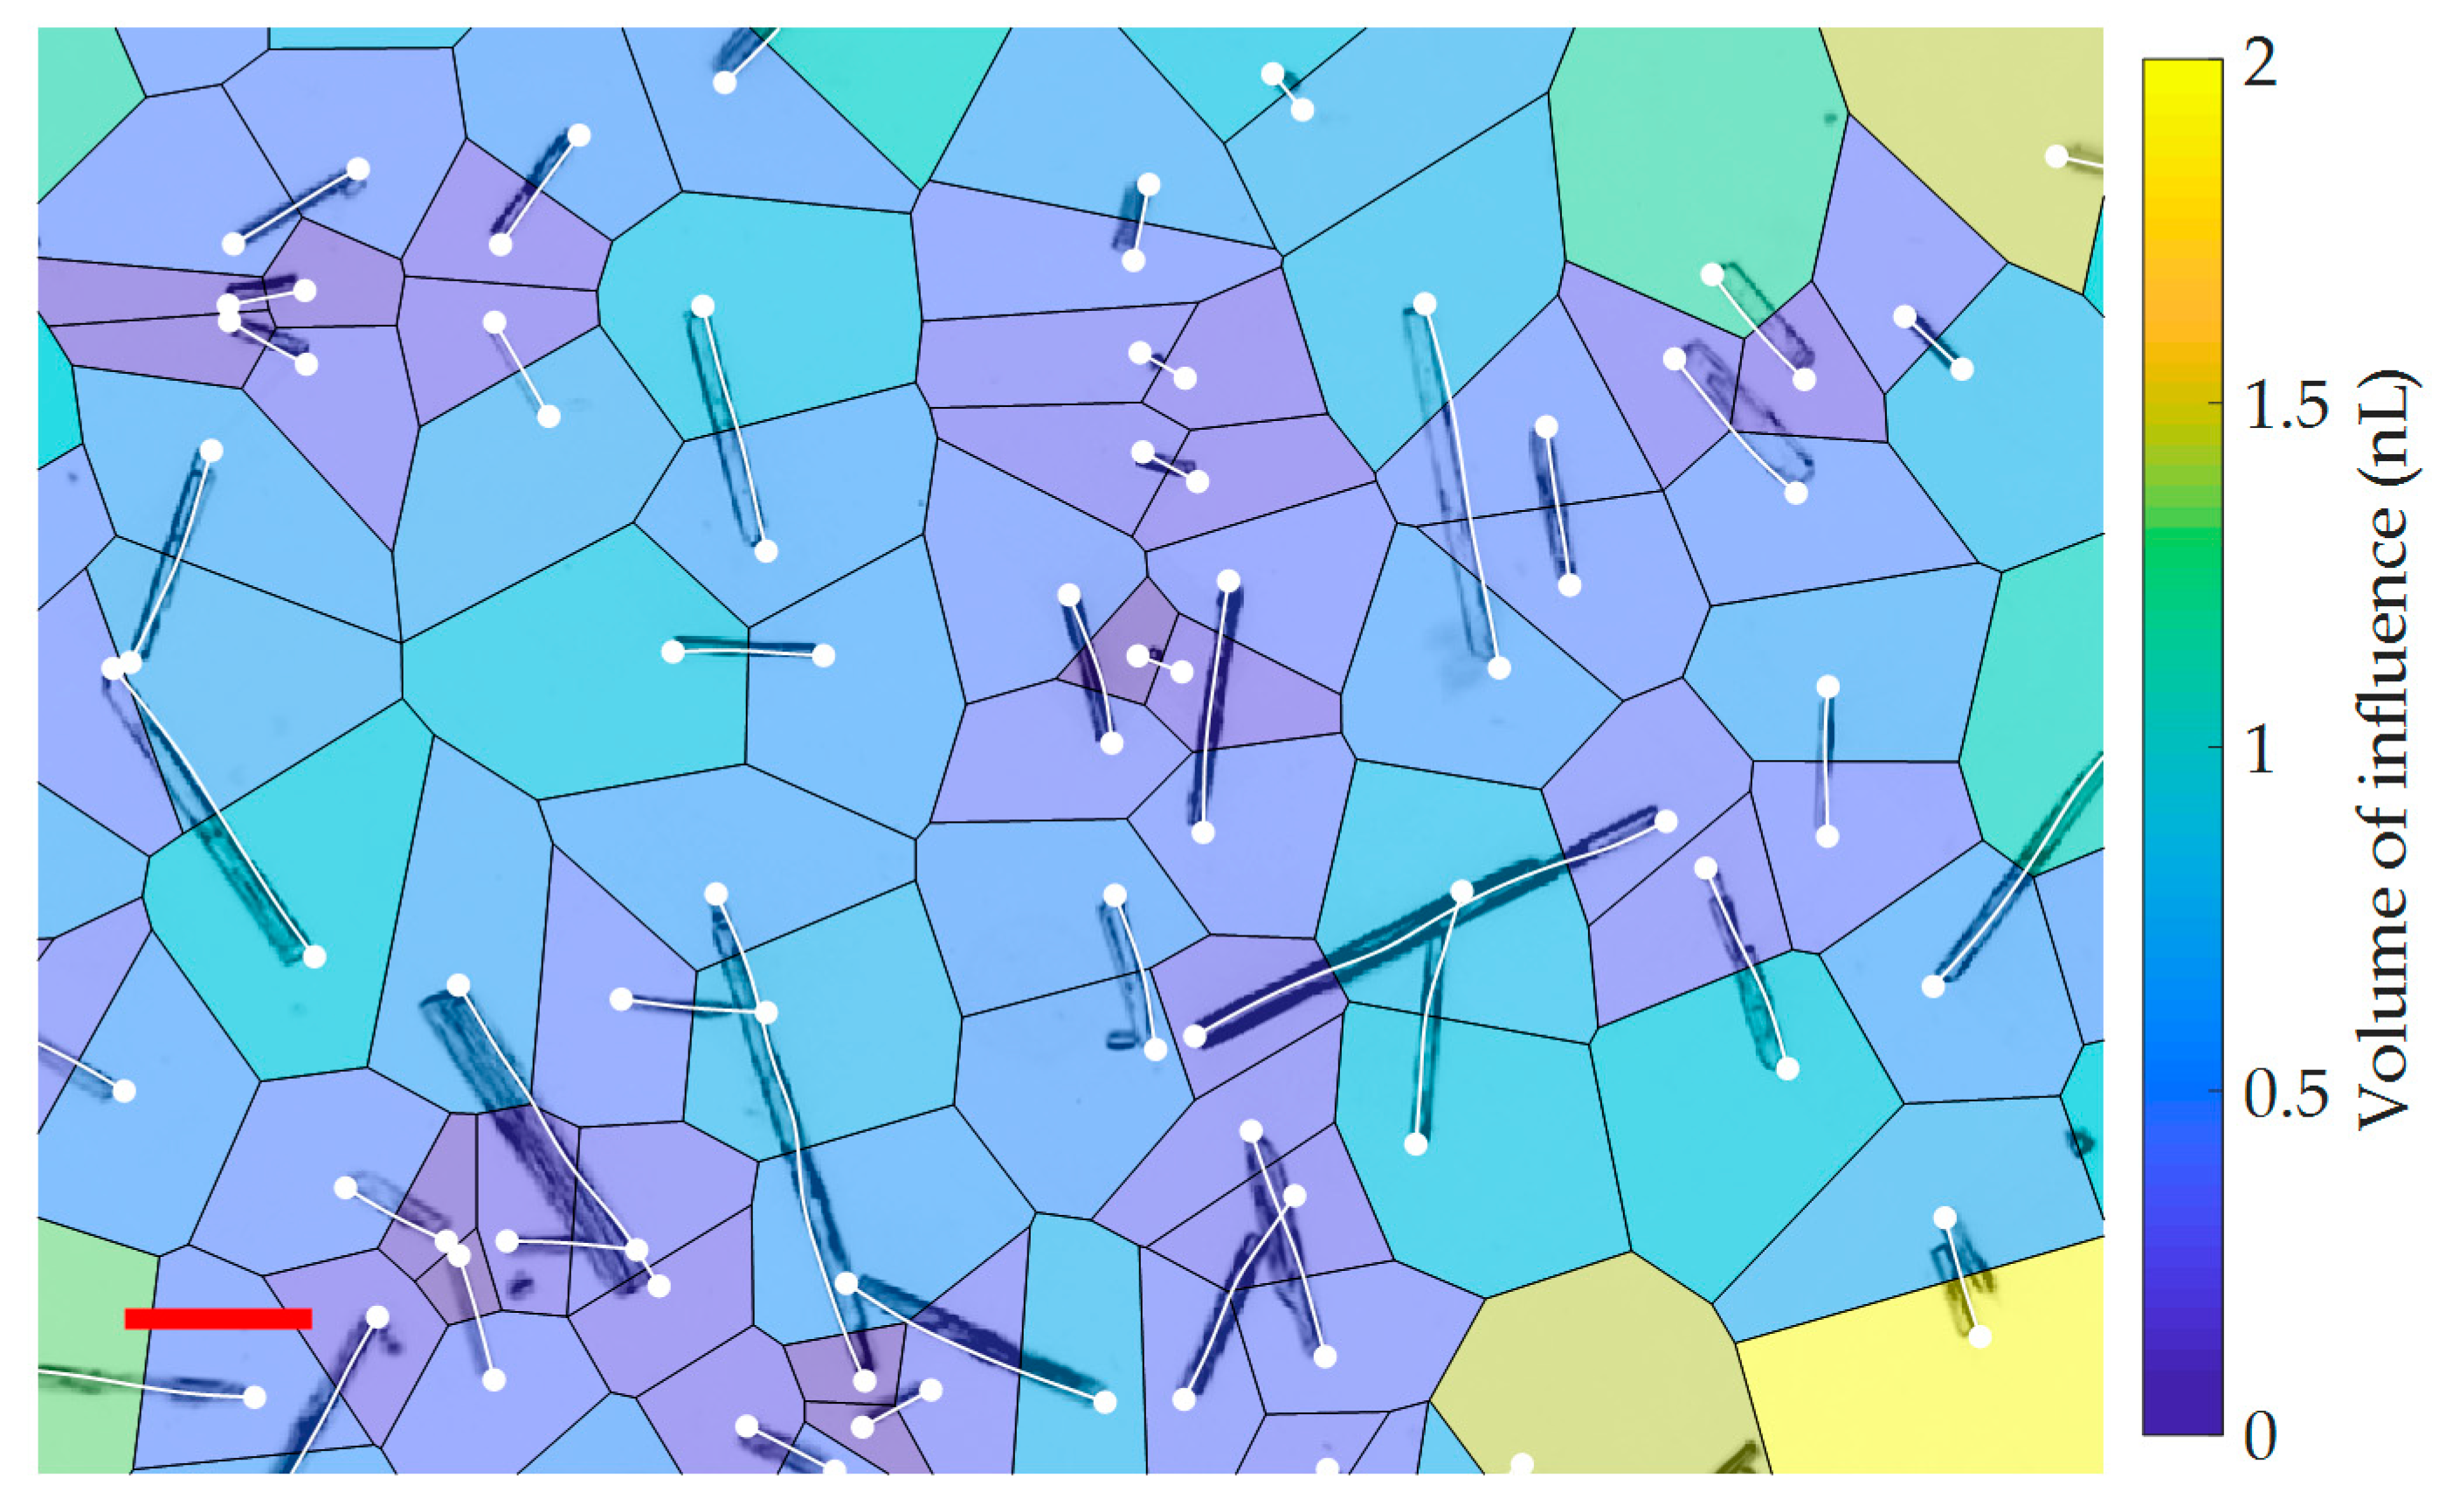
Finally, given that the system is not mixed, we considered whether the distribution of growth rates could be attributed to the slight differences in local supersaturation due to the random scattering of crystals. For this analysis, we continued to assume that growth occurs predominately at the ends of the crystals, such that only the ends of the crystals act as a sink for ampicillin generated in the bulk (see Appendix B for analysis of this assumption). It was also assumed that there is no bulk flow and that the height dimension is insignificant (sampled volumes measure 1290 × 967 × 43 microns L × W × H). With these assumptions, the images can be divided into areas such that each area contains a single growing crystal end that is the only sink for dissolved ampicillin in that area. Figure 6 shows how one such image was divided.
As the reaction rate is the same throughout the bulk and if GRD is the result of the random placement of crystals only, the growth rate of each crystal should be correlated with the area over which that crystal serves as the dissolved ampicillin sink (controlled for the growing area of the sink). Instead, no correlation was found between the area of influence and the growth rate. 
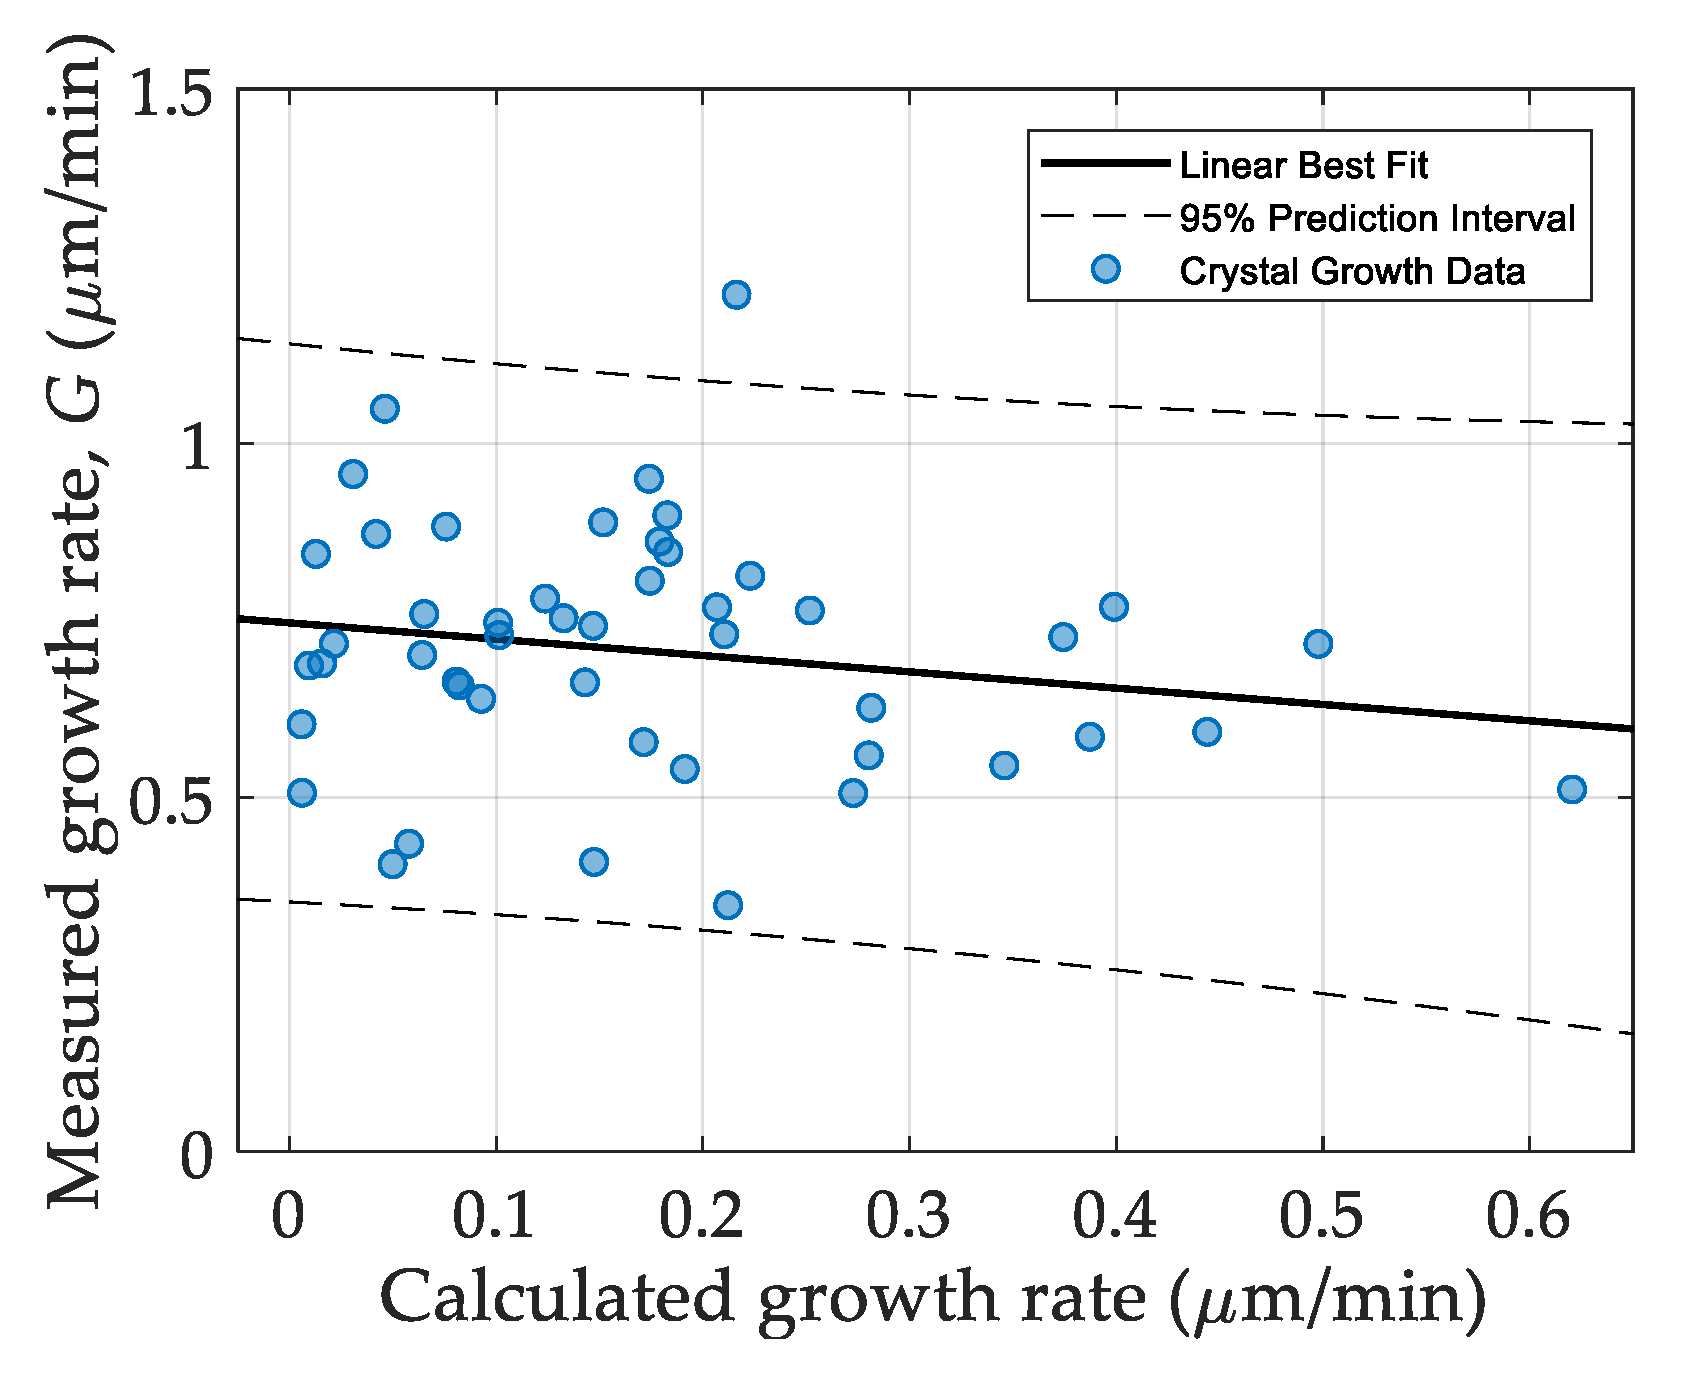
Figure 7 shows the expected growth rate (see Appendix C for details of calculation) versus the measured growth rate for the experiment shown in Figure 6. The calculation under-predicts the growth rate, likely because the width is overestimated during the image analysis. It is visually obvious that the data are not correlated, with a 95% confidence interval on the slope ranging from −0.50 to 0.99, indicating no linear relationship (Spearman’s rho indicates no one-to-one relationship, linear or otherwise). No correlation was found when the same analysis was applied to other experiments not shown in Figure 6. To describe the growth rate of an individual crystal requires knowledge of the collective system properties (i.e., supersaturation, temperature, etc.) and intrinsic crystal properties (dislocation frequency, surface features). While many correlations exist and can partly be explained by system properties, the large scatter in the data are in line with the constant crystal growth model where GRD is explained in terms of intrinsic crystal properties.
Previous studies have incorporated a distribution of growth rates into a population balance model to examine the effect of GRD on the CSD from a continuous crystallizer [22]. The population density function, n, from a mixed-suspension, mixed-product removal (MSMPR) crystallizer is given by
n ( L ) = B o 0 G f ( G ) d G 0 f ( G ) exp ( L G τ ) d G
where Bo is the nucleation rate, f(G) is the probability density function describing the growth rates of nuclei, and τ is the mean residence time of the MSMPR. To compare CSDs, it is assumed that the rate of generation of crystals, given by the suspension density MT divided by the residence time, is the same in systems following the ΔL law and systems exhibiting GRD. MT is defined by
M T = B o k v 0 L 3 n ( L ) d L
where kv is a volumetric shape factor. With Equation (4) the nucleation rate could be adjusted to ensure the same rate of crystal generation in any crystallizer. It was shown in 
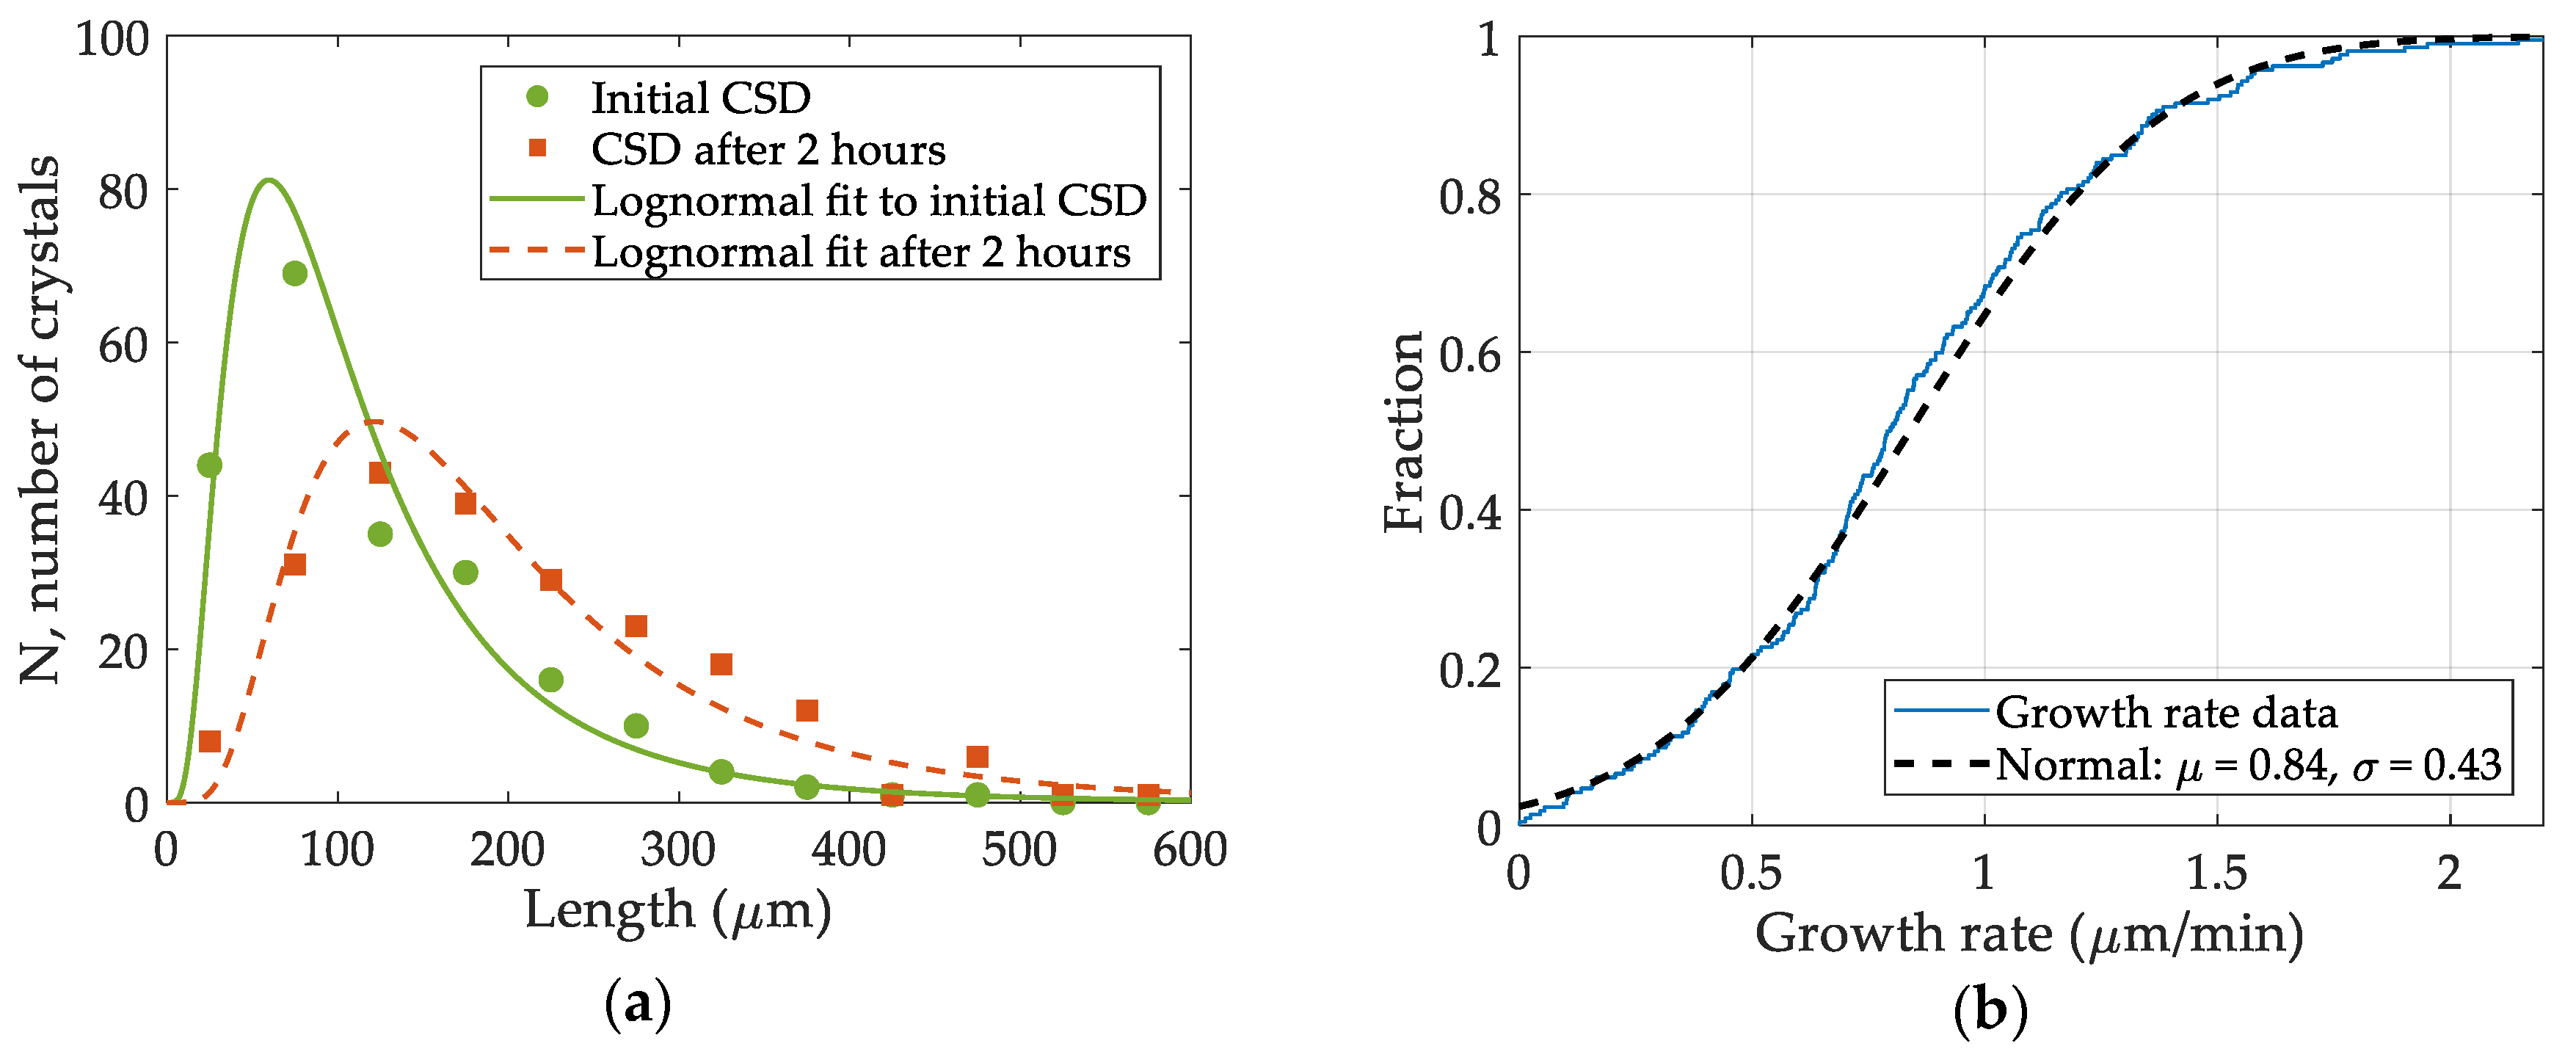
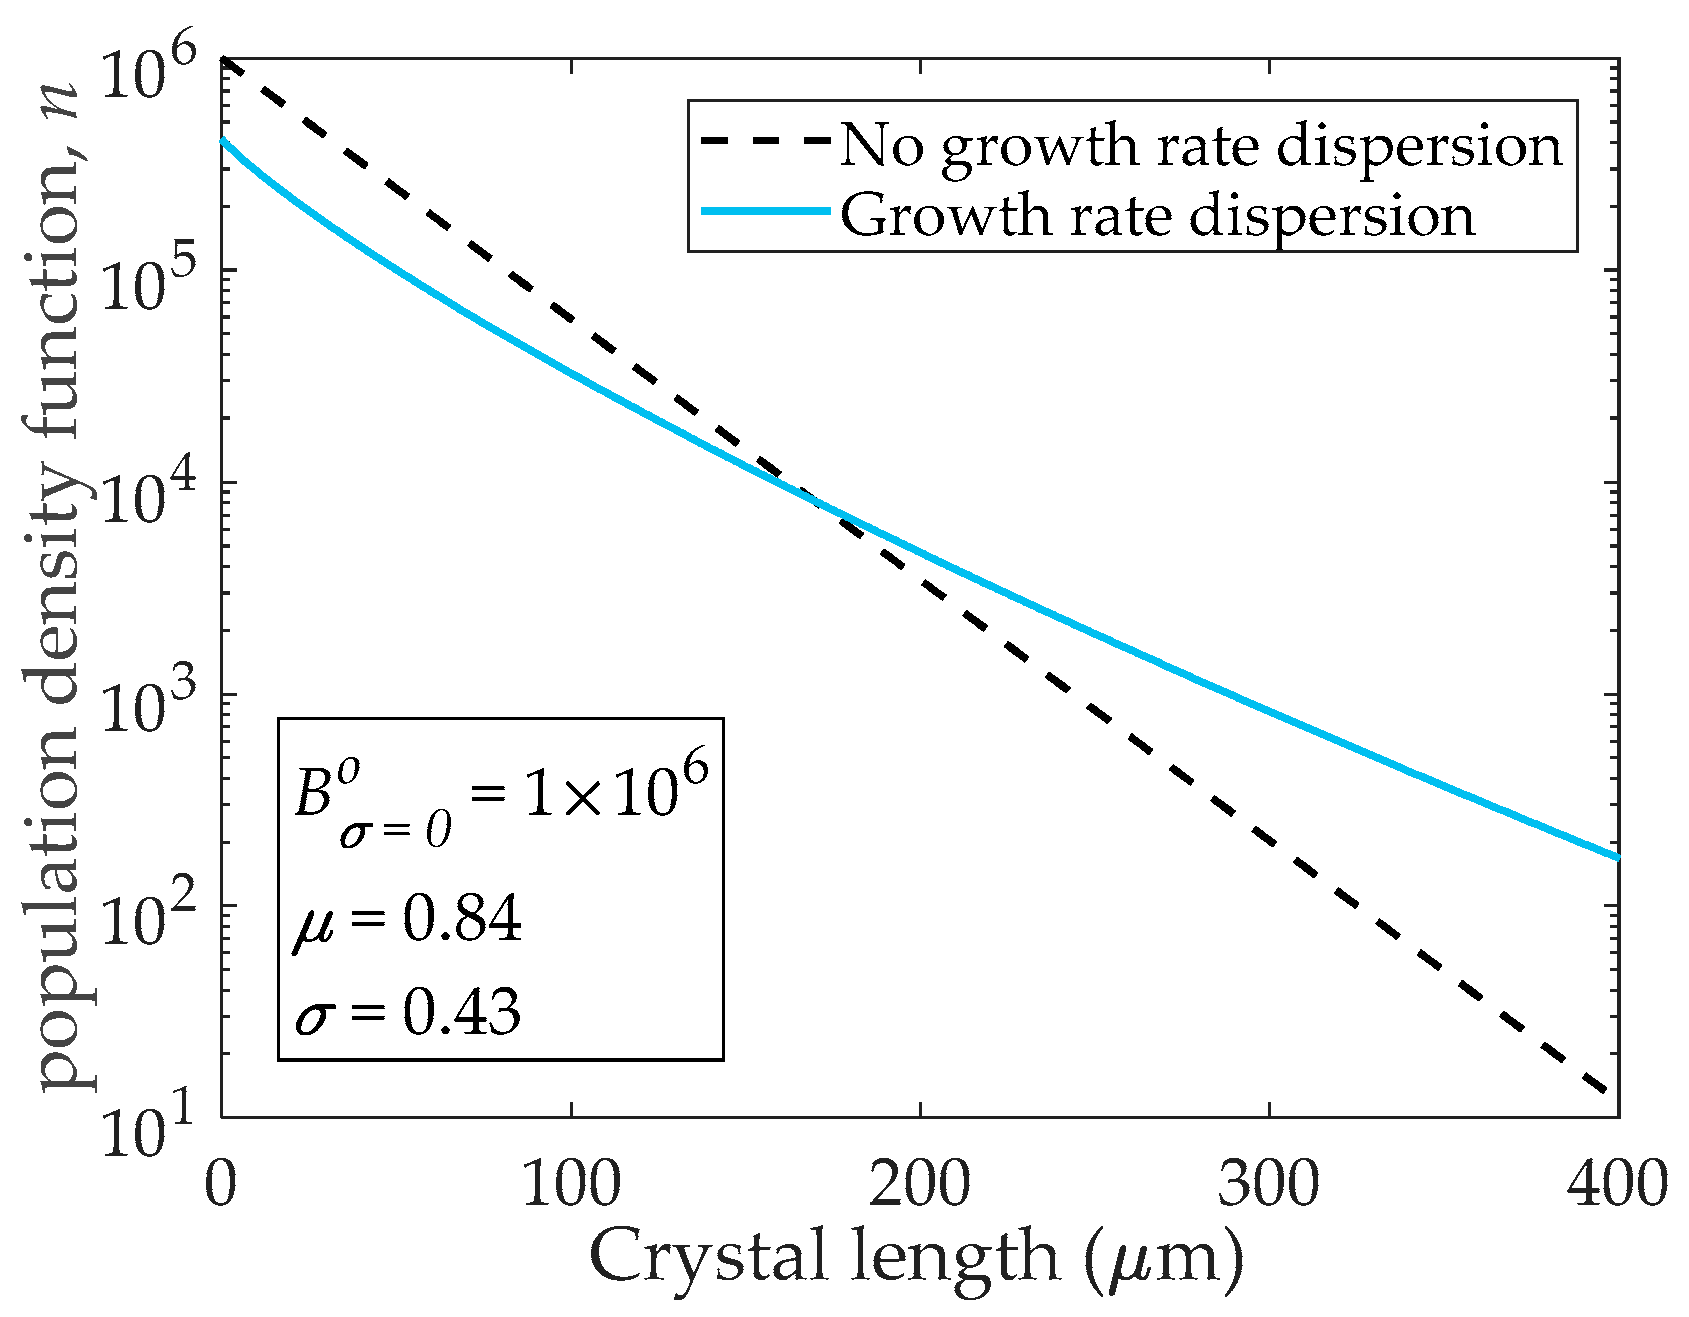
Figure 2b that the growth rates of the crystals follow a normal distribution, with a mean μ = 0.84 μm/min and σ = 0.43 μm/min, and it is assumed that this distribution is appropriate for the nuclei in the MSMPR exhibiting GRD, f(G). Using these results, an MSMPR producing ampicillin by the PGA-catalyzed reactive crystallization was modeled. A residence time of 42 min has previously been shown to optimize yield while meeting purity constraints, therefore τ = 42 was used in the model [35]. Figure 8 shows the population density function of the crystals produced by an MSMPR following the ΔL law (no GRD, σ = 0) and an MSMPR with GRD. With GRD, the population density function becomes skewed towards larger crystals compared to the ΔL law growth rate; there are an order of magnitude more crystals at 400 μm length with GRD than without GRD. Such a substantial increase in large crystals could require a further processing step, such as grinding, if the process were designed to meet product size specifications with the assumption that the growth rates of all crystals are the same.

5. Conclusions

Growth rate dispersion of ampicillin trihydrate crystals was directly observed. The experimental design allowed many sources of potential differences in growth rate to be eliminated: isothermal conditions ruled out spatial differences in temperature and any Arrhenius dependence, homogeneous bulk phase ruled out mixing effects seen with anti-solvent crystallization and precipitation, quiescent conditions ruled out breakage, agglomeration, and nucleation as sources of irregularity in the CSD. Image analysis of individual crystals over time showed that the growth rate was linear and steady, ruling out the possibility of random fluctuations and size dependent growth, two theories previously advanced to explain unexpected widening of CSDs. Direct observation of growing crystals led to insight regarding the mechanism of growth rate dispersion that would not be possible with population-level measurements such as size distribution. Analysis of the spatial orientation of the crystals, in an unmixed environment, revealed that the magnitude of growth rate dispersion could not be explained by the random scattering of crystals. Therefore, we conclude that the dispersion of growth rates observed in ampicillin trihydrate crystallized in the presence of the precursors, 6-APA and PGME, is due to properties intrinsic to each individual crystal. The correlation of growth rates and critical times required for growth to begin suggests that the most important intrinsic property is total length of growth step edge, which will be influenced by number and arrangement of screw dislocations.

Supplementary Materials

The following are available online at https://www.mdpi.com/2227-9717/7/6/390/s1, Video S1–S3: GIFs of ampicillin trihydrate crystals growing under the described experimental conditions.

Author Contributions

Conceptualization, M.A.M.; methodology, M.A.M.; software, M.A.M.; formal analysis, M.A.M., A.S.B., M.A.G. and R.W.R.; writing—original draft preparation, M.A.M.; writing—review and editing, A.S.B., M.A.G. and R.W.R.

Funding

This research was funded by the FDA Center for Drug Evaluation and Research, grant number U01FD006484. M.A.M. also acknowledges funding from the Georgia Institute of Technology’s Specialty Separations Center and NSF/IUCRC Center for Pharmaceutical Development, grant number 1540017. SEM was performed at the Georgia Tech Institute for Electronics and Nanotechnology, a member of the National Nanotechnology Coordinated Infrastructure, which is supported by the National Science Foundation (Grant ECCS-1542174).

Acknowledgments

The authors would like to acknowledge Nils Persson for help with image analysis, Grant Marshall for assistance with data collection, and Krysten Minnici for help with electron microscopy.

Conflicts of Interest

The authors declare no conflict of interest.

Appendix A

Field emission scanning electron microscope images of ampicillin trihydrate initial crystals were obtained using a Zeiss Ultra-60 FE-SEM with an accelerating voltage of 3 kV using the high vacuum mode at room temperature. Samples were gold-sputtered for 30 seconds using a Hummer 6 Gold Sputterer to give an approximate thickness of 5 nm.
Figure A1. FE-SEM images of ampicillin trihydrate initial crystals. The scale bar is 30 μm in (a) and 2 μm in (bf). Image (a) shows uniformity of initial crystals, (b) shows a fracture and splinter of an initial crystal, (c,d) show epitaxial growth and possibly twinning, (e,f) show ends of initial crystals. In (e) the end has several visible growth steps, in (f) two ends are shown, one pristine pointed end with few growth steps, the other a clean break.
Processes 07 00390 g0a1

Appendix B

Figure A2. The initial and final frame from a growth experiment are overlaid, with the initial crystals in blue and the final crystals in orange (there complete overlap makes black). The * indicates the crystal examined in detail in Figure A3.
Processes 07 00390 g0a2
As can be seen in Figure A2, the crystals do not appreciably grow in the width direction, but they do extend significantly in the length direction. Because of a small amount of movement between frames, the crystals do not always completely align between the start and end of the experiment, however the image analysis protocol accounts for this movement. In the examination of how the random placement of initial crystals could impact the distribution of crystal growth rates, it was assumed that the change in volume occurred predominately through the ends of the crystals and that the flux of solute to the end of the crystal was greater than the flux to the sides of the crystal. A detailed analysis of the change in volume of an individual crystal is shown in Figure A3.
Figure A3. The crystal marked by the * in Figure A2 is shown on the left, with the edges drawn on and length and width (in μm) indicated for both the initial (blue) and final crystal (orange). The equation for change in volume over time is shown, showing how the volume change is proportional to the length and the width squared. The table shows the change in volume for the crystal at the left.
Processes 07 00390 g0a3
For the example crystal in Figure A3, the ratio of length and width face growth rates is approximately 50:1; by Figure A3a a crystal would need to have an aspect ratio (L:W) of 25 for the length and width growth to contribute to desupersaturation equally. Only 2 of the 887 examined crystals have an aspect ratio greater than 25 due to breakage of the initial crystals. Moreover, >75% of initial crystals have an aspect ratio <10, at which point the crystal widths account for less than 40% of the volumetric growth. Also, the flux to the different faces is proportional to the growth rate of that face, meaning if the length-face growth rate is 50-fold greater than the width-face growth rate, 50-fold more solute incorporates into the length-face than the width-face per unit area. The volume flux, defined in terms of crystal volume added (ΔV, μm3) per area of specific crystal face (A, μm2) per minute (Δt, min), occurs at the ends of the crystal. For the sample crystal in Figure A2 and Figure A3, the volume flux to the different faces is summarized in the table in Figure A3.

Appendix C

Calculation of the expected growth rate was based on the reaction rate of ampicillin synthesis under the experimental conditions, which had previously been reported [5]. The reaction rate, R, is 45 μmol/L/min under these conditions. The rate of new crystal generation per volume of influence (C, μm3/min/nL) is therefore
C = R ρ M W
where ρ is the density of ampicillin trihydrate (1.4 g/cm3) and MW is the molecular weight of ampicillin trihydrate (403.5 g/mol). C evaluates to 13 μm3/min/nL. Assuming growth normal to the needle axis consumes negligible ampicillin compared to growth along the needle axis, the linear growth rate per volume of influence (D, μm/min/nL) is found by normalizing C by the crystal cross-sectional area, A. The crystals only have two unique dimensions, a length (in the z-direction) and a width (in the x- and y-directions), with a square cross-section [36], therefore A can be approximated from the crystal widths (W) measured during image analysis.
D = C / W 2
Multiplying D by the volumes of influence in Figure 6 gives the calculated growth rate, Gcalc.

References

  1. Laxminarayan, R. Antibiotic effectiveness: Balancing conservation against innovation. Science 2014, 345, 1299–1301. [Google Scholar] [CrossRef] [PubMed] [Green Version]
  2. Gonçalves, L.R.B.; Sousa, R.; Fernandez-Lafuente, R.; Guisan, J.M.; Giordano, R.L.C.; Giordano, R.C. Enzymatic synthesis of amoxicillin: Avoiding limitations of the mechanistic approach for reaction kinetics. Biotechnol. Bioeng. 2002, 80, 622–631. [Google Scholar] [CrossRef] [PubMed]
  3. Illanes, A.; Wilson, L.; Corrotea, O.; Tavernini, L.; Zamorano, F.; Aguirre, C. Synthesis of cephalexin with immobilized penicillin acylase at very high substrate concentrations in fully aqueous medium. J. Mol. Catal. B Enzym. 2007, 47, 72–78. [Google Scholar] [CrossRef]
  4. Elander, R.P. Industrial production of β-lactam antibiotics. Appl. Microbiol. Biotechnol. 2003, 61, 385–392. [Google Scholar] [CrossRef] [PubMed]
  5. McDonald, M.A.; Bommarius, A.S.; Rousseau, R.W. Enzymatic reactive crystallization for improving ampicillin synthesis. Chem. Eng. Sci. 2017, 165, 81–88. [Google Scholar] [CrossRef]
  6. McCabe, W.L. Crystal growth in aqueous solutions1: I—Theory. Ind. Eng. Chem. 1929, 21, 30–33. [Google Scholar] [CrossRef]
  7. Ulrich, J. Growth rate dispersion—A review. Cryst. Res. Technol. 1989, 24, 249–257. [Google Scholar] [CrossRef]
  8. Girolami, M.W.; Rousseau, R.W. Size-dependent crystal growth—A manifestation of growth rate dispersion in the potassium alum-water system. AIChE J. 1985, 31, 1821–1828. [Google Scholar] [CrossRef]
  9. Randolph, A.D.; White, E.T. Modeling size dispersion in the prediction of crystal-size distribution. Chem. Eng. Sci. 1977, 32, 1067–1076. [Google Scholar] [CrossRef]
  10. Garside, J.; Ristić, R.I. Growth rate dispersion among adp crystals formed by primary nucleation. J. Cryst. Growth 1983, 61, 215–220. [Google Scholar] [CrossRef]
  11. Zumstein, R.C.; Rousseau, R.W. Anomalous growth of large and small copper sulfate pentahydrate crystals. Ind. Eng. Chem. Res. 1989, 28, 289–297. [Google Scholar] [CrossRef]
  12. Budz, J.; Jones, A.; Mullin, J. On the shape-size dependence of potassium sulfate crystals. Ind. Eng. Chem. Res. 1987, 26, 820–824. [Google Scholar] [CrossRef]
  13. Sahın, Ö.; Nusret Bulutcu, A. Effect of surface charge distribution on the crystal growth of sodium perborate tetrahydrate. J. Cryst. Growth 2002, 241, 471–480. [Google Scholar] [CrossRef]
  14. Botsaris, G.D.; Ersan Denk, G.; Shelden, R.A. Oscillating crystal growth rates. Kristall und Technik 1973, 8, 769–778. [Google Scholar] [CrossRef]
  15. Encarnación-Gómez, L.G.; Bommarius, A.S.; Rousseau, R.W. Reactive crystallization of β-lactam antibiotics: Strategies to enhance productivity and purity of ampicillin. React. Chem. Eng. 2016, 1, 321–329. [Google Scholar] [CrossRef]
  16. Woo, X.Y.; Tan, R.B.; Braatz, R.D. Modeling and computational fluid dynamics-population balance equation-micromixing simulation of impinging jet crystallizers. Cryst. Growth Des. 2009, 9, 156. [Google Scholar] [CrossRef]
  17. Tavare, N.S. Mixing in continuous crystallizers. AIChE J. 1986, 32, 705–732. [Google Scholar] [CrossRef]
  18. Maggioni, G.M.; Mazzotti, M. Modelling the stochastic behaviour of primary nucleation. Faraday Discuss. 2015, 179, 359–382. [Google Scholar] [CrossRef] [PubMed]
  19. Bobo, E.; Petit, S.; Coquerel, G. Growth rate dispersion at the single-crystal level. Chem. Eng. Technol. 2015, 38, 1011–1016. [Google Scholar] [CrossRef]
  20. Berglund, K.; Larson, M. Modeling of growth rate dispersion of citric acid monohydrate in continuous crystallizers. AIChE J. 1984, 30, 280–287. [Google Scholar] [CrossRef]
  21. Srisanga, S.; Flood, A.E.; Galbraith, S.C.; Rugmai, S.; Soontaranon, S.; Ulrich, J. Crystal growth rate dispersion versus size-dependent crystal growth: Appropriate modeling for crystallization processes. Cryst. Growth Des. 2015, 15, 2330–2336. [Google Scholar] [CrossRef]
  22. Zumstein, R.; Rousseau, R. Growth rate dispersion by initial growth rate distributions and growth rate fluctuations. AIChE J. 1987, 33, 121–129. [Google Scholar] [CrossRef]
  23. Zumstein, R.C.; Rousseau, R.W. Growth rate dispersion in batch crystallization with transient conditions. AIChE J. 1987, 33, 1921–1925. [Google Scholar] [CrossRef]
  24. Persson, N.E.; McBride, M.A.; Grover, M.A.; Reichmanis, E. Automated analysis of orientational order in images of fibrillar materials. Chem. Mater. 2016, 29, 3–14. [Google Scholar] [CrossRef]
  25. Persson, N.; Rafshoon, J.; Naghshpour, K.; Fast, T.; Chu, P.-H.; McBride, M.; Risteen, B.; Grover, M.A.; Reichmanis, E. High-throughput image analysis of fibrillar materials: A case study on polymer nanofiber packing, alignment, and defects in OFETs. ACS Appl. Mater. Interfaces 2017, 9, 36090–36102. [Google Scholar] [CrossRef] [PubMed]
  26. Wang, X.; De Anda, J.C.; Roberts, K. Real-time measurement of the growth rates of individual crystal facets using imaging and image analysis: A feasibility study on needle-shaped crystals of l-glutamic acid. Chem. Eng. Res. Des. 2007, 85, 921–927. [Google Scholar] [CrossRef]
  27. Ochsenbein, D.R.; Vetter, T.; Schorsch, S.; Morari, M.; Mazzotti, M. Agglomeration of needle-like crystals in suspension: I. Measurements. Cryst. Growth Des. 2015, 15, 1923–1933. [Google Scholar] [CrossRef]
  28. Lilliefors, H.W. On the kolmogorov-smirnov test for normality with mean and variance unknown. J. Am. Stat. Assoc. 1967, 62, 399–402. [Google Scholar] [CrossRef]
  29. Ottens, M.; Lebreton, B.; Zomerdijk, M.; Rijkers, M.; Bruinsma, O.S.L.; van der Wielen, L.M. Impurity effects on the crystallization kinetics of ampicillin. Ind. Eng. Chem. Res. 2004, 43, 7932–7938. [Google Scholar] [CrossRef]
  30. Feng, S.; Shan, N.; Carpenter, K.J. Crystallization of amoxicillin trihydrate in the presence of degradation products. Org. Process. Res. Dev. 2006, 10, 1212–1218. [Google Scholar] [CrossRef]
  31. Kubota, N.; Yokota, M.; Mullin, J. Supersaturation dependence of crystal growth in solutions in the presence of impurity. J. Cryst. Growth 1997, 182, 86–94. [Google Scholar] [CrossRef]
  32. Kubota, N. Effect of impurities on the growth kinetics of crystals. Cryst. Res. Technol. 2001, 36, 749–769. [Google Scholar] [CrossRef]
  33. McDonald, M.A.; Marshall, G.D.; Bommarius, A.; Grover, M.A.; Rousseau, R.W. Crystallization kinetics of cephalexin monohydrate in the presence of cephalexin precursors. Cryst. Growth Des. 2019. revision under review. [Google Scholar]
  34. Burton, W.-K.; Cabrera, N.; Frank, F. The growth of crystals and the equilibrium structure of their surfaces. Philos. Trans. R. Soc. Lond. A Math. Phys. Eng. Sci. 1951, 243, 299–358. [Google Scholar] [CrossRef]
  35. McDonald, M.A.; Bommarius, A.S.; Grover, M.A.; Rousseau, R.W. Continuous reactive crystallization of β-lactam antibiotics catalyzed by penicillin g acylase. Part ii: Case study on ampicillin and product purity. Comput. Chem. Eng. 2019, 126, 332–341. [Google Scholar] [CrossRef]
  36. Burley, J.C.; Streek, J.v.d.; Stephens, P.W. Ampicillin trihydrate from synchrotron powder diffraction data. Acta Crystallogr. Sect. E Struct. Rep. Online 2006, 62, o797–o799. [Google Scholar] [CrossRef]
Figure 1. Microscope images of ampicillin trihydrate, colorized to enhance contrast. The scale-bar is 100 μm: (af) images taken at 2, 20, 40, 60, 90, and 120 min, respectively.
Processes 07 00390 g001
Figure 2. (a) The CSD of initial crystals (green circles) and fit to lognormal distribution (solid green curve) and the CSD after 2 h of growth (red squares) and fit to lognormal distribution (dashed red curve) for experiments with an initial loading of 0.03 g, the bin widths are the same for both CSDs. (b) Cumulative distribution of growth rates extracted from CSDs for experiments with an initial loading of 0.03 g (solid blue curve) and a normal distribution with a mean of 0.84 and standard deviation of 0.43 μm/min (dashed black curve) for reference. Note that the CSDs are lognormal while the growth rate distribution is normal.
Processes 07 00390 g002
Figure 3. (a) The length (left, closed symbols) and width (right, open symbols) of two individual crystals is plotted over time. Note the right axis scale is 5x the left axis scale. Both crystals are fit to Equation (1). (b) Left axis, histogram of R2 values. Right axis, mean growth rate for each bar in the R2 histogram (with enough samples to compute a meaningful mean and standard deviation, n > 10) with error bars of one standard deviation. Note all bins for R2 less than 0.8 have been grouped into a single red bin.
Processes 07 00390 g003
Figure 4. A scatter plot of growth rates of individual crystals against the length of the initial crystal for different initial loadings, with a linear correlation and 95% prediction interval. Along the x-axis is the normalized number-based CSD histogram of the initial crystal lengths, colored by loading. Along the y-axis is the normalized growth rate distribution histogram of the initial crystals, colored by initial loading.
Processes 07 00390 g004
Figure 5. (a) Growth rate of individual crystals versus the initial loading of the experiment in which the growth rate was measured, horizontal jitter is introduced to illustrate the density of data points. (b) Growth rate of individual crystals versus the critical time of the crystal. The solid lines are the linear best fits and the dashed curves are the 95% prediction intervals.
Processes 07 00390 g005
Figure 6. An image of growing crystals is divided into areas based on distance to nearest growing crystal end. The areas are colored based on the volume represented by the area and range from dark blue representing the smallest volume (0.1 nL) and yellow representing the largest volume (2 nL). The areas are overlaid on the grayscale image from which the data were generated. The white points are the crystal ends used in the analysis, and the white curves connecting them illustrate how the crystal is represented in the image analysis program GT Fiber. The red scale bar is 100 μm.
Processes 07 00390 g006
Figure 7. The measured growth rate of the crystals in Figure 6 versus the calculated growth rate of the same crystals based on the division of the image in Figure 6.
Processes 07 00390 g007
Figure 8. The CSD in an MSMPR producing ampicillin by PGA-catalyzed reactive crystallization. The dashed curve represents the case with no GRD and the solid blue curve shows the CSD when the growth rates follow a normal distribution as described in Figure 2b.
Processes 07 00390 g008
Table 1. Initial conditions for growth experiments.
Experimental VariableValue
Volume (of one aliquot)700 μL
6-APA concentration200 mmol/L
PGME concentration200 mmol/L
Ampicillin concentration18 mmol/L
PGA concentration5.0 μmol/L
Ampicillin trihydrate initial loading0.01–0.05 g
pH value6.50
Temperature25.0 °C

