Article

Control of Solvent-Based Post-Combustion Carbon Capture Process with Optimal Operation Conditions

Department of Chemical and Materials Engineering, Tamkang University, Tamsui 25137, Taiwan
*
Author to whom correspondence should be addressed.
Processes 2019, 7(6), 366; https://doi.org/10.3390/pr7060366
Submission received: 10 May 2019 / Revised: 4 June 2019 / Accepted: 5 June 2019 / Published: 12 June 2019
(This article belongs to the Special Issue Dynamic Modeling and Control in Chemical and Energy Processes)

Abstract

:
Solvent-based post-combustion carbon capture (PCC) is a mature and essential technology to solve the global warming problem. The high energy consuming issue and the flexible operation required by the power plants inquire about the development of effective control systems for PCC plants. This study proposes the optimal-based control approach that utilizes optimal set-point values for the quality controllers. The five optimal-based control schemes studied all employed L/G (liquid to gas ratio in absorber) as one quality control variable. Performance comparisons with a typical conventional control scheme are conducted employing a rate-based dynamic model for the MEA (monoethanolamine) solvent PCC process developed on a commercial process simulator. Compared to the typical control scheme, the optimal-based control schemes provide faster responses to the disturbance changes from the flue gas conditions and the set-point change of the CO2 capture efficiency, as well as better results in terms of IAEs (integral of absolute errors) of capture efficiency and reboiler heat duty during the stabilization period. LG-Tstr and LG-Tabs-Cascade are the best schemes. In addition to L/G, these two schemes employ the control of Tstr (the temperature of a stage of stripper) and a cascade control of Tabs (the temperature of a stage of absorber) (outer loop) and Tstr (inner loop), respectively.

Graphical Abstract

1. Introduction

Carbon capture and storage (CCS) is a critical CO2 emission abatement technology. Based on a CCS facility with a CO2 capture capacity of 1.5 million tonnes per annum (Mtpa), 2500 CCS facilities must be operated in 2040 to meet the Paris 2 °C target [1]. Post-combustion CO2 capture (PCC) using amine-based solvent is considered a mature technology for CO2 capture and is likely to be the first carbon capture technology to be deployed worldwide on a large scale [2]. The advantages of amine-based PCC include its suitability for retrofitting to existing fossil fuel-fired power plant and the ability to treat flue gas flows with low CO2 concentration [3]. Nonetheless, the issues of large energy requirement, typically around 15–30% of the net power generated of a coal-fired power plant [4], must be resolved before large-scale deployment of PCC technology becomes a reality. In addition to alternative process configurations and optimal operation conditions [5,6,7,8], the attention to efficiency improvements in PCC technology has been extended toward effective control of PCC and the flexible operation strategies of the power plant integrated with its PCC plant [2].
On the basis of researches for stand-alone PCC plants, including the development of dynamic model, model validation using pilot plant data, and investigation of various control structures, many recent publications contribute to the development of linked dynamic process simulation models and study of control strategies for the flexible operation of the integrated thermal power plant and PCC process. Ziaii et al. [9] developed a dynamic model of a monoethanolamine (MEA)-based absorption process and a steady-state model of the turbine section of a coal-fired power plant to evaluate control strategies for part-load operation or the power plant and a reduction of reboiler load. The open loop response study concluded that the control strategy using a ratio controller to adjust the circulation solvent flow rate with the reboiler heat rate allows the maintaining of lean loading and results in the increase of CO2 removal by 1% with fast response. For a coal-fired power plant, Wellner et al. [10] analyzed a case scenario of reducing the steam extraction of the carbon capture process by 50% using a PCC model validated by the steady and transient data of a pilot plant in Heilbronn, Germany and a dynamic model of the power plant. The PCC runs in feed-forward operation and by actuating reboiler steam valve fast and reliable power control can be obtained. Montañés et al. [11] linked dynamic models of power plant, gas turbine, steam turbine, and PCC process to study the load-change transient performance of a commercial-scale natural gas combined cycle power plant. The power plant model was validated against steady-state data, and the PCC model was validated using steady-state and transient data from a large-scale amine pilot plant [12]. Five control schemes of PCC were evaluated for the change of gas turbine load from 100% to 70% with different ramp rate. The control scheme controlling the L/G (liquid to gas ratio) of the absorber gives significantly faster stabilization times to the power plant and PCC unit’s main process variables. Garđarsdóttir et al. [13] investigated the transient performance of two operation modes, various power plant loads and levels of steam availability, for the integrated system of a supercritical pulverized-coal-fired power plant with a CO2-absorption process. The five control schemes for the PCC process employ the CO2 capture rate, L/G, and reboiler temperature as controlled variables and the flow rates of steam, lean solvent, and rich solvent as manipulated variables. With these control schemes, the load-change operation mode can be well controlled, while stable operations are not attainable for varying steam availability operation. Martinez Castilla et al. [14] conducted a modeling study of open-loop responses of the CO2 capture process integrated into an industrial combined-heat-and-power plant with load changes. Using a dynamic PCC model validated by the pilot plant operated at Maasvlakte power station in Netherlands, Sharifzadeh and Shah [15] investigated the controllability of the integrated power plant and capture process, for which the design and operation of the capture process have been optimized simultaneously [16]. The control scheme controls the extent of CO2 capture, reboiler temperature, and lean solvent temperature entering the absorber with lean solvent flow rate, steam flow rate, and cooling water flow rater, respectively. The results of 155 sensitivity analyses suggested a high degree of controllability and flexibility for both natural gas and coal-fired scenarios [15].
In these studies, on the flexible operation of the integrated power plant and PCC process, the dynamic models of the PCC process employed were developed and validated independently to the power plant model. Based on their analysis results, Montañés et al. [11] and Garđarsdóttir et al. [13] both concluded that CO2-absorption process has much slower dynamics than the power plant cycle. Hence, an effective control scheme of the PCC process is highly critical to the controllability and flexibility of the integrated system [13]. As the PCC process is associated with the power plant only through two boundary conditions, i.e., the flue gas inlet stream and the reboiler steam, the structure of control schemes for the integrated power plant and PCC process and that of the stand-alone PCC process are the same. The identified effective control schemes considering appropriate boundary conditions for the stand-alone PCC process can be expected to work well for the integrated power plant and PCC process.
For the control of stand-alone PCC processes, Panahi and Skogestad [4,17] emphasized on the optimal operation of PCC with the optimality defined in terms of a cost function that includes energy consumption and the penalty for the release of CO2 to air. The proposed self-optimizing control concept is that the process is indirectly close to its optimum when the control variables are held constant at their optimal normal set-points. By a top-down approach, the self-optimal controlled variables (CVs) are identified as the percentage of CO2 capture (%CC) in the absorber and the temperature of a tray in stripper ( T str ) or the reboiler duty ( Q reb ) and T str for different regions of operation. For the major disturbances of the system, i.e., the flue gas flowrate and CO2 concentration, a bottom-up approach was then taken to test the performance of different pairing among CVs and manipulated variables (MVs). In addition to decentralized control, they also implemented the MPC (model predictive control) for comparison. The performance comparison was based on the tightness of CVs to their target values and the economic objective function values at the final steady state. They concluded that the best control parings (CV-MV) are %CC- Q reb and T str - F rich (rich solvent flow rate into the stripper) and has performance comparable to MPC.
Nittaya et al. [18] proposed three control schemes developed from RGA (Relative Gain Array) analysis approach or heuristic approach, including (A) %CC- Q reb and T reb - F lean (reboiler temperature-lean solvent flow rate into the absorber); (B) %CC- F lean and T reb - Q reb ; (C) %CC- Q reb and T reb - F rich . These control schemes were evaluated using different scenarios, namely the changes in the CO2 capture set-points, operating conditions of flue gas stream, and stiction of the outlet valve of the buffer tank. The performance evaluation was based on ISE of %CC (Integrated-Squared-Error of %CC against its set point) and the integrated reboiler energy requirement. Because the assumption of the RGA analysis did not take into account the process dynamics, the control structure (A) based on RGA analysis did not provide good performance. The control structures B and C obtained from the heuristic approach resulted in shorter closed-loop settling time.
For the integrated natural gas-fueled combined cycle power plant and PCC process, Montañés et al. [19] reported experimental results of open-loop responses and performance of several decentralized control structures for load changes at the larger scale amine pilot plant at Technology Centre Mongstad. The tests adopted control schemes with L/G ratio control and with CO2 capture rate control, specifically, include (A) T reb - Q reb and keeping L/G ratio to a fixed value manually; (B) %CC- F rich and T reb - Q reb ; (C) %CC- F rich and manually adjusting Q reb . The study concluded that fast and large changes in the solvent flow rate as a control measure could cause instabilities due to the interaction between the stripper temperature and the capture rate control loops. They suggested a combination of feedforward and feedback algorithms could be a solution to achieve fast and stable disturbance rejections.
Two valuable insights can be drawn from these studies on the control strategies of PCC plants. The first one is the need to pursue the optimal control and operation with the objective function defined in terms of energy consumption or cost of operation. For example, Panahi and Skogestad [4,17] proposed a method to identify the self-optimal controlled variables; Gjernes et al. [20] developed U-curves in the experimental tests for the CO2 capture unit of Technology Center Mongstad and identified the optimal stripper bottom temperature and lean loading of MEA solvent for minimum specific reboiler duty. The second one is that it is necessary to adjust the operation conditions, such as the solvent flowrate or reboiler steam flowrate, with the changes in loading (e.g., the flow rate or CO2 concentration of flue gas) or set-point (e.g., the percentage or amount of CO2 capture). For these adjustments, Montañés et al. [11,12] suggested the adoption of feedforward control and implemented manually in their experimental study. The choice of the L/G of absorber as a controlled variable [9] actually implies this adjustment. However, in those studies [11,13] that adopted L/G as a controlled variable, even for a significant level of power plant load change cases, a fixed-value L/G set-point determined for the baseline operation, instead of the optimal value for the actual flue gas inlet conditions, was used.
The rigorous simulation model developed from first principles is an indispensable and economic tool for the design and operation of amine-based PCC process. Due to the rate-controlled chemical reactions and the heat and mass transfer, a significant difference in accuracy between equilibrium- and rate-based models was found [21]. Steady-state rate-based model for chemical absorption has been developed and provided as a standard module (Radfrac) in the commercial process simulation software package Aspen Plus® [22]. However, the Radfrac column model does not export to Aspen Plus Dynamics®. Dynamic rate-based models have been developed on other software platforms, such as gPROMS® [18,23,24], Matlab® [25], and UniSim® [17]. The dynamic models developed on the Aspen Plus® platform are either only for the stripper column [9] or equilibrium-based [26]. Using the steady-state, rate-based Aspen Plus® model, Zhang et al. [27] established correlations of murphy efficiencies to develop the dynamic model in the Aspen Plus Dynamics®. Bui et al. [2] provided an extensive literature review of the simulation scenarios and characteristics of various dynamic models. Some dynamic models have undergone validation against dynamic pilot plant data [12,25,28,29]. Recently, the authors of this paper [30] developed a rate-based dynamic model for the MEA (monoethanolamine) solvent PCC process on the Aspen Custom Modeler® (ACM) software platform [31]. The model was validated using the dynamic pilot plant from [25].
In this study, the performance of several control schemes with optimal operation conditions as the controller set-points is analyzed employing the rate-based dynamic model for the stand-alone MEA solvent PCC process developed on the ACM software platform [30]. In addition to the dynamic response and settling time, the performance of control schemes in terms of the integrated absolute error (IAE) during the transient-period for the absorption efficiency, amount of CO2 emission and reboiler heat duty are compared. In the discussion of the flexible operation of the integrated power plant and PCC process, scenarios with up to 50% load changes are investigated [13,19]. In this paper, the scope of the study is limited to the control of a stand-alone PCC with disturbance and set-point changes around the nominal base load operation (±10%).

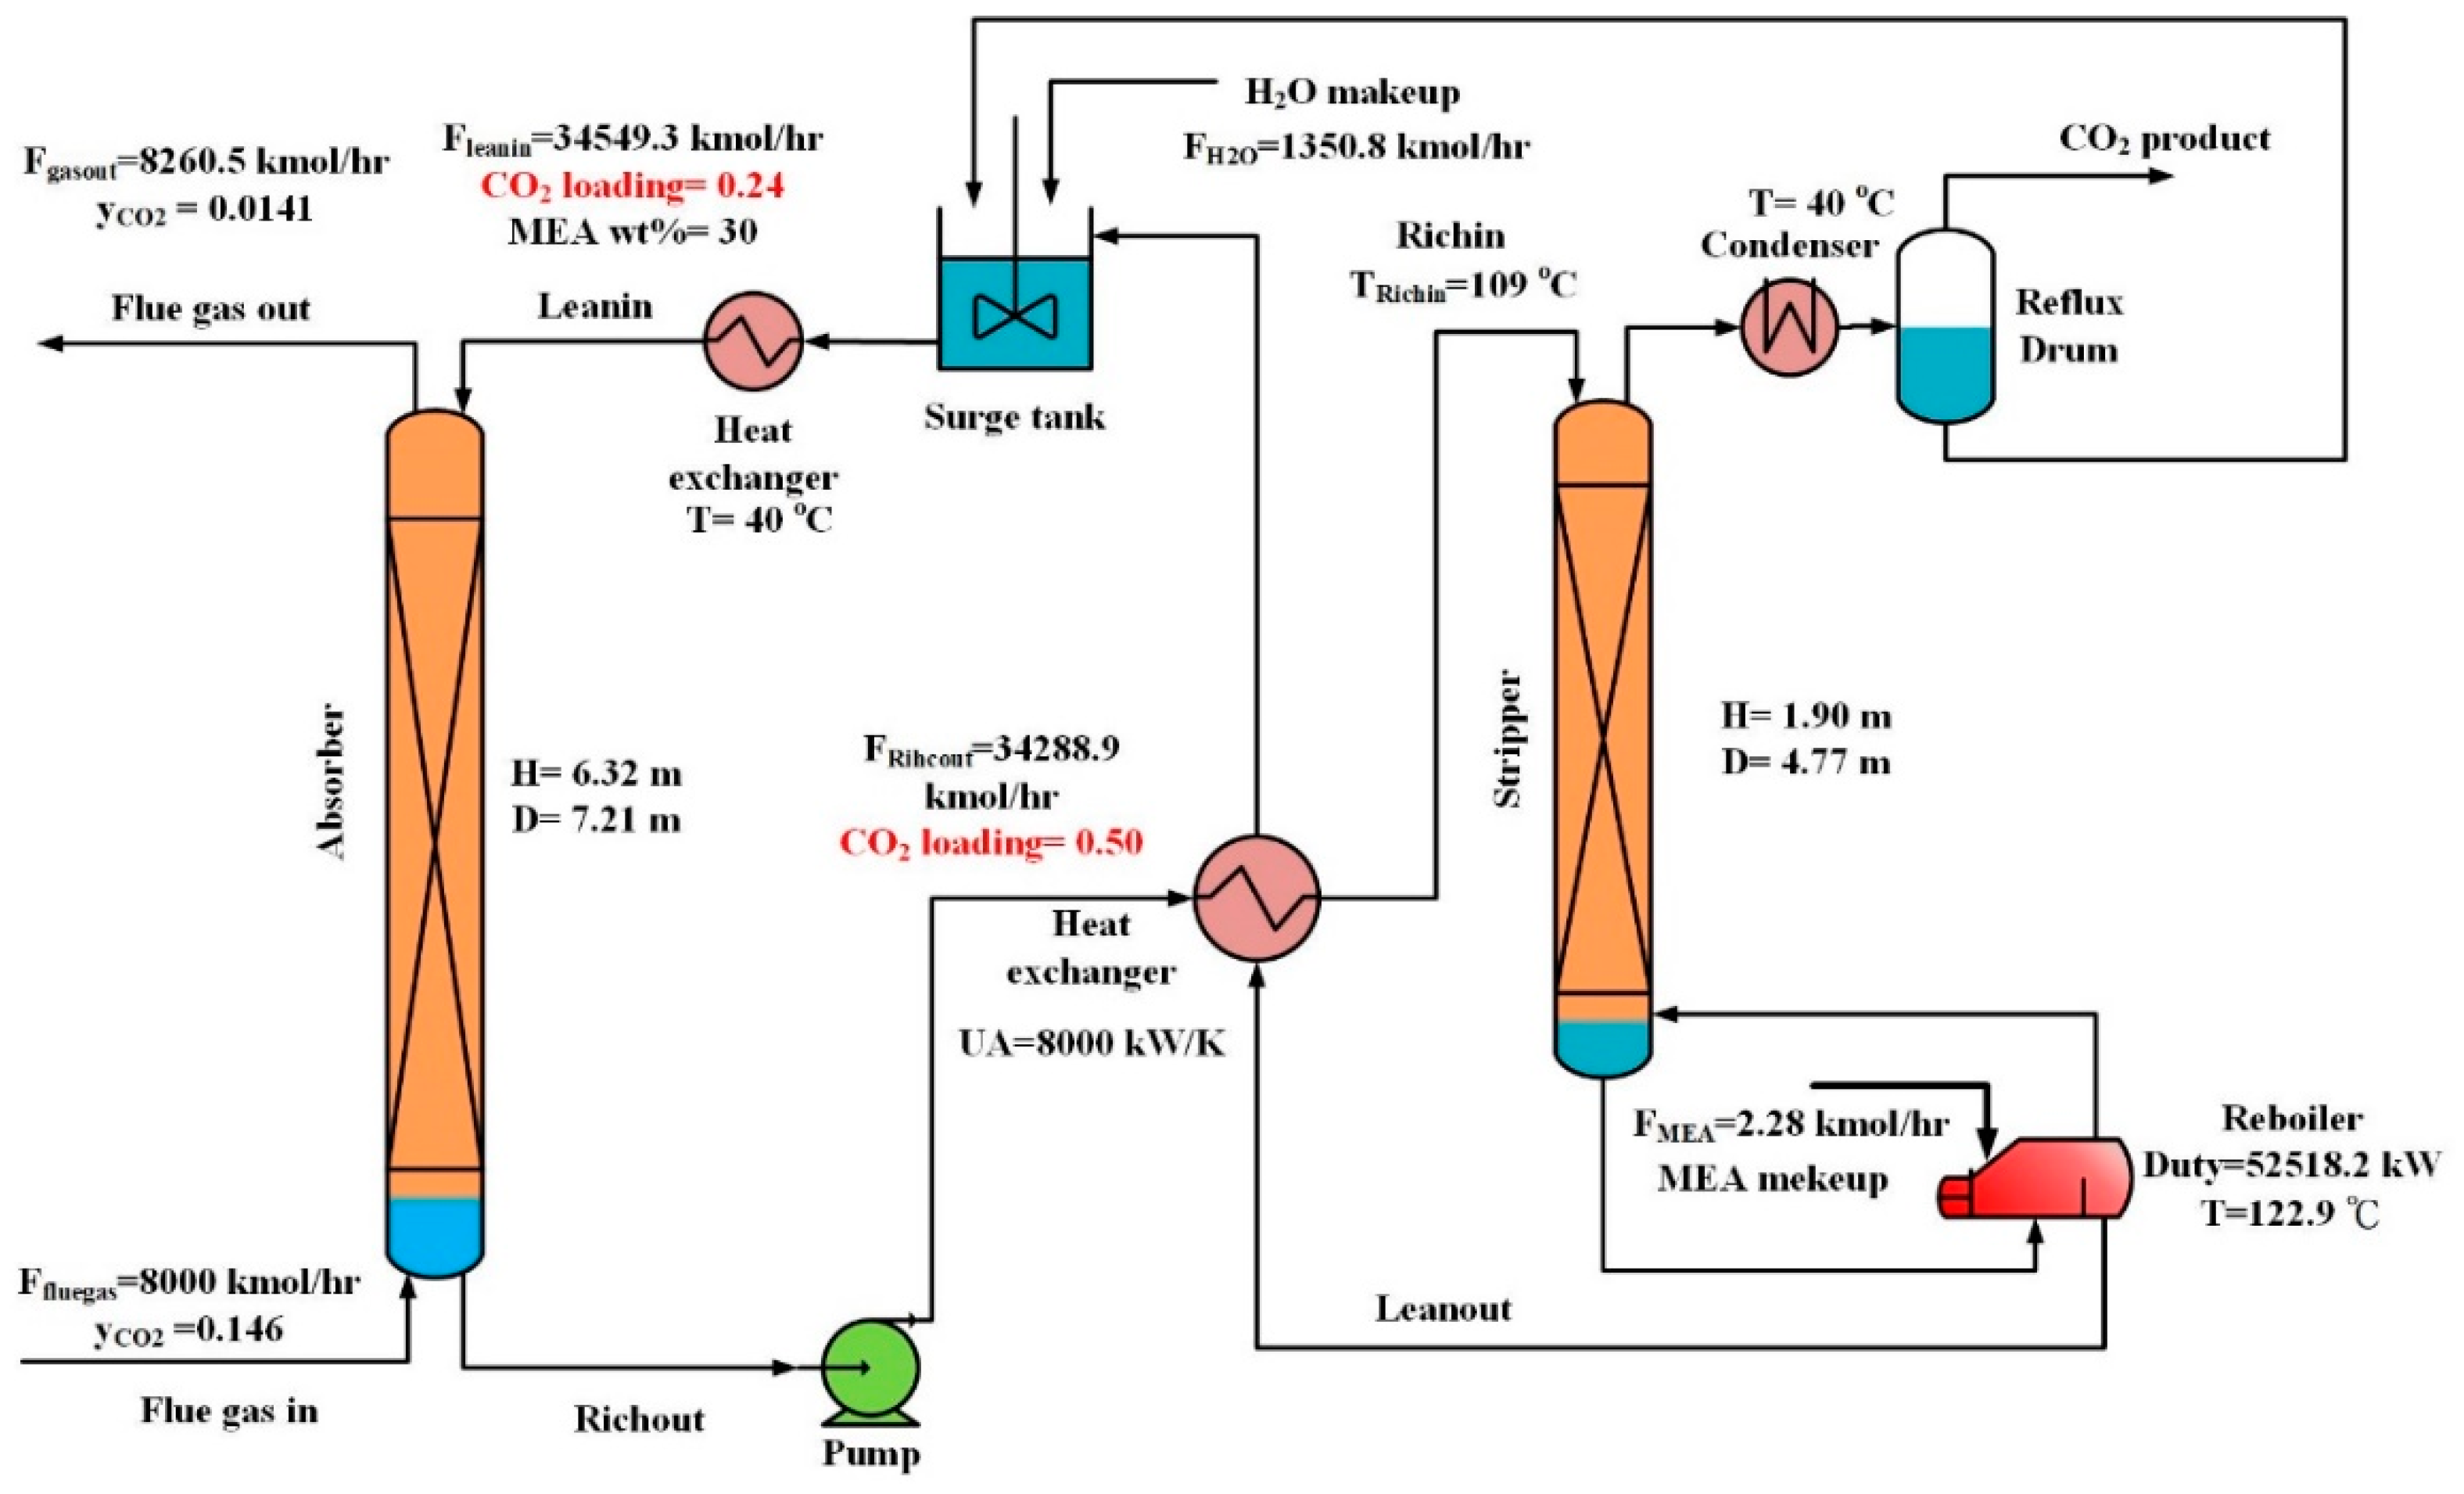
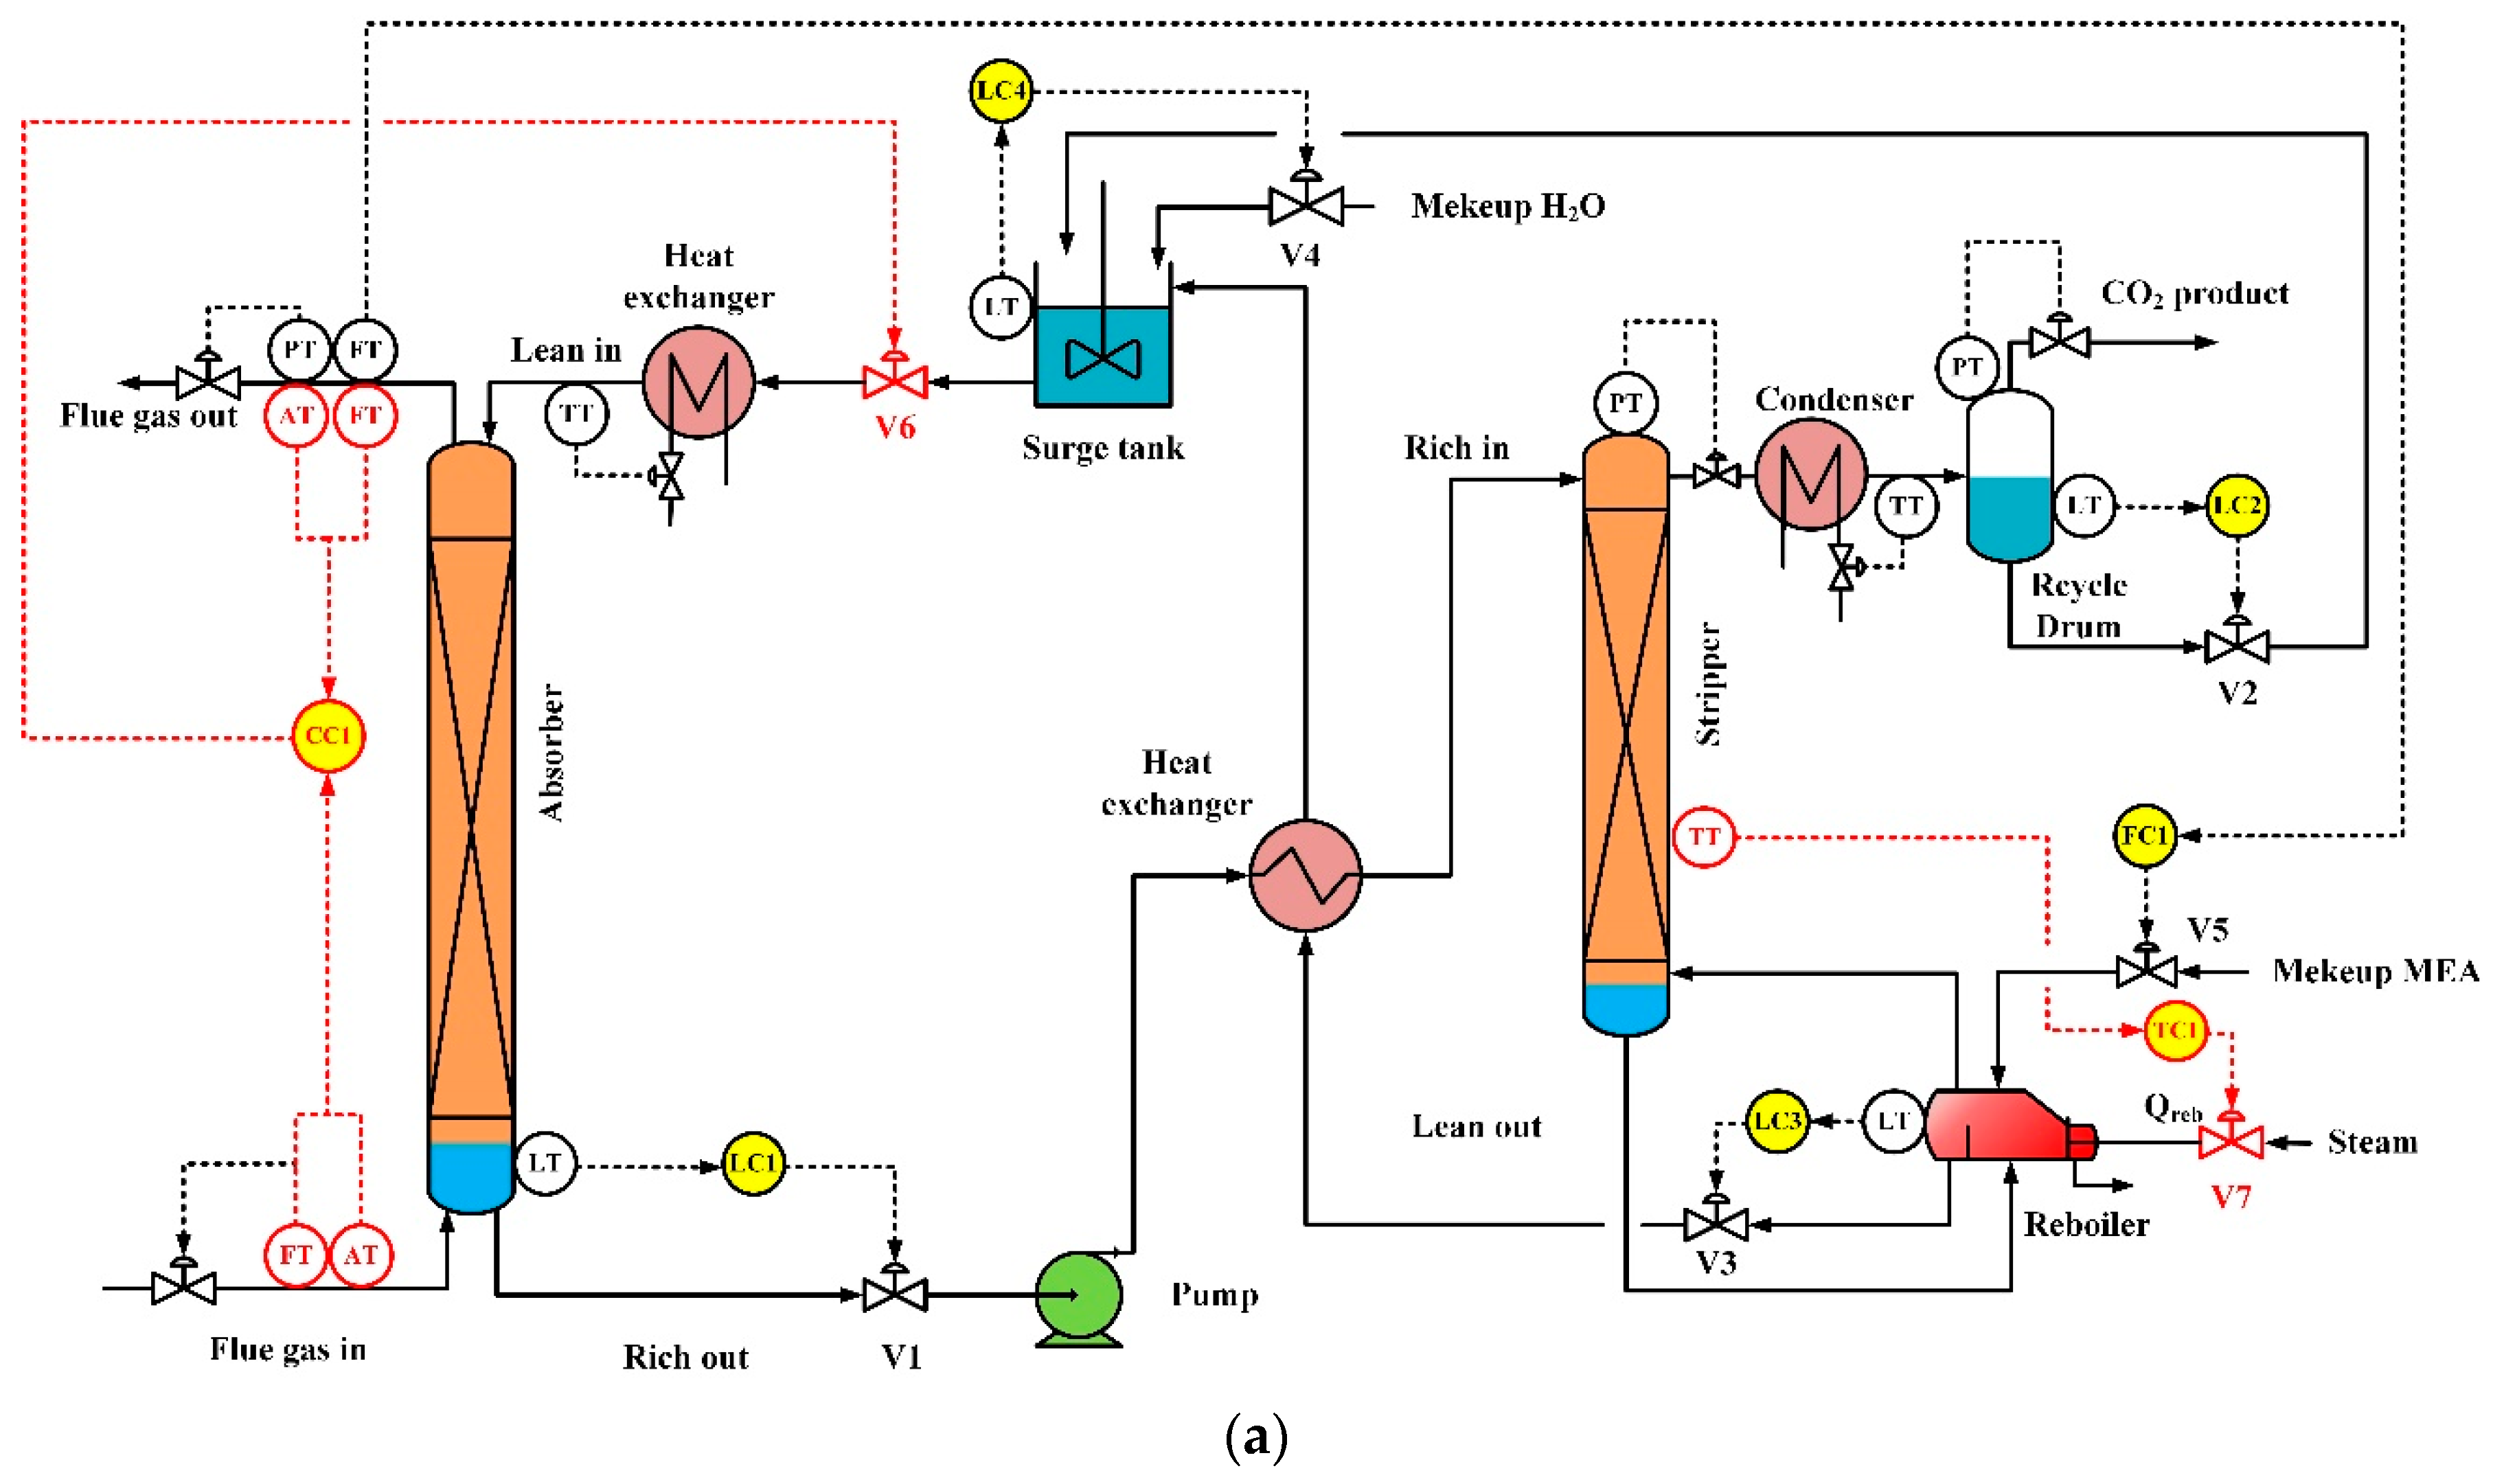
2. Process and Simulation

The CO2 capture process studied is illustrated in Figure 1. The major units were the absorber for flue gas CO2 absorption into the MEA solution and the stripper with a steam reboiler and a condenser for the regeneration of the MEA solution and producing the gaseous product, which consists of only CO2 and water. Other units were auxiliary equipment, including the cross heat exchanger for heat recovery from the lean solution leaving the stripper to the rich solution leaving the absorber, a cooler to further cool the lean solution before entering the absorber, and a surge tank to buffer the solution flow between the absorber and stripper. Due to the limitation of feasible column diameter, five parallel lines were needed. The gas treated in the absorber was 1/5 of the flue gas generated by a 300 MWe coal-fired power plant, and the CO2 concentration was 14.6 vol%. The absorption liquid was a 30 wt% MEA aqueous solution. The CO2 capture efficiency was 90%, and the stripper operation pressure was 2 bar. Both the absorber and stripper employed the Sulzer BX structured packing.
The CO2 capture process, as shown in Figure 1, was simulated using the unit and flowsheet models built on ACM by the authors of this paper. The modeling details and model validation are presented in [29]. The rate-based column model developed for absorber and stripper took into account the heat and mass transfer across the vapor-liquid interface, as well as the enhancement of CO2 absorption by the liquid phase chemical reactions.
For this study, the equipment sizes specified are depicted in Figure 1. For the base operation conditions, based on the design in Flø et al. [25] and the level control stability in our simulation, the holdup volume of absorber sump, reboiler sump, condenser reflux drum, and surge tank corresponded to the residence time of 5 min, 20 min, 5 min, and 30 min, respectively.

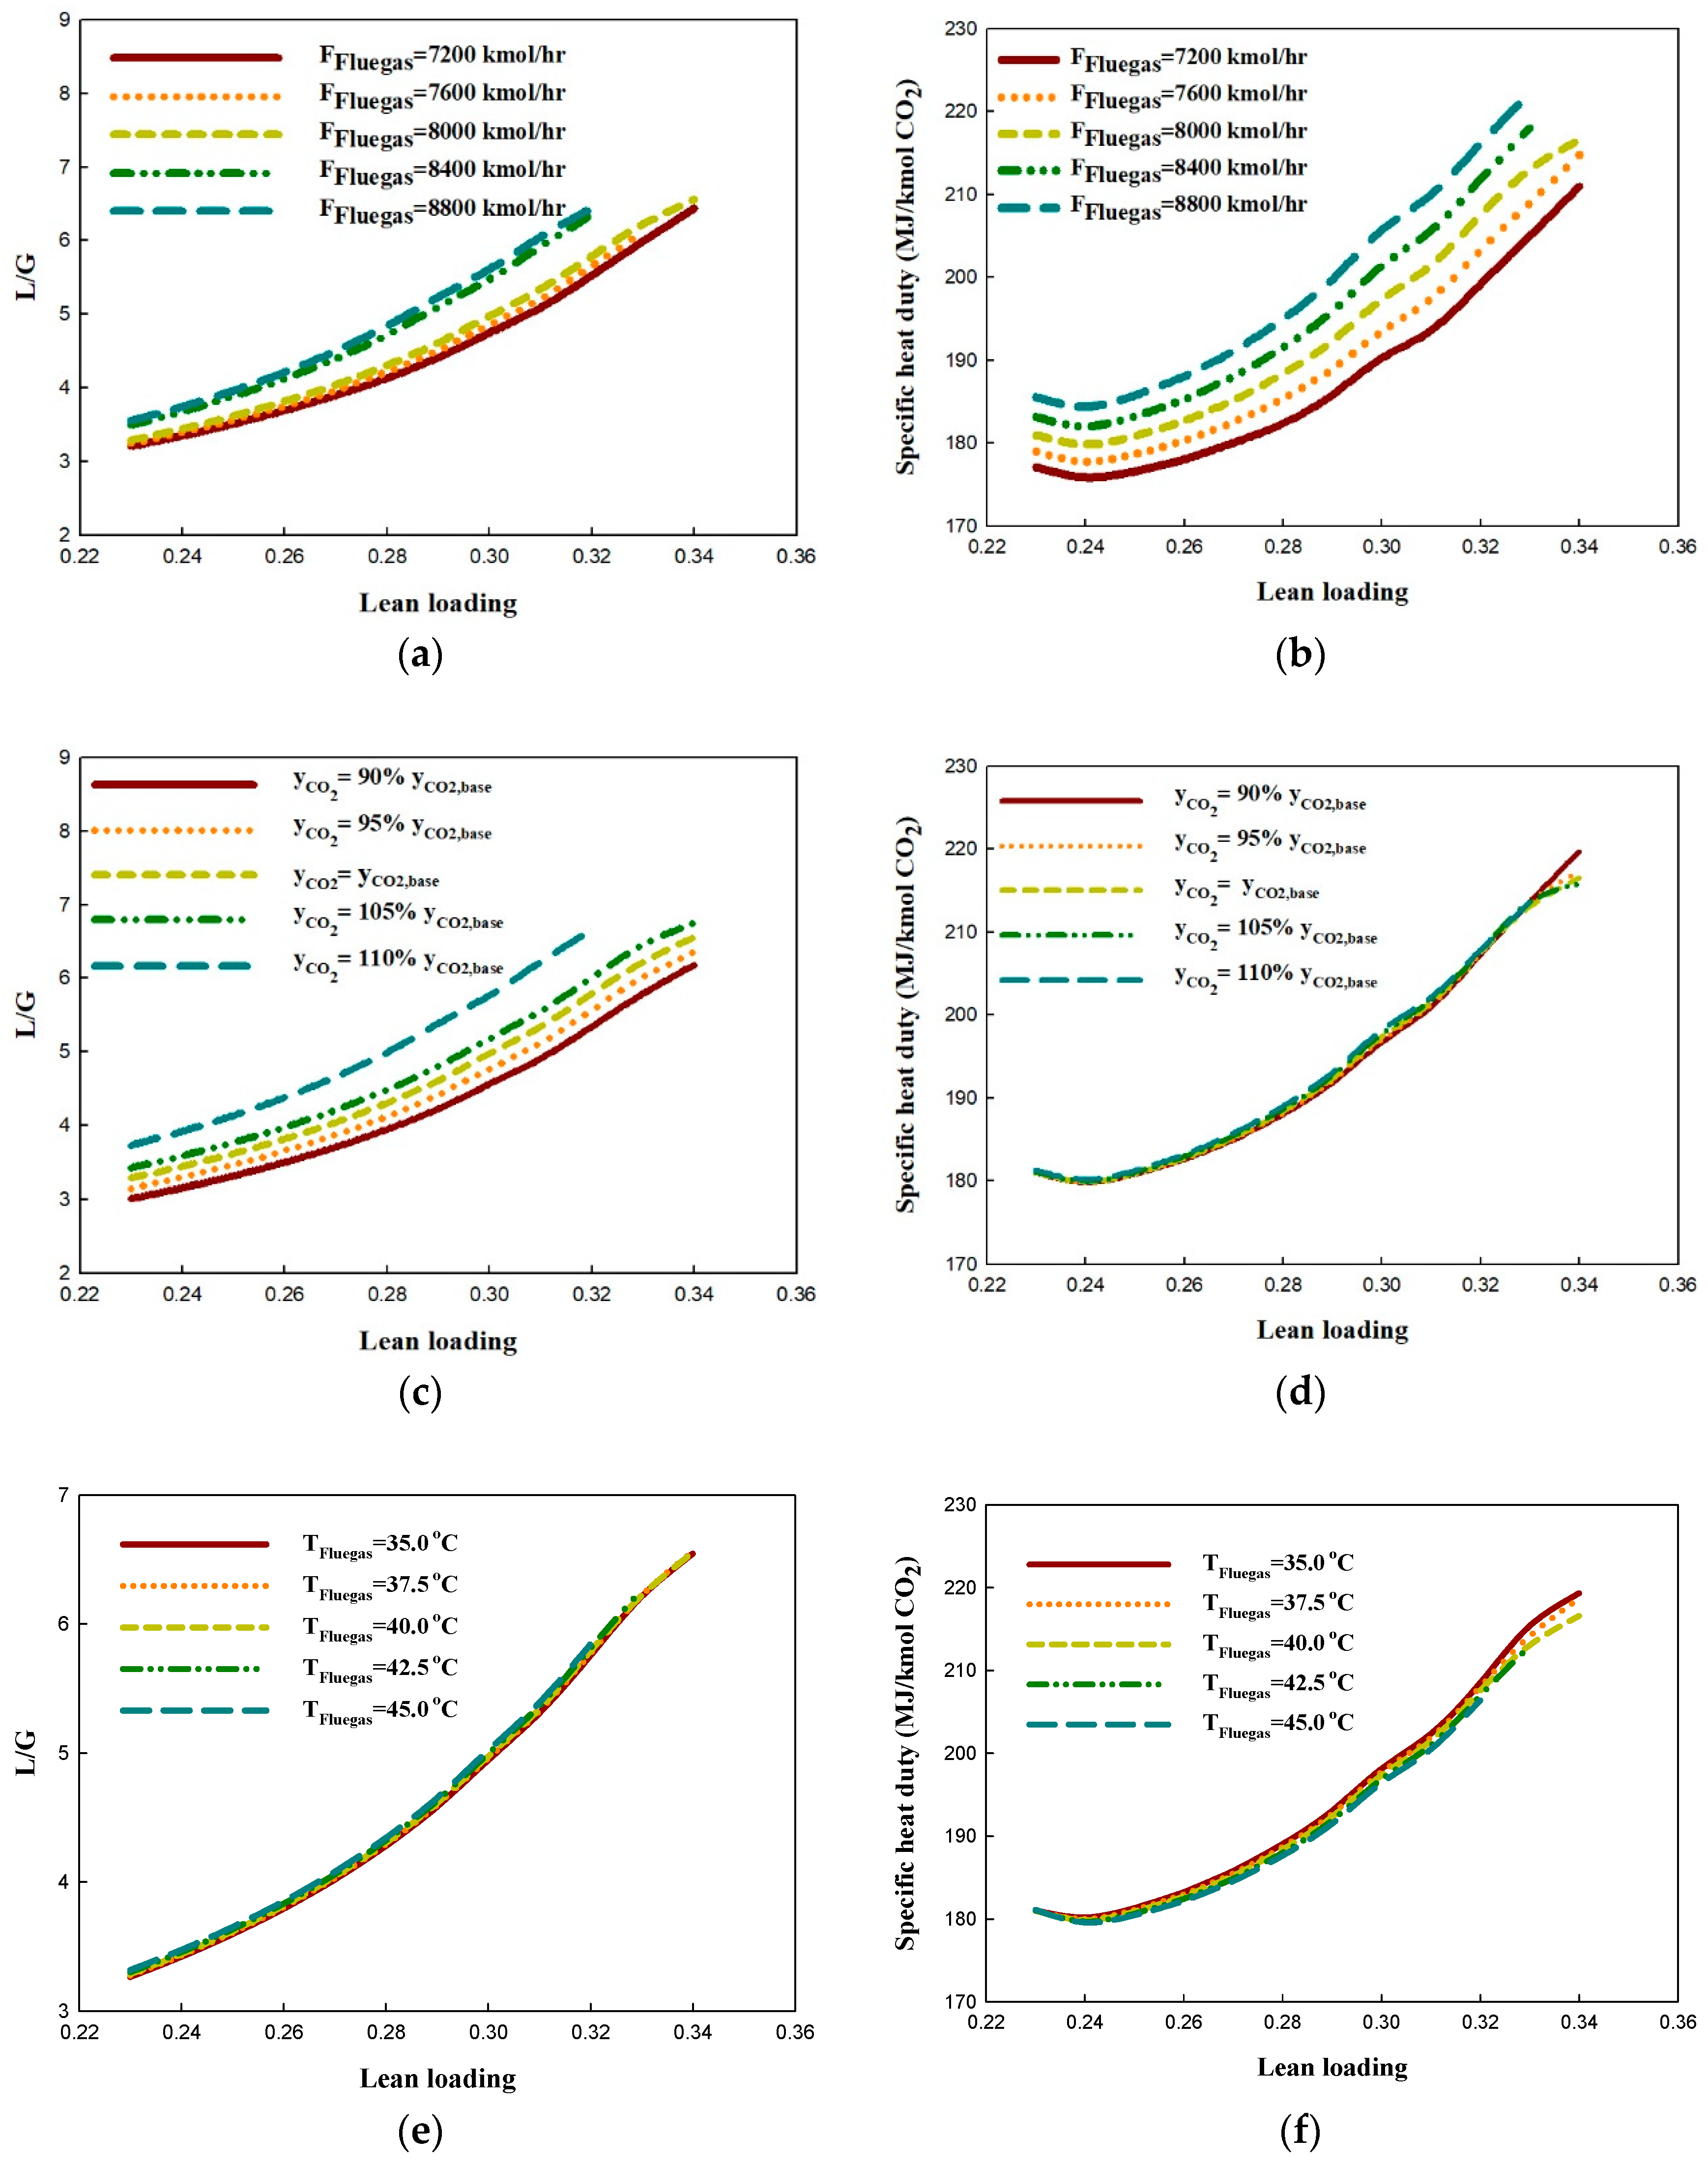
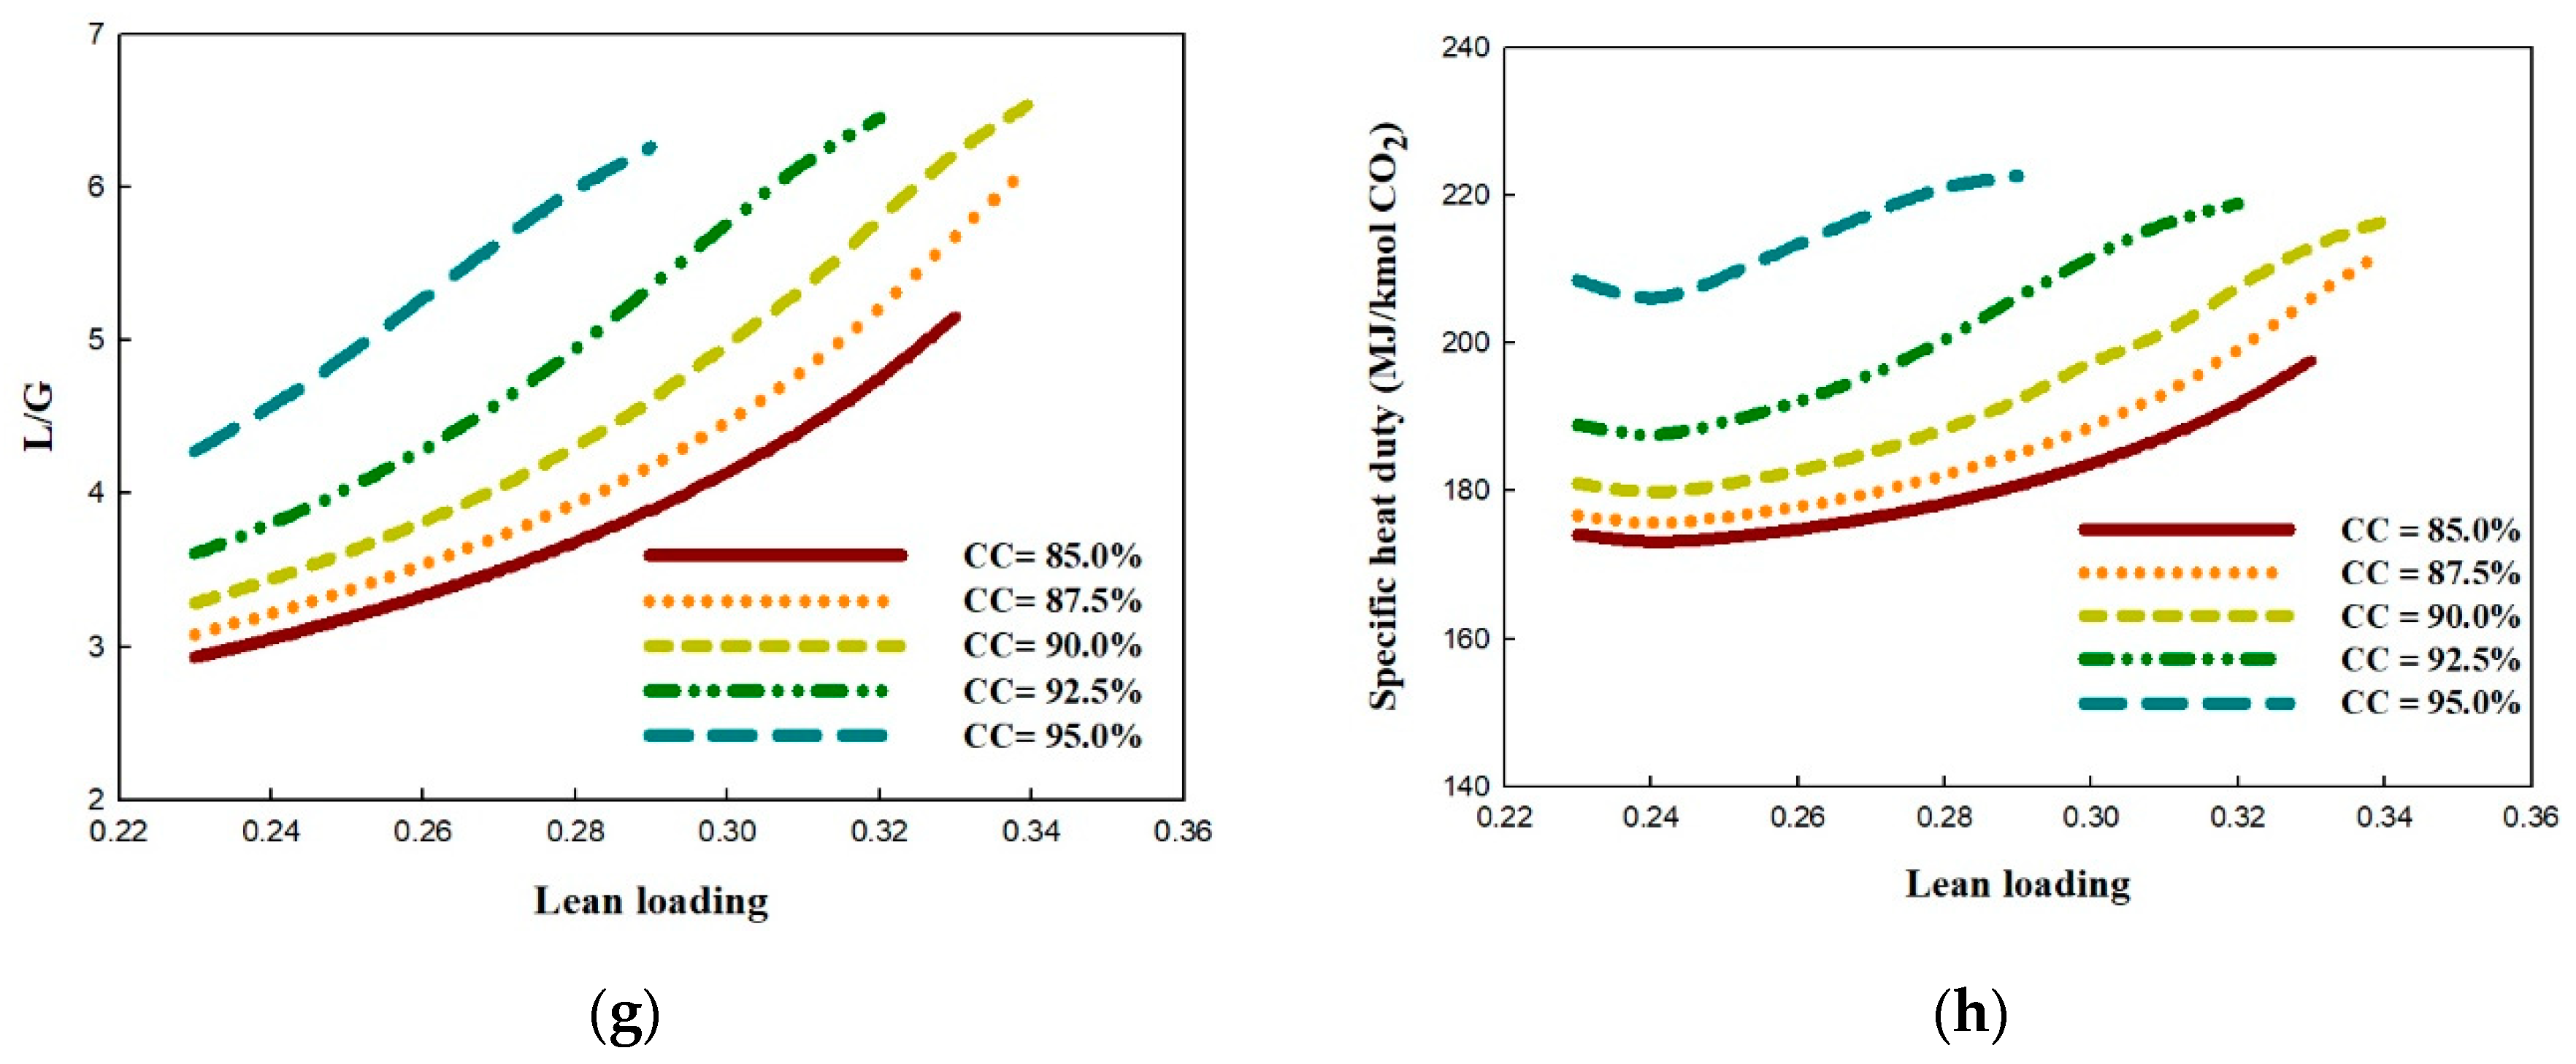
3. Steady-State Optimization

The control approach proposed in this study was based on the optimal operation conditions with the objective of minimizing the specific heat duty ( Q ¯ reb ), i.e., the reboiler heat duty for one kmole of CO2 captured. Therefore, a steady-state optimization analysis for the process operated under the studied disturbances or new set-points must be conducted before the investigation of proposed control schemes and their performance. The optimization study was implemented by combining parametric analysis and optimal search using ACM. The parametric analysis varied the flow rate ( F Flue gas ), CO2 concentration ( y C O 2 ), and temperature ( T Flue gas ) of the inlet flue gas, the lean loading of solvent ( LL ), and the CO2 capture efficiency (%CC). For each set of these operation parameters, the minimum specific reboiler duty ( Q ¯ reb ) was determined, employing the optimization solver of ACM. The decision variables ( D ) were the solvent flow rate ( F Leanin ), reboiler duty ( Q reb ), and the makeup flowrates of water ( F H 2 O , MU ) and MEA ( F MEA , MU ). The optimization problem conducted in ACM is defined as:
min D Q ¯ reb
D = { F Leanin ,   Q reb ,   F MEA , MU ,   F H 2 O , MU }
Subject to:
f ( X ,   S ) = 0
% C C = % C C fixed ,   C MEA = 30 wt % ,   LL = LL fixed
F Flue gas = F Fluegas ,   fixed ,   y C O 2 = y C O 2 , fixed ,   T Flue gas = T Fluegas ,   fixed
where f is the rate-based process model as a function of state variables X and equipment size variables S. Note that the equipment sizes are fixed.
For the disturbance changes of flue gas flow rate, CO2 concentration, and temperature, as well as the set-point change of CO2 capture efficiency, the optimal solutions for different lean loading of solvent are summarized in Figure 2. For all the flue gas conditions or capture efficiency, the optimal L/G increased with the lean loading. In other words, when employing higher lean loading, the higher circulation rate of solvent is required. The optimal L/G increased with the flue gas flow rate and concentration, as well as the capture efficiency. The flue gas temperature had an only minor effect on the optimal L/G. The specific heat duty also increased with the flue gas flowrate and capture efficiency, but the effects of flue gas concentration and temperature were insignificant. All the curves in Figure 2b,d,f,h show a minimum specific heat duty at lean loading of 0.24. This result suggests that this process, with the given equipment sizes, should be operated at lean loading of 0.24. The optimal value of L/G for each operation case, for example, at certain flue gas flow rate, concentration, and temperature or certain capture efficiency, is employed in the control schemes, as discussed in Section 4.

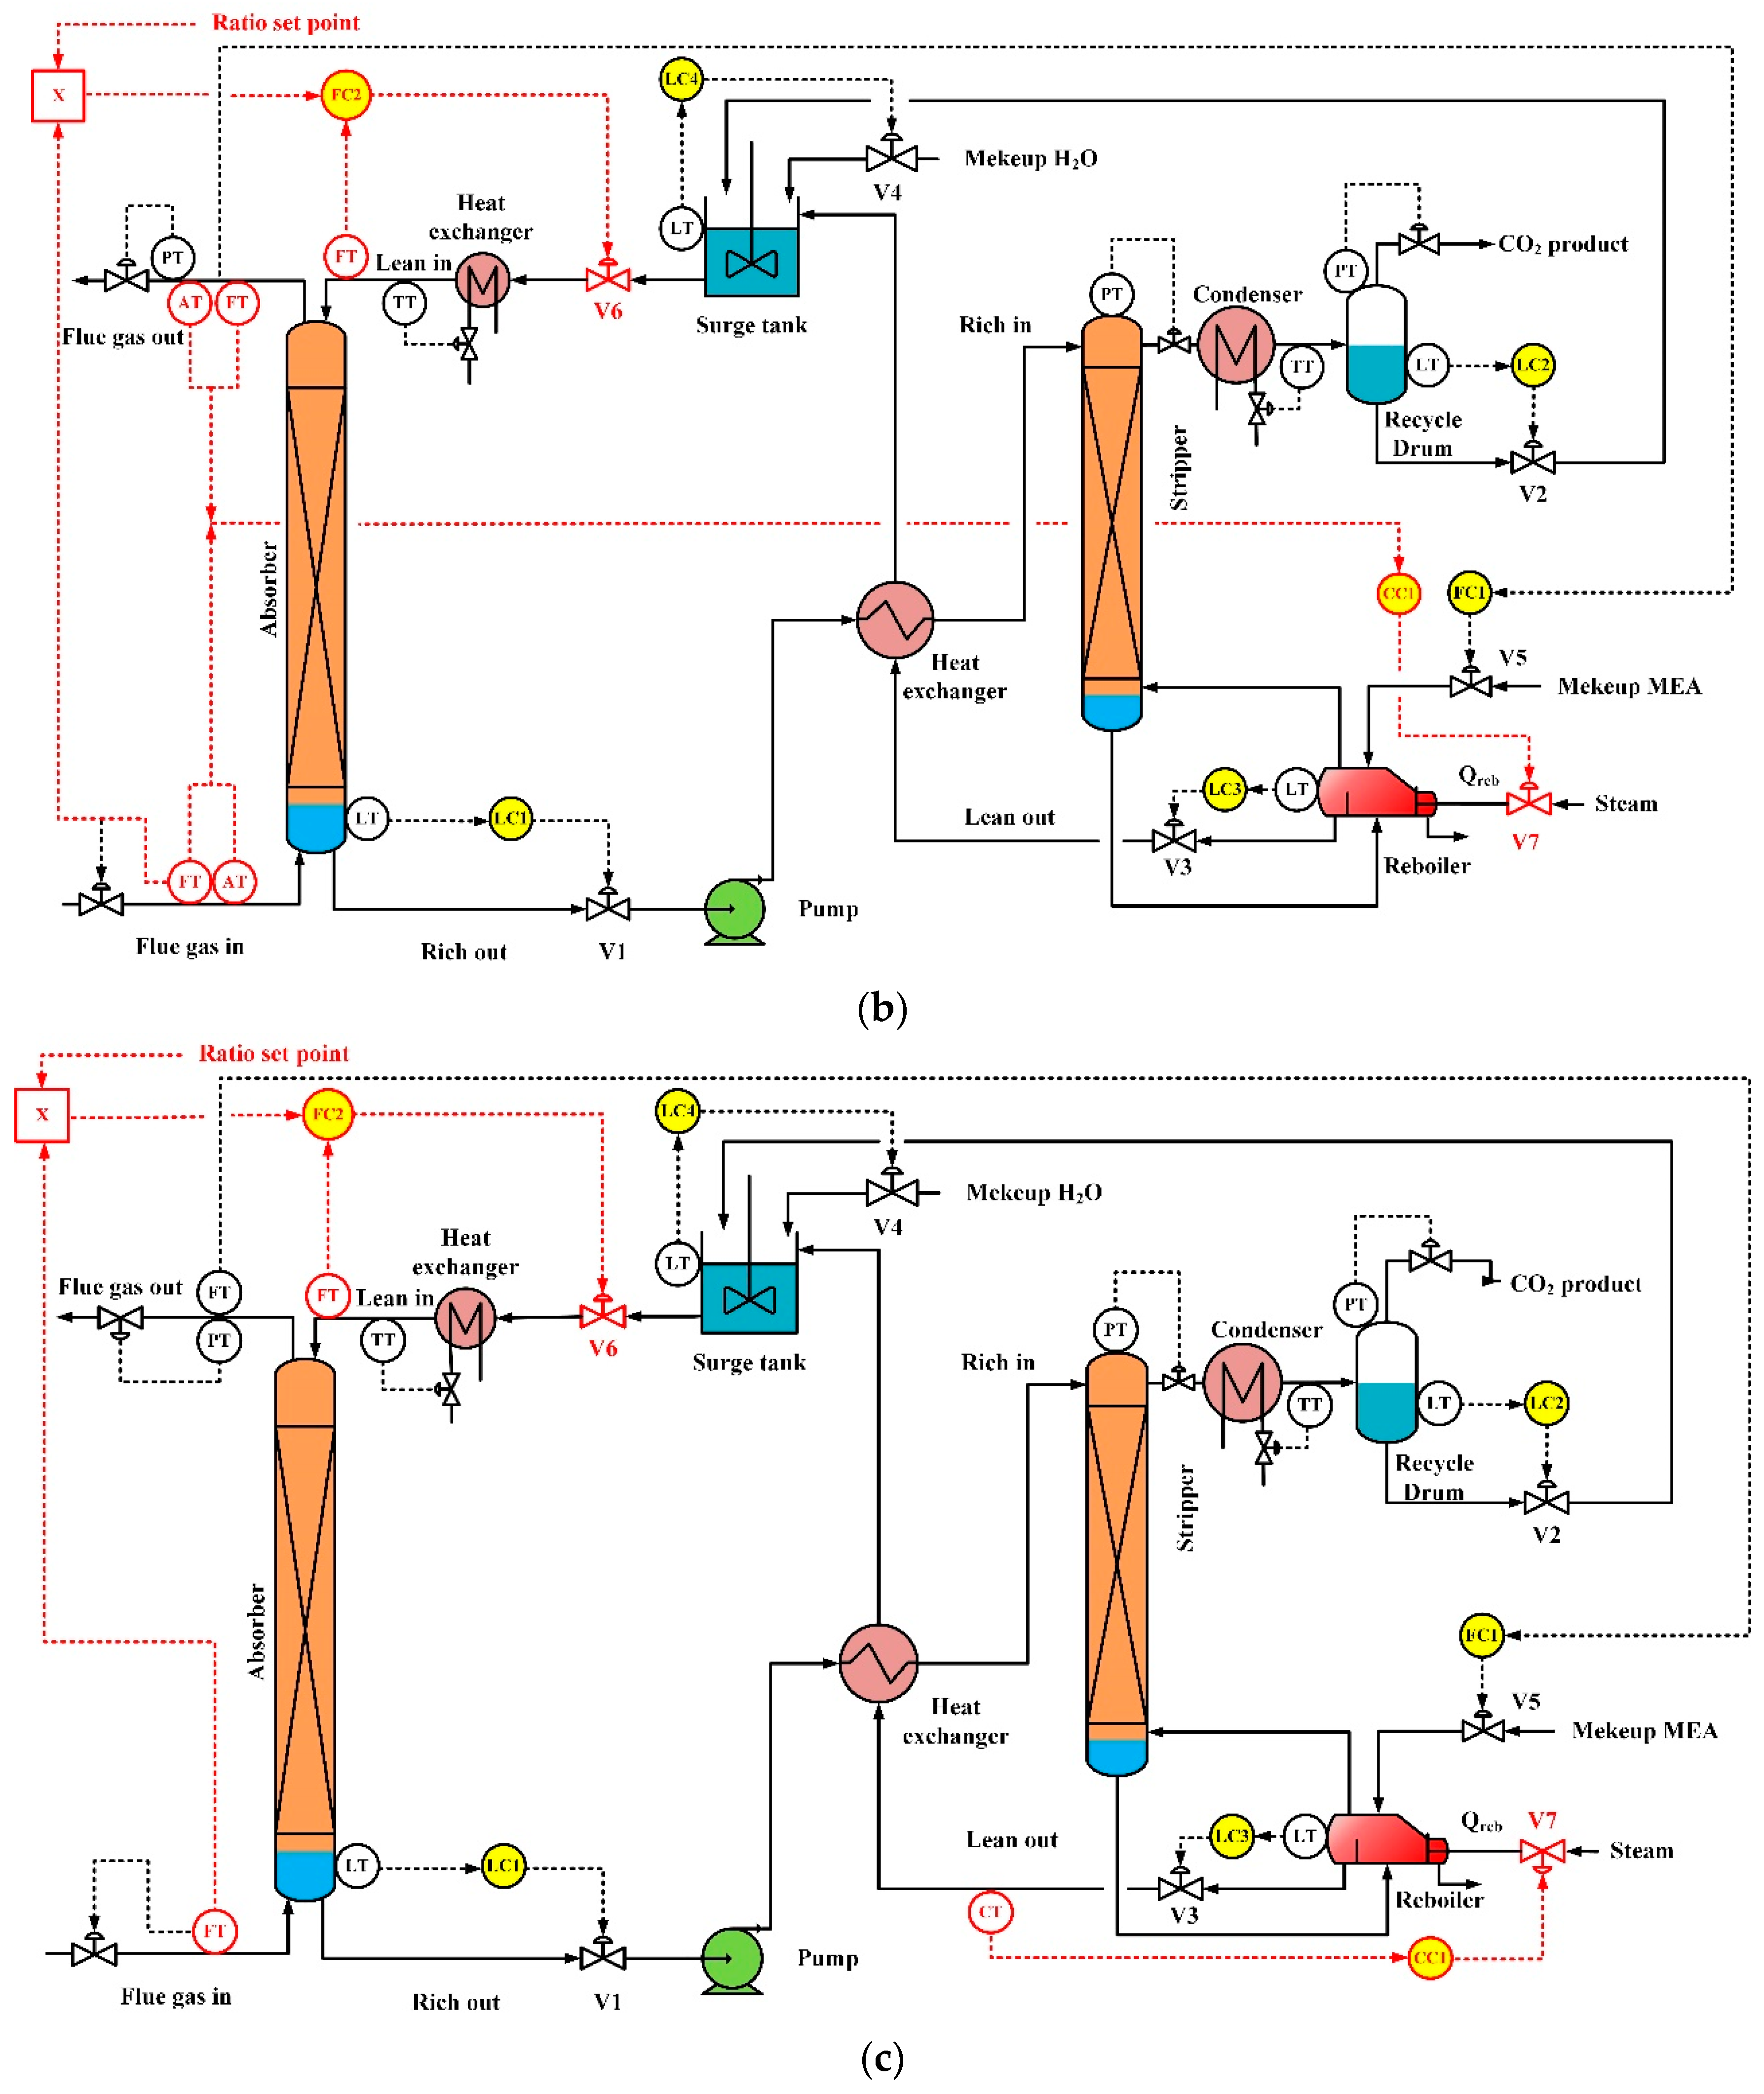
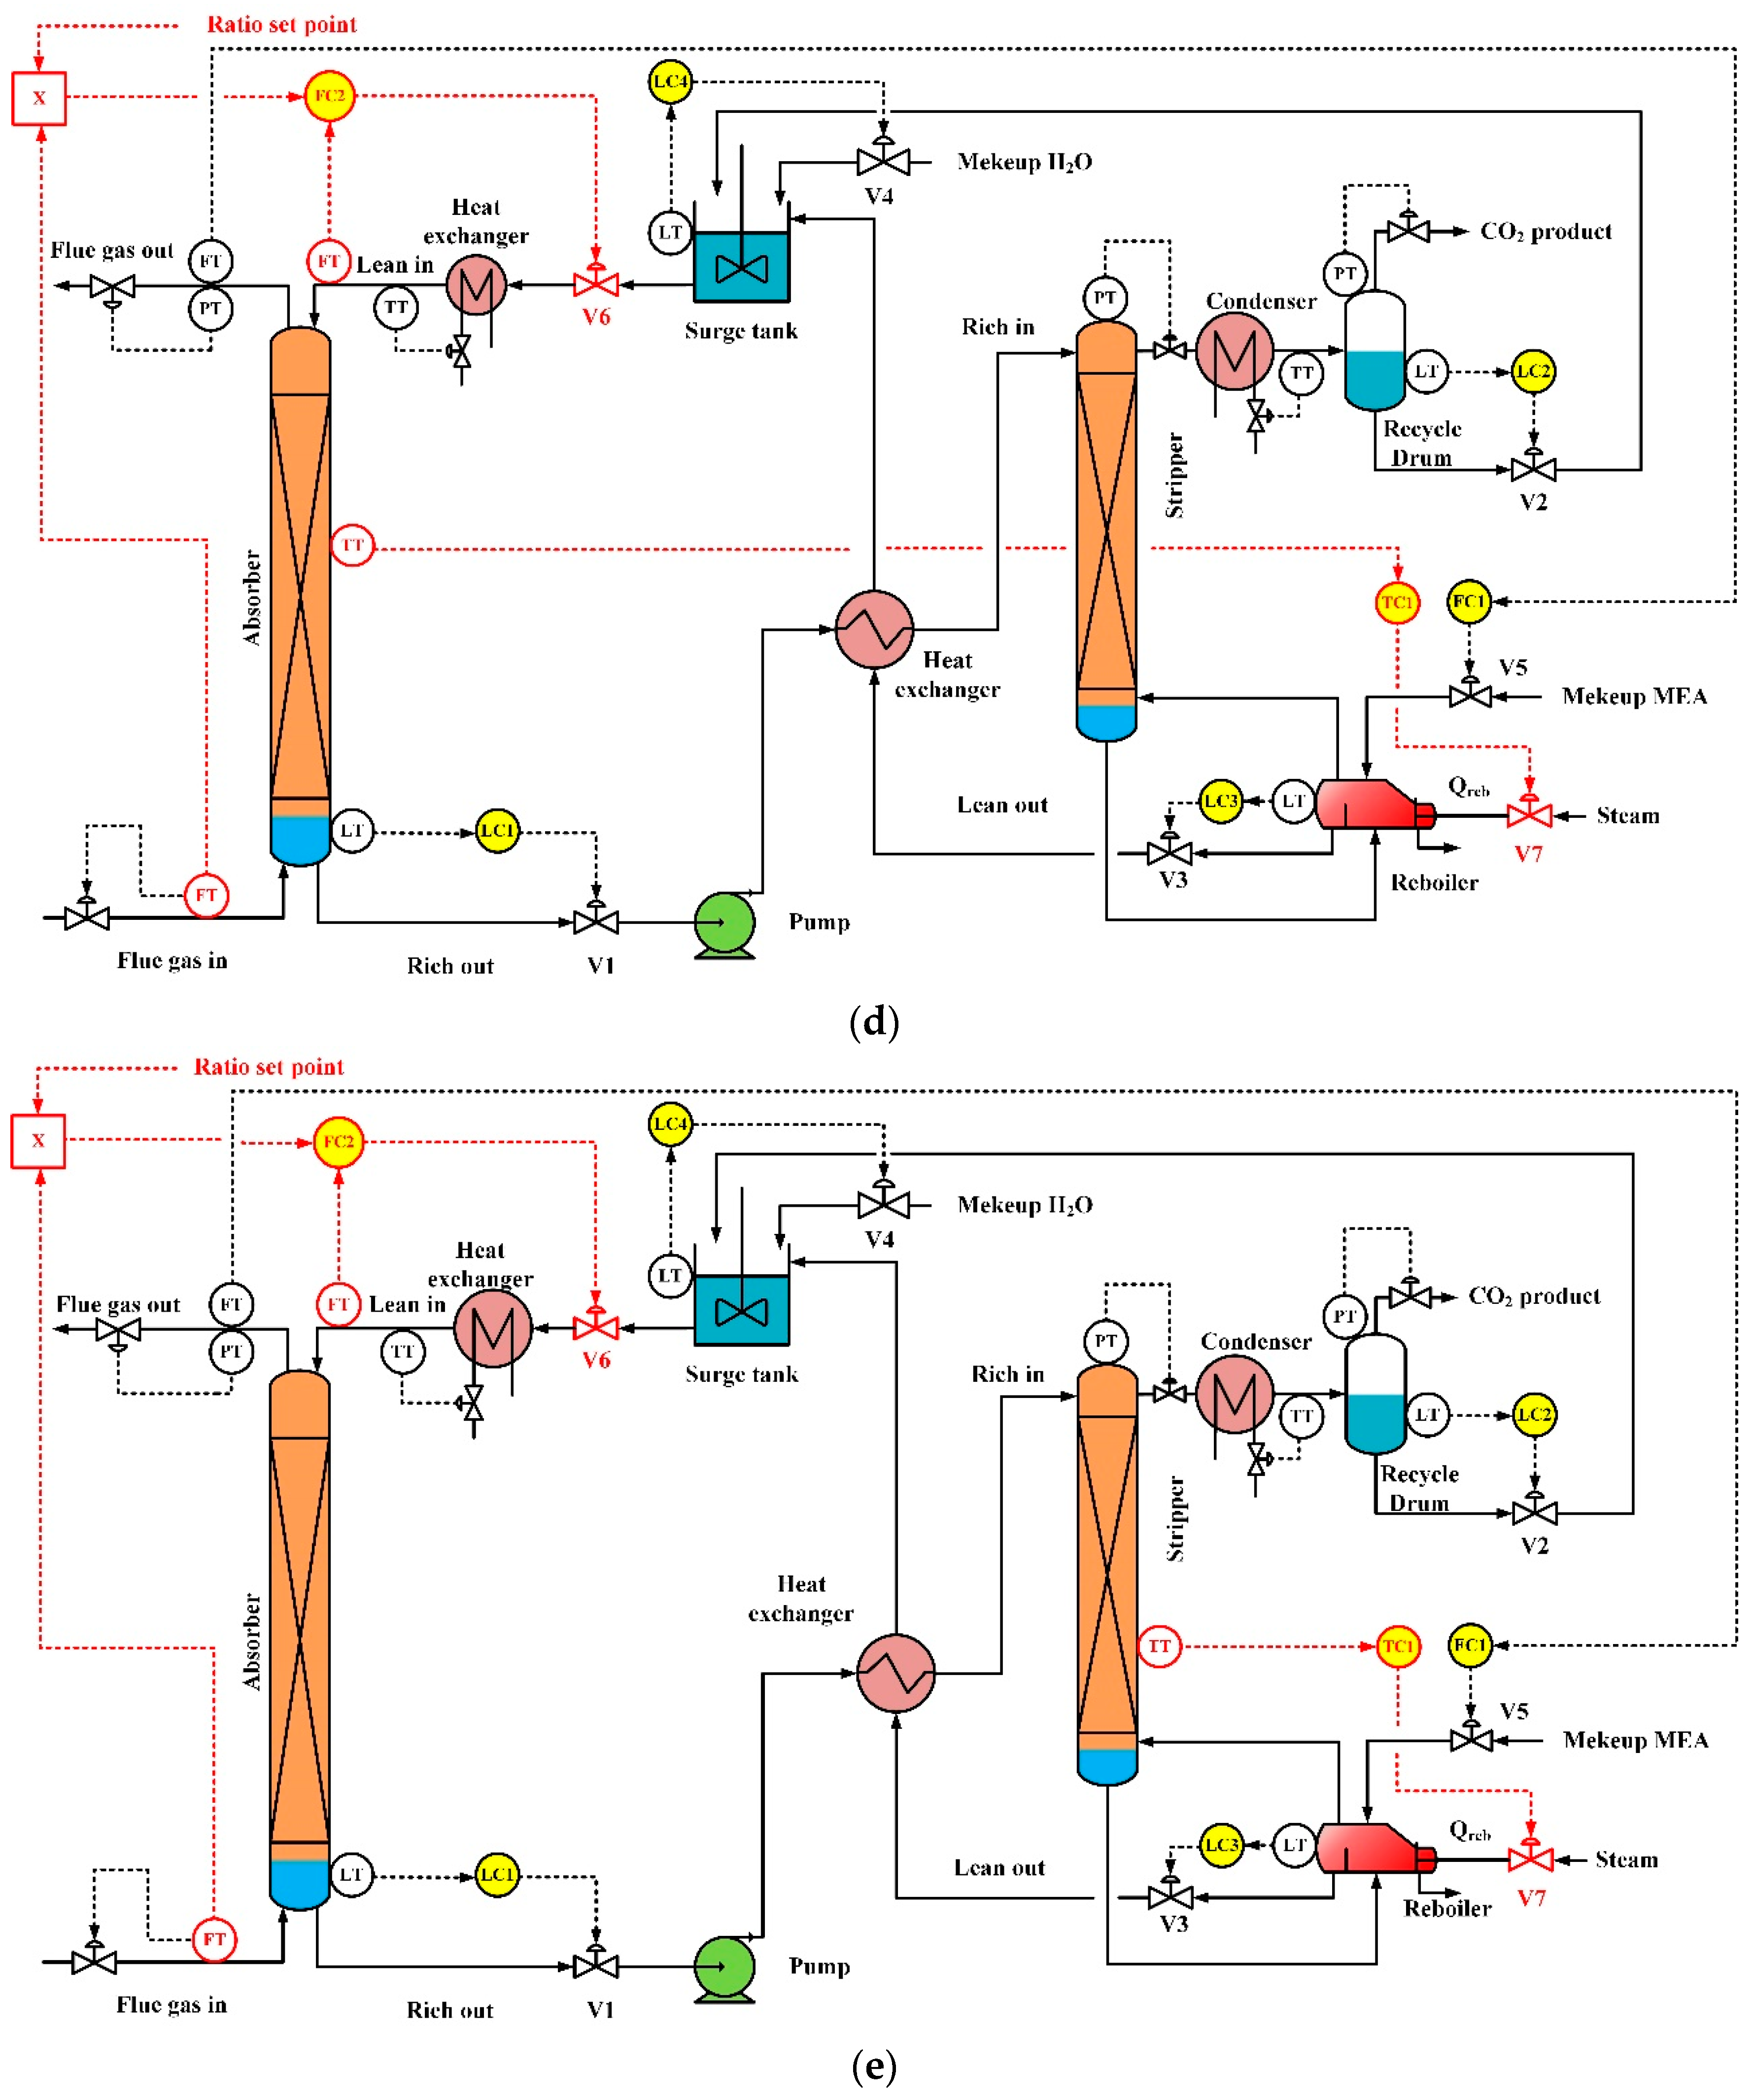
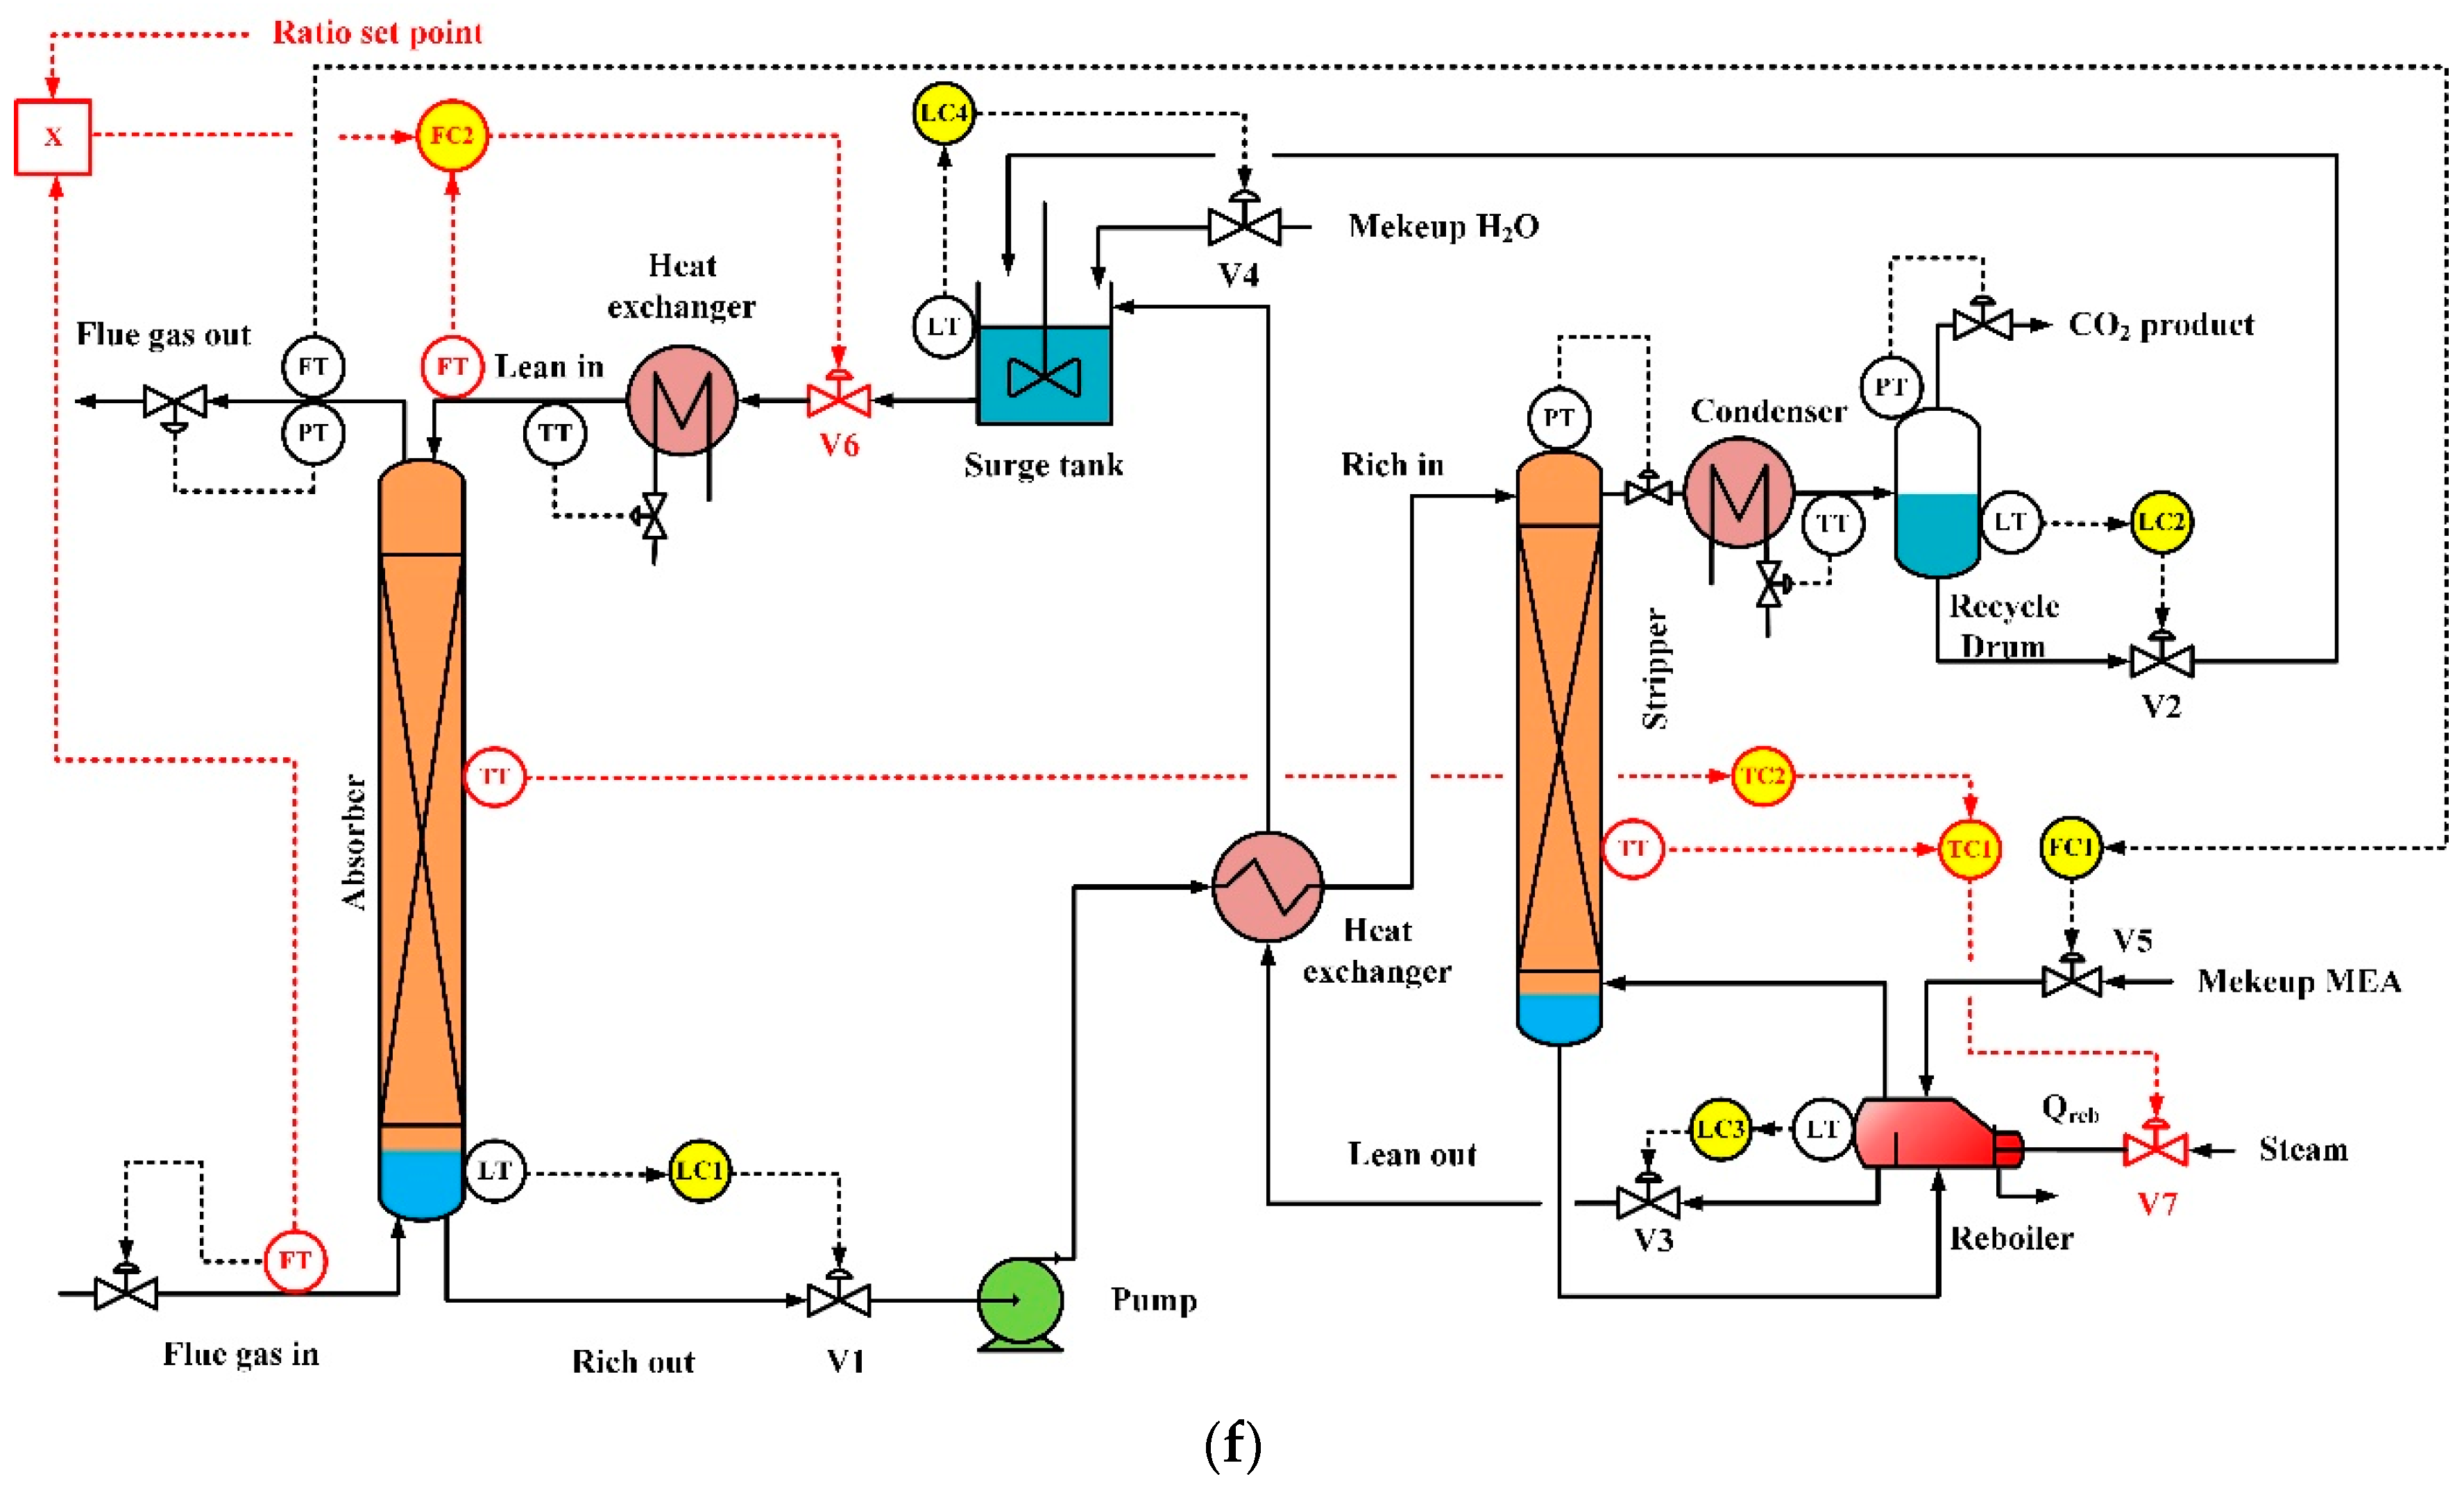
4. Control Schemes and Controller Parameters

The manipulated variables, for which control valves can be employed to adjust their values, available to the PCC process, are listed in Table 1 and depicted in Figure 3a. The seven valves, V1~V7, can be employed to set up the five inventory control loops and two quality control loops. The matches of manipulated and controlled variables for inventory control are listed in Table 1. Note that the pressure control loops of absorber and stripper, which correspond to the inventory control of the gases of the two columns, were assumed to be under perfect control with the outlet flue gas flow and CO2 product flow, respectively. Therefore, the pressure control was not included in the following discussion. The lean amine cooler and the stripper condenser are both operated using cooling water. Because of the fast dynamic responses relative to other controllers in the process, these two temperature controllers were assumed to be under perfect control and were not included in the control schemes. For all the control schemes studied in this paper, the inventory control loops are all the same. In other words, the control schemes are different only in their quality control loops.
The two manipulated variables left for the quality control were the lean solvent flow rate and the reboiler heat duty. However, the controlled variables for the quality control could be the CO2 capture efficiency (%CC), lean solvent CO2 loading (LL), temperature of a certain stage of absorber ( T abs ), temperature of a certain stage of stripper ( T str ), or the liquid to gas ratio in the absorber (LG). The control approach taken by this study was to utilize optimal operation conditions and L/G. Five control schemes were hence proposed. The control schemes, symbolized by the two controlled variables selected for the quality control and shown in Figure 3b–f, include LG-CC, LG-LL, LG- T abs , LG- T str , and LG- T abs -Cascade. The control scheme of LG- T abs -Cascade employs a cascade structure using T str and T abs as the inner-loop and outer-loop controlled variables, respectively. To serve as a benchmark for the performance evaluation of the proposed optimal-based control schemes, a typical control structure using CC and T str as the controlled variables [4,5,6,15,17,18] with fixed set-point values was included in this study. The typical control scheme is shown in Figure 3a. For the schemes employing the absorber temperature ( T abs ) as a controlled variable, the temperature of stage 6 (counted from top) of the absorber was chosen, which is the stage having the highest temperature. For the schemes adopting the stripper temperature ( T str ) as a controlled variable, as shown in Figure 3a,e,f, the temperature of stage 17 (counted from top) of the stripper was chosen, which is the stage most sensitive to the reboiler duty determined by a sensitivity analysis with different reboiler duty. Note that for the packed-type absorber and stripper, the total height of the column packing is equally discretized into 20 stages in the simulation study. As shown in Figure 3c, the bottom concentration of the stripper, instead of the concentration of the lean solvent entering the absorber, was used as the controlled variable of the lean loading control loop. This arrangement allows for faster adjustment of the reboiler steam flow rate for the variation of the stripper bottom concentration.
The tuning parameters using literature suggested values [32] or determined by open-loop IMC (Internal Model Control) method [33] for the PID (Proportional–Integral–Derivative) controllers of all the control schemes are listed in Table 2. Dead times of 6.5 min were used in all composition loops, and two first order lags of 0.5 min were used in all temperature loops [32].

5. Results and Discussion

In this section, the control performance of the studied control schemes to the disturbances of flue gas conditions, including its flowrate, CO2 concentration, and temperature, as well as the set-point change of CO2 capture efficiency, are presented and compared. The performance discussed include the dynamic responses and the IAEs (integral of absolute error) of capture efficiency and reboiler heat duty during the stabilization period.

5.1. Dynamic Responses

In this study, the disturbance or set-point changes are achieved by a step change at the time of 1 h. For all the control schemes employing CC (capture efficiency) for quality control, i.e., CC- T str and LG-CC, the set-point value of the CC controller is only adjusted for the cases of capture efficiency set-point change. For the typical control scheme CC- T str , the set-point value of T str is fixed for all the disturbance or set-point changes. For all the other five control schemes (Figure 3b–f), termed as the optimal-based control schemes, the set-point values of the controlled variables for quality control, i.e., L/G, LL, T abs , and T str , are adjusted to their optimal values at the same time as the disturbance or set-point change starts. Note that the optimal values of these controlled variables have been obtained from the steady-state optimization analysis, presented in Section 3. By this analysis approach, it implies that feedforward control is available to provide the information of disturbance changes. In this study, the dynamics of the feedforward control is not included in the simulation.
For the disturbance and set-point change cases studied, including the ±10% disturbance change of the flue gas flow rate (±800 kmol/h), ±10% disturbance change of the flue gas CO2 concentration (±1.46 vol%), ±12.5% disturbance change of the flue gas temperature (±5 °C), and the set-point change of CO2 capture efficiency from 90% to 85%, 87.5%, 92.5%, and 95%, the complete results of the dynamic responses are provided in the Supplementary Materials due to the length limitation of this paper. In the following, the results of one disturbance change case and one set-point change case are discussed.

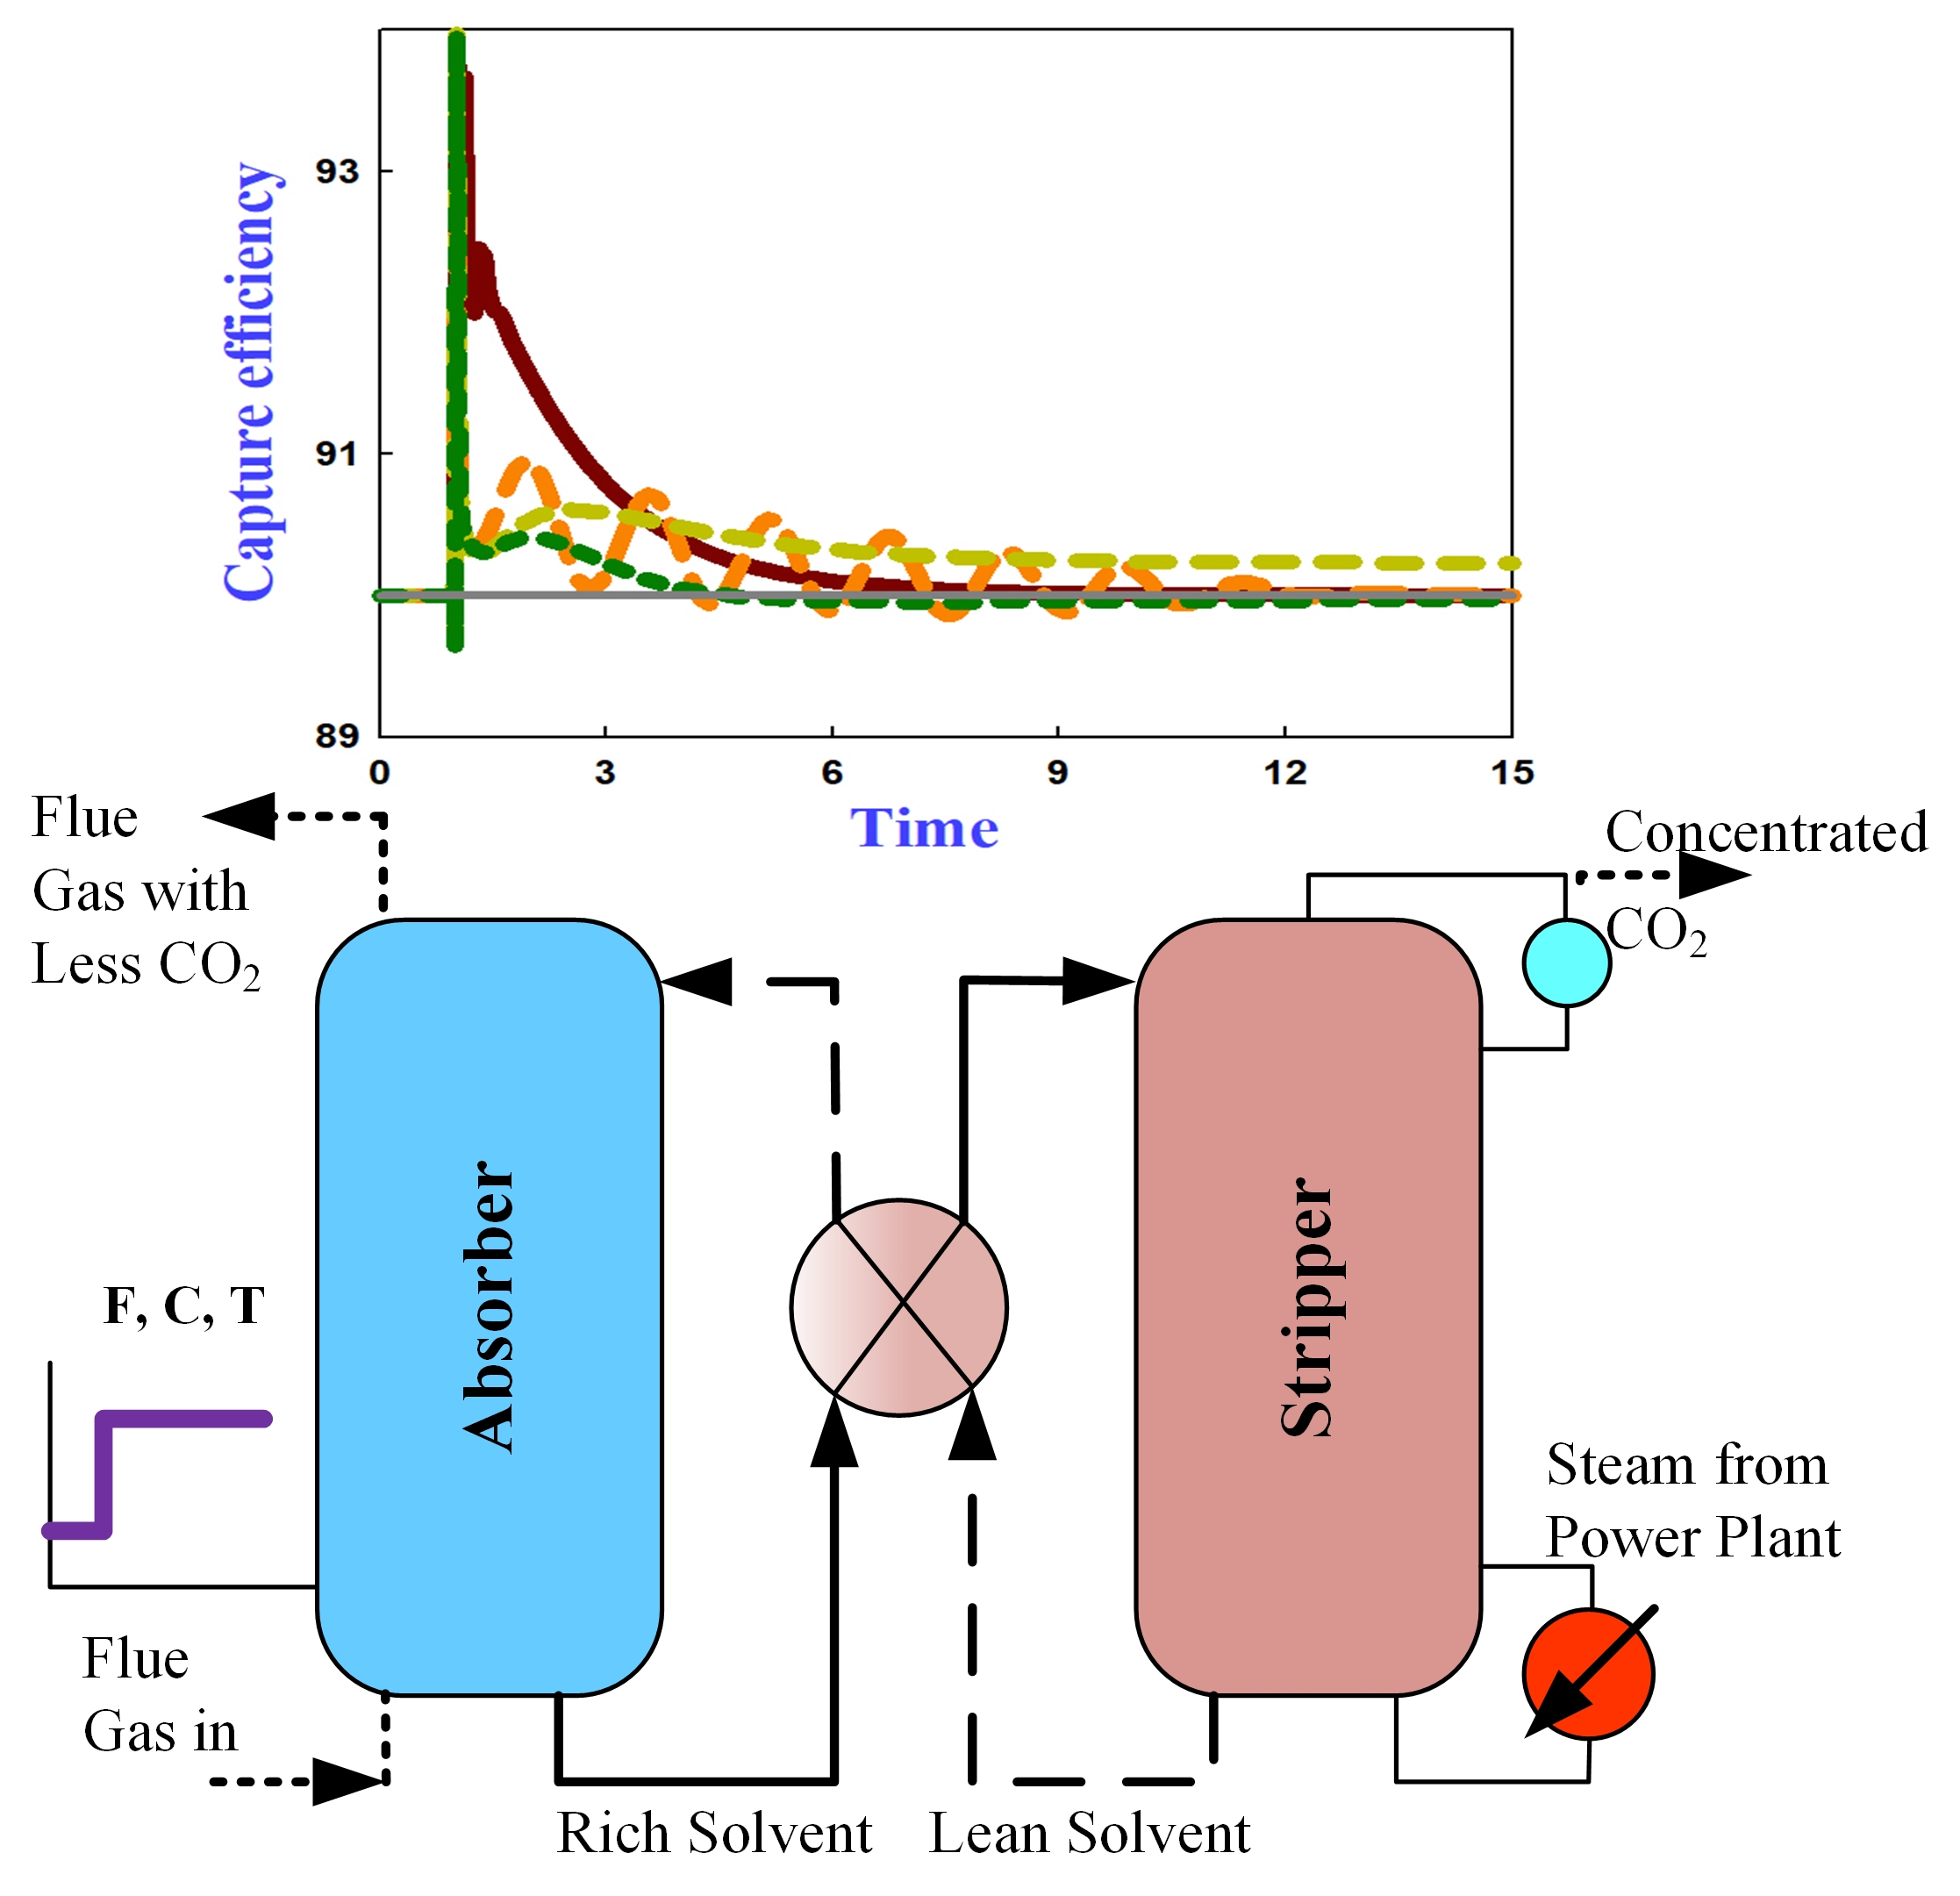
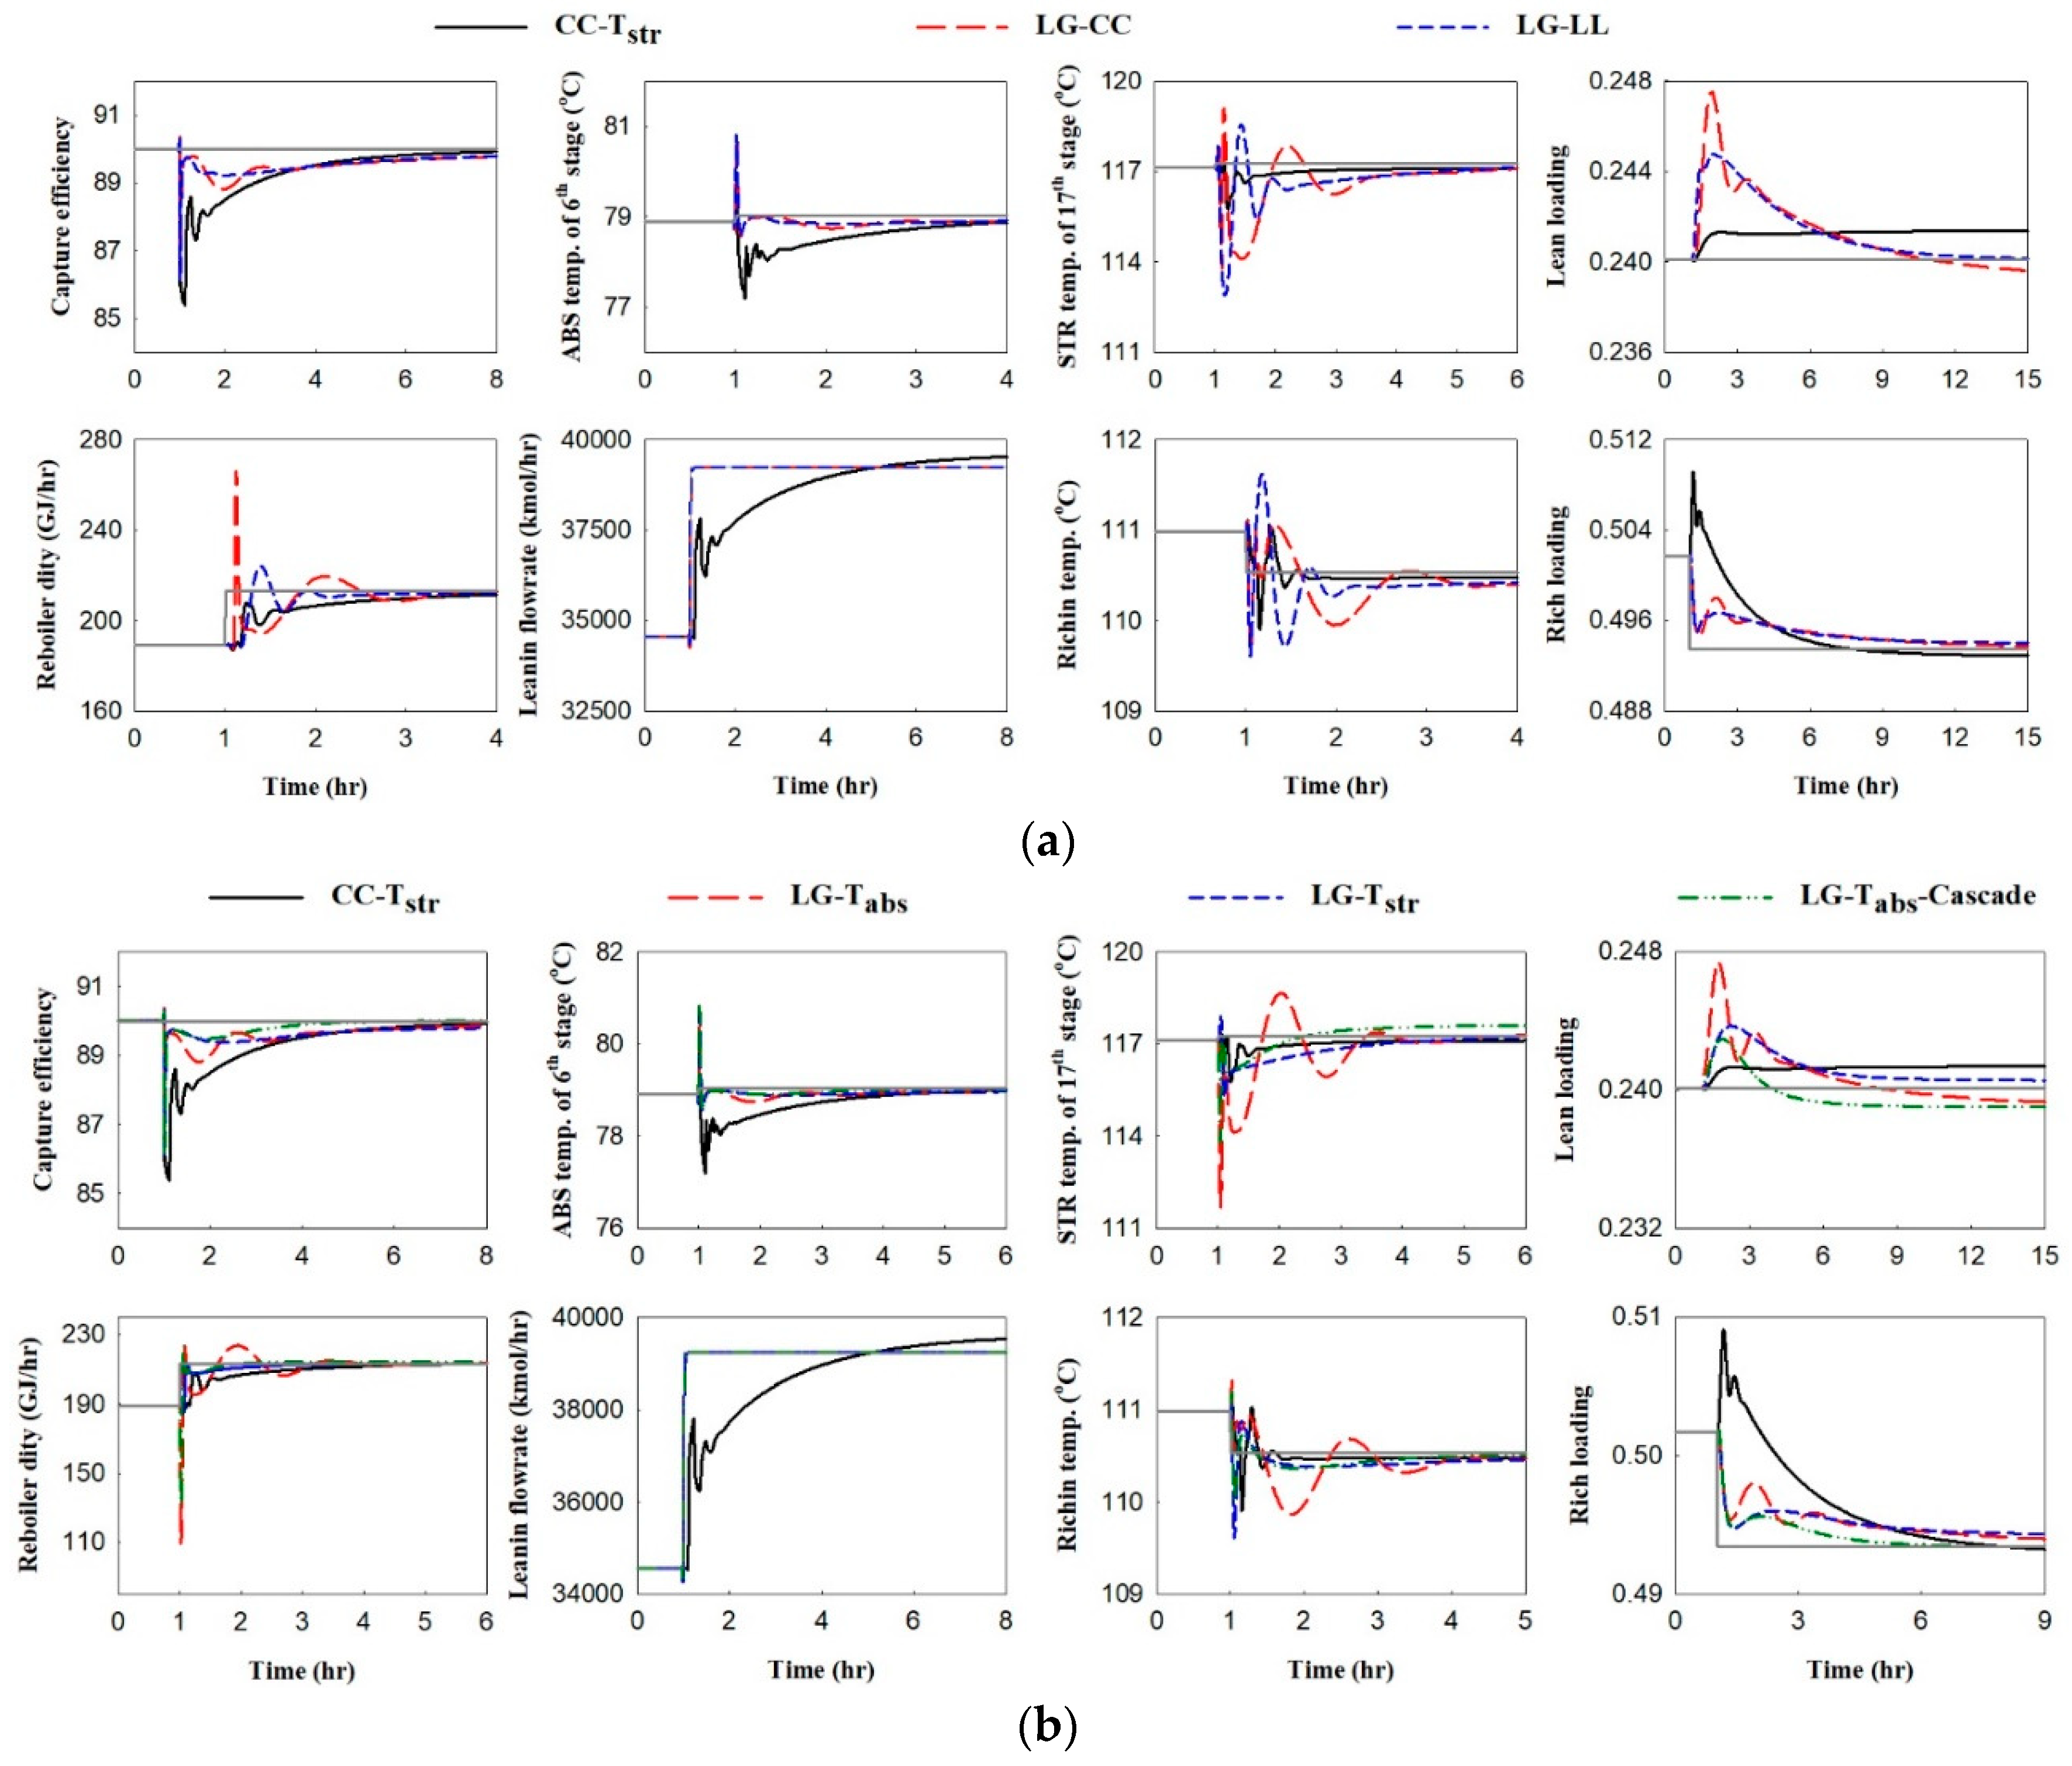
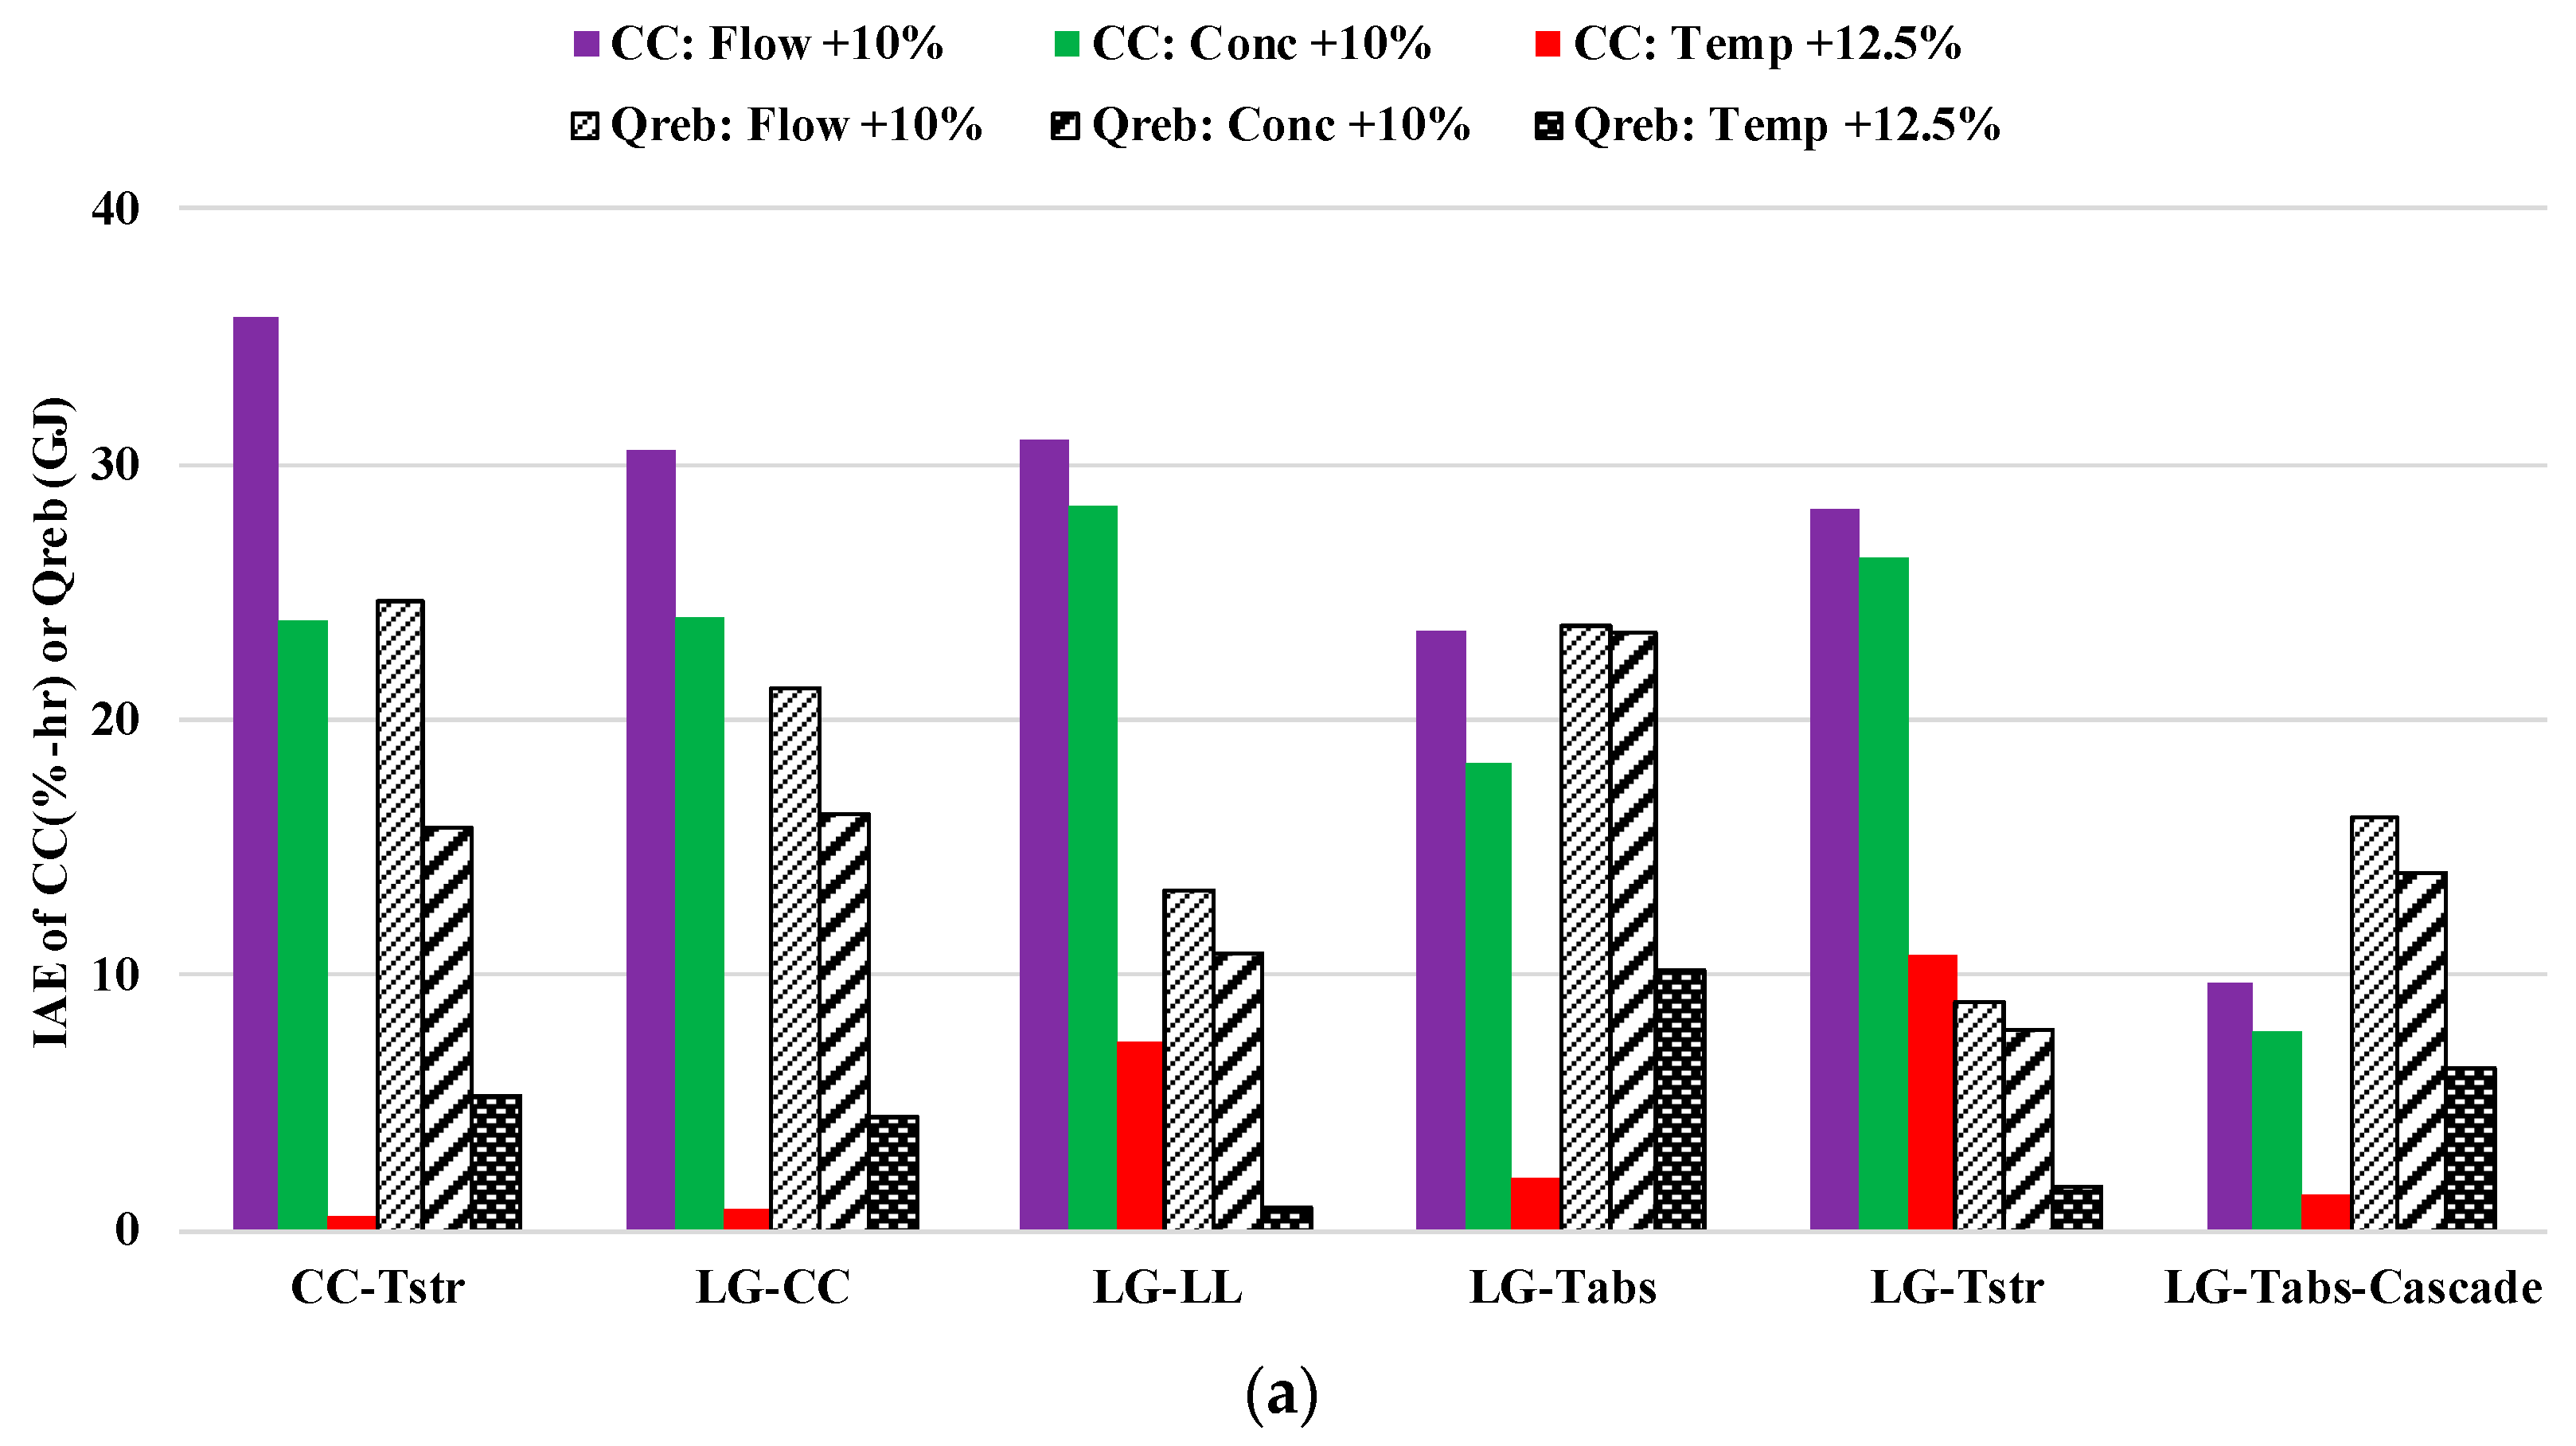
5.1.1. Disturbance in Flue Gas

For the 10% increase of flue gas flow rate, the dynamic responses of concentration-control related schemes, i.e., LG-CC and LG-LL, and the temperature-control related schemes, i.e., LG- T abs , LG- T str , and LG- T abs -Cascade, are compared to the typical control scheme CC- T str in Figure 4a,b, respectively. The characteristics revealed are summarized as below.
  • Capture efficiency: For all the control schemes, the capture efficiency sharply dropped to about 85% following the step increase of flue gas flow rate. For all the optimal-based control schemes, the capture efficiency recovers to 90% with obviously less time and less deviation from the target value than the CC- T str control scheme.
  • Reboiler heat duty: The LG-CC control responses to the initial drop of capture efficiency with an initial drastic escalation of reboiler duty because of the CC control loop. On the contrary, LG- T abs and LG- T abs -Cascade both responses with an initial drastic decrease of reboiler duty because of the control of T abs , which is quickly raised due to the greater amount of absorption resulted from the higher flue gas flow rate.
  • Solvent flow rate: For all the optimal-based control, L/G is controlled and set to its optimal value when the disturbance occurs. On the other hand, the CC- T str scheme responses with a slow increase in solvent flow rate to a higher than optimal final value.
  • Solvent loadings: For all the optimal-based schemes, the response of lean loading is stronger than that of rich loading, while the opposite is true for the CC- T str scheme. For the CC- T str scheme, the set-point of stripper temperature is not adjusted with the disturbance change; hence, it results in a smoother change in lean loading. However, the final steady value of lean loading deviates from the optimal value, i.e., 0.24. For all the optimal-based schemes, the new steady state can approach the optimal value.
  • Temperatures: Temperature-control related schemes show temperature responses with less damping, expect LG- T abs . In LG- T abs , reboiler heat duty is manipulated to control T abs , and longer response time is needed due to the involvement of many units in the control loop. When the modified scheme, i.e., LG- T abs -Cascade, is employed, the temperature responses are much improved.
Due to the minor effects on the process, the disturbance change of flue gas temperature can be easily controlled by all the control schemes, as shown in the Supplementary Information.

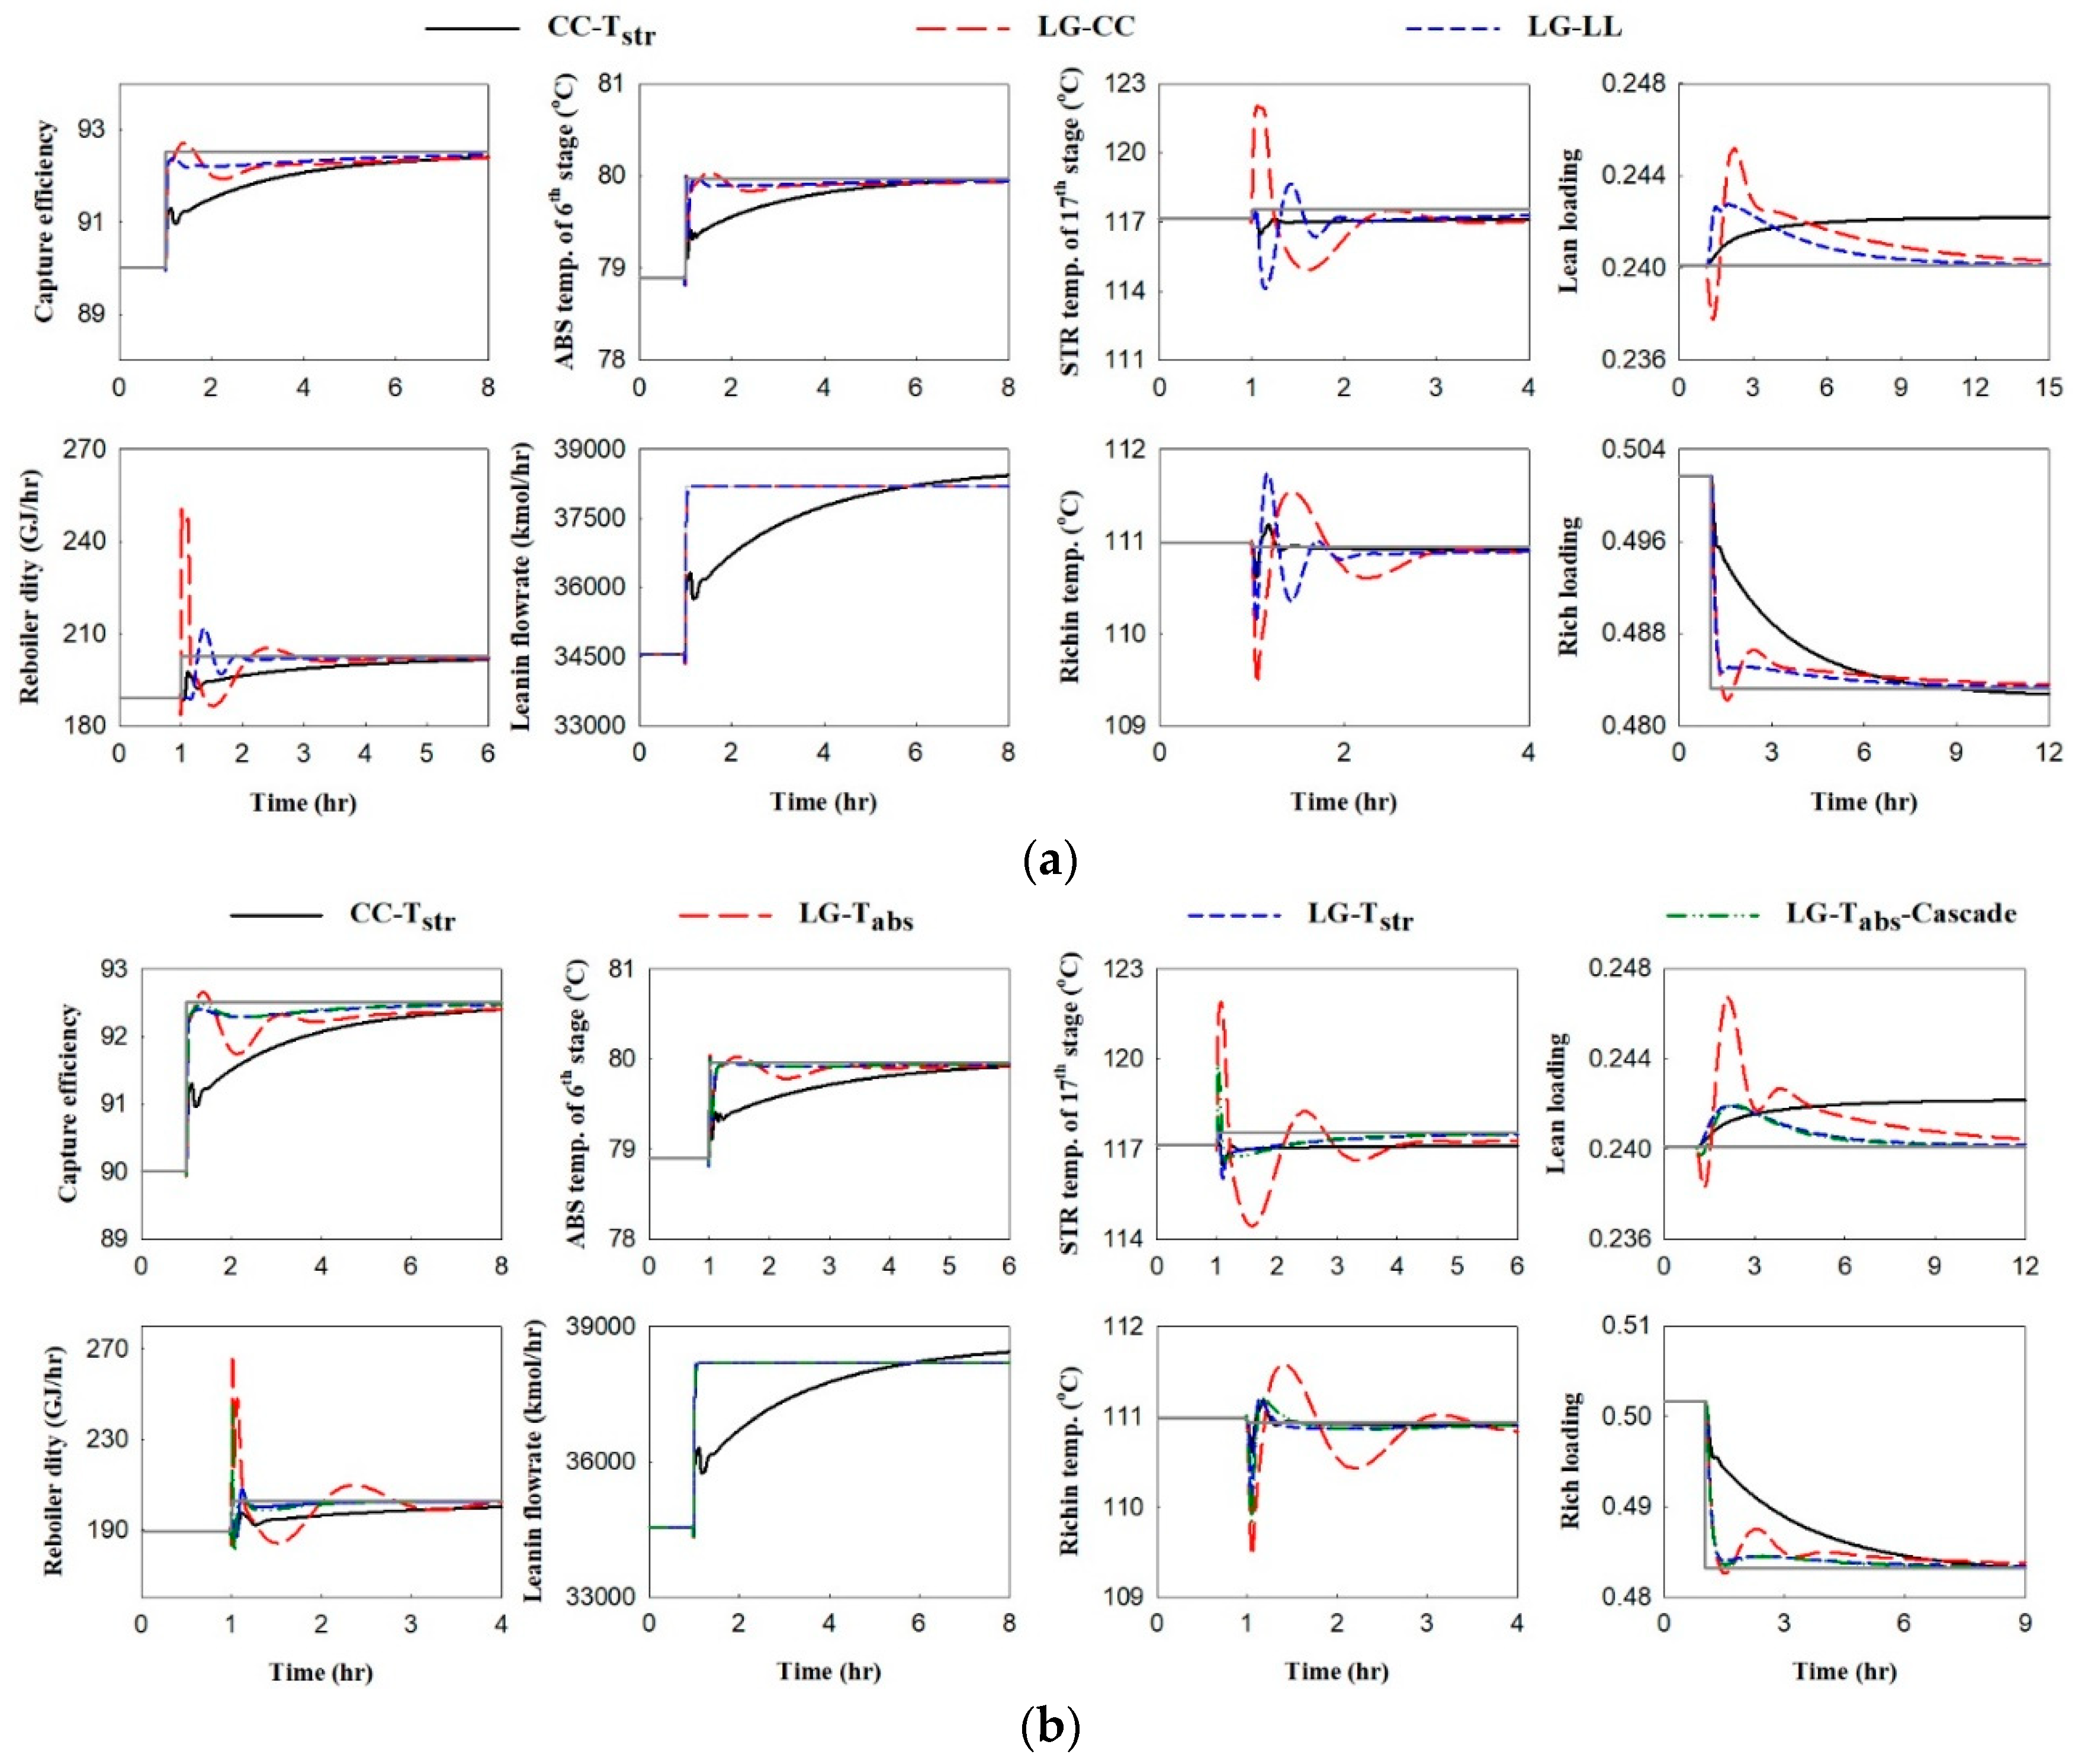
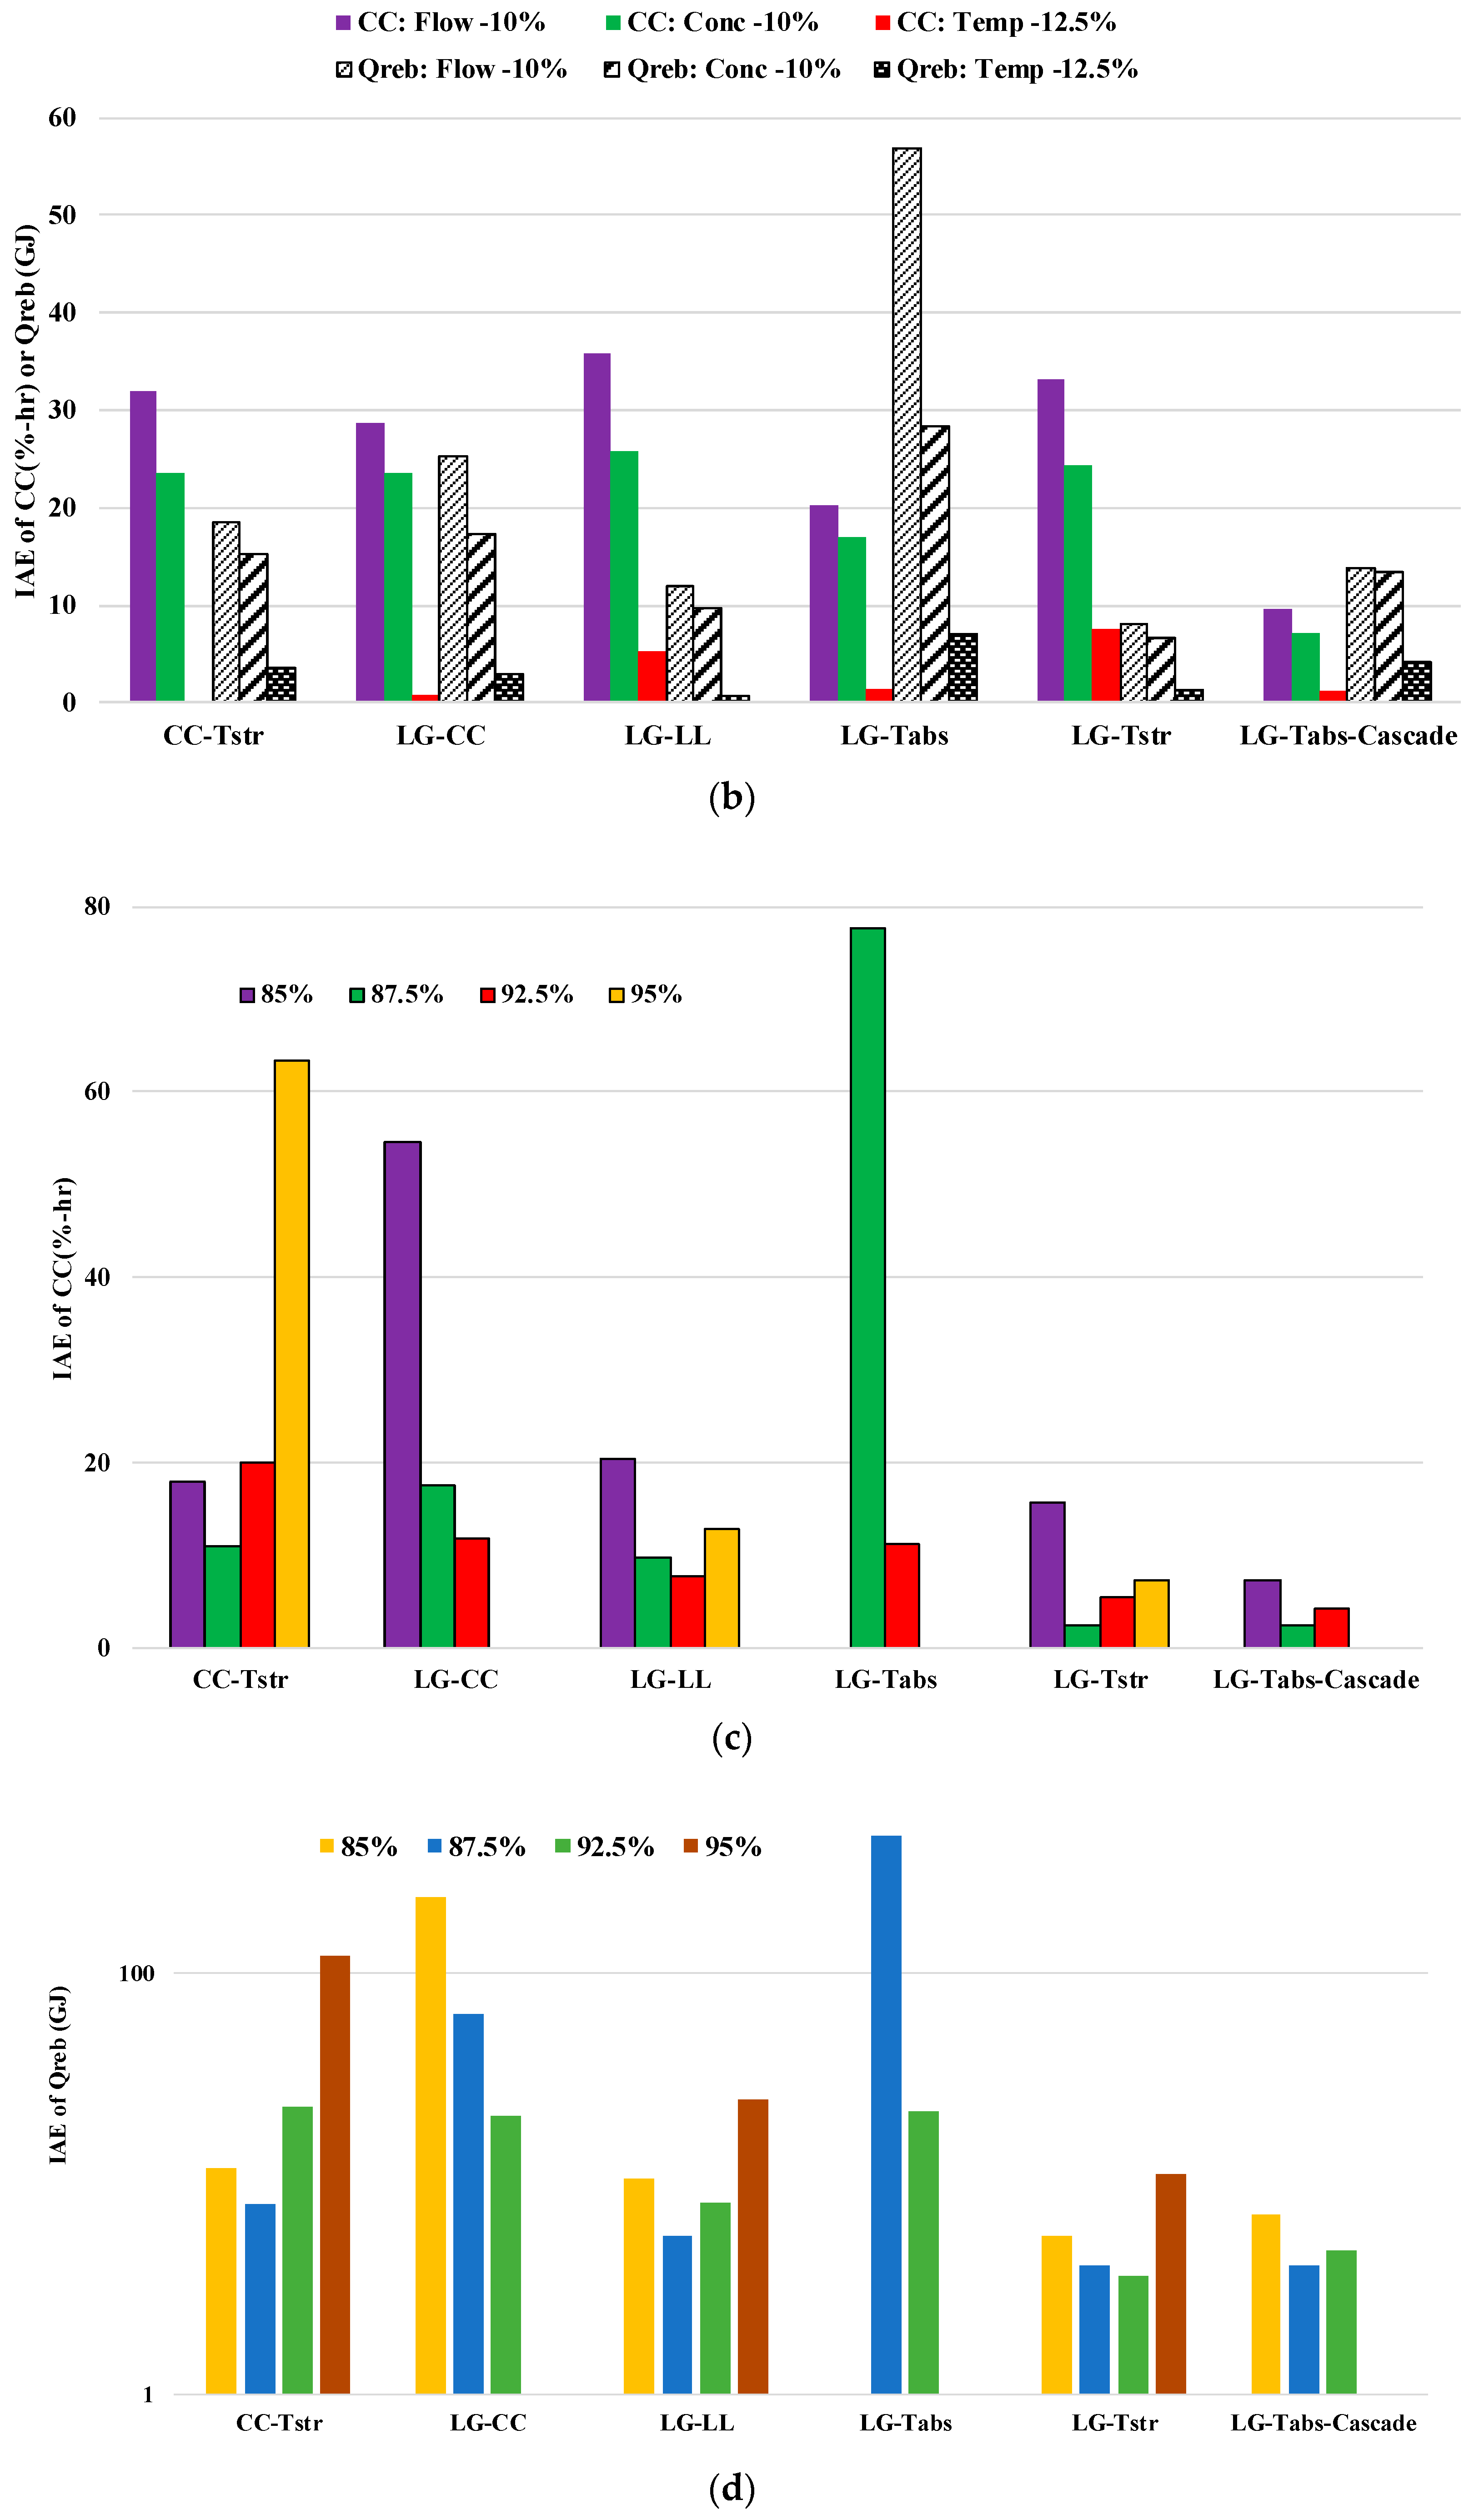
5.1.2. Capture Efficiency Set-Point Change

For the set-point change of CO2 capture efficiency from 90% to 92.5%, the dynamic responses of concentration-control related schemes and the temperature-control related schemes are compared to the typical control scheme CC- T str in Figure 5a,b, respectively. The characteristics revealed are summarized as below.
  • Capture efficiency: The capture efficiency can quickly reach the target value with all the optimal-based control schemes; however, the typical control scheme responds very slowly. Within the optimal-based control schemes, the responses of LG- T abs and LG-CC show more significant damping.
  • Reboiler heat duty: In order to obtain fast responses, the optimal-based control schemes require much higher reboiler heat duty with noteworthy damping than the CC- T str control scheme at the initial period of time.
  • Solvent flow rate: For all the optimal-based control, L/G is controlled and set to its optimal value at the same time when the set-point change of the capture efficiency is set. The solvent flow rate of CC- T str scheme increases very slowly to a higher than optimal final value.
  • Solvent loadings: For all the optimal-based schemes, the lean loading responses with more significant damping than the rich loading, while the CC- T str scheme responds slowly for both lean and rich loadings. For the CC- T str scheme, the final steady value of lean loading deviates from the optimal value, i.e., 0.24.
  • Temperatures: Temperature-control related schemes show temperature responses with less damping, expect LG- T abs . In LG- T abs , as explained above, the long reacting time of the T abs control loop results in a highly damping response. While the modified LG- T abs -Cascade scheme provides much better control.
Note that for the set-point change of capture efficiency to the highest value of 95%, feasible operation results can only be obtained for the control schemes of CC- T str , LG-LL, and LG- T str . For other control schemes, the simulation problem might be caused by the controller-action-requested operation conditions, which fall outside the limited operation ranges or converged solutions cannot be found. Feasible operation is also not attainable for the set-point change of capture efficiency to 85% while employing LG- T abs control scheme. For the equipment sizes and operation ranges determined for the capture efficiency of 90%, it is easier to face converge problems for a greater extent of capture efficiency changes, i.e., the set-point value of 85% or 95%.
On the dynamic responses, we can conclude:
  • For all the concentration-related optimal-based control schemes, employing the CC or LL control, the capture efficiency or lean loading can be well controlled.
  • For all the temperature-related optimal-based control schemes, except LG- T abs , the temperatures of the absorber, stripper, and rich solvent entering the stripper can be well controlled.
  • For all the control schemes, including the optimal-based and the typical, the capture efficiency set-point can be closely approached for disturbance changes and most of the set-point change cases.
  • For both disturbance and set-point changes, more significant damping responses are observed for LG- T abs and LG-CC control schemes. The RGA analysis results [34] confirm that inappropriate matches are used by these two schemes. The inferior performance of these two control schemes can also be explained by the longer path between the controlled variable and manipulated variable.

5.2. Stabilization Period Performance

The studied control schemes are further compared for the deviation from final target capture efficiency and reboiler heat duty during the stabilization period. The deviation is evaluated by the integral absolute error (IAE) defined for the capture efficiency and reboiler heat duty as:
% C C IAE = t 0 t f | % C C t % C C set point | dt
Q reb ,   IAE = t 0 t f | Q reb , t Q reb , target | dt
The integral time interval starts from the time disturbance or set-point change ( t 0 = 1   h ) and ends at a fixed long enough time ( t f ), which is 15 h and 20 h for the disturbance change and set-point change, respectively.
For the disturbance changes of flue gas conditions, the IAEs of %CC and Q reb of the control schemes are compared in Figure 6a,b. Considering the closeness of capture efficiency to the target value, LG- T abs -Cascade is the best control scheme, while LG- T str gives the closest reboiler heat duty profile to the optimal heat duty corresponding to the new flue gas conditions. Relative to the typical control scheme CC- T str , each of the optimal-based control schemes is superior in terms of closer capture efficiency or reboiler heat duty. Within the optimal-based control scheme, LG- T abs gives the worst outcome in the IAE of Q reb .
For the set-point change of capture efficiency, the IAEs of %CC and Q reb of the control schemes are compared in Figure 6c,d, respectively. Note that the figures show only the cases for which converged simulation results are available. Based on these IAE results, LG- T str and LG- T abs -Cascade are the best schemes for the set-point change control. Same as for the disturbance change control, LG- T abs is the worst optimal-based scheme for the set-point change control.

5.3. Effect of Model Error

Evaluation of the effect of model accuracy on the control performance is essential to ensure the validity of the above comparison and discussion on the studied control schemes. In this study, the evaluation is conducted for disturbance change cases by testing the effect of ±5% error on the optimal value of L/G, which is used as the set-point value of the LG controller in the optimal-based control schemes. The effect compared is the deviation of the final capture efficiency from the set-point value, i.e., 90%. The results for all the disturbance change cases are summarized in Table 3. Note that the ‘accurate’ case represents when there is no error in the model. For a few cases, converged dynamic simulation results cannot be obtained due to too stringent tolerance settings. Although the deviation of capture efficiency from the cases with a model error is higher than the case without model error, the deviation results are all less than 2%. Therefore, the results and discussion of control schemes’ comparison presented in the above sections are valid if reasonable model accuracy can be assumed.

6. Conclusions

For the solvent-based post-combustion carbon capture process, which is an important technology but high energy-consuming technology for the remediation of global warming problem, this paper presents the performance of five optimal-based control schemes proposed in this study. These control schemes take the approach of responding to the disturbance or set-point changes by immediately setting optimal values to the set-points of the quality controllers. Although the feedforward control to inform the disturbance change and the on-line optimization are not taken into account by this study, they can be contained in the control system. This study is limited to the stand-alone PCC process not being integrated with a model of the power plant, and that disturbances are considered for flue gas flow close to base load operation conditions or flue gas flow rate close to the full capacity of the absorber column.
Compared to a typical control scheme (CC- T str ), the optimal-based control schemes, with optimal L/G (liquid to gas ratio in the absorber) as one of the controlled variable in common, provide faster responses to the disturbance changes from the flue gas conditions and the set-point change of the CO2 capture efficiency. Within the optimal-based control schemes, LG- T str and LG- T abs -Cascade are the best schemes based on the IAEs of capture efficiency and reboiler heat duty.

Supplementary Materials

The following are available online at https://www.mdpi.com/2227-9717/7/6/366/s1, Figure S1: Dynamic responses for disturbance changes of flue gas conditions, Figure S2: Dynamic responses for set-point changes of CO2 capture efficiency.

Author Contributions

H.C., C.D.H., and Y.-H.C. developed the model and control concept. M.-T.S. and Y.-H.C. established the programs and data analysis. All authors contributed to the results, discussion, and conclusions. H.C. and Y.-H.C. prepared the manuscript.

Funding

This research was funded by the Ministry of Science and Technology of Taiwan, grant number MOST 107-2221-E-032-040.

Conflicts of Interest

The authors declare no conflict of interest.

Nomenclature

%CCpercent CO2 capture efficiency
Ddecision variables
Fflow rate (kmol/h)
Ggas flow rate (kmol/h)
IAEintegral of absolute error
Lliquid flow rate (kmol/h)
LLlean loading (kmol CO2/kmol MEA)
PCCpost-combustion carbon capture
Qheat duty (GJ/hr)
Q ¯ specific heat duty (GJ/kmol CO2)
Sprocess equipment size variables
Ttemperature (°C)
Xprocess state variables

Subscripts

absabsorber
lnlean solvent
mumakeup
MEAmonoethanolamine
rebreboiler
richrich solvent
strstripper

References

  1. The Global Status of CCS: 2018. Available online: https://www.globalccsinstitute.com/resources/global-status-report/ (accessed on 22 December 2018).
  2. Bui, M.; Gunawan, I.; Verheyen, V.; Feron, P.; Meuleman, E.; Adeloju, S. Dynamic modelling and optimization of flexible operation in post-combustion CO2 capture plants: A review. Comput. Chem. Eng. 2014, 61, 245–265. [Google Scholar] [CrossRef]
  3. Lawal, A.; Wang, M.; Stephenson, P.; Koumpouras, G.; Yeung, H. Dynamic modelling and analysis of post-combustion CO2 chemical absorption process for coal-fired power plants. Fuel 2010, 89, 2791–2801. [Google Scholar] [CrossRef]
  4. Panahi, M.; Skogestad, S. Economically efficient operation of CO2 capturing process Part II: Design of control layer. Chem. Eng. Process. 2012, 52, 112–124. [Google Scholar] [CrossRef]
  5. Moullec, Y.L.; Kanniche, M. Screening of flowsheet modifications for an efficient monoethanolamine (MEA) based post-combustion CO2 capture. Int. J. Greenh. Gas Control 2011, 5, 727–740. [Google Scholar] [CrossRef]
  6. Moullec, Y.L.; Neveux, T.; Al Azki, A.; Chikukwa, A.; Hoff, K.A. Process modifications for solvent-based post combustion CO2 capture. Energy Procedia 2014, 63, 1470–1477. [Google Scholar] [CrossRef]
  7. Abu-Zahra, M.R.M.; Schneiders, L.H.J.; Niederer, J.P.M.; Feron, P.H.M.; Versteeg, G.F. CO2 capture from power plants: Part I. A parametric study of the technical performance based on monoethanolamine. Int. J. Greenh. Gas Control 2007, 1, 37–46. [Google Scholar] [CrossRef]
  8. Abu-Zahra, M.R.M.; Niederer, J.P.M.; Feron, P.H.M.; Versteeg, G.F. CO2 capture from power plants: Part II. A parametric study of the economical performance based on mono-ethanolamine. Int. J. Greenh. Gas Control 2007, 1, 135–142. [Google Scholar] [CrossRef]
  9. Ziaii, S.; Rochelle, G.T.; Edgar, T.F. Dynamic modeling to minimize energy use for CO2 capture in power plants by aqueous monoethanolamine. Ind. Eng. Chem. Res. 2009, 48, 6105–6111. [Google Scholar] [CrossRef]
  10. Wellner, K.; Marx-Schubach, T.; Schmitz, G. Dynamic behavior of coal-fired power plants with postcombustion CO2 capture. Ind. Eng. Chem. Res. 2016, 55, 12038–12045. [Google Scholar] [CrossRef]
  11. Montañés, R.M.; GarÐarsdóttir, S.Ó.; Normann, F.; Johnsson, F.; Nord, L.O. Demonstrating load-change transient performance of a commercial-scale natural gas combined cycle power plant with post-combustion CO2 capture. Int. J. Greenh. Gas Control 2017, 63, 158–174. [Google Scholar] [CrossRef]
  12. Montañés, R.M.; Flø, N.E.; Nord, L.O. Dynamic process model validation and control of the amine plant at CO2 technology centre mongstad. Energies 2017, 10, 1527. [Google Scholar] [CrossRef]
  13. Garđarsdóttir, S.Ó.; Montañés, R.M.; Normann, F.; Nord, L.O.; Johnsson, F. Effects of CO2-absorption control strategies on the dynamic performance of a supercritical pulverized-coal-fired power plant. Ind. Eng. Chem. Res. 2017, 56, 4415–4430. [Google Scholar] [CrossRef]
  14. Martinez Castilla, G.; Biermann, M.; Montañés, R.M.; Normann, F.; Johnsson, F. Integrating carbon capture into an industrial combined-heat-and-power plant: Performance with hourly and seasonal load changes. Int. J. Greenh. Gas Control 2019, 82, 192–203. [Google Scholar] [CrossRef]
  15. Sharifzadeh, M.; Shah, N. MEA-based CO2 capture integrated with natural gas combined cycle or pulverized coal power plants: Operability and controllability through integrated design and control. J. Clean. Prod. 2019, 207, 271–283. [Google Scholar] [CrossRef]
  16. Sharifzadeh, M.; Shah, N. Carbon capture from natural gas combined cycle power plants: Solvent performance comparison at an industrial scale. AIChE 2016, 62, 166–179. [Google Scholar] [CrossRef]
  17. Panahi, M.; Skogestad, S. Economically efficient operation of CO2 capturing process Part I: Self-optimizing procedure for selecting the best controlled variables. Chem. Eng. Process. 2011, 50, 247–253. [Google Scholar] [CrossRef]
  18. Nittaya, T.; Douglas, P.L.; Croiset, E.; Ricardez-Sandoval, L.A. Dynamic modelling and control of MEA absorption processes for CO2 capture from power plants. Fuel 2014, 116, 672–691. [Google Scholar] [CrossRef]
  19. Montañés, R.M.; Flø, N.E.; Nord, L.O. Experimental results of transient testing at the amine plant at Technology Centre Mongstad: Open-loop responses and performance of decentralized control structures for load changes. Int. J. Greenh. Gas Control 2018, 73, 42–59. [Google Scholar] [CrossRef] [Green Version]
  20. Gjernes, E.; Pedersen, S.; Cents, T.; Watson, G.; Fostås, B.F.; Shah, M.I.; Hamborg, E.S. Results from 30 wt% MEA performance testing at the CO2 technology centre Mongstad. Energy Procedia 2017, 114, 1146–1157. [Google Scholar] [CrossRef]
  21. Zhang, Y.; Chen, C.-C. Modeling CO2 absorption and desorption by aqueous monoethanolamine solution with Aspen rate-based model. Energy Procedia 2013, 37, 1584–1596. [Google Scholar] [CrossRef]
  22. Aspen Technology, Inc. Aspen Plus® V10; Aspen Technology, Inc.: Bedford, MA, USA, 2018. [Google Scholar]
  23. Harun, N.; Nittaya, T.; Douglas, P.L.; Croiset, E.; Ricardez-Sandoval, L.A. Dynamic simulation of MEA absorption process for CO2 capture from power plants. Int. J. Greenh. Gas Control 2012, 10, 95–309. [Google Scholar] [CrossRef]
  24. Walters, M.S.; Edgar, T.F.; Rochelle, G.T. Dynamic modeling and control of an intercooled absorber for post-combustion CO2 capture. Chem. Eng. Process. 2016, 107, 1–10. [Google Scholar] [CrossRef]
  25. Flø, N.E.; Knuutila, H.; Kvamsdal, H.M.; Hillestad, M. Dynamic model validation of the post-combustion CO2 absorption process. Int. J. Greenh. Gas Control 2015, 41, 127–141. [Google Scholar]
  26. Zhang, Y.; Chen, H.; Chen, C.; Plaza, J.M.; Dugas, R.; Rochelle, G.T. Rate-based process modeling study of CO2 capture with aqueous monoethanolamine solution. Ind. Eng. Chem. Res. 2009, 48, 9233–9246. [Google Scholar] [CrossRef]
  27. Zhang, Q.; Turton, R.; Bhattacharyya, D. Development of model and model-predictive control of an MEA-based post-combustion CO2 capture process. Ind. Eng. Chem. Res. 2016, 55, 1292–1308. [Google Scholar] [CrossRef]
  28. van de Haar, A.; Trapp, C.; Wellner, K.; De Kler, R.; Schmitz, G.; Colonna, P. Dynamics of post-combustion CO2 capture plants: Modeling, validation, and case study. Ind. Eng. Chem. Res. 2017, 56, 1810–1822. [Google Scholar] [CrossRef] [PubMed]
  29. Chinen, A.S.; Morgan, J.C.; Omell, B.; Bhattacharyya, D.; Miller, D.C. Dynamic data reconciliation and validation of a dynamic model for solvent-based CO2 capture using pilot-plant data. Ind. Eng. Chem. Res. 2019, 58, 1978–1993. [Google Scholar] [CrossRef]
  30. Chen, Y.-H.; Shen, M.-T.; Chang, H. Dynamic modeling and control of the carbon dioxide capture process using monoethanolamine solvent. J. Appl. Sci. Eng. 2019. paper accepted. [Google Scholar]
  31. Aspen Technology, Inc. Jump Start: Aspen Custom Modeler® V8; Aspen Technology, Inc.: Bedford, MA, USA, 2015. [Google Scholar]
  32. Luyben, W.L.; Luyben, M.L. Essentials of Process Control; McGraw-Hill: New York, NY, USA, 1997. [Google Scholar]
  33. Rivera, D.E.; Morari, M.; Skogestad, S. Internal model control 4. PID controller design. Ind. Eng. Chem. Process. Des. Dev. 1986, 25, 252–265. [Google Scholar] [CrossRef]
  34. Shen, M.-T. Dynamic Simulation and Control of Carbon Dioxide Capture System Using Chemical Absorption. Master’s Thesis, Department of Chemical and Materials Engineering, Tamkang University, New Taipei City, Taiwan, 2018. [Google Scholar]
Figure 1. The CO2 capture process using monoethanolamine (MEA) solvent for a coal-fired power plant.
Processes 07 00366 g001
Figure 2. Optimal solutions for the operations for flue gas conditions (flow rate, CO2 concentration, and temperature) and capture efficiency changes under different lean loading of solvent in terms of L/G and specific reboiler duty. (a) L/G-flue gas flowrate change; (b) specific heat duty-flue gas flowrate change; (c) L/G-flue gas concentration change; (d) specific heat duty-flue gas concentration change; (e) L/G-flue gas temperature change; (f) specific heat duty-flue gas temperature change; (g) L/G-capture efficiency change; (h) specific heat duty-capture efficiency change.
Processes 07 00366 g002aProcesses 07 00366 g002b
Figure 3. Control schemes proposed for the PCC process where scheme (a) is a typical one and schemes (bf) are based on optimal operation conditions. The inventory control loops are the same in all control schemes. The two quality control loops in each control scheme are shown in red. The disturbances of ±10% around base load case are studied. (a) CC- T str ; (b) LG-CC; (c) LG-LL; (d) LG- T abs ; (e) LG- T str ; (f) LG- T abs -Cascade. LG: liquid to gas ratio; Tstr: the temperature of a stage of a stripper; Tabs: the temperature of a stage of the absorber.
Processes 07 00366 g003aProcesses 07 00366 g003bProcesses 07 00366 g003cProcesses 07 00366 g003d
Figure 4. Dynamic responses for disturbance of flue gas flow rate with a 10% increase. The subfigures show the responses of the controlled variables (capture efficiency, lean loading, absorber temperature, and stripper temperature) and major process variables (lean solvent flow rate, reboiler duty, and the loading and temperature of the rich solvent). In both figures (a,b), the traditional control scheme (CC- T str ) responses are included for comparison. For all the control schemes, the original capture efficiency can be restored with the same reboiler duty at the new steady state. (a) concentration-control related schemes; (b) temperature-control related schemes.
Processes 07 00366 g004
Figure 5. Dynamic responses for set-point change of CO2 capture efficiency from 90% to 92.5%. The subfigures show the responses of the controlled variables (capture efficiency, lean loading, absorber temperature, and stripper temperature) and major process variables (lean solvent flow rate, reboiler duty, and the loading and temperature of the rich solvent). In both figures (a) and (b), the traditional control scheme (CC- T str ) responses are included for comparison. For all the control schemes, the new capture efficiency set-point can be met with the same reboiler duty at the new steady state. (a) concentration-control related schemes; (b) temperature-control related schemes.
Processes 07 00366 g005
Figure 6. Integral of absolute errors (IAEs) of CO2 capture efficiency (CC) and reboiler heat duty ( Q reb ) during the stabilization period for disturbance and set-point changes. A higher value of IAE indicates a greater extent deviation from the target capture efficiency or a higher reboiler duty demand. (a) Increase of flue gas conditions; (b) decrease of flue gas conditions; (c) IAE of %CC for set-point change of CO2 capture efficiency; (d) IAE of Q reb for set-point change of CO2 capture efficiency (in logarithm scale).
Processes 07 00366 g006aProcesses 07 00366 g006b
Table 1. Manipulated and controlled variables available for configuring control structures.
Manipulated VariableControlled Variable
Inventory Control
Absorber rich outflow rate ( F richout ) (V1)Absorber sump liquid level ( L abs )
Stripper lean outflow rate ( F leanout ) (V3)Stripper sump liquid level ( L str )
Reflux drum condensate flow rate ( F cond ) (V2)Reflux drum liquid level ( L refluxdrum )
Makeup H2O flow rate ( F H 2 O , mu ) (V4)Surge tank liquid level ( L surgetank )
Makeup MEA flow rate ( F MEA , mu ) (V5)Solvent MEA concentration ( C MEA )
Quality control
Absorber lean inflow rate ( F leanin ) (V6)CO2 capture efficiency (%CC)
Reboiler heat duty ( Q reb ) (V7)Lean loading (LL)
Stripper temperature ( T str )
Absorber temperature ( T abs )
Liquid to gas ratio in the absorber (LG)
Table 2. Tuning parameters of the Proportional–Integral–Derivative (PID) controllers for the same inventory controllers used for all control schemes and for the quality controllers of each control scheme.
Controllers and Control SchemesGainIntegral Time (min)Derivative Time (min)
Level controllers for all schemes 12.0-
Flow controllers for CC- T str 21.5432.5-
Flow controllers for other schemes 10.50.30.1
Temperature controllers 2
CC- T str 0.8717.74-
LG-CC26.59231.81-
LG-LL1.25139.54-
LG- T abs 6.174.66-
LG- T str 1.7462.65-
LG- T abs -Cascade74.95143.84-
Notes: 1. Luygen and Luygen [32]; 2. Internal Model Control (IMC) method. CC: capture capacity, LG: liquid to gas ratio, Tstr: the temperature of a stage of a stripper, Tabs: the temperature of a stage of the absorber, Cascade: cascade control structure.
Table 3. Effect of model error on the deviation of CO2 capture efficiency (%) by testing ±5% error on the optimal values of the controlled variables.
CaseLG-CCLG-LLLG-TabsLG-TstrLG-Tabs-Cascade
+10% change of flue gas flow rate
Accurate−0.05−0.12−0.02−0.180.03
Error +5%−0.01−1.600.59−1.540.60
Error −5%0.001.14−1.060.97−1.03
−10% change of flue gas flow rate
Accurate0.040.160.000.23−0.03
Error +5%−1.87−1.640.91
Error −5%1.79−1.061.73−1.07
+10% change of flue gas concentration
Accurate−0.04−0.12−0.01−0.170.03
Error +5%−0.01−1.93−1.850.67
Error −5%0.01−1.52−1.01−1.320.93
−10% change of flue gas concentration
Accurate0.010.120.010.17−0.03
Error +5%0.00−1.010.871.22−0.97
Error −5%0.001.46−1.141.40−1.14
+12.5% change of flue gas temperature
Accurate0.000.07−0.010.11−0.01
Error +5%0.00−1.710.85−1.530.85
Error −5%0.00−1.740.76−1.630.78
−12.5% change of flue gas temperature
Accurate0.00−0.050.01−0.080.01
Error +5%0.001.53−1.021.45−1.01
Error −5%0.001.36−1.111.22−1.10
CC: capture capacity, LG: liquid to gas ratio, Tstr: the temperature of a stage of a stripper, Tabs: the temperature of a stage of the absorber, Cascade: cascade control structure.

