Article

Hybrid Approach for Optimisation and Analysis of Palm Oil Mill

1
Department of Chemical and Environmental Engineering, The University of Nottingham Malaysia Campus, Broga Road, 43500 Semenyih, Malaysia
2
School of Engineering and Physical Sciences, Heriot-Watt University Malaysia, 62200 Putrajaya, Wilayah Persekutuan Putrajaya, Malaysia
3
Centre for Engineering and Sustainable Development Research, De La Salle University, 2401 Taft Avenue, 0922 Manila, Philippines
*
Author to whom correspondence should be addressed.
Processes 2019, 7(2), 100; https://doi.org/10.3390/pr7020100
Submission received: 11 January 2019 / Revised: 9 February 2019 / Accepted: 11 February 2019 / Published: 15 February 2019
(This article belongs to the Special Issue Process Design, Integration, and Intensification)

Abstract

:
A palm oil mill produces crude palm oil, crude palm kernel oil and other biomass from fresh fruit bunches. Although the milling process is well established in the industry, insufficient research and development reported in optimising and analysing the operations of a palm oil mill. The performance of a palm oil mill (e.g., costs, utilisation and flexibility) is affected by factors such as operating time, capacity and fruit availability. This paper presents a hybrid combined mathematical programming and graphical approach to solve and analyse a palm oil mill case study in Malaysia. The hybrid approach consists of two main steps: (1) optimising a palm oil milling process to achieve maximum economic performance via input-output optimisation model (IOM); and (2) performing a feasible operating range analysis (FORA) to study the utilisation and flexibility of the developed design. Based on the optimised results, the total equipment units needed is reduced from 39 to 26 unit, bringing down the total capital investment by US$6.86 million (from 18.42 to 11.56 million US$) with 23% increment in economic performance (US$0.82 million/y) achieved. An analysis is presented to show the changes in utilisation and flexibility of the mill against capital investment. During the peak crop season, the utilisation index increases from 0.6 to 0.95 while the flexibility index decreases from 0.4 to 0.05.

1. Introduction

Oil palm (Elaeis guineensis) is cultivated for the production of fresh fruit bunches (FFBs) due to its stability, high yield and low cost [1,2]. FFBs are then can be converted into a variety of products including foods, cosmetics, detergents and biofuels. To date, approximately 85% of global crude palm oil (CPO) is produced in Indonesia and Malaysia [
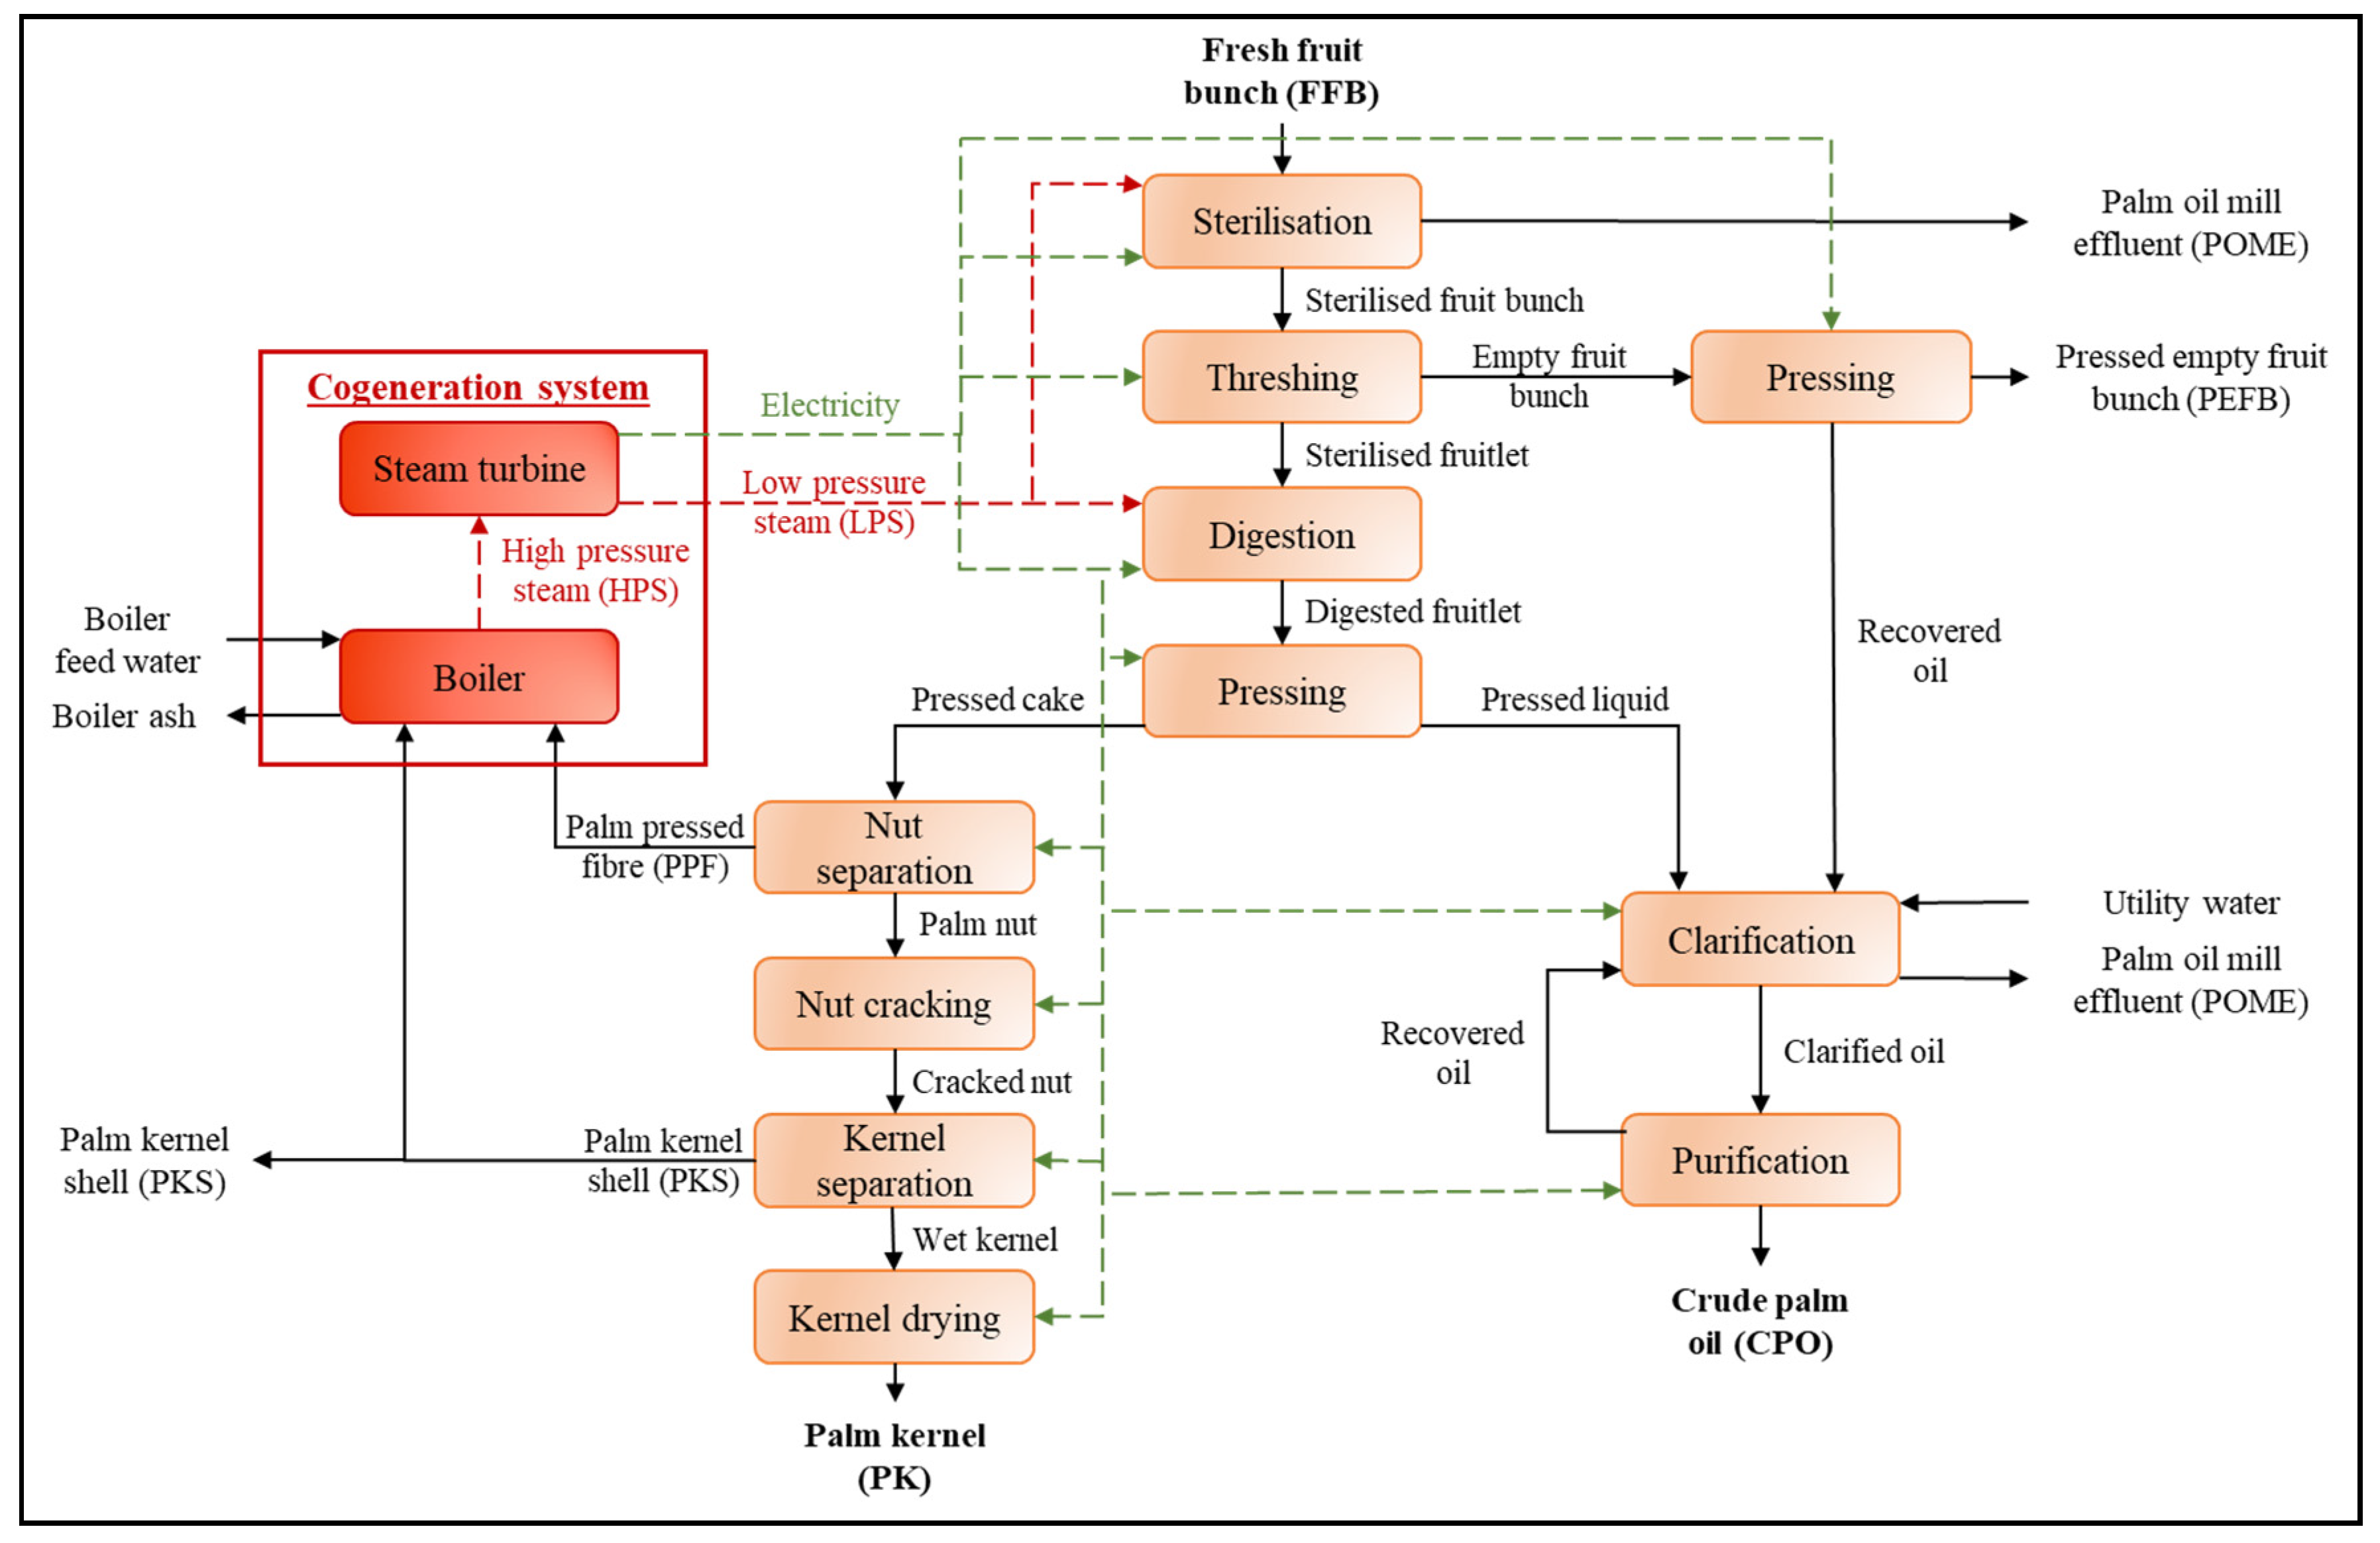
3]. CPO is extracted from FFBs in processing facilities known as palm oil mills (POM). A typical milling process consists of several operational units as shown in Figure 1. FFBs undergo sterilisation, threshing, digestion and pressing to produce pressed liquid and cake. The pressed liquid is clarified and purified to produce CPO, while the pressed cake undergoes nut separation, nut cracking, kernel separation and drying to produce palm kernel (PK). Most POMs in Malaysia will send the PK to a kernel crushing plant for crude palm kernel oil (CPKO) production [4] before refinery processes where CPO and CPKO are refined into higher quality edible oils and fats [5]. Throughout the milling process, biomass such as palm kernel shell (PKS), pressed empty fruit bunch (PEFB) and palm pressed fibre (PPF) are generated as by-products. Meanwhile, large amounts of strong wastewater, which is known as palm oil mill effluent (POME) are produced during sterilisation and clarification operations.
POMs are usually located near to the plantations, which usually are in remote areas to minimise logistics costs. In Malaysia, 63% of the active POMs are positioned far away (>10 km) from electrical grid connection point [7], leaving them at a disadvantage as they would require steam and electricity for CPO extraction. Abdullah and Sulaiman [8] estimated that 0.075–0.1MWh electricity and 2.5 t of low-pressure steam (LPS) are required per ton of CPO produced. In current practice, over three-quarters of over 400 POMs in Malaysia met the process steam and electricity demands by burning PPF and a portion of PKS generated from the milling process [9,10] via co-generation [11]. Excess PKS can then be sold as an alternative solid fuel around the world [12,13], while PEFB is returned to plantations as mulching materials [14] or composted to produce biofertilizer [15]. The biomass can also be used for a range of other applications (e.g., pellet, dried long fibre, etc.). Meanwhile, pond-based wastewater treatment systems are commonly used to treat POME before discharge [16].
Yu-Lee [17] stated that the processing capacity of a plant or system depends on the labour, equipment, technology and materials available. In this sense, POMs would have their unique design features and the operations of each mill may differ between one another. For instance, the capacity of a typical POM could range between 20 to 90 t/h of FFB, with operations up to 19 h every day [18]. Besides, ripe FFBs collected from plantations must be transported and processed immediately in POMs to prevent degradation of CPO quality due to increased free fatty acid content [19]. The amount of FFBs supplied to a POM could vary depending on location and time, due to seasonal crop changes and possible unforeseen circumstances in the plantations [6,20]. To overcome these issues, most plants or systems including POM are often built with an excess capacity to ensure higher flexibility [21] and lower processing costs (i.e., labour, service and maintenance costs) [22]. However, this affects the utilisation and economic performance of POM, especially during the lean crop season.
According to the literature, there are several methods developed to optimise and analyse the performance of systems; one of the commonly used methods is input-output (IO) model. IO model was first developed by Leontief [23] to deal with the interdependencies between system components (e.g., materials, processes, costs) using systems of linear equations. IO models are used to study the behaviour of a system when the input or output of one system component changes quantitatively [24]. Some notable works on IO model have been presented to analyse economic networks [23], industrial networks [25], chemical industry supply chains [26], food manufacturing plants [27] and life cycle assessment [28,29]. IO optimisation models (IOM) have also been developed based on the general IO methodology. IOM has been successfully applied for industrial complexes [30,31], biorefineries [32], sustainable industrial systems [33], human resources [34] and palm oil plantations [35] to make the best use of situation, goods or production capacity.
Apart from IOM, graphical approaches have been developed to analyse system performance. Graphical approaches provide visual assistance in analysing scientific data and communicating quantitative information [36]. Some of the well-known graphical approaches are the insight-based pinch analysis technique [37] and process graph, also known as P-graph [38]. Detailed information and applications of such approaches have been reviewed and discussed by Linnhoff [39], Foo [40], and Teng et al. [41]. Recently, Andiappan et al. [42] proposed the 
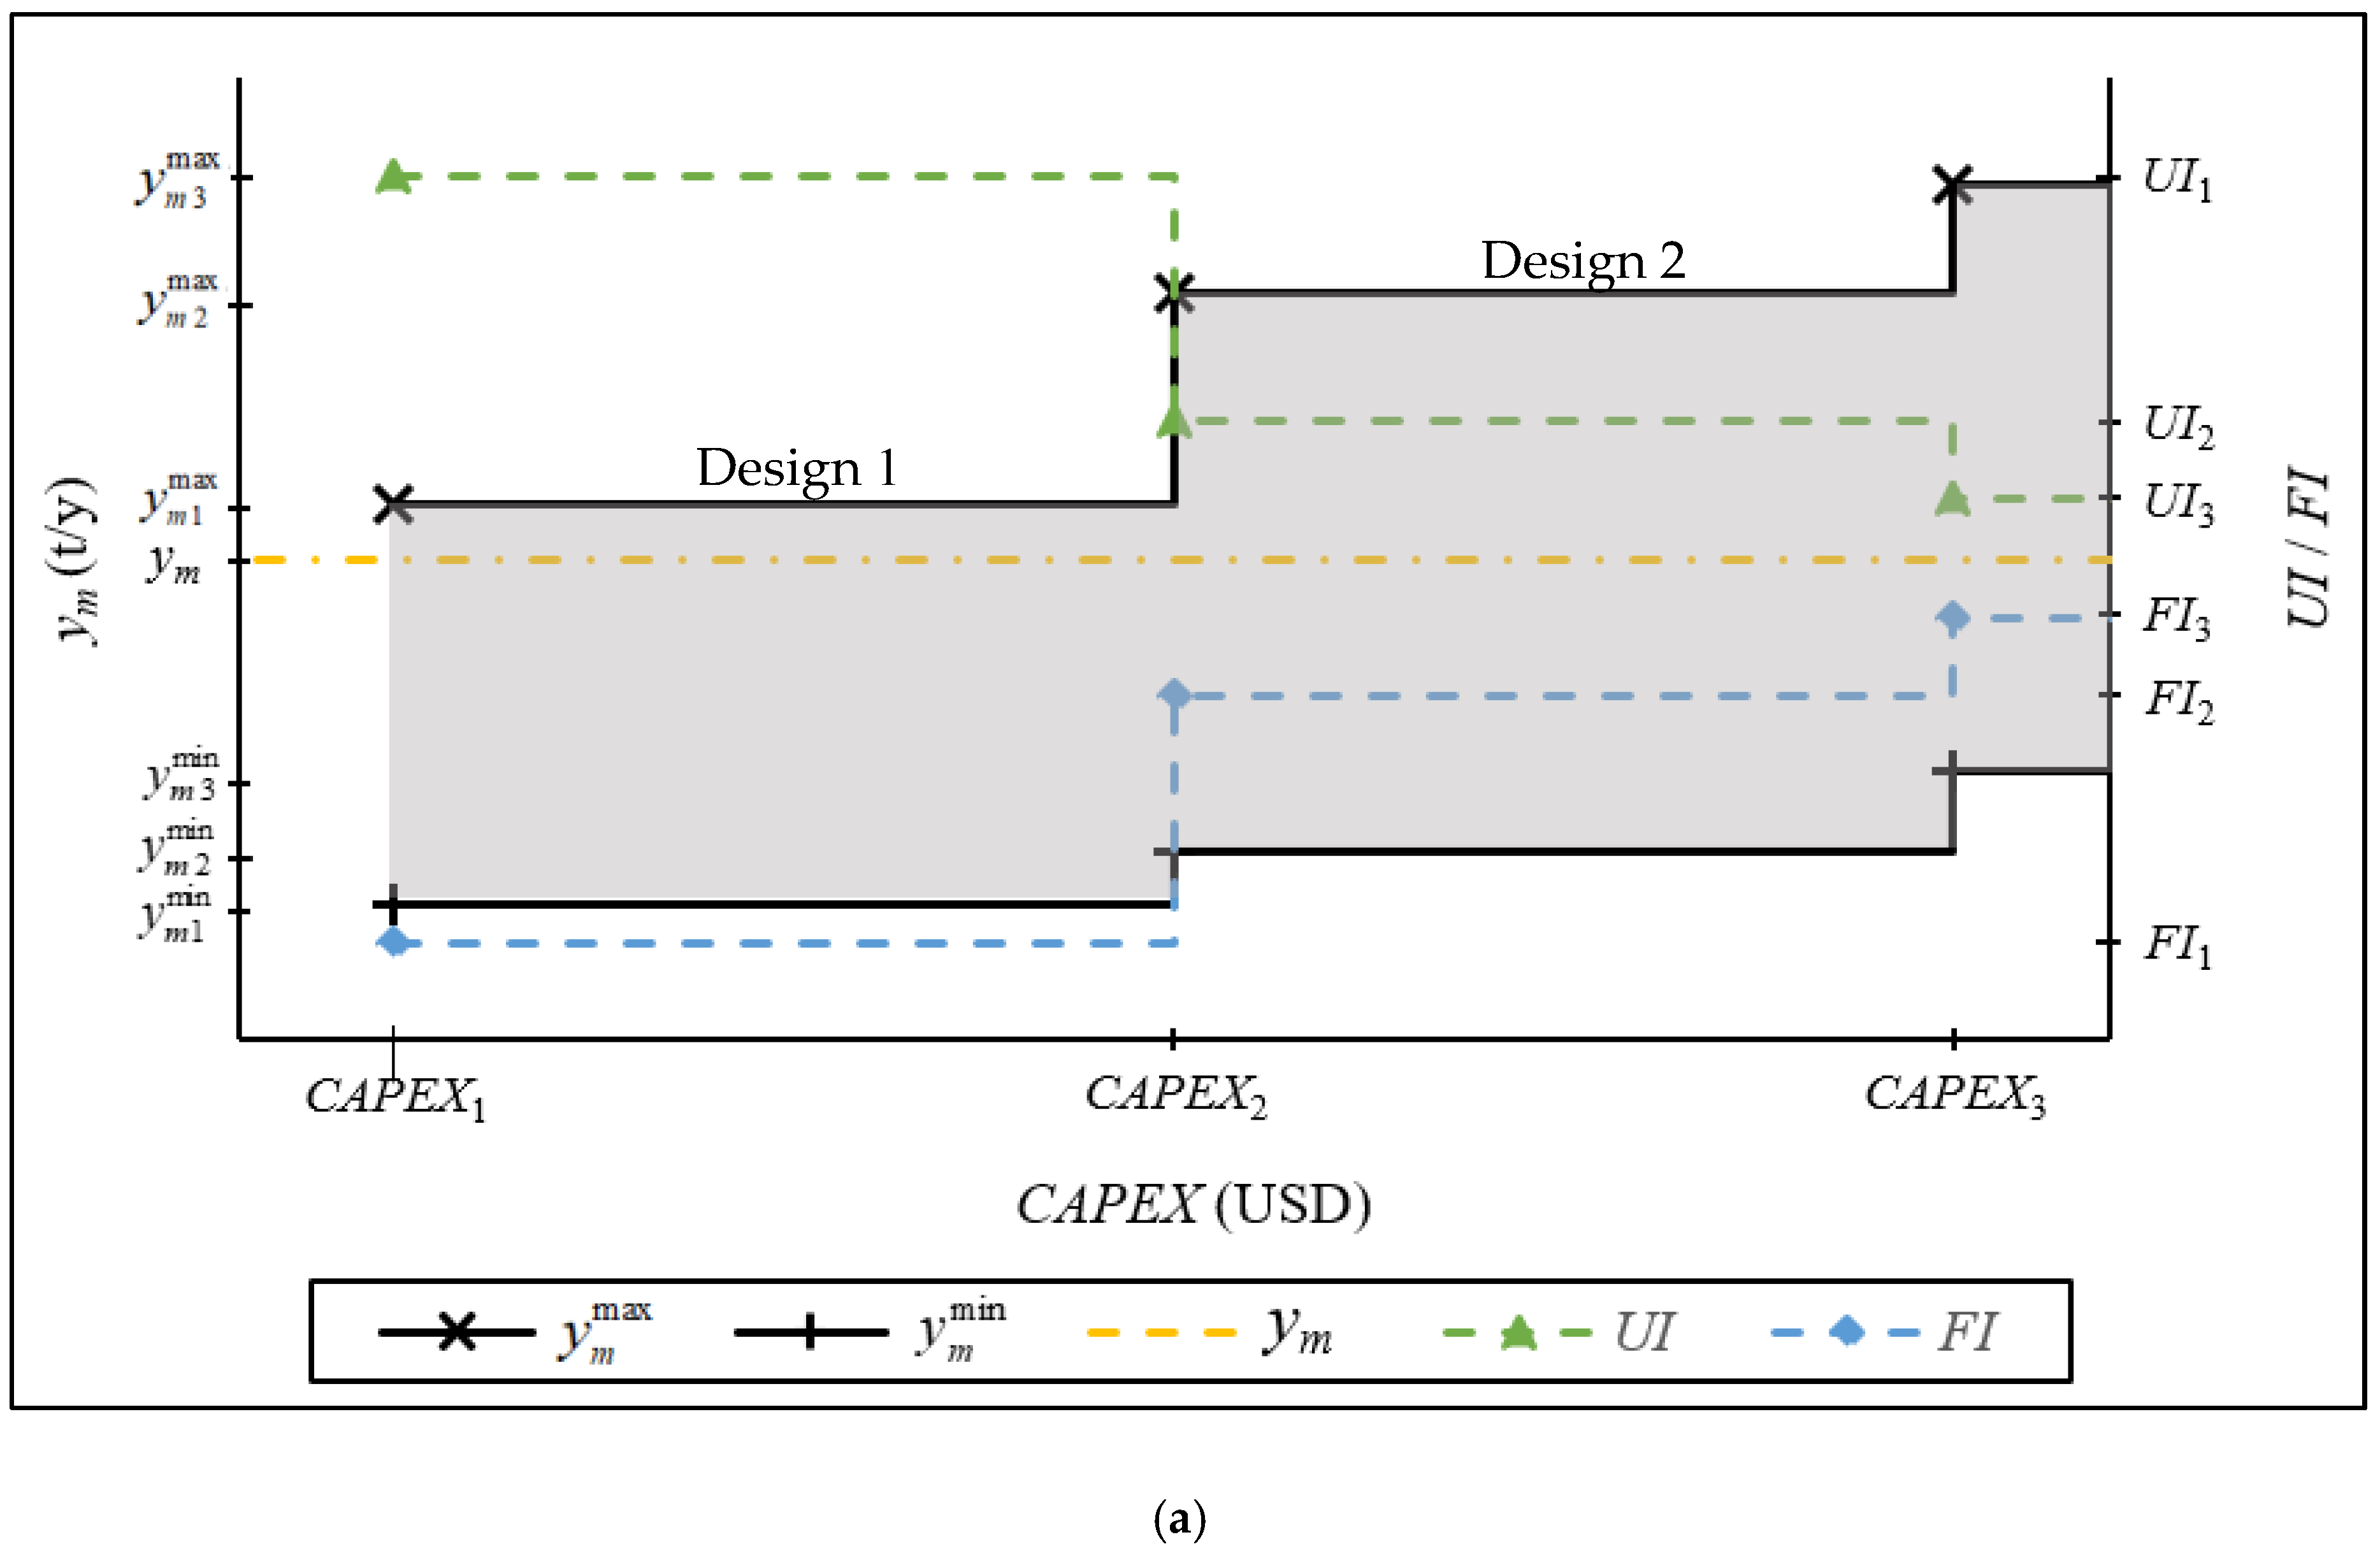
feasible operating range analysis (FORA) to examine the real-time feasible operating range of an energy system graphically. Such approach allows the range output (i.e., maximum and minimum of each output) of a system to be determined, considering material input and capacity constraints of individual unit operations. Besides, it also provides insight into potential design modifications based on variations in output demand and process bottleneck [43].
The studies presented thus far provide evidence for the applications of mathematical programming and graphical approaches (i.e., IOM and FORA) to optimise and analyse problems in various fields. However, limited works were reported for a hybrid approach to deal with such issues. None of the contributions discussed has focused on palm oil milling processes apart from Foong et al. [6], in which a mathematical programming approach alone is presented. Based on the previous work [6], operational variables such as operating hours and labour costs are yet to be considered. Besides, analysis on a real-time feasible operating range and the bottleneck of the developed design is not performed in the previous work. In addition, the operational performance of the milling process can be quantified in terms of utilisation and flexibility indices, introduced by Grossmann et al. [44] to measure the usage and expected deviation from a nominal design state that a process can handle. These research gaps are dealt with in this study, developing a hybrid approach consisting of IOM for palm oil mill optimisation, followed by FORA to analyse the feasible operating range of the developed system. In particular, this work provides an extended account of FORA, whereby production rates, flexibility and utilisation indices and capital expenditure are considered simultaneously to provide a visualisation tool for process improvement.
In the following section, the problem statement for this work is presented, followed by a detailed formulation for IOM in Section 3. Next, an existing POM flowsheet is optimised using the input-output approach described in Section 4. Following this, the economic performance, utilisation and flexibility of the POM are then compared to highlight the improvements achieved. Lastly, the conclusions and prospective future works are described in the final section.

2. Problem Statement

The problem addressed by the proposed approach is divided into two parts, stated as follows. The palm oil milling processes consist of a set of technology te ϵ TE with interchangeable material m ϵ M. Firstly, an IOM is developed where A is the input and output matrix composed of the fixed interaction ratios, am,te between material m and technology te. Each crop season s has a fixed fraction of occurrence, αs, to indicate the proportion of each year that it takes up. Different levels of supply of material m are available in each crop season s. The number of equipment units operated, Ute determined from the nominal capacity, CAPte available in the market. Each material m and technology te associated with a given material cost, Cm, operating cost, OCte, capital cost, CCte and electricity consumption, Ete, respectively. In the event where annual operating time, AOT exceeds the annual shift time, AST, additional overtime cost, OTC and operating costs, OPEX required. The objective is to maximise the economic performance, EP of the POM as shown in Equation (1).
Maximise EP
Based on the optimised POM design, the Ute determined is set as the maximum units operated, U t e max to identify the technology bottleneck, Bte from the maximum capacity, CAP t e max of each technology te. Next, FORA is then performed to evaluate the developed system using utilisation and flexibility indices, UI and FI, respectively. The following section further explains the approach developed for this work.

3. Hybrid Approach Formulation

As mentioned previously, a hybrid approach is developed in this work to optimise the palm oil milling process via IOM, followed by FORA to analyse the developed system. The italic notations represent the variables determined by the model and non-italic notations represent constant parameters defined in the proposed approach. Meanwhile, matrix and vector symbols are represented by bold notations.

3.1. Input-Output Optimisation Model (IOM)

In this model, each crop season in which material flows would vary is represented by index s. It is assumed that a linear correlation for material flows in the milling process is given in Equation (2)
A ( x t e ) s = ( y m ) s        m ,   s
where A is the matrix consists of fixed interaction ratios, am,te for material input and output ratios, to and from technology te. Each column in matrix A corresponds to different technology te, while its rows correspond to material m flows. am,te are expressed in negative values for material inputs, positive values for material outputs or zero if there are no interactions between material m and technology te. xte is the processing capacity vector of technology te, in which positive values obtained for technologies operated and zero when it is not. Meanwhile, ym is the flow rate vector of material m (i.e., input or output). Final and by-products are indicated with positive values while process feedstocks are indicated with negative values and intermediates denoted with zeros. Note that both xte and ym are expressed in material flow rate (t/h) or power generation (kW).
In the process, electricity is also being consumed to operate technology te for material conversions. However, electricity demand, EDemand of a POM relies on the number of units operated for technology, Ute rather than linear correlation as shown in Equation (3).
( E Demand ) s = t e = 1 TE ( U t e ) s E t e          s
Ete is a diagonal matrix for electricity consumption specified per unit technology te operated. Vector for the number of units of technology operated, Ute is determined based on the inverse of a nominal capacity diagonal matrix, CAPte available in the market ( CAP t e 1 ) obtained from Equation (4).
( U t e ) s ( x t e ) s CAP t e 1        s ,   t e
Ute consists of positive integers and the inequality in Equation (4) ensures that the products of Ute and CAPte to be greater or equal to xte for the process to operate.
In the presence of power supply from grid connection, the system produces and utilises electricity generated onsite. To ensure that the process is self-sufficient without interruption, an additional constraint, Equation (5) is included whereby the output of electricity produced, yelectricity in the process is greater or equal to the electricity demand, EDemand in each crop season s.
( y electricity ) s ( E Demand ) s        s
Note that the focus of this work is to model the interdependency of each equipment with one another in a single system or plant. For conservative measurement, the power consumption and process efficiency for maximum loading is assumed for each operating equipment to prevent underestimation of power demand needed, regardless of the process throughput for each equipment. Every technology unit te is sized based on these conservative values to ensure the reliability of system developed. As such, every time an equipment is selected, a conservative energy consumption value (or maximum) is activated.
Meanwhile, the economic performance, EP of the process is evaluated based on Equation (6)
E P = G P C R F   ×   C A P E X
where GP, CRF and CAPEX represent the gross profit, capital recovery factor and capital costs required, respectively. To ensure that the developed system can sustain itself economically, EP must be greater or equal to zero. Next, Equation (7) is used to calculate GP
G P = s α s [ ( A O T m = 1 M y m C m O P E X O T C ) s L C ]
whereby AOT, αs, Cm, OPEX, OTC and LC are the annual operational time, fraction of occurrence, material, total operating, overtime and labour costs, respectively. Equation (7) is subject to
s α s = 1
in which the inclusion of αs assessed the performance of the system developed in all crop season s. Each fraction of occurrence represents the time fraction where a season occurs. The summation of these fractions must equal to one as shown in Equation (8) as the time fraction is obtained by dividing the duration of a crop season s with the total duration considered. AOT is determined by Equation (9)
( m max ) s ( A O T × y m ) s        s
where m max is the maximum material demand (positive value) or available (negative value) per annum, depending on the constraint set for each season s. Equation (9) is subject to
( A O T ) s AOT max        s
where AOTmax is the maximum annual operating time of the process.
CRF is used to annualise CAPEX over a specified operation lifespan t t e max and discount rate, r, determined via Equation (11).
C R F   = r   ( 1 + r ) t t e max   ( 1 + r ) t t e max 1
CAPEX is calculated based on the units of technology installed during the high crop season, (Ute)H while OPEX depends on the units of technology operated, Ute in the process as shown in Equations (12)–(13).
C A P E X = t e = 1 TE ( U t e ) H CC t e
( O P E X ) s = t e = 1 TE ( U t e ) s OC t e        s
CCte and OCte represent the capital and operating costs per unit of technology te, expressed in diagonal matrixes. Meanwhile, Equations (14) and (15) determine OTC and LC required.
( O T C ) s = C OT n wk [ ( A O T ) s AST ]        s
L C = C lab n wk n ws
where COT and Clab are the specific overtime cost and labour cost; nwk and nws represent the number of workers and working shifts per day; AST is the annual shift time of the process.

3.2. Feasible Operating Range Analysis (FORA)

It is worth mentioning that the optimal design obtained using IOM is only optimised for a given set of conditions. When changes arise in the near future, it is important to have sufficient flexibility to cater for such changes. As such, FORA provide a clear visualisation to avoid the system developed from over- or under-designed. In fact, it provides flexibility for the decision maker to decide on the required design flexibility based on how much CAPEX to be invested. Based on the IOM developed previously, FORA is performed to analyse the feasible operating range of the POM designed. The analysis begins by setting the maximum units of technology installed, U t e max as the Ute of the design with the smallest capacity (i.e., during low crop season) as given in Equation (16).
U t e max = ( U t e ) L
The product of U t e max and CAPte gives the maximum capacity, CAP t e max as shown in Equation (17) and the inverse matrix, ( CAP t e max )−1 is used in Equation (18) to identify the technology bottleneck, Bte of the system. Bte ranges from zero to one where zero indicating that technology te is not utilised, while one shows the bottleneck of the entire system in which the capacity of that particular technology te is utilised to its maximum potential.
CAP t e max = U t e max CAP t e        t e
( x t e ) s ( CAP t e max ) 1 = ( B t e ) s        s ,   t e
In this work, the milling process is optimised with the objective function given in Equation (1) by deactivating the material input constraint, Equation (8) to determine the maximum product output of the system, y m max . At this point, the technology bottleneck of the system is indicated by Bte equal to one (Bte = 1), representing that a particular technology has been fully utilised, capping the ym of the entire system. It is assumed that process intensification of the technology bottleneck is not possible and additional equipment unit will be needed to increase y m max , where Bte serves as an indicator to pinpoint the additional technology equipment for purchase/upgrade.
Following that, the objective function is modified into Equation (19) to determine the minimum output of the system, y m min while ensuring the system is economically stable to sustain its operation (i.e., EP equal to zero). In the event where minimum EP is required at a targeted value, additional constraints may be added to the formulation. The changes in y m max and y m min are measured for each incremental step in summation of U t e max ( t e = 1 TE U t e max ) by one equipment unit at a time to determine the feasible operating range of each design.
Minimise EP
The utilisation index, UI and flexibility index, FI for each incremental unit of U t e max is determined via Equations (20) and (21) to measure the operational performance of the system
( U I ) s = ( y m ) s y m max        s
( F I ) s = y m max ( y m ) s y m max        s
where UI and FI range between zero to one. In the event where UI equals to zero, the process is not utilised while UI equals to one indicates that the process is operating at 100% of the processing capacity installed. Meanwhile, zero in FI represents that the process has no flexibility in its operation and vice versa. To better illustrate the proposed FORA, a generic process where y m max , y m min , UI and FI are plotted against CAPEX as shown in Figure 2a. Several key features to be highlighted from the analysis are as follows:
  • Cross and plus markers in Figure 2a represent y m max and y m min of different system design with different U t e max (x-axis on the left) and a corresponding CAPEX required (y-axis). The area shaded in grey between y m max and y m min represented the feasible operating range of the developed system where ym (yellow line) must fall in between this region. This is to ensure that the system output is always less than or equal to the maximum production capacity, while greater or equal to the minimum output to sustain its operation.
  • y m max and y m min changes with the system design, during the addition or removal of the equipment unit. Hence, step changes are observed in y m max and y m min (black lines) when CAPEX increases.
  • The technology bottleneck and additional equipment unit to be added for each step are identified by Bte when Bte = 1. Increments in y m max and y m min are not proportional to the increment in CAPEX as the capital and capacity of each technology varies according to the market. Occasionally, more than one technology bottlenecks might occur. In that respect, multiple types of equipment and greater CAPEX are needed to increase the capacity of the system.
  • The increment in y m max (black line) reduces the UI (green line) while increases the FI (blue line) of the system in the same behaviour due to the changes in production capacity as shown in the x-axis on the right.
In the event where ym is increased to y m max , the first design becomes infeasible (area shaded in red) as y m new falls out of the area shaded in grey as shown in Figure 2b. At the same time, a budget constraint is applied where only an increment up to a maximum capital cost, CAPEXmax can be invested. Based on the diagram, design 2 is required to cope up with such changes and CAPEX2 falls within the constraint (CAPEX2 < CAPEXmax). As such, the expansion from first to second design is feasible and the system will have more flexibility in product output up to y m 2 max level. On the other hand, when y m new is further increased as shown in Figure 2c, the CAPEX required falls beyond the constraint (CAPEX3 > CAPEXmax). This shows that none of the design is suitable for such increment in ym. Hence, the decision maker may only expand up to y m 2 max with CAPEX2, sacrificing the additional output between y m new and y m 2 max .
Besides targeting for changes in ym, the proposed approach allows for decision making based on FI or UI. For instance, the same investor is interested in changing the system slightly, allowing for more flexibility, FInew to tolerate greater fluctuation in ym which may occur in the future. Similarly, budget constraint is capped at CAPEXmax. As presented in Figure 2d, FInew is greater than FI1 but lesser FI2. Therefore, flexibility up to FI2 can be achieved based on the constraint set. This analysis serves as a powerful tool to plan for increment in product output expected in the future, under different constraints.
The following section presents a typical POM case study in Malaysia to illustrate the proposed approach. An IOM is developed to optimise the milling process, followed by FORA to study the feasible operating range within its design capacity. The developed mixed-integer linear programming model was solved via LINGO (v16, LINDO Systems, Inc., Chicago, USA) to achieve a global solution [45], with an Intel® Core i5 (2 × 3.20 GHz), 8 GB DDR3 RAM desktop unit. Alternatively, other optimisation software such as MATLAB and Statistics Toolbox (Release 2012b, The MathWorks, Inc., Natick, MA, USA) and General Algebraic Modeling System (GAMS) (Release 24.2.1, GAMS Development Corporation, Washington, DC, USA) could be used to achieve the same solution, depending on user preference.

4. Case Study

In this case study, the hybrid approach presented is demonstrated using a POM design adopted from Foong et al. [6] as the baseline design. It is assumed that the mill operator is interested to further optimise the milling process to improve economic performance, EP by taking operational factors such as operating hours, labour costs and FFB availability into account. Besides, an analysis to study the feasible operating range, utilisation and flexibility of the POM design is performed, providing a better insight for any changes in system design to cater for any variation in production output in the future. FFBs obtained from plantations are divided into three crop seasons, that is, low, medium and high seasons, each with a given fraction of occurrence, αs and availability, yFFB as shown in Table 1.
A typical POM operates in batches for 12 h daily, usually divided into two workings shifts (i.e., annual shift time, AST = 4350 h/y). It is assumed that the POM is located in a remote area where power grid connection is not available and electricity required to operate the milling process is produced by cogeneration of biomass resources such as PPF and PKS. Fifteen operators with a labour cost, Clab of US$4500/y is required for each shift to operate the milling process. It is further assumed that the POM will have an operation lifespan, t t e max of 15 years with a discount rate, r of 5% per annum. The baseline POM design is shown in 
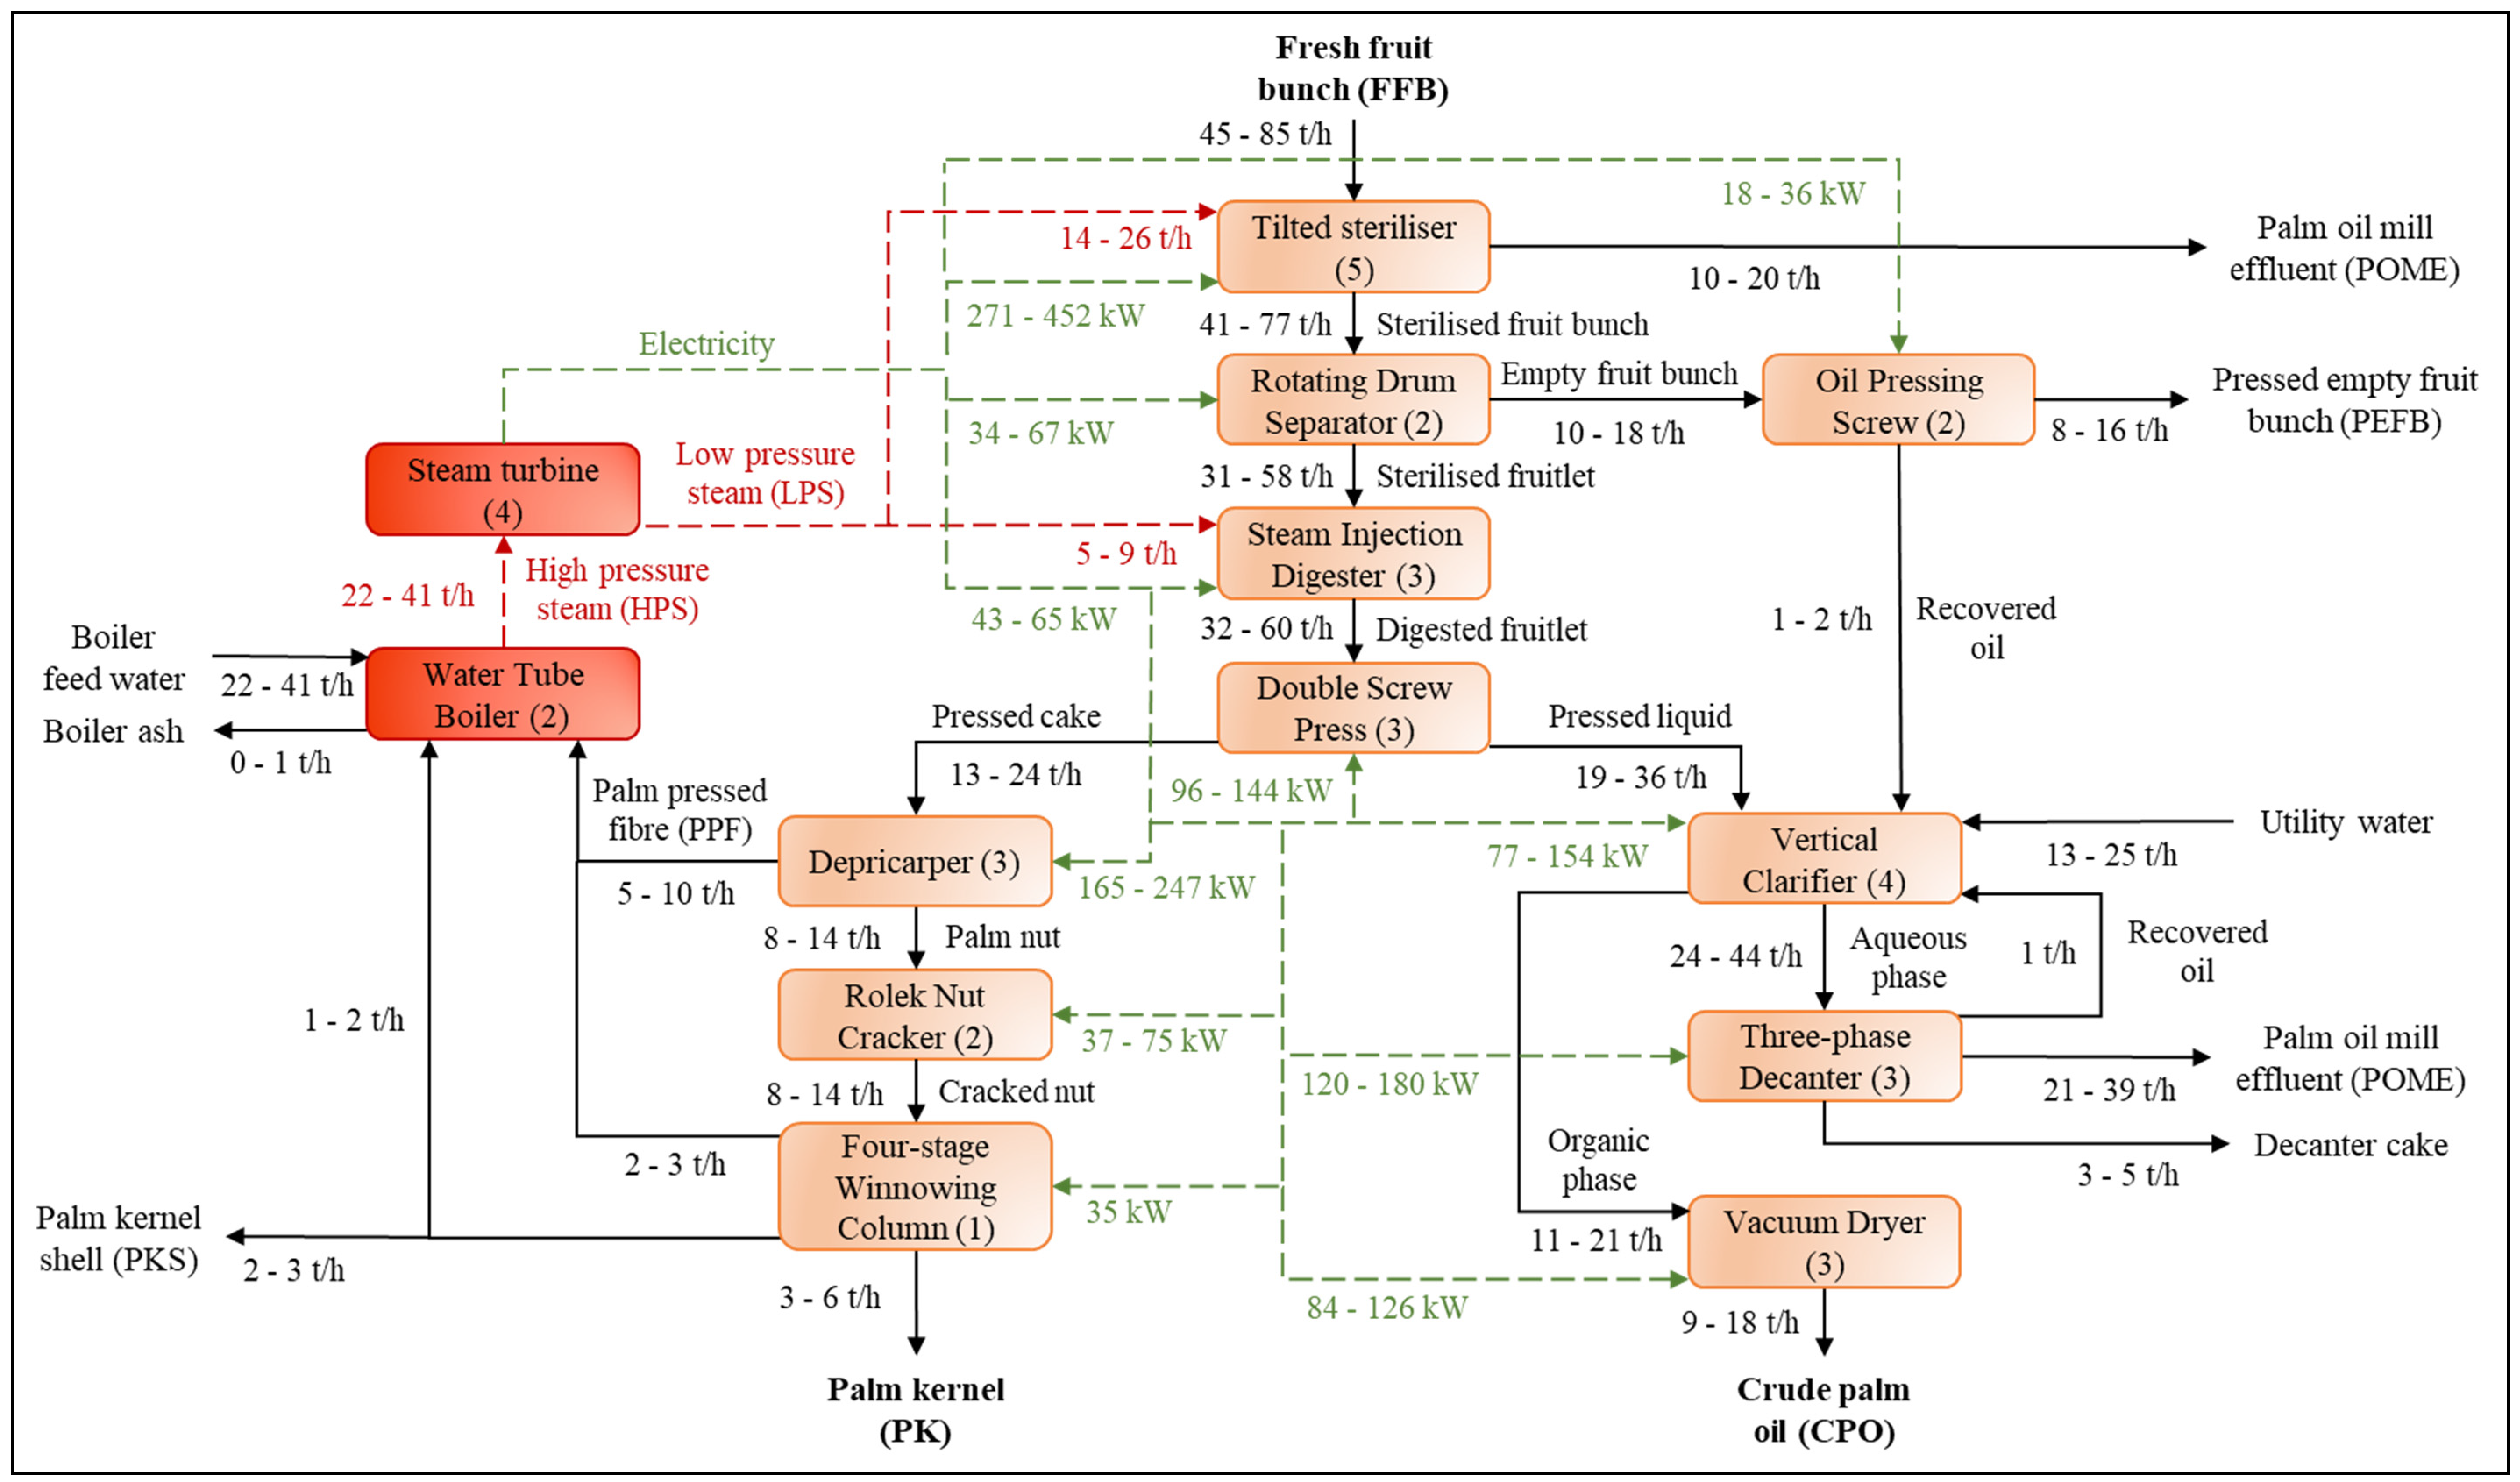
Figure 3 with the material and energy flows reported in a range for low and high crop seasons while the values stated in bracket represents the equipment units of each technology needed. Economic parameters such as CAPEX, OPEX, LC, GP and EP are summarised in Table 2 while additional information on material flows, technology units, process matrix table and other specifications of the system (i.e., CAPte, Ete, CCte, OCte and Cm) provided in Table 3, Table 4, Table 5, Table 6 and Table 7.
The assumption that the milling process can only be operated for 4350 h a year due to the working shifts of operators causes its capacity to be underutilised. In that case, more equipment units are required, resulting in greater CAPEX needed to process all the FFBs supplied, especially during the peak crop season. This shows a limitation in the previous study [6] during optimisation of a palm oil milling process. A more common practice in the industry is to increase the annual operating time, AOT of the process. In the industry, POM may operate up to 19 h/day or 7000 h/y (AOT ≤ 7000). In that sense, the total capital costs, CAPEX needed can be reduced as lesser equipment units are required. However, the increment in AOT on top of 4350 h/y AST requires overtime cost; OTC paid for operators working extra time and operating costs, OCte for service and maintenance of technology units. In this study, overtime costs, COT of US$5/h and an additional 20% for OCte are considered for operations exceeding 4350 h/y.

5. Results and Discussion

In order to achieve higher 
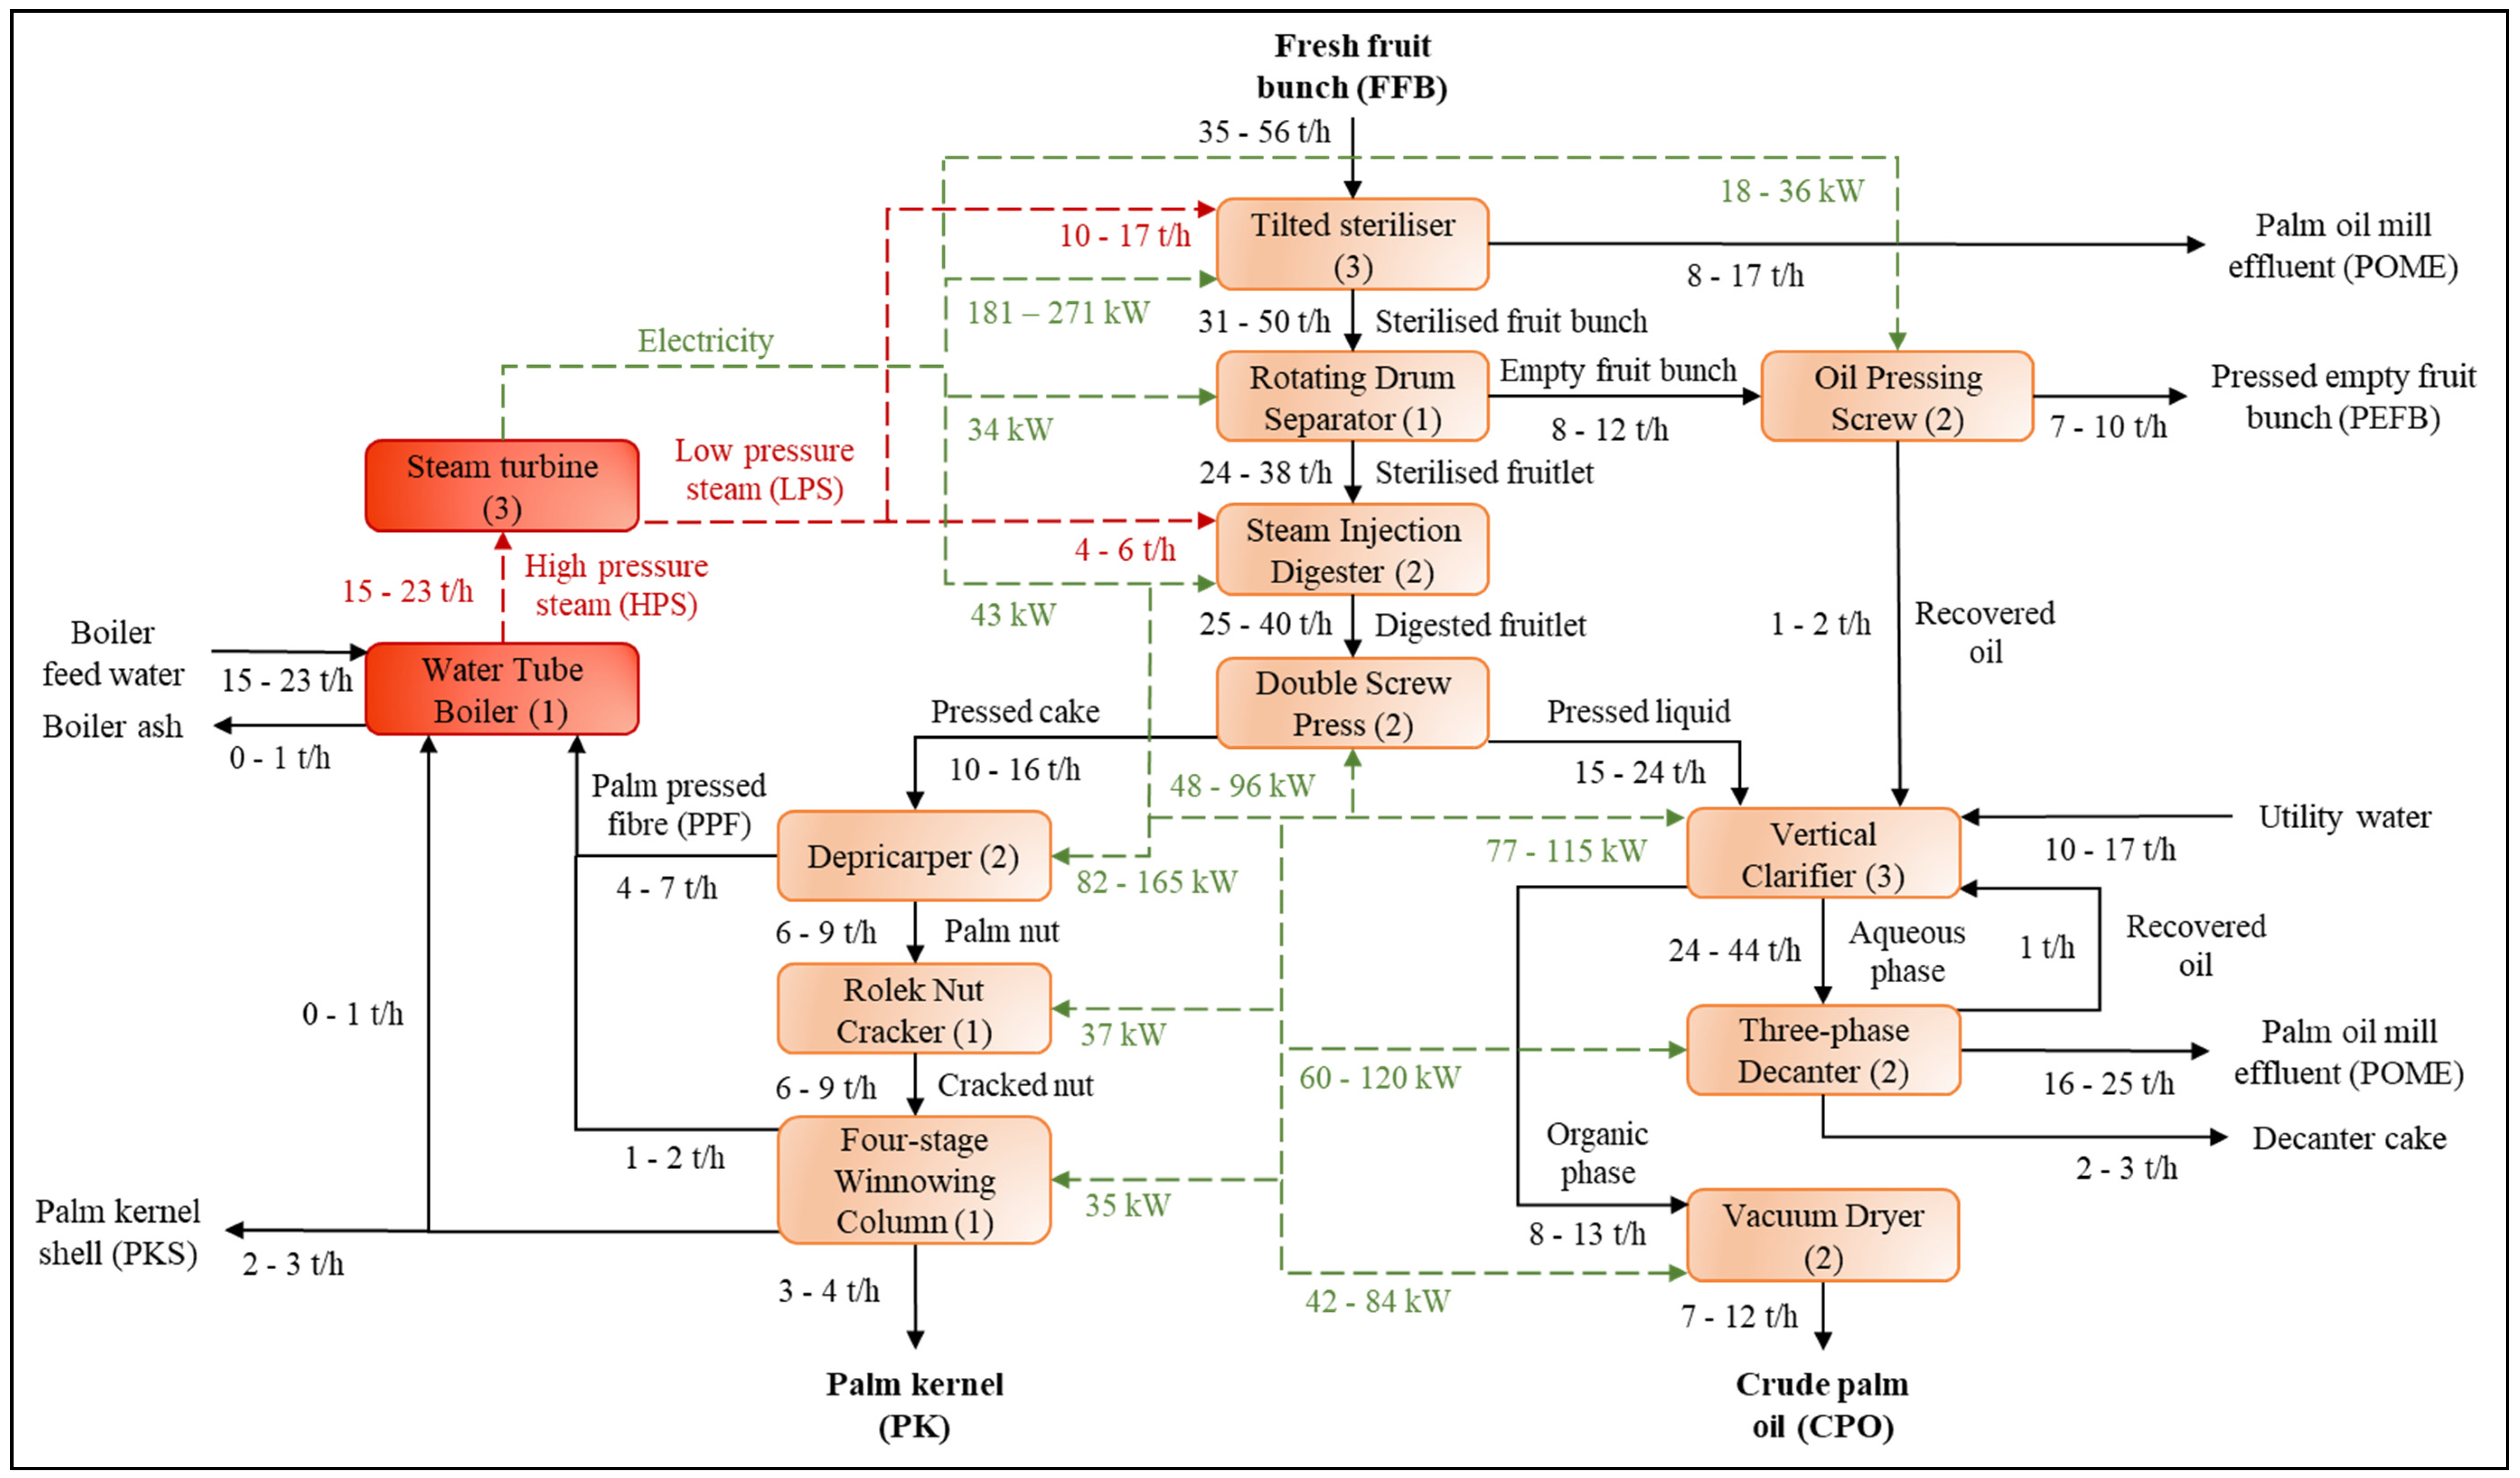
EP, an IOM was developed based on Equations (2)–(15) to optimise the baseline POM design with an objective function given in Equation (1). The model consists of 419 continuous variables with 54 integer variables and 622 constraints, solved in 17 s to achieve a global solution. The optimised POM design is presented in Figure 4 and the results (Table 8) showed that an EP of US$4.57 million/y EP is achieved (22% increment) as compared to US$3.75 million/y reported in the baseline design. This is mainly due to the reduction in CAPEX required, from US$18.42 to 11.56 million as the units of technology required, U t e max reduce from 39 (Table 4) to 26 units as shown in Table 9.
Data from Table 10 is compared with Table 3, showing that the same annual output is achieved, despite a smaller throughput (material flow per hour) in the optimised design by operating 5580, 5640, 4698 and 6656 h/y on average, low, medium and high crop seasons, respectively. In this respect, additional OTC by US$0.10, 0.03 and 0.17 million/y required for different crop seasons (an average of US$0.09 million/y). Besides, an additional 20% OCte is required to operate the equipment due to longer operational time. However, OPEX is still reduced by US$0.32 million/y on average (= US$1.38–1.06 million/y) as the overall equipment operated decreases. It is worth mentioning that the equipment operated is the same for medium and high crop seasons but longer AOT in the latter case. As higher OTC is required to process all the fruits available during medium crop season with smaller processing capacity, it is more optimal to operate the milling process with higher throughput but lower AOT. 
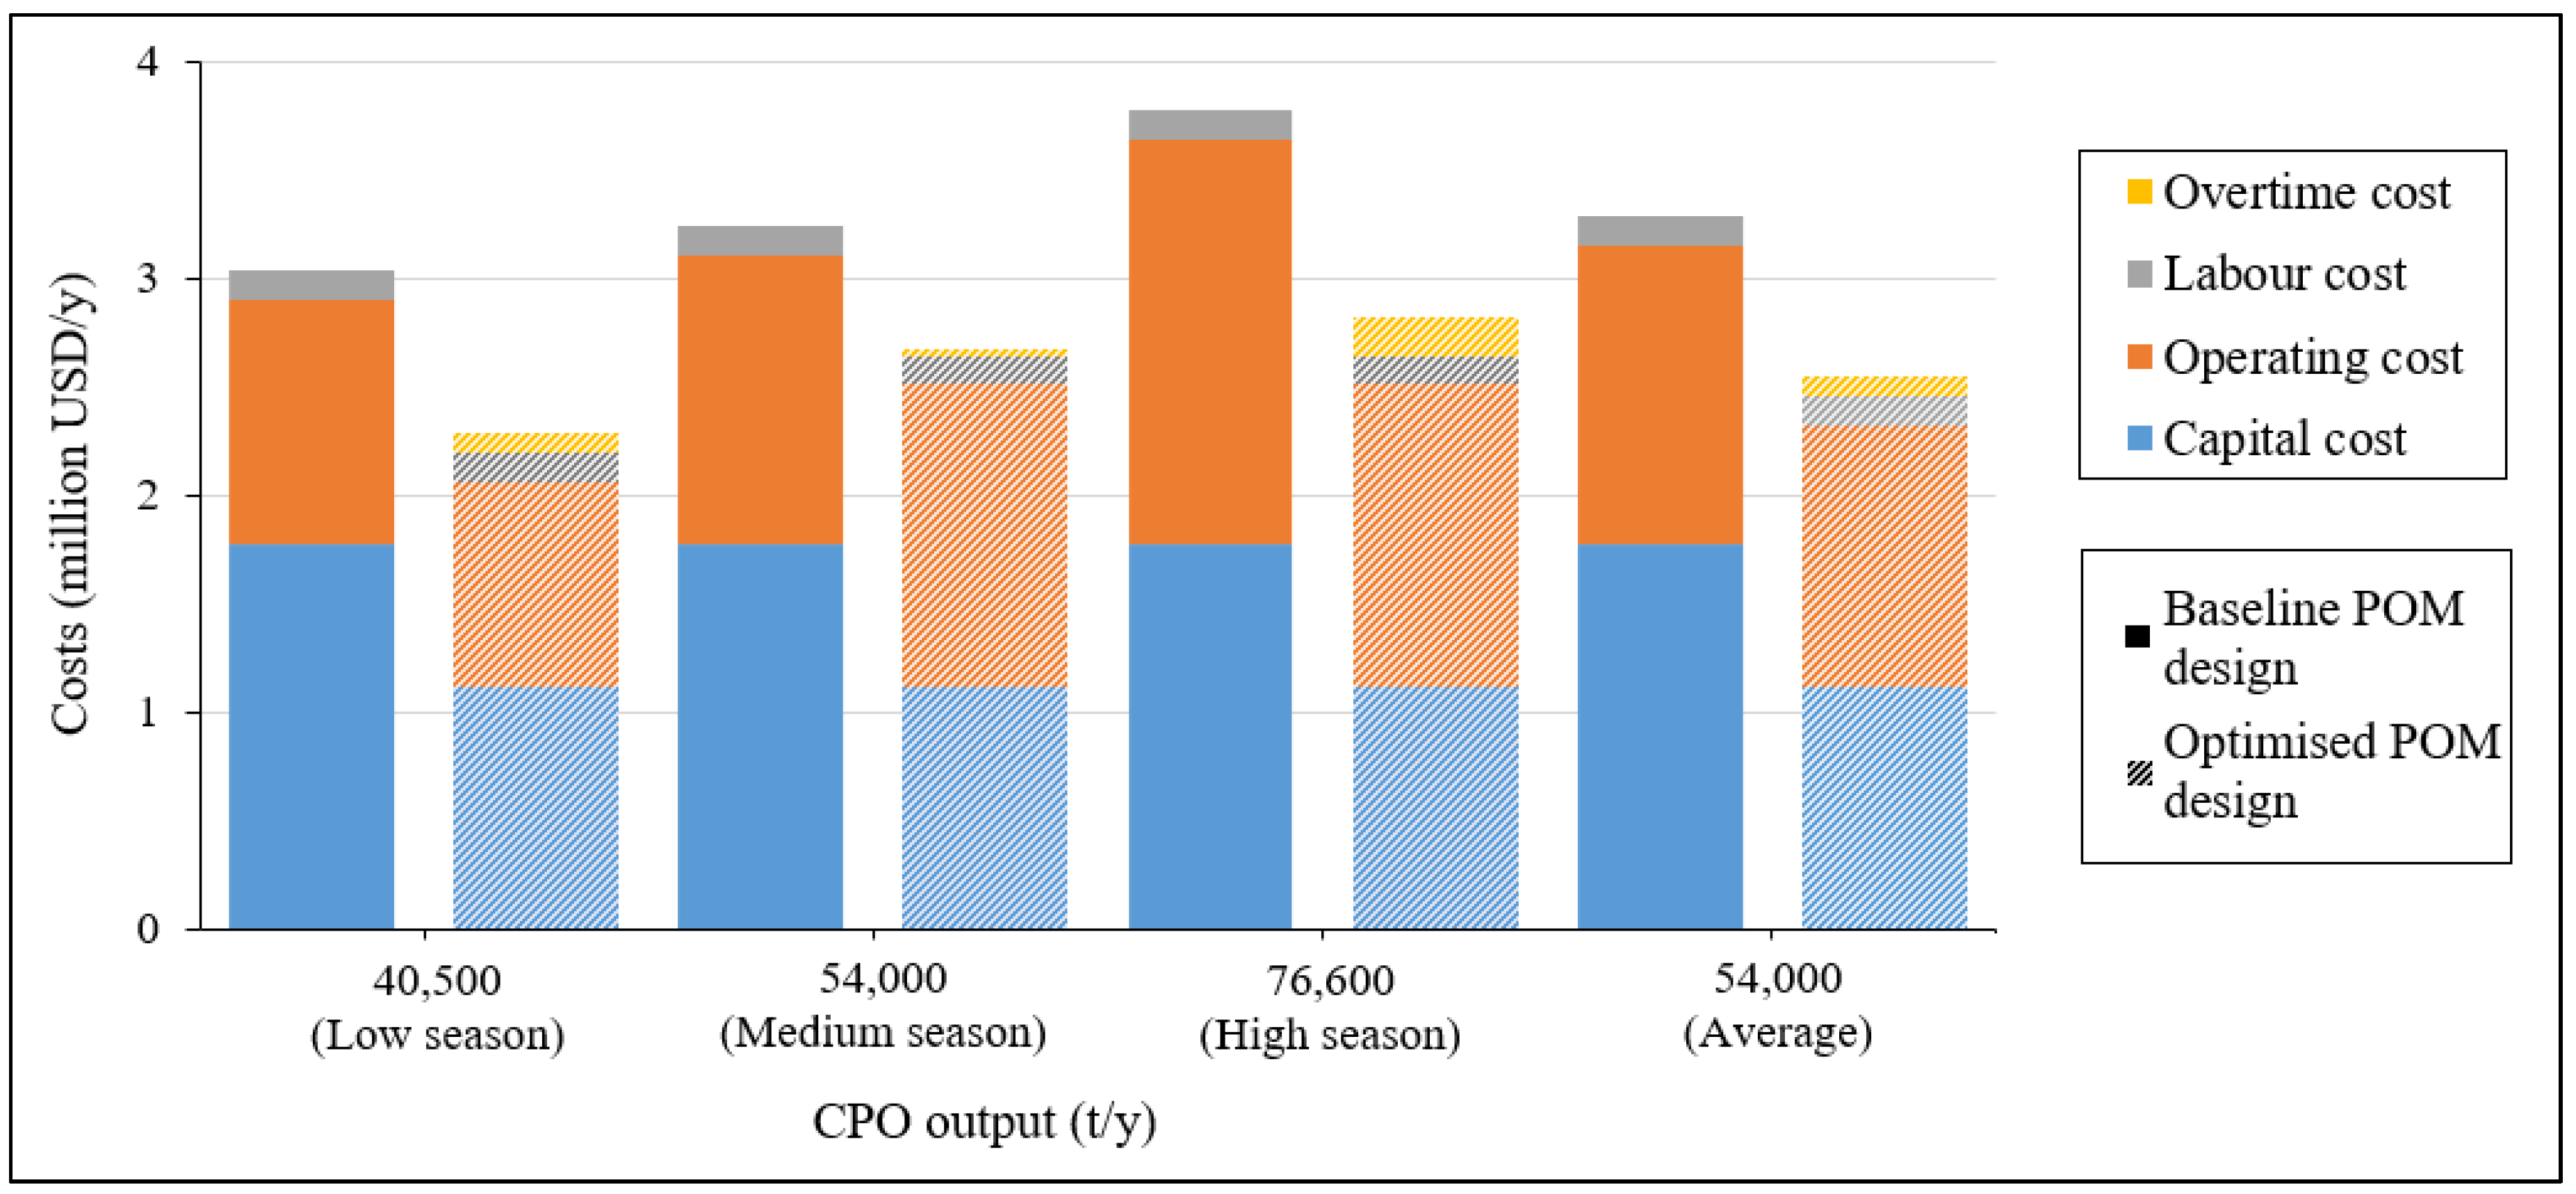
Figure 5 shows the breakdown of costs allocation for both designs where CAPEX is annualised into a yearly basis for 15 years. It can be seen that the total costs required by the optimised design are lower than the baseline design by to 23% on average with 25, 18 and 25% reduction during low, medium and high crop seasons, respectively. In the next part of this section, the milling process is further analysed with FORA as mentioned earlier to study the feasible range of CPO output with respect to CAPEX invested.
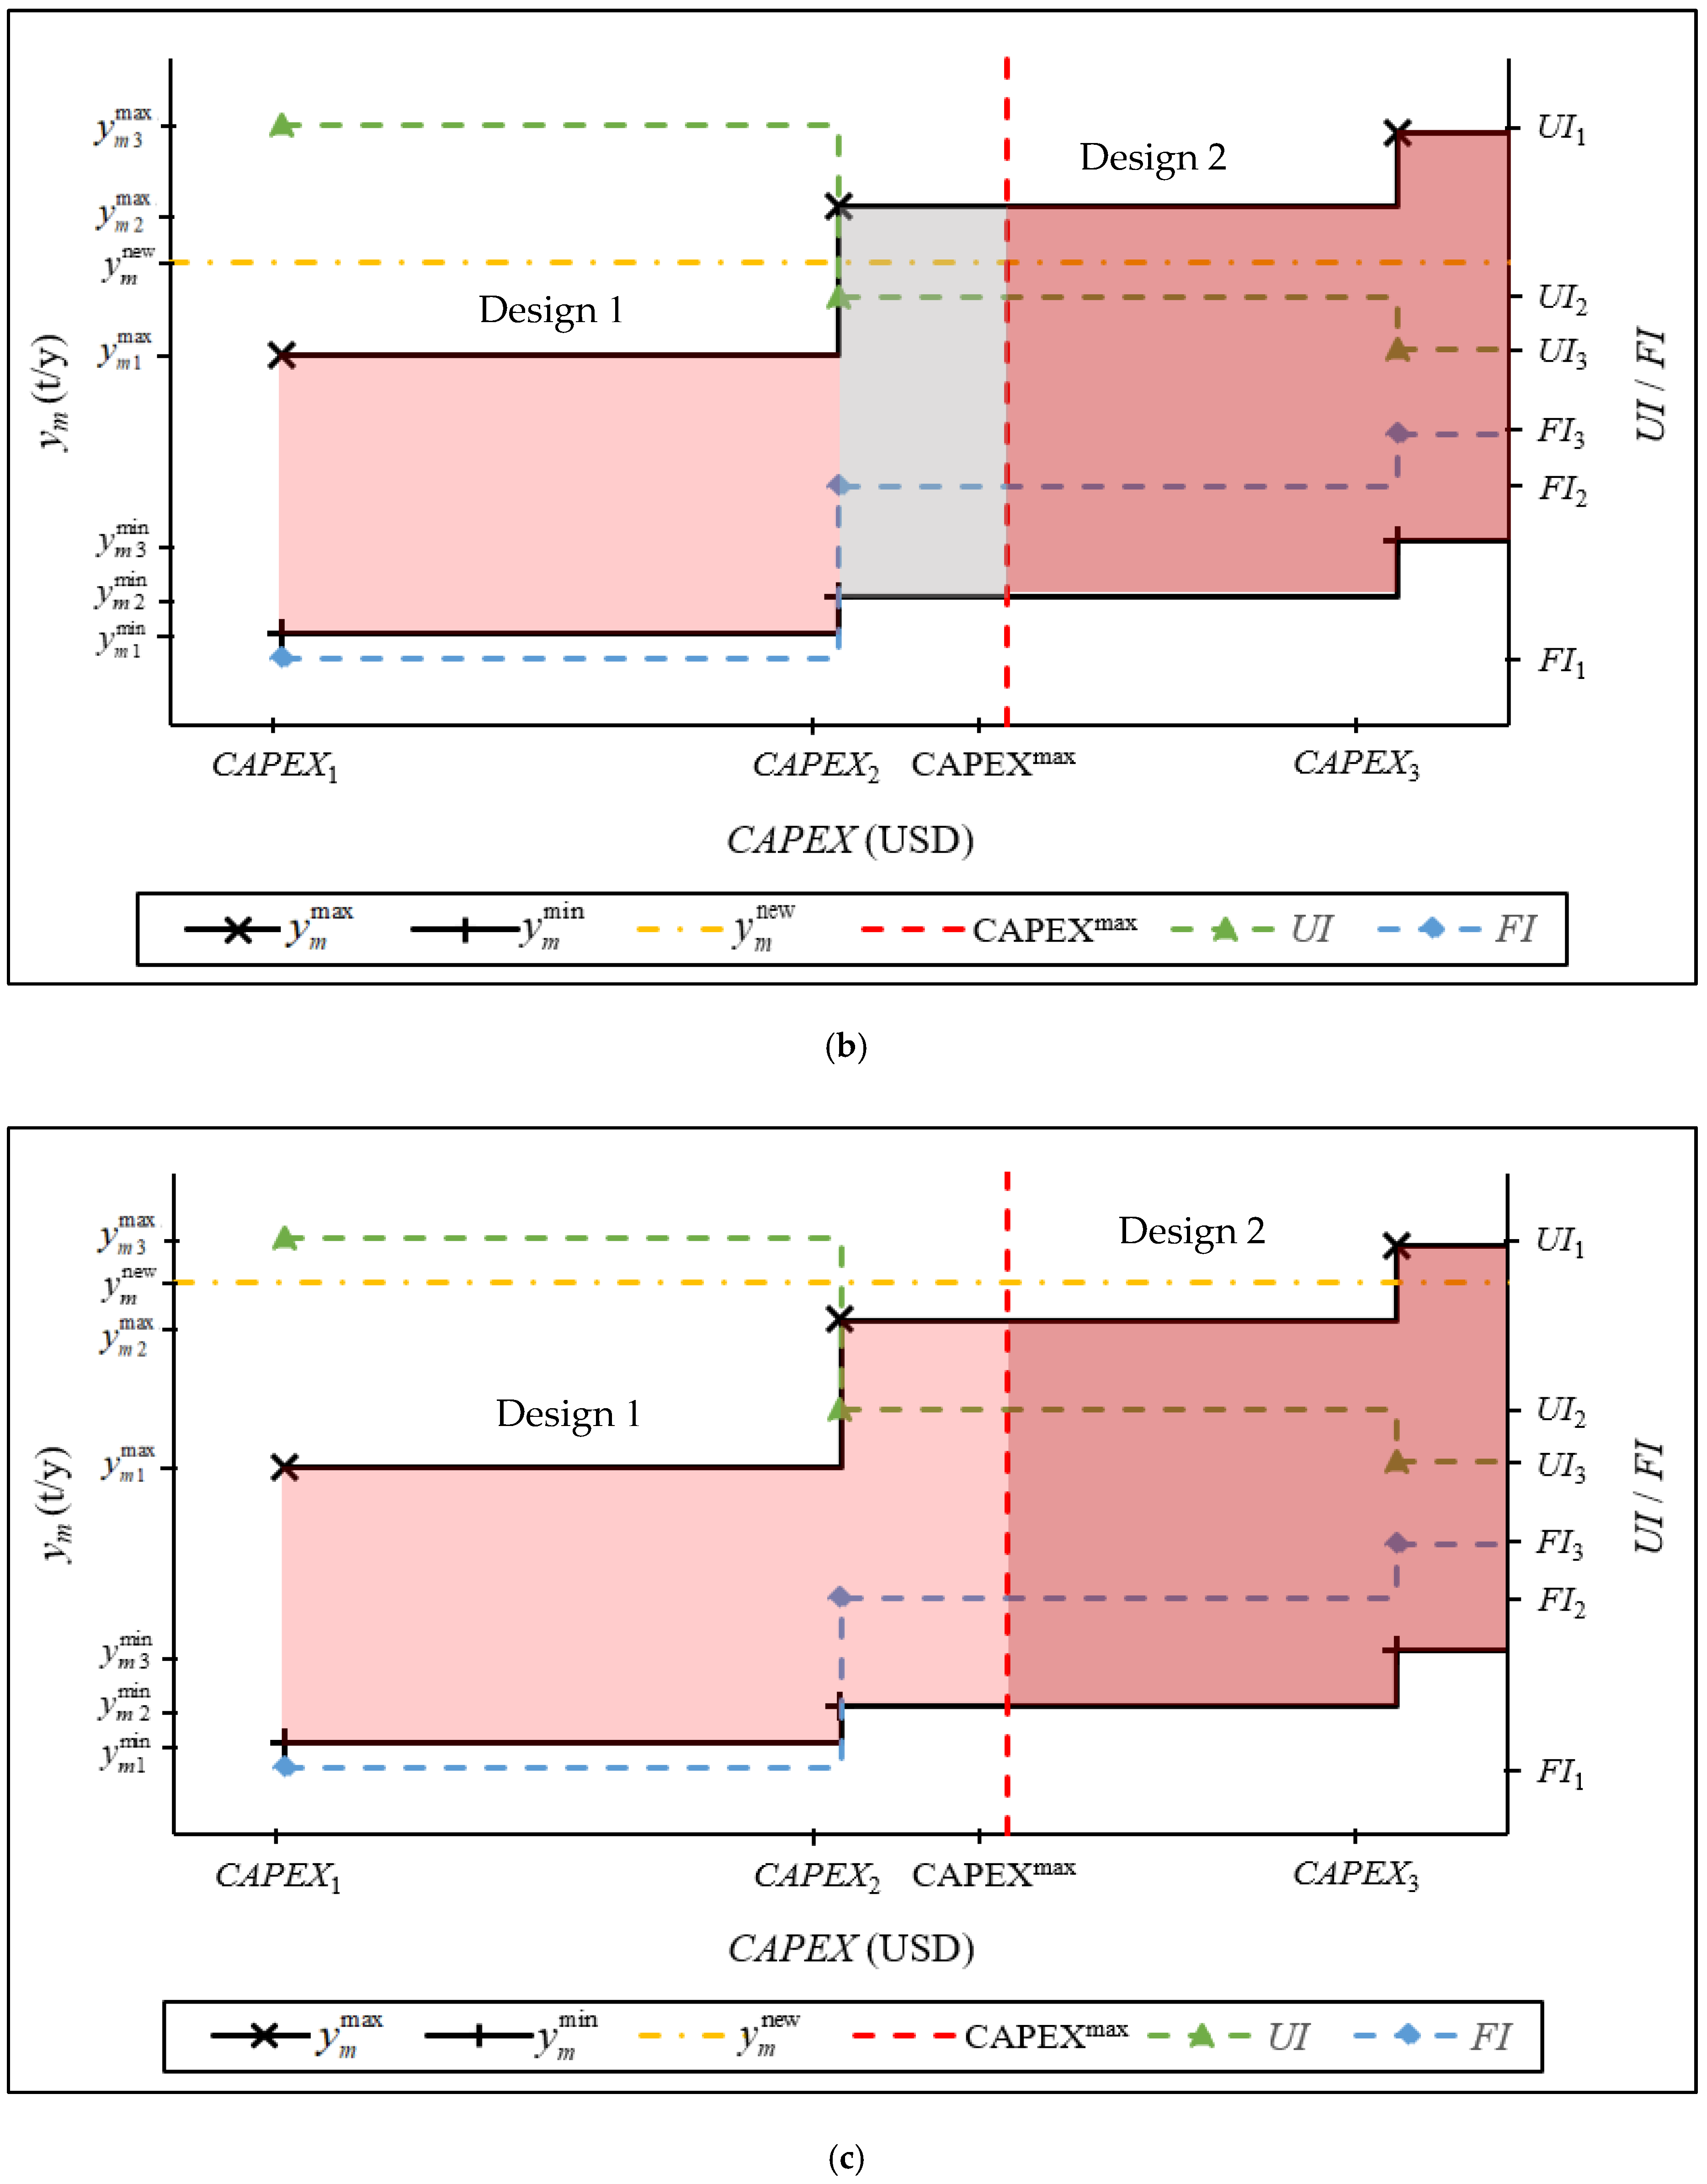
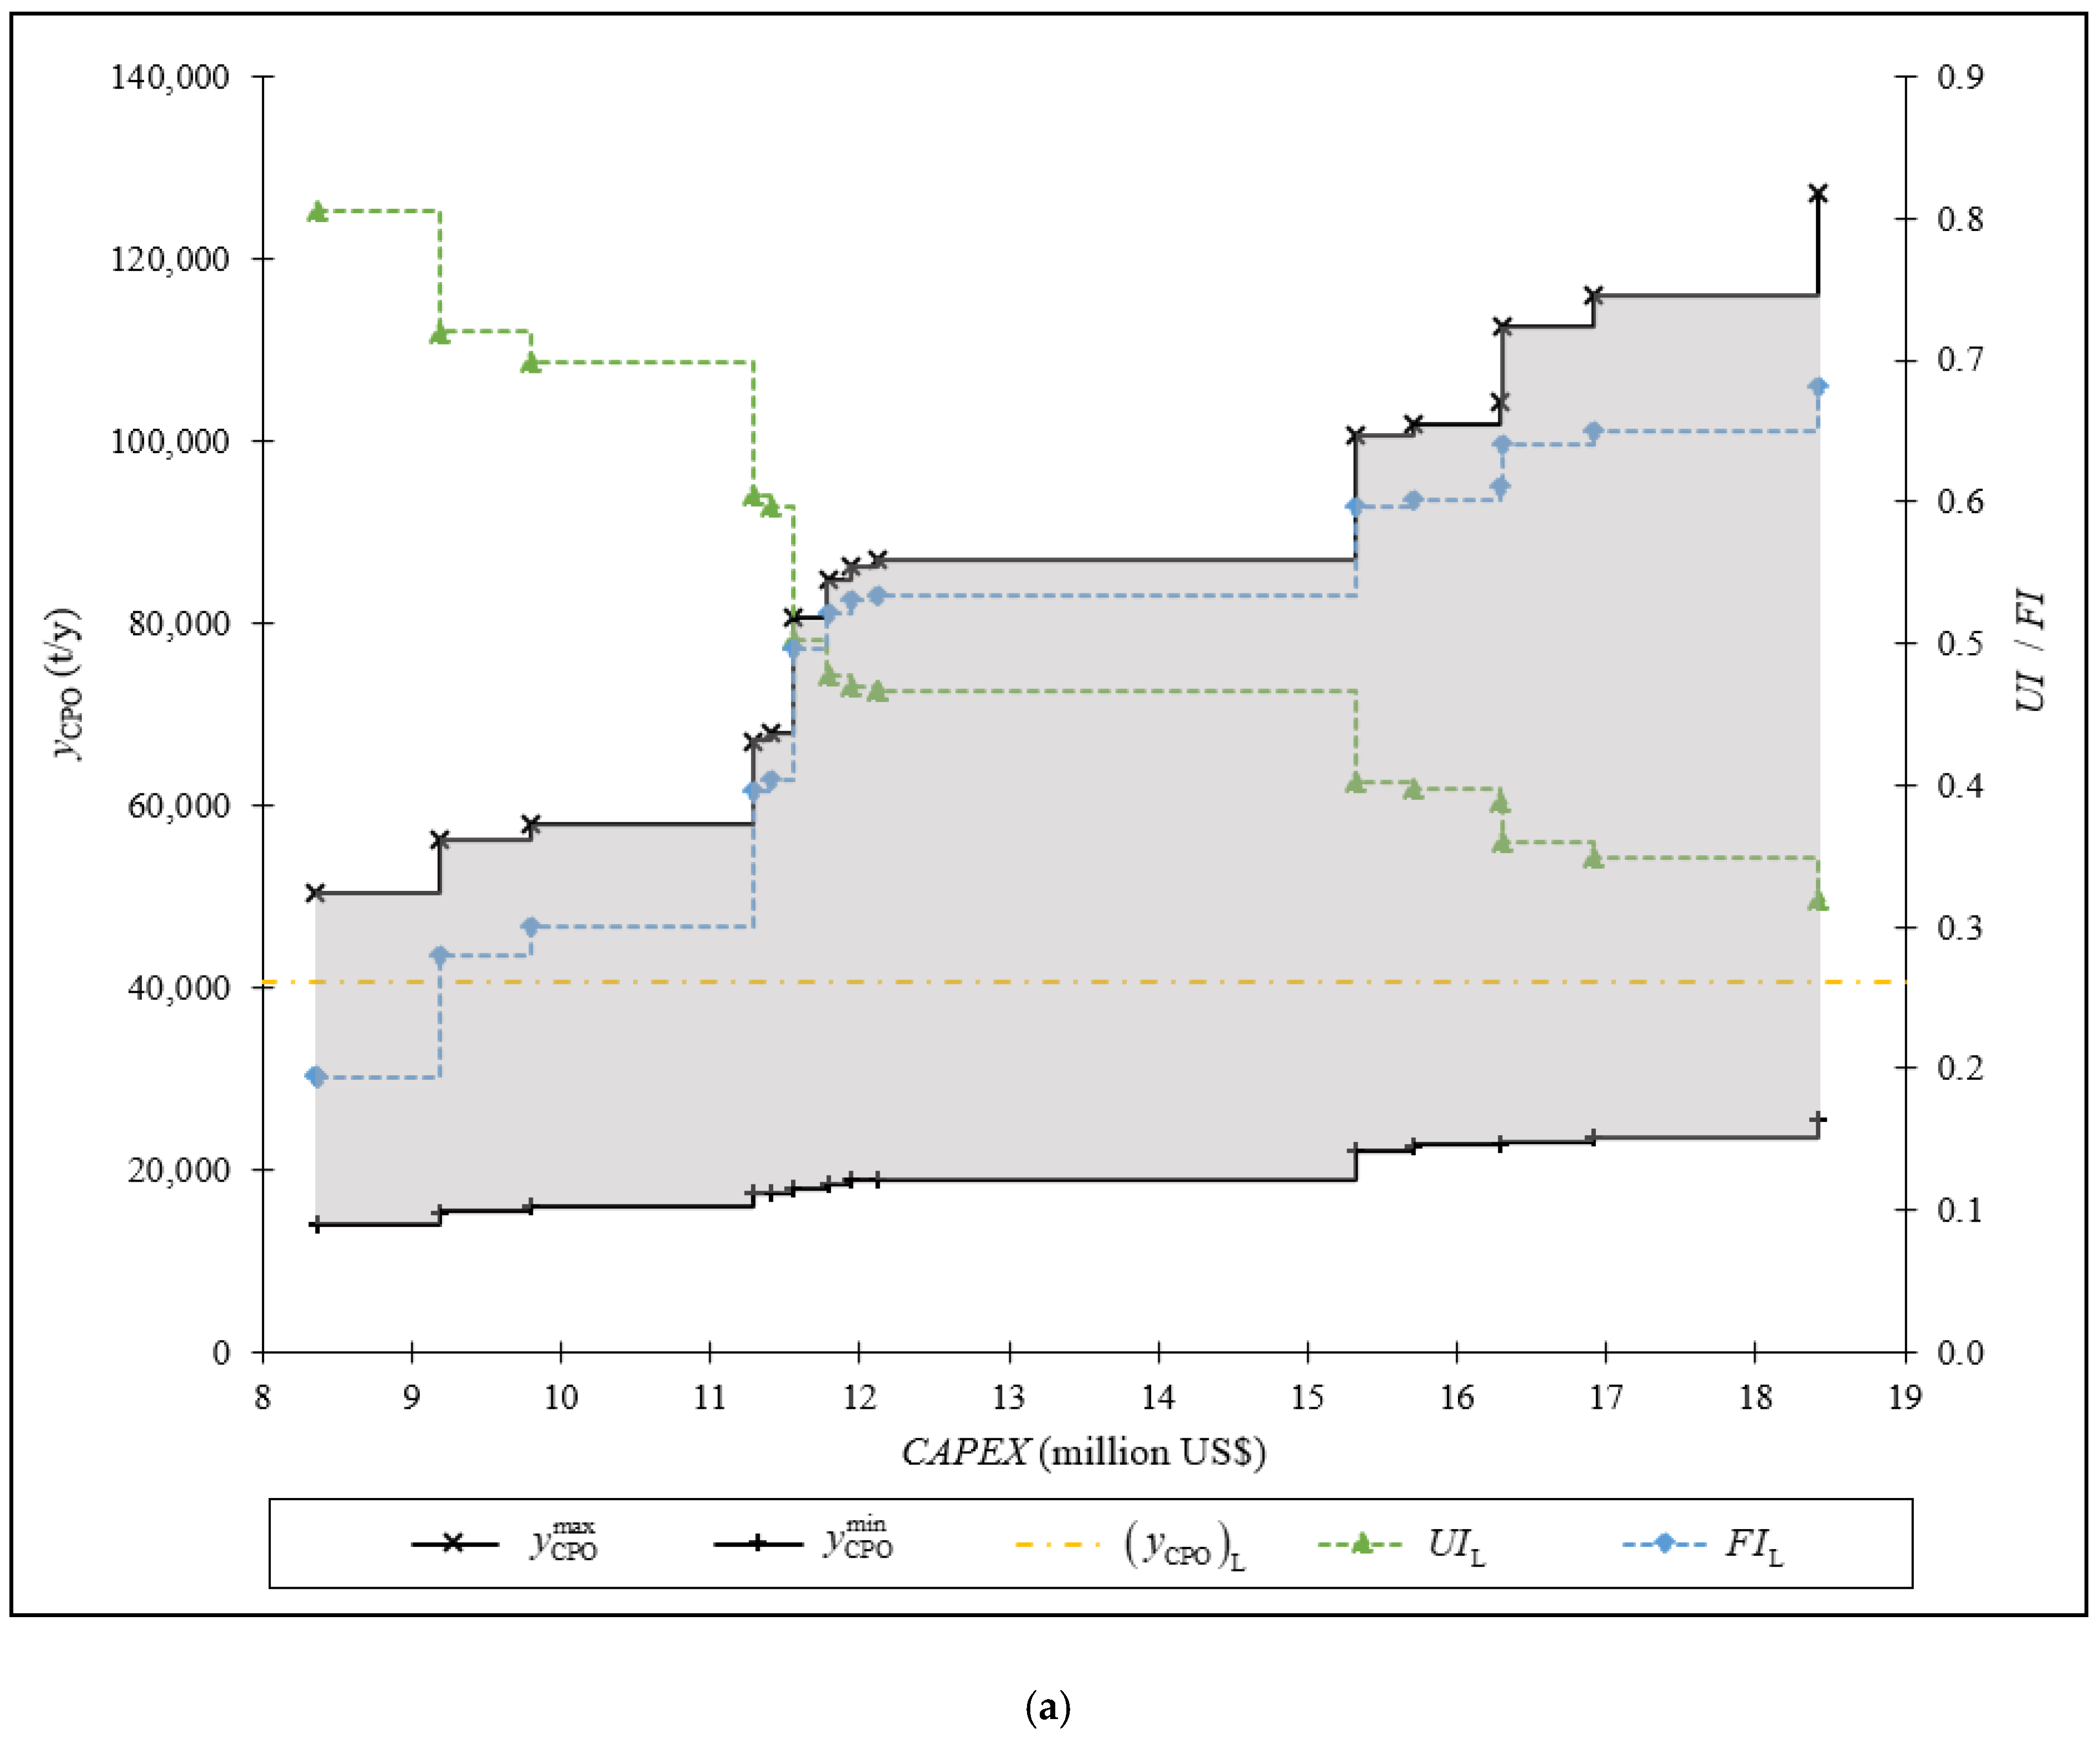
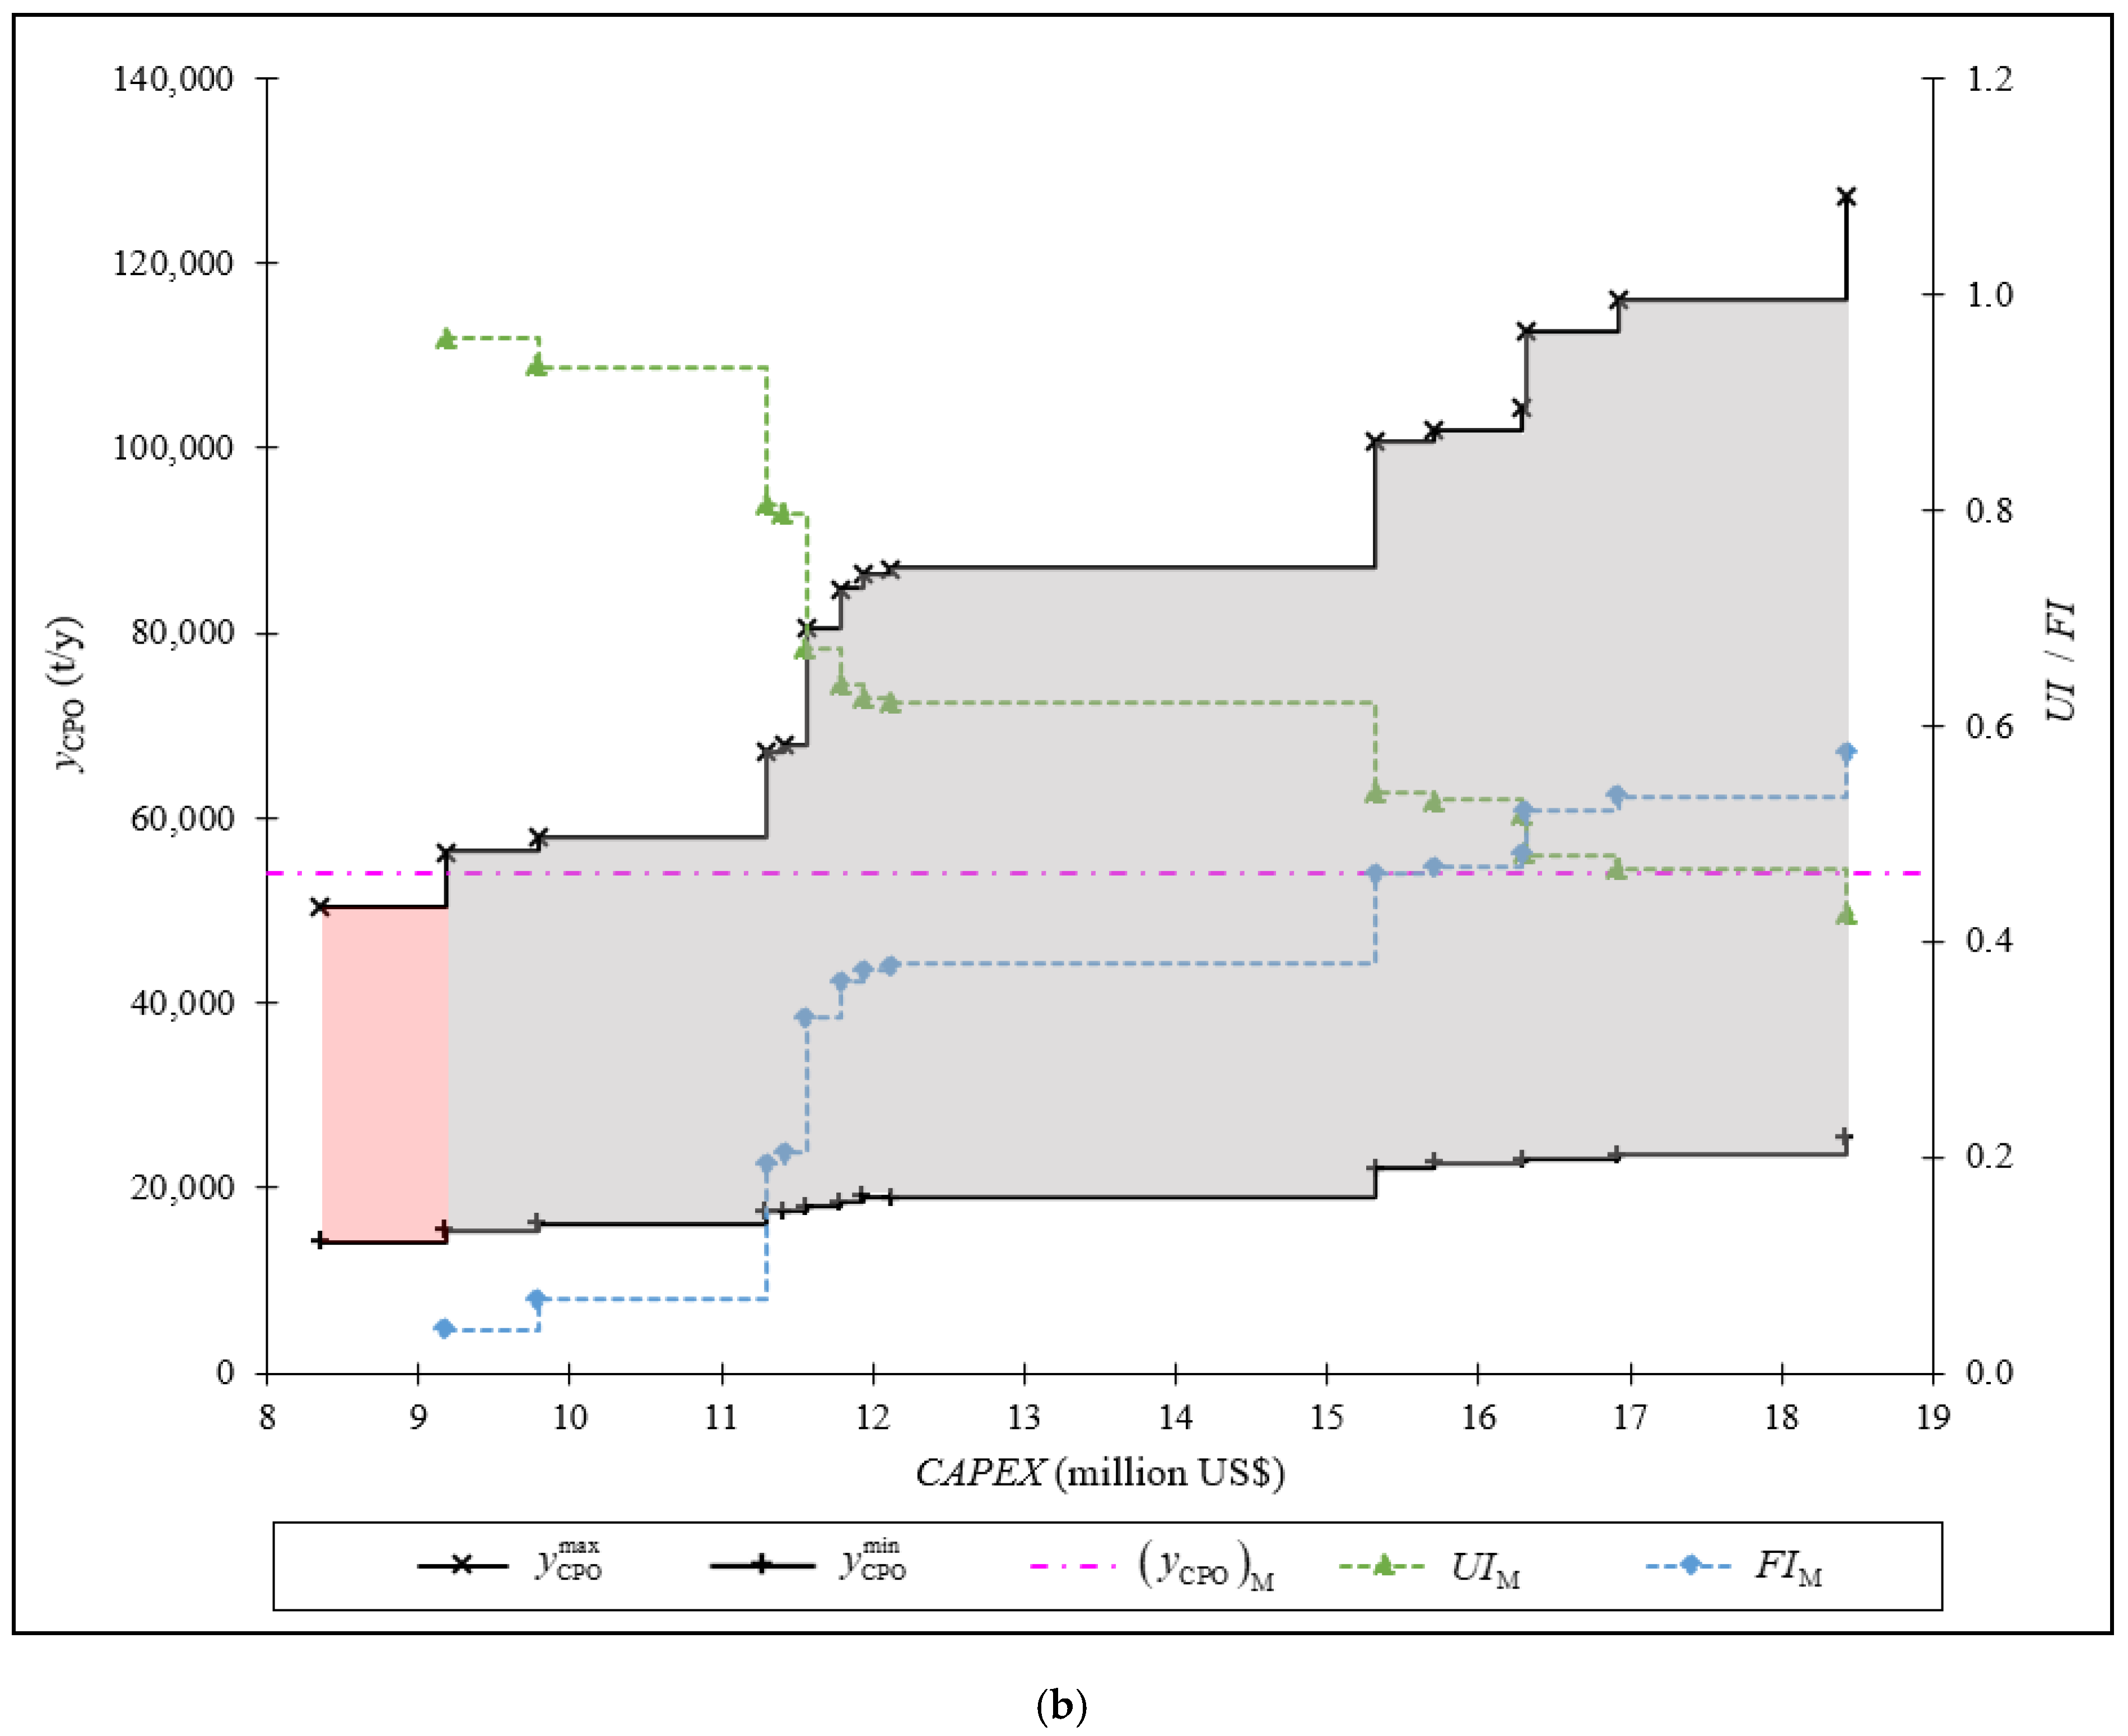
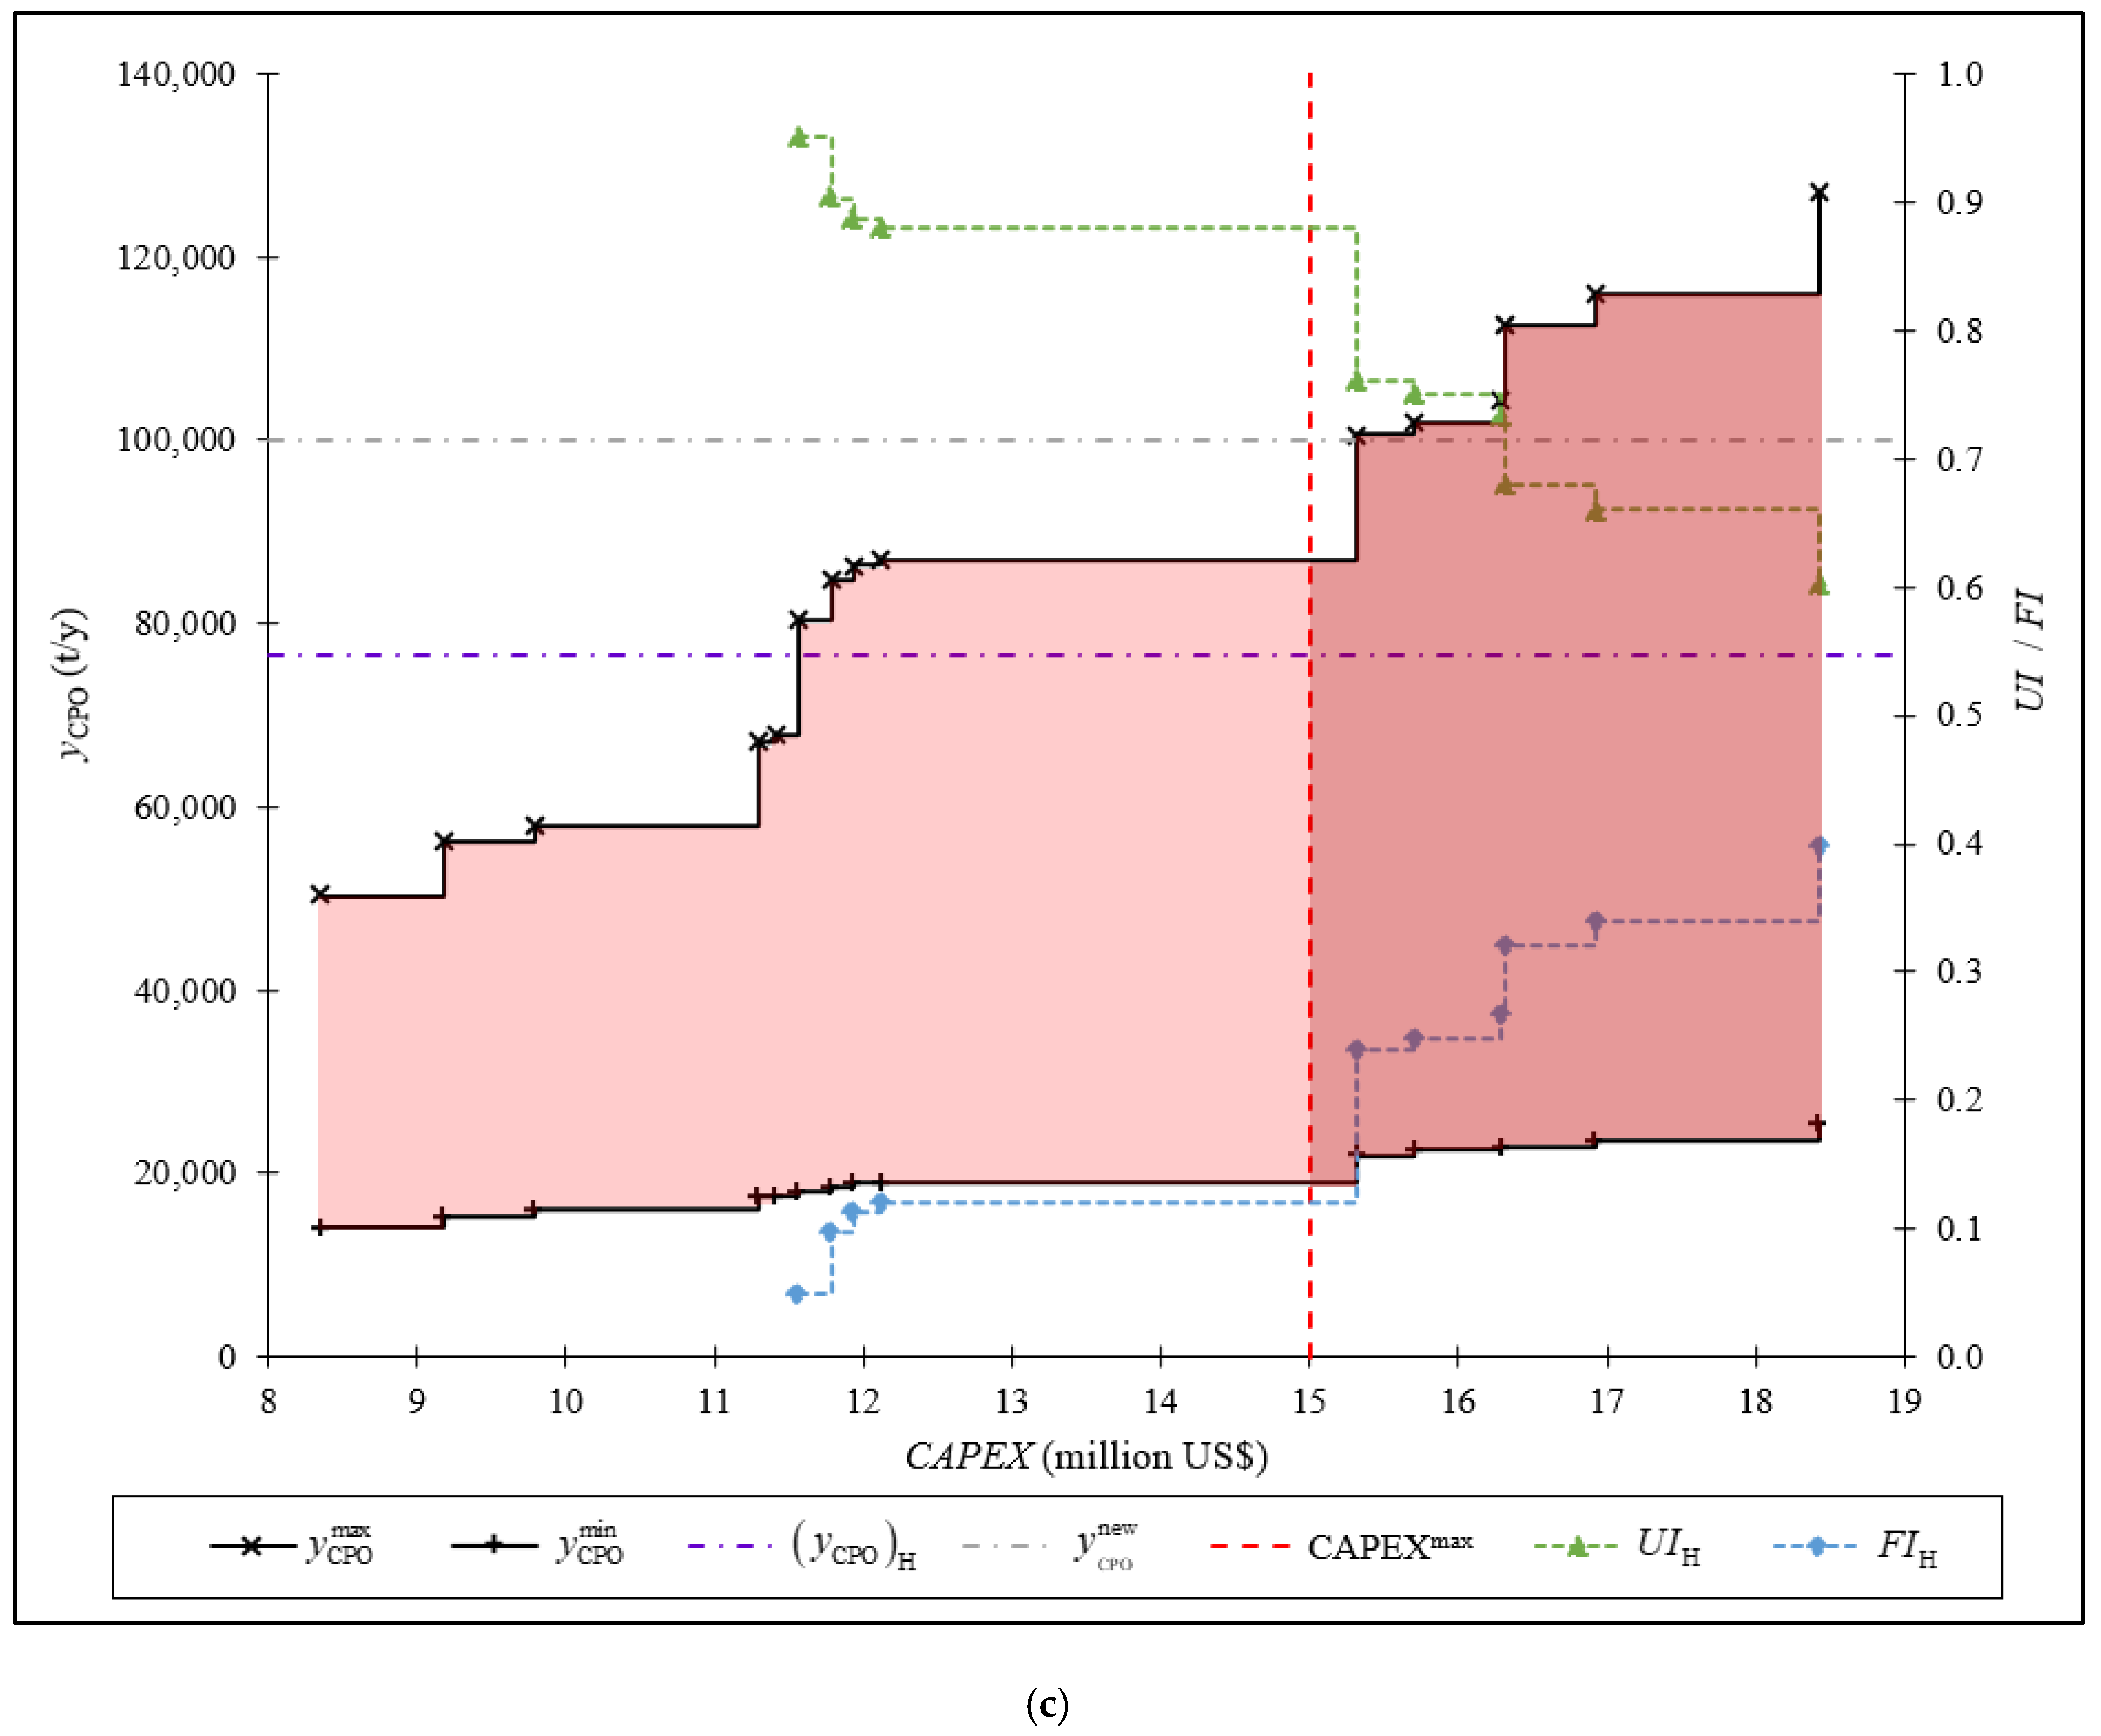
FORA is performed on the milling process based on Equations (16)–(18), subject to objective functions Equations (1) and (19) for each POM design while operational performance such as UI and FI are computed based on Equations (20)–(21). The analysis is performed for each increment in equipment unit added, beginning from the design with the smallest capacity of 18 units (optimised design during low crop season) to the design with the biggest capacity, 39 units in the baseline design. Graphical representations for FORA performed on different POM designs are presented in Figure 6 for different crop seasons and detailed information can be found in Table 11. From Figure 6a, we can see that the CPO production during low crop season, ( y CPO ) L falls within the entire feasible region, representing that each of the design can be used to achieve the output required. In this respect, the optimal operation will be determined from the trade-off between OTC, CAPEX and OPEX as a design with smaller capacity requires higher OTC but lower CAPEX and OPEX or vice versa. According to Table 8, Table 9 and Table 10, the POM is operated at smallest design capacity (CAPEX = US$8.36 million) with longer AOT of 5640 h/y (OTC = US$0.1 million/y) during the low crop season. However, the POM is operated in a different manner during medium crop season. 
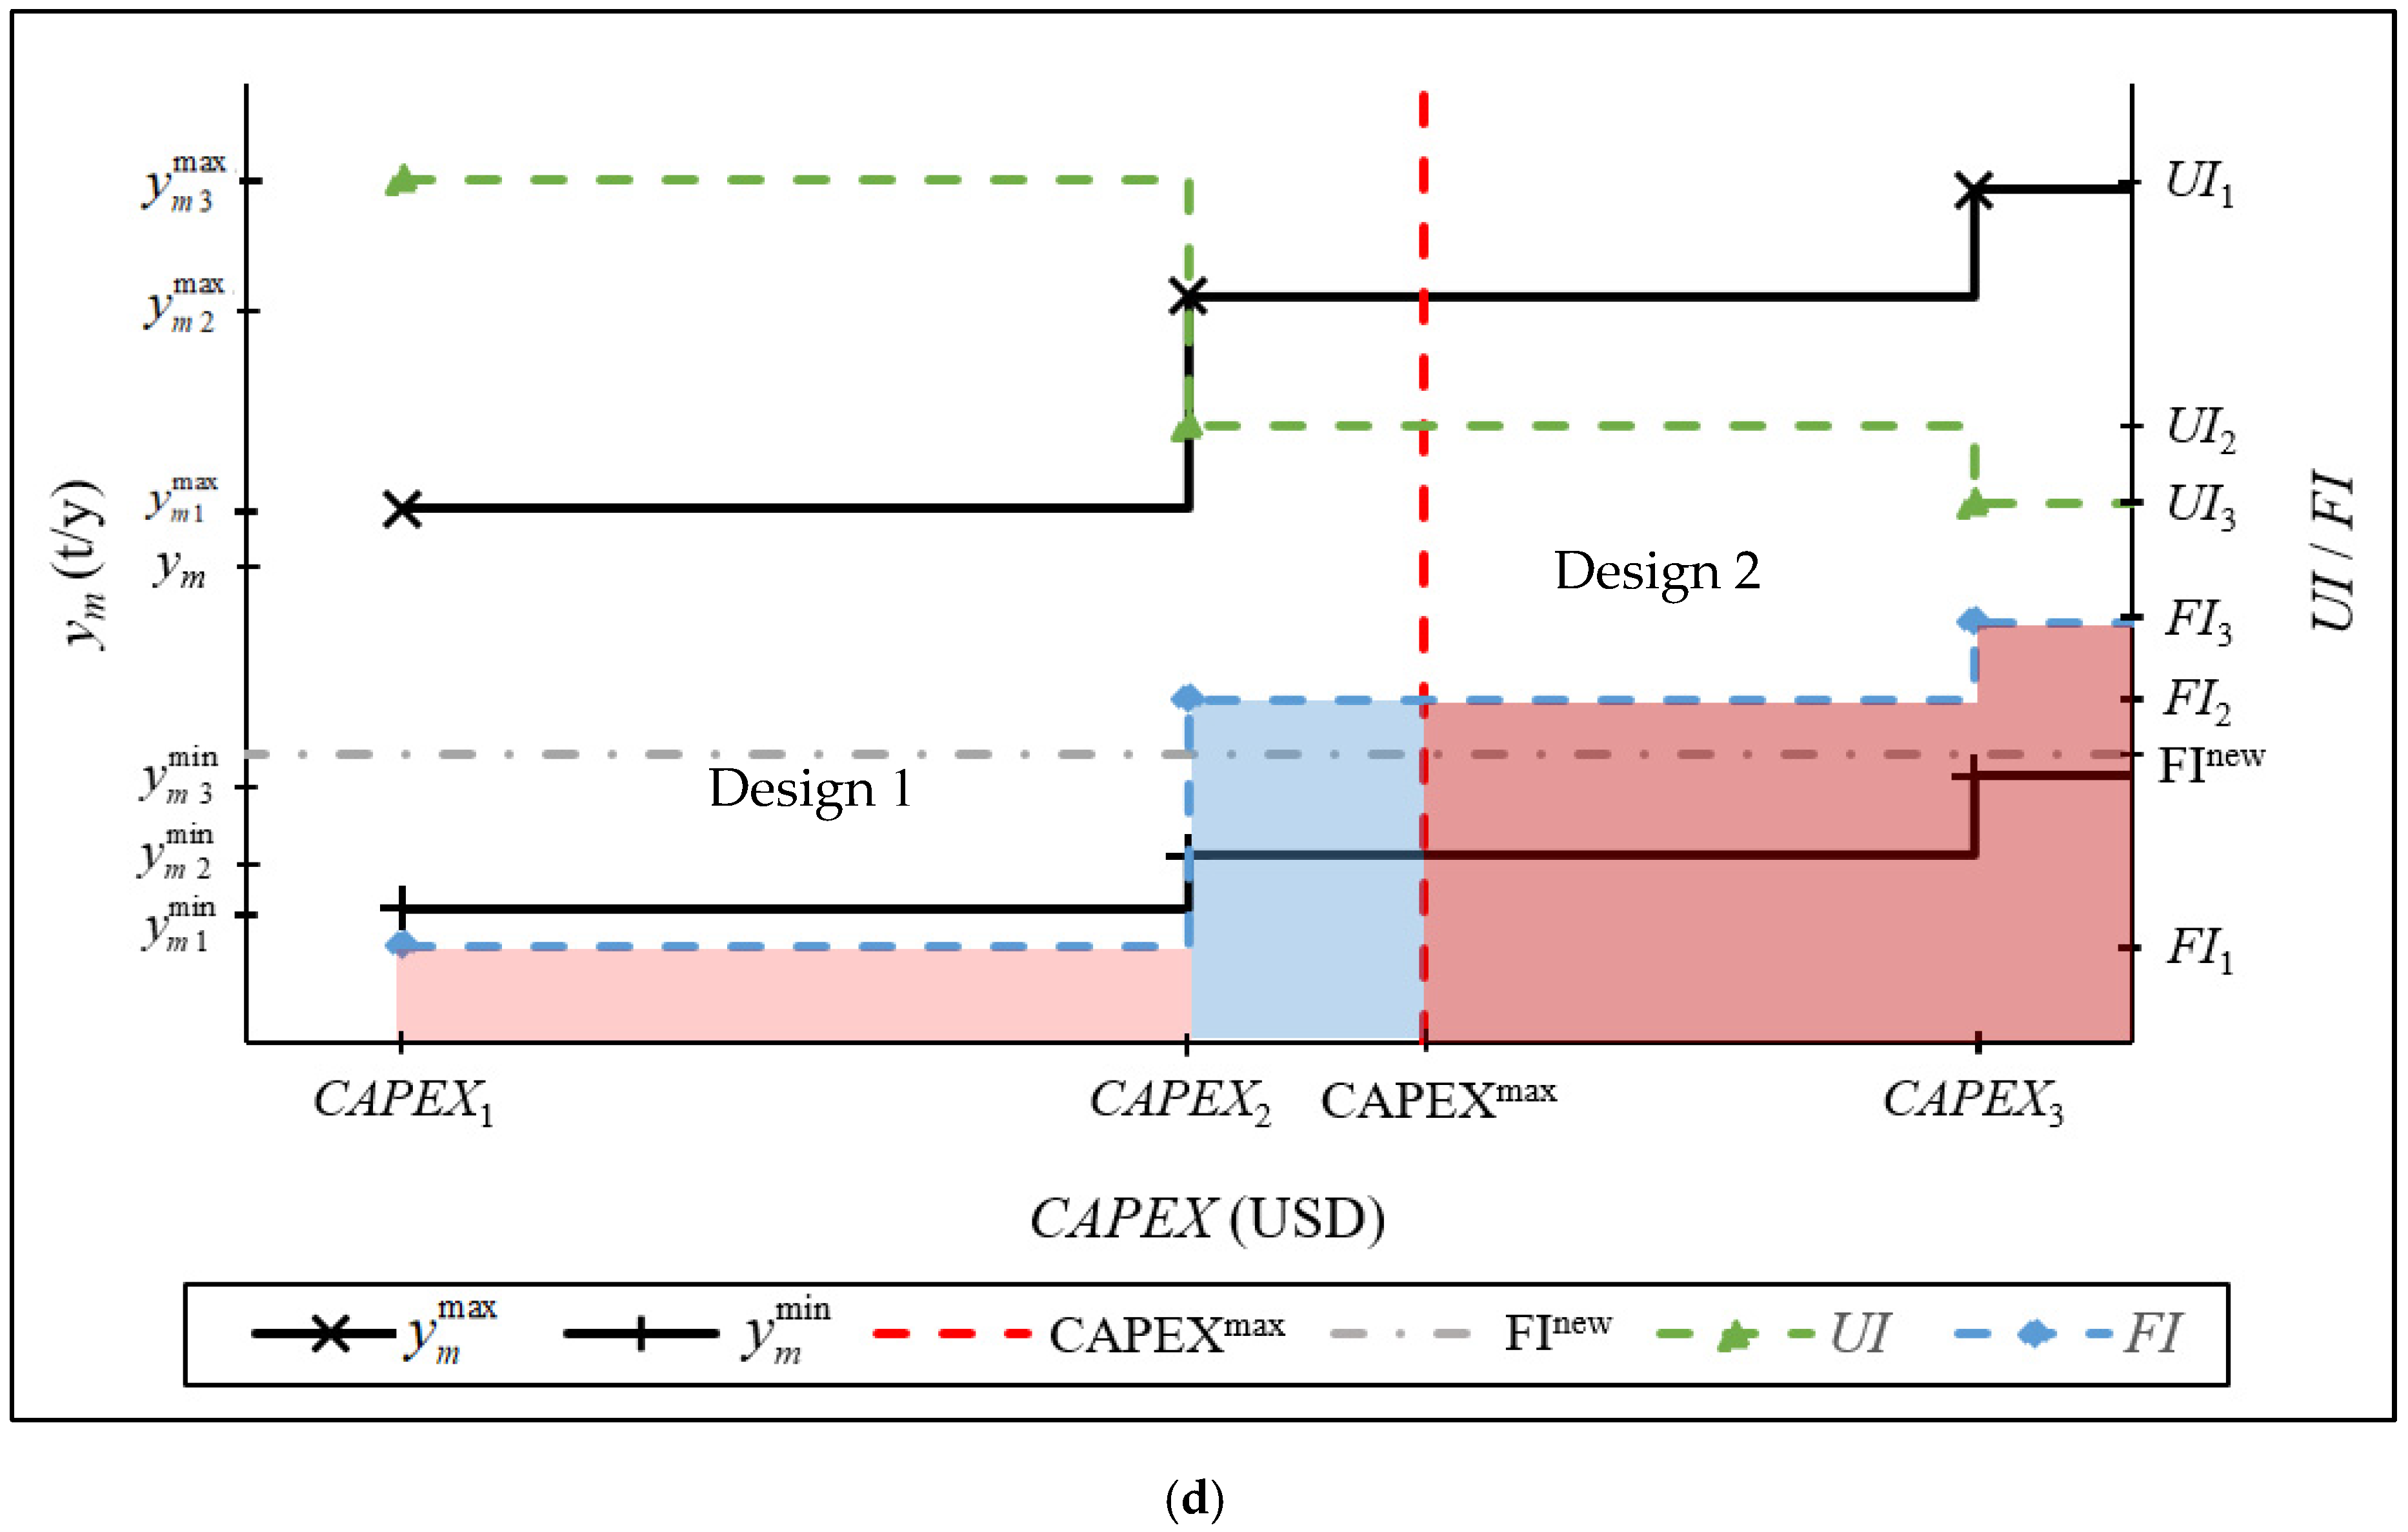
Figure 6b shows that (yCPO)M lies in the feasible range for POM designs with 21 equipment units (CAPEX = US$9.18 million) and higher. Rather than operating the process with the smallest capacity possible, it was operated at a higher capacity (26 equipment units, CAPEX = US$11.56 million) due to lower OTC of US$0.03 million/y (AOT = 4700). On the other hand, at least 26 equipment units are needed during high crop season as (yCPO)H falls out of the feasible operating range for smaller POM design as shown in Figure 6c. From the optimised results, the smallest possible design with higher OTC of US$0.17 million/y (AOT = 6660) is operated during this crop season.
Apart from determining the feasible operating range of each design, this approach also serves as a tool to pinpoint the technology bottleneck, additional CAPEX needed and y CPO max increment for the milling process in sequence. Table 11 shows that additional equipment units for vacuum dryer, double screw press and depricarper technologies are needed to increase y CPO max from 50,300 to 56,300 t/y. Three different bottlenecks occur at the same time and y CPO max can only be increased when all three equipment units added. It is then followed by MPS turbine and three-phase decanter to increase y CPO max from 56,300 to 58,000 t/y and so on. It also allows the cost-benefit ratio, CBR for each step to be performed via Equation (22), providing more insight into the effectiveness of any additional investment made.
C B R = C CPO ( y CPO max 2 y CPO max 1 ) C R F ( C A P E X 2 C A P E X 1 ) + ( O P E X 2 O P E X 1 )
Based on the yCPO for each crop season, the UI and FI vary with its design. Note that UI and FI can only be measured when yCPO falls within the feasible operating range. During high crop season, a more significant portion of the production capacity in the optimised design has been utilised (UI = 0.95) as compared to the baseline design with UI of 0.60. However, it reduces the flexibility from FI of 0.40 to 0.05. This indicates that even though a higher proportion of the production capacity utilised in the optimised design during high crop season, the flexibility is reduced. In the event where yCPO were to increase further, it is implausible for the optimised design to cope up with such changes, unless, additional equipment units for rotating drum separator, vertical clarifier, rolek nut cracker and so forth are added. For instance, when (yCPO)H is increased by 30% from 76,600 to 100,000 t/y, CAPEX of US$15.32 million and 31 equipment units will be needed to achieve the y CPO new as shown in Figure 6c. However, such increment could not be satisfied if CAPEXmax is limited at US$15 million. Thus, a maximum of 87,000 t/y CPO could be produced with such given constraint in CAPEX.

6. Conclusions

A hybrid methodology was developed in this work to optimise a typical palm oil milling process to achieve maximum economic performance, performing an analysis for its operations and providing a feasibility study on the developed system. This hybrid approach consists of generic formulations for IOM and FORA to represent a palm oil milling process. The proposed approach has been illustrated using a Malaysian palm oil mill case study with multiple crop seasons. In the case study, higher EP is achieved from the optimised POM design with a smaller capacity but longer operational time as compared to the baseline design used. The utilisation of the POM has been improved. However, the flexibility of the process is also reduced proportionally. FORA serve as a decision-making tool to determine the CAPEX required, based on the output required with other constraints considered. Future research work will be directed to consider partial load models for changes in power consumption and process efficiency of each equipment units, analysing the detailed performance of each equipment and possibility for process intensification. Besides, sensitivity analysis for selling electricity, uncertainties in product prices and raw material availability due to external reasons and FORA formulation with multiple products output as well as the integration of downstream processes such as biorefinery can be included for decision-making in the future.

Author Contributions

Conceptualization, S.Z.Y.F. and D.K.S.N.; methodology, S.Z.Y.F.; software, S.Z.Y.F. and D.K.S.N.; validation, V.A., R.R.T. and D.C.Y.F.; formal analysis, S.Z.Y.F., V.A. and D.K.S.N.; investigation, R.R.T. and D.C.Y.F.; resources, D.K.S.N.; data curation, S.Z.Y.F.; writing—original draft preparation, S.Z.Y.F.; writing—review and editing, V.A., R.R.T. and D.C.Y.F.; visualisation, S.Z.Y.F.; supervision, D.K.S.N.; funding acquisition, D.K.S.N.

Funding

This research was funded by the Ministry of Higher Education, Malaysia through LRGS Grant (LRGS/2013/UKM-UNMC/PT/05).

Acknowledgments

Credit to Havys Oil Mill Sdn Bhd for the industrial data provided to develop an industrial case study in this work.

Conflicts of Interest

The authors declare no conflict of interest. The funders had no role in the design, analyses and interpretation of any data of the study.

Nomenclature

Abbreviation
CPKOCrude Palm Kernel Oil
CPOCrude Palm Oil
FFBFresh Fruit Bunch
FORAFeasible Operating Range Analysis
IOInput-output
IOMInput-output Optimisation Model
PEFBPressed Empty Fruit Bunch
PKPalm Kernel
PKSPalm Kernel Shell
POMPalm Oil Mill
POMEPalm Oil Mill Effluent
PPFPalm Pressed Fibre
Sets
HIndex for high crop season
LIndex for low crop season
MIndex for medium crop season
mIndex for material
sIndex for crop season
teIndex for technology
Variables
AOTAnnual operational time
BteTechnology te bottleneck
CAPEXTotal capital costs
CAPEX1Total capital costs for design 1
CAPEX2Total capital costs for design 2
CAPEX3Total capital costs for design 3
CBRCost-benefit ratio
CRFCapital recovery factor
EDemandTotal electricity demand
EPEconomic performance
FIFlexibility index
GPTotal gross profit
LCTotal labour costs
OPEXTotal operating costs
OTCTotal overtime costs
UIUtilisation index
UteNumber of equipment unit operated for technology te
xteProcessing capacity of technology te
yCPOCrude palm oil output
y CPO new New crude palm oil output
yelectricityElectricity output
yFFBFresh fruit bunch input
ymInput or output of material m
y CPO max Maximum crude palm oil output
y m max Maximum input or output of material m
y m 1 max Maximum input or output of material m for design 1
y m 2 max Maximum input or output of material m for design 2
y m 3 max Maximum input or output of material m for design 3
y CPO min Minimum crude palm oil output
y m min Minimum input or output of material m
y m 1 min Minimum input or output of material m for design 1
y m 2 min Minimum input or output of material m for design 2
y m 3 min Minimum input or output of material m for design 3
y m new New input or output of material m
Parameters
αsFraction of occurrence for crop season s
AMatrix of material input and output ratios to and from technology te
am,teFixed interaction ratios between material m and technology te
AOTmaxMaximum annual operating time
ASTAnnual shift time
CAPEXmaxMaximum total capital costs
CAPteNominal capacity of technology te
CAP t e max Maximum capacity of technology te
( CAP t e max )−1Inverse matrix for maximum capacity of technology te
CAP t e 1 Inverse matrix for nominal capacity of technology te
CCteCapital cost for technology te
ClabCost of material m
CmTotal overtime costs
COTSpecific overtime cost
EteDiagonal matrix for electricity consumption specified per unit technology te
FInewNew flexibility index
nwkNumber of workers per shift
nwsNumber of working shifts per day
OCteOperating and maintenance costs for technology te
rDiscount rate
t t e max Operational lifespan for technology te
U t e max Maximum units of technology te installed

References

  1. Petrenko, C.; Paltseva, J.; Searle, S. Ecological Impacts of Palm Oil Expansion in Indonesia; International Council on Clean Transportation: Washington, DC, USA, 2016. [Google Scholar]
  2. Reeves, J.B.; Weihrauch, J.L. Composition of Foods: Fats and Oils: Raw, Processed, Prepared; Agricultur.; United States Department of Agriculture Science and Education Administration: Washington, DC, USA, 1979.
  3. Varkkey, H.; Tyson, A.; Choiruzzad, S.A.B. Palm oil intensification and expansion in Indonesia and Malaysia: Environmental and socio-political factors influencing policy. For. Policy Econ. 2018, 92, 148–159. [Google Scholar] [CrossRef]
  4. Jekayinfa, S.O.; Bamgboye, A.I. Energy Requirements for Palm-kernel Oil Processing Operations. Nutr. Food Sci. 2004, 34, 166–173. [Google Scholar] [CrossRef]
  5. Ng, R.T.L.; Ng, D.K.S. Systematic Approach for Synthesis of Integrated Palm Oil Processing Complex. Part 1: Single Owner. Ind. Eng. Chem. Res. 2013, 52, 10206–10220. [Google Scholar] [CrossRef]
  6. Foong, S.Z.Y.; Lam, Y.L.; Andiappan, V.; Foo, D.C.Y.; Ng, D.K.S. A Systematic Approach for the Synthesis and Optimization of Palm Oil Milling Processes. Ind. Eng. Chem. Res. 2018, 57, 2945–2955. [Google Scholar] [CrossRef]
  7. Umar, M.S.; Jennings, P.; Urmee, T. Sustainable electricity generation from oil palm biomass wastes in Malaysia: An industry survey. Energy 2014, 67, 496–505. [Google Scholar] [CrossRef] [Green Version]
  8. Abdullah, N.; Sulaiman, F. The Oil Palm Wastes in Malaysia. In Biomass Now: Sustainable Growth and Use; Matovic, M.D., Ed.; InTech: Rijeka, Croatia, 2013; pp. 75–93. [Google Scholar]
  9. Yusniati; Parinduri, L.; Sulaiman, O.K. Biomass Analysis at Palm Oil Factory as an Electric Power Plant. J. Phys. Conf. Ser. 2018, 1007, 12053. [Google Scholar] [CrossRef]
  10. Umar, M.S.; Urmee, T.; Jennings, P. A policy framework and industry roadmap model for sustainable oil palm biomass electricity generation in Malaysia. Renew. Energy 2018, 128, 275–284. [Google Scholar] [CrossRef]
  11. Husain, Z.; Zainal, Z.A.; Abdullah, M.Z. Analysis of Biomass-Residue-Based Cogeneration System in Palm Oil Mills. Biomass Bioenergy 2003, 24, 117–124. [Google Scholar] [CrossRef]
  12. Zafar, S. Energy Potential of Palm Kernel Shells. Available online: https://www.bioenergyconsult.com/tag/pks-market-trends/ (accessed on 4 August 2018).
  13. Husain, Z.; Zainac, Z.; Abdullah, Z. Briquetting of Palm Fibre and Shell from the Processing of Palm Nuts to Palm Oil. Biomass Bioenergy 2002, 22, 505–509. [Google Scholar] [CrossRef]
  14. van Dam, J.E.G.; Elbersen, H.W. Palm Oil Production for Oil and Biomass: The Solution for Sustainable Oil Production and Certifiably Sustainable Biomass Production? 2004. Available online: http://library.wur.nl/WebQuery/wurpubs/350255 (accessed on 4 August 2018).
  15. Yusuf, E.A. Development and Evaluation of Organic Biofertilizer Using Oil Palm Empty Fruit Bunch as Composted Medium for Vegetable Gardening. Ph.D. Thesis, University Malaysia Sarawak, Kota Samarahan, Malaysia, 2014. [Google Scholar]
  16. Tong, S.L.; Jaafar, A.B. Waste to Energy: Methane Recovery from Anaerobic Digestion of Palm Oil Mill Effluent. Energy Smart 2004, 4, 1–8. [Google Scholar]
  17. Yu-Lee, R.T. Essentials of Capacity Management; Wiley: Hoboken, NJ, USA, 2002; ISBN 0471207462. [Google Scholar]
  18. Mohamad, F.; Mat Tahar, R.; Awang, N. Evaluating Capacity Of Palm Oil Mill Using Simulation Towards Effective Supply Chain—A Case Study. In Proceedings of the International Conference Management, Penang, Malaysia, 13–14 June 2011. [Google Scholar]
  19. Ibarahim, H.R.; Thani, M.I.; Hussin, R.; Ramlah, W.; Sulaiman, M.S. Industrial Processes & The Environment (Handbook No. 3): The Crude Palm Oil Industry; Department of Environment: Putrajaya, Malaysia, 1999. [Google Scholar]
  20. Malaysian Palm Oil Board (MPOB). Oil Palm Estates, January–December 2017; MPOB: Kuching, Malaysia, 2018. [Google Scholar]
  21. Sharifzadeh, M. Integration of Process Design and Control: A review. Chem. Eng. Res. Des. 2013, 91, 2515–2549. [Google Scholar] [CrossRef]
  22. Azman, I. The Impact of Palm Oil Mills’ Capacity on Technical Efficiency of Palm Oil Millers in Malaysia. Oil Palm Ind. Econ. J. 2014, 14, 35–41. [Google Scholar]
  23. Leontief, W.W. Quantitative Input and Output Relations in the Economic Systems of the United States. Rev. Econ. Stat. 1936, 18, 105–125. [Google Scholar] [CrossRef]
  24. Noel, V.M.; Omega, R.S.; Masbad, J.G.; Ocampo, L. Supply input-output economics in process prioritisation of interdependent manufacturing systems. Int. J. Manag. Decis. Mak. 2017, 16, 1–23. [Google Scholar] [CrossRef]
  25. Duchin, F. Industrial Input-output Analysis: Implications for Industrial Ecology. Proc. Natl. Acad. Sci. USA 1992, 89, 851–855. [Google Scholar] [CrossRef] [PubMed]
  26. Ukidwe, N.U.; Bakshi, B.R. Resource Intensities of Chemical Industry Sectors in the United States via Input–Output Network Models. Comput. Chem. Eng. 2008, 32, 2050–2064. [Google Scholar] [CrossRef]
  27. Egilmez, G.; Kucukvar, M.; Tatari, O.; Bhutta, M.K.S. Supply Chain Sustainability Assessment of the U.S. Food Manufacturing Sectors: A Life Cycle-Based Frontier Approach. Resour. Conserv. Recycl. 2014, 82, 8–20. [Google Scholar] [CrossRef]
  28. Rocco, M.V.; Di Lucchio, A.; Colombo, E. Exergy Life Cycle Assessment of electricity production from Waste-to-Energy technology: A Hybrid Input-Output approach. Appl. Energy 2017, 194, 832–844. [Google Scholar] [CrossRef]
  29. Pairotti, M.B.; Cerutti, A.K.; Martini, F.; Vesce, E.; Padovan, D.; Beltramo, R. Energy Consumption and GHG Emission of the Mediterranean Diet: A Systemic Assessment using a Hybrid LCA-IO Method. J. Clean. Prod. 2015, 103, 507–516. [Google Scholar] [CrossRef]
  30. Tan, R.R.; Aviso, K.B.; Cayamanda, C.D.; Chiu, A.S.F.; Promentilla, M.A.B.; Ubando, A.T.; Yu, K.D.S. A Fuzzy Linear Programming Enterprise Input–Output Model for Optimal Crisis Operations in Industrial Complexes. Int. J. Prod. Econ. 2016, 181, 410–418. [Google Scholar] [CrossRef]
  31. Jing, D.; Chun-you, W. Multiobjective Optimization Model for Industrial Ecosystem Based on Input-Output Analysis: A Case Study of Combined Heat and Power Plant Eco-industrial Park. In Proceedings of the 2007 International Conference on Management Science and Engineering, Harbin, China, 20–22 August 2007; pp. 1316–1321. [Google Scholar]
  32. Ubando, A.T.; Culaba, A.B.; Tan, R.R.; Ng, D.K.S. A Systematic Approach for Optimization of an Algal Biorefinery Using Fuzzy Linear Programming. Comput. Aided Chem. Eng. 2012, 31, 805–809. [Google Scholar]
  33. Tan, R.R.; Yu, K.D.S.; Aviso, K.B.; Promentilla, M.A.B. Input–Output Modeling Approach to Sustainable Systems Engineering. Encycl. Sustain. Technol. 2017, 519–523. [Google Scholar] [CrossRef]
  34. Aviso, K.B.; Mayol, A.P.; Promentilla, M.A.B.; Santos, J.R.; Tan, R.R.; Ubando, A.T.; Yu, K.D.S. Allocating Human Resources in Organizations Operating under Crisis Conditions: A Fuzzy Input-Output Optimization Modeling Framework. Resour. Conserv. Recycl. 2018, 128, 250–258. [Google Scholar] [CrossRef]
  35. Foong, S.Z.Y.; Goh, C.K.M.; Supramaniam, C.V.; Ng, D.K.S. Input–output Optimisation Model for Sustainable Oil Palm Plantation Development. Sustain. Prod. Consum. 2019, 17, 31–46. [Google Scholar] [CrossRef]
  36. Cleveland, W.S.; Mcgill, R. We have studied the elementary Graphical Perception and Graphical Methods for Analyzing Scientific Data. Science 2009, 229, 828–833. [Google Scholar] [CrossRef]
  37. Linnhoff, B.; Townsend, D.W.; Boland, D.; Hewitt, G.F.; Thomas, B.E.A.; Guy, A.R.; Marsland, R.H. User Guide on Process Integration for the Efficient Use of Energy, 1st ed.; Institution of Chemical Engineers: Rugby, UK, 1982; ISBN 0852951566. [Google Scholar]
  38. Friedler, F.; Tarjan, K.; Huang, Y.W.; Fan, L.T. Graph-theoretic approach to process synthesis: Polynomial algorithm for maximal structure generation. Comput. Chem. Eng. 1993, 17, 929–942. [Google Scholar] [CrossRef]
  39. Linnhoff, B. Pinch Analysis—A State-of-the-Art Overview. Chem. Eng. Res. Des. 1993, 71, 503–522. [Google Scholar]
  40. Foo, D.C.Y. State-of-the-art review of pinch analysis techniques for Water network synthesis. Ind. Eng. Chem. Res. 2009, 48, 5125–5159. [Google Scholar] [CrossRef]
  41. Teng, W.C.; Fong, K.L.; Shenkar, D.; Wilson, J.A.; Foo, D.C.Y. Piper diagram—A novel visualisation tool for process design. Chem. Eng. Res. Des. 2016, 112, 132–145. [Google Scholar] [CrossRef]
  42. Andiappan, V.; Ng, D.K.S.; Tan, R.R. Design Operability and Retrofit Analysis (DORA) framework for energy systems. Energy 2017, 134, 1038–1052. [Google Scholar] [CrossRef]
  43. Kasivisvanathan, H.; Tan, R.R.; Ng, D.K.S.; Abdul Aziz, M.K.; Foo, D.C.Y. Heuristic framework for the debottlenecking of a palm oil-based integrated biorefinery. Chem. Eng. Res. Des. 2014, 92, 2071–2082. [Google Scholar] [CrossRef]
  44. Grossmann, I.E.; Halemane, K.P.; Swaney, R.E. Optimization strategies for flexible chemical processes. Comput. Chem. Eng. 1983, 7, 439–462. [Google Scholar] [CrossRef] [Green Version]
  45. LINDO Systems Inc. LINGO the Modelling Language and Optimizer; LINDO Systems Inc.: Chicago, IL, USA, 2017. [Google Scholar]
Figure 1. Unit operations in a typical palm oil mills (POM) [6].
Processes 07 00100 g001
Figure 2. (a) FORA for a generic process. (b) FORA with y m new within the CAPEXmax constraints. (c) FORA with y m new exceeding the CAPEXmax constraints. (d) FORA with FInew and CAPEXmax constraints.
Processes 07 00100 g002aProcesses 07 00100 g002bProcesses 07 00100 g002c
Figure 3. Baseline POM design.
Processes 07 00100 g003
Figure 4. Optimised POM design.
Processes 07 00100 g004
Figure 5. Costs allocation for a baseline against optimised palm oil mill design.
Processes 07 00100 g005
Figure 6. (a) Graphical representations for FORA performed during low crop season. (b) Graphical representations for FORA performed during medium crop season. (c) Graphical representations for FORA performed during high crop season with y CPO new .
Processes 07 00100 g006aProcesses 07 00100 g006bProcesses 07 00100 g006c
Table 1. The fraction of occurrence and FFB availability for different crop seasons.
Crop SeasonFraction of Occurrence, αsFFB Availability, yFFB (t/y)
LowαL = 0.417−195,800
MediumαM = 0.333−261,000
HighαH = 0.250−369,800
Average−261,000
Reprinted (adapted) with permission from [6], copyright (2018) American Chemical Society.
Table 2. Economic parameters for baseline POM design.
Economic ParametersLow SeasonMedium SeasonHigh SeasonAverage
Total capital costs, CAPEX (million US$)18.4218.42
Annualised CAPEX (million US$/y)1.771.77
Labour costs, LC (million US$/y)0.140.14
Total operating costs, OPEX (million US$/y)1.131.331.871.38
Gross Profit, GP (million US$/y)3.895.648.105.53
Economic Performance, EP (million US$/y)2.123.876.323.75
Reprinted (adapted) with permission from [6], copyright (2018) American Chemical Society.
Table 3. Material and energy flows for baseline POM design.
Material FlowsLow SeasonMedium SeasonHigh SeasonAverage
(t/h)(t/y)(t/h)(t/y)(t/h)(t/y)(t/h)(t/y)
Low pressure steam, LPS−15.3−66,600−20.3−88,300−28.8−125,300−20.3−88,500
Utility water−13.4−58,300−17.8−77,400−25.3−110,000−17.8−77,500
Crude palm oil, CPO9.340,50012.454,00017.676,60012.454,000
Palm kernel, PK3.314,5004.519,5006.428,0004.519,500
Palm pressed fibre, PPF00000000
Palm kernel shell, PKS1.460002.912,8004.318,8002.611,500
Pressed empty fruit bunch, PEFB8.537,00011.349,00015.969,00011.349,000
Palm oil mill effluent, POME31.3136,00041.7181,50059.1257,00041.7181,500
Energy Flows(kW)(MWh/y)(kW)(MWh/y)(kW)(MWh/y)(kW)(MWh/y)
Electricity demand, EDemand (kW)9904292110049671600693312005178
Reprinted (adapted) with permission from [6], copyright (2018) American Chemical Society.
Table 4. Technology units operated for baseline POM design.
Technology Units Operated (units)Low SeasonMedium SeasonHigh Season
Tilted steriliser335
Rotating drum separator122
Oil pressing screw122
Steam injection digester233
Double screw press223
Depricarper223
Rolek nut cracker122
Four-stage winnowing column111
Vertical clarifier234
Vacuum dryer223
Three-phase decanter223
Oil recovery pit122
Water tube boiler122
High-pressure steam turbine111
Medium-pressure steam turbine223
Total243139
Reprinted (adapted) with permission from [6], copyright (2018) American Chemical Society.
Table 5. Process matrix A for palm oil milling process.
Material/Technologyte = 1te = 2te = 3te = 4te = 5te = 6te = 7te = 8te = 9te = 10te = 11te = 12te = 13te = 14te = 15te = 16te = 17te = 18
Tilted Steriliser (t/h)Rotating Drum Separator (t/h)Oil Pressing Screw (t/h)Steam Injection Digester (t/h)Double Screw Press (t/h)Depricarper (t/h)Rolek Nut Cracker (t/h)Four-Stage Winnowing Column (t/h)Vertical Clarifier (t/h)Oil Recovery (t/h)Vacuum Dryer (t/h)Three- Phase Decanter (t/h)Oil Recovery Pit (t/h)PPF Combustion (t/h)PKS Combustion (t/h)Water Tube Boiler (t/h)HPS Turbine (kW)MPS Turbine (kW)
m = 1Fresh fruit bunch, FFB (t)−100000000000000000
m = 2Utility water (t)00000000−0.696000000000
m = 3Steam lost (t)0.12000.1160000000.1380000000
m = 4Sterilised fruit bunch (t)0.9−10000000000000000
m = 5Empty fruit bunch, EFB (t)00.24−1000000000000000
m = 6Sterilised fruitlet (t)00.760−100000000000000
m = 7Digested fruitlet (t)0001.04−10000000000000
m = 8Pressed liquid (t)00000.6000-1000000000
m = 9Pressed cake (t)00000.4−1000000000000
m = 10Palm fruit nut (t)000000.59−100000000000
m = 11Cracked nut (t)0000000.99−10000000000
m = 12Nut lost (t)0000000.0100000000000
m = 13Aqueous phase (t)000000001.15600-1000000
m = 14Organic phase (t)000000000.540-10000000
m = 15Palm pressed fibre, PPF (t)000000.4100.1900000−10000
m = 16Palm kernel shell, PKS (t)00000000.357000000−1000
m = 17Pressed empty fruit bunch, PEFB (t)000.868000000000000000
m = 18Decanter cake (t)000000000000.113000000
m = 19Crude palm oil, CPO (t)0000000000.360.8280000000
m = 20Palm kernel, PK(t)00000000.4530000000000
m = 21Recovered oil (t)000.132000000−100.020.009700000
m = 22Palm oil mill effluent, POME (t)0.23000000000.640.0340.867−100000
m = 23Deoiled POME (t)0000000000000.990300000
m = 24Boiler feed water (t)000000000000000−100
m = 25Boiler ash (t)00000000000000.04230.039000
m = 26Low heating value (MJ)00000000000001338817804−5151.800
m = 27Low pressure steam, LPS (t)−0.300−0.15600000000000000.0316
m = 28Medium pressure steam, MPS (t)00000000000000000.0735−0.0316
m = 29High pressure steam, HPS (t)0000000000000001−0.07350
m = 30Electricity (kW)000000000000000011
Table 6. Technology specifications for palm oil milling process.
Technology Specificationste = 1te = 2te = 3te = 4te = 5te = 6te = 7te = 8te = 9te = 10te = 11te = 12te = 13te = 14te = 15te = 16te = 17te = 18
Tilted SteriliserRotating Drum SeparatorOil Pressing ScrewSteam Injection DigesterDouble Screw PressDepricarperRolek Nut CrackerFour-Stage Winnowing ColumnVertical ClarifierOil RecoveryVacuum DryerThree- Phase DecanterOil Recovery PitPPF CombustionPKS CombustionWater Tube BoilerHPS TurbineMPS Turbine
Capacity, CAPte (t/h.unit or kW/unit)20501020251010151010082041100100251000500
Electricity, Ete (kW/unit)75.42815184069312932035505.500000
Capital costs, CCte (million US$/unit)1.20.230.120.150.180.250.180.250.1500.390.300.03002.000.830.61
Operating costs, OCte (million US$/unit.y)0.180.030.020.020.040.030.040.010.0200.060.040000.080.020.01
Table 7. Material costs, Cm for palm oil milling process.
Material Costs, Cm (US$/t)m = 1m = 2m = 15m = 16m = 16
Fresh Fruit Bunch, FFBUtility WaterPalm Pressed Fibre, PPFPalm Kernel Shell, PKSPalm Kernel Shell, PKS
1210.55234545
m = 17m = 18m = 19m = 20m = 24
Pressed Empty Fruit Bunch, PEFBDecanter CakeCrude Palm Oil, CPOPalm Kernel, PKBoiler Feed Water
8435483891.14
Intermediates associated with zero costs (Cm = 0) are not listed here.
Table 8. Economic parameters for optimised POM design.
Economic ParametersLow SeasonMedium SeasonHigh SeasonAverage
Annual operational time, AOT (h/y)5640470066606520
Total capital costs, CAPEX (million US$)11.5611.56
Annualised CAPEX (million US$/y)1.111.11
Labour costs, LC (million US$/y)0.140.14
Overtime costs, OTC (million US$/y)0.100.030.170.09
Total operating costs, OPEX (million US$/y)0.941.401.401.21
Gross Profit, GP (million US$/y)4.155.578.395.68
Economic Performance, EP (million US$/y)3.044.467.284.57
Table 9. Technology units operated for optimised POM design.
Technology Units Operated (Units)Low SeasonMedium SeasonHigh Season
Tilted steriliser233
Rotating drum separator111
Oil pressing screw122
Steam injection digester222
Double screw press122
Depricarper122
Rolek nut cracker111
Four-stage winnowing column111
Vertical clarifier233
Vacuum dryer122
Three-phase decanter122
Oil recovery pit111
Water tube boiler111
High-pressure steam turbine111
Medium-pressure steam turbine122
Total182626
Table 10. Material and energy flows for optimised POM design.
Material FlowsLow SeasonMedium SeasonHigh SeasonAverage
(t/h)(t/y)(t/h)(t/y)(t/h)(t/y)(t/h)(t/y)
Low pressure steam, LPS−11.8−66,600−18.8−88,300−18.8−125,300−15.9−88,500
Utility water−10.3−58,300−16.5−77,400−16.5−110,000−13.9−77,500
Crude palm oil, CPO7.240,50011.554,00011.576,6009.754,000
Palm kernel, PK2.614,5004.219,5004.228,0003.519,500
Palm pressed fibre, PPF00000000
Palm kernel shell, PKS1.795001.779002.818,8002.313,000
Pressed empty fruit bunch, PEFB8.537,00010.449,00010.469,0008.849,000
Palm oil mill effluent, POME24.1136,00038.6181,50038.6257,00032.5181,500
Energy Flows(kW)(MWh/y)(kW)(MWh/y)(kW)(MWh/y)(kW)(MWh/y)
Electricity demand, EDemand (kW)660374410004900100069408904938
Table 11. Feasible operating range analysis data.
Ute (units) y CPO max   ( t / y ) y CPO min   ( t / y ) CAPEX (million US$)Additional CAPEX (million US$)Equipment AddedCBRUILFILUIMFIMUIHFIH
1850,30014,1008.36---0.810.19----
2156,30015,4009.180.82Vacuum dryer
Double screw press
Depricarper
3.50.720.280.960.04--
2258,00016,1009.790.61MPS turbine2.90.700.300.930.07--
2467,00017,50011.291.50Three-phase decanter
Tilted steriliser
3.00.600.400.810.19--
2568,00017,50011.410.12Oil pressing screw3.10.600.400.800.20--
2680,50018,00011.560.15Steam injection digester44.30.500.500.670.330.950.05
2784,80018,50011.790.23Rotating drum separator9.90.480.520.640.360.900.10
2886,30019,00011.940.15Vertical clarifier5.50.470.530.630.370.890.11
2987,00019,00012.120.18Rolek nut cracker1.30.470.530.620.380.880.12
31100,60022,00015.323.21Tilted steriliser
Water tube boiler
2.50.400.600.540.460.760.24
32101,90022,70015.490.18Double screw press2.70.400.600.530.470.750.25
35104,40022,90016.290.80Depricarper
Vacuum dryer
Vertical clarifier
1.60.390.610.520.480.730.27
36112,60023,00016.310.02Oil recovery pit415.30.360.640.480.520.680.32
37116,00023,60016.920.61MPS turbine5.90.350.650.470.530.660.34
39127,20025,50018.421.50Three-phase decanter
Tilted steriliser
3.70.320.680.430.570.600.40

