Article

Numerical Analysis of Two-Phase Flow in the Cavitation Process of a Waterjet Propulsion Pump System

1
College of Hydraulic Science and Engineering, Yangzhou University, Yangzhou 225009, China
2
Ningbo Jushen Pumps Industry Co., Ltd., Ningbo 315100, China
*
Authors to whom correspondence should be addressed.
Processes 2019, 7(10), 690; https://doi.org/10.3390/pr7100690
Submission received: 2 September 2019 / Revised: 16 September 2019 / Accepted: 19 September 2019 / Published: 2 October 2019
(This article belongs to the Special Issue Smart Flow Control Processes in Micro Scale)

Abstract

:
The waterjet propulsion system has been widely used in the military and civil fields because of its advantages of in terms of high efficiency and energy savings. In order to study the three-dimensional cavitation flow in the waterjet propulsion pump, the cavitation process of the waterjet propulsion pump was simulated numerically using the Zwart–Gerber–Belamri cavitation model and the RNG (Renormalization Group) k-ε model. The simulation results of cavitation on the waterjet propulsion pump and pump system show that, in the initial stage of cavitation, vapors first collect on the leading edge of the suction surface of the blade near the rim of the impeller. As the total pressure at the impeller inlet decreases, the cavitation region expands toward the trailing edge and the vapor fraction volume gradually increases. In order to simulate the cavitation state of the waterjet propulsion pump under the actual working conditions, a numerical simulation of the entire waterjet propulsion pump system with inlet passage was carried out. After assembling the inlet passage, the flow pattern at the impeller inlet becomes uneven, leading to irregular changes in the cavitation region of the impeller. The potential danger regions of cavitation are the lip of inlet passage and the upper and lower connecting curved section of the inlet passage. The performance of waterjet propulsion pump system changes greatly when the net positive suction head available (NPSHa) value of the pump reaches the critical value.

1. Introduction

Waterjet propulsion is largely used in the military and civil fields because of its simple transmission mechanism, low noise, and good maneuverability [1,2,3]. While compared to propeller propulsion waterjet propulsion can utilize the inflow stamping to increase the anti-cavitation capability at high speeds, cavitation problems may arise under some special conditions such as “low ship speed and high rotating speed” [4,5]. This special working condition usually occurs in the process of ship acceleration or turning. At this time, the net positive suction head of the waterjet propulsion system is obviously lower than the NPSHr (Net Positive Suction Head Required) of the pump at this speed, and the propulsion pump is prone to cavitation. Cavitation will cause an increase in shaft power, a reduction in flow rate, head, and efficiency, and a decrease in thrust. At the same time, it will also cause noise and vibration in the pump [6,7,8,9,10].
With the development of technology and the problems encountered in practical applications, there is an increasing demand for pump performance indicators in engineering, and cavitation has gradually become an important factor limiting the further improvement of pump performance [11,12]. Cavitation refers to the process of forming vapor bubbles in the low pressure region of the liquid flow field [13]. Previous studies have shown that the cavitation process occurring in hydraulic machinery is harmful, and its damage is mainly manifested in three aspects. First, cavitation can cause damage to the surface of hydraulic machinery materials [14,15]. Secondly, cavitation will lead to a significant reduction in hydraulic performance of hydraulic machinery [16,17]. Thirdly, cavitation not only affects the steady state fluid flow, but also affects the unsteady flow characteristics or dynamic response of the flow [18,19]. For a long time, scholars at home and abroad have started detailed and in-depth research on the mechanism of hydraulic machinery cavitation, and accumulated a large amount of knowledge and experience through the use of numerical simulations and experiments [20,21,22,23]. As early as 1917, Rayleigh [24] conducted a theoretical analysis of the cavitation. Rayleigh solved the flow problem of a spherical cavity infinite flow field with a vacuum or internal pressure constant and gave the Rayleigh bubble athletics equation. This laid the foundation for the modern numerical simulation of cavitation dynamics. Bal et al. [25] described a method for simulating the uniform motion of a two-dimensional or three-dimensional cavitating hydrofoil under a free surface. This method is suitable for 2D and 3D hydrofoils under fully wetted or cavitating flow conditions. Brennen et al. [26] simulated the unsteady cavitation flow in the two-dimensional potential flow and successfully predicted the occurrence of two-dimensional cavitation. Singhal et al. [27] and Schmidt et al. [28] performed full-flow numerical calculation and analysis of the cavitation of the axial flow pump under design conditions, and predicted the development of cavitation flow and cavitation occurrence region in the flow passage. Although numerical simulation technology can predict the occurrence and development of cavitation, the experiment is still one of the most efficient way to study cavitation. Gopalan [29] used the PIV (Particle Image Velocimetry) and high-speed photography to study the flow structure in the closure region of sheet cavitation. The results showed that the collapse of cavitation in the enclosed region is the main cause of the whirlpool disaster. Escaler et al. [30] evaluated the cavitation detection in actual hydraulic turbines based on analysis of structural vibrations, acoustic emissions, and hydrodynamic pressures measured in the machine. They validated the proposed technique by experimenting with real prototypes of different types of cavitation. Through the performance test of centrifugal pumps, Johnson et al. [31] described the hydraulic characteristics of centrifugal pumps in cavitation state more accurately and systematically.
As effective research methods for vibration, noise, and cavitation, numerical simulation and model tests have been adopted by many experts and scholars [32,33,34,35]. Experts and scholars have made great progress in the study of cavitation, but the cavitation problem under special conditions in the waterjet propulsion system is still an important factor that restricts the full play of its hydraulic performance. Moreover, the present research on cavitation of waterjet propulsion system mainly focuses on the cavitation characteristics of waterjet propulsion pump. There are few studies on cavitation of waterjet propulsion system with inlet passage. In particular, the influence of inlet passage on the cavitation performance of propulsion pump system and pump is worth further study. Hence, it is of great practical value and academic significance to study the cavitation process of the waterjet propulsion system with and without the inlet passage. In this paper, the cavitation characteristics of the whole flow field of the waterjet propulsion pump system were analyzed by means of a two-phase flow numerical simulation.

2. Methodology

2.1. Turbulence Model and Cavitation Model

During the development of cavitation flow, the fluid was treated as a vapor liquid mixture. The gas-liquid two-phase mixture model (Mixture model) was used for two-phase flow calculations in this paper. The mixture model assumes that the fluid is homogeneous, and the two-phase fluid components are assumed to share the same velocity and pressure. The continuity equation of vapor/liquid, momentum equation, and vapor volume fraction mass transport equation for the two-phase flow are generally expressed as follows:
ρ m t + ( ρ m u j ) x j = 0
ρ m u i t + ( ρ m u i u j ) x j = ρ f i p x i + x j [ ( μ m + μ t ) { u i x j + u j x i 2 3 u i x j δ i j } ]
( α v ρ V ) t + ( α v ρ V u j ) x j = R E R C
where p is the mixture pressure, Pa; ρ V is vapor volume density, kg/m3; u i is the velocity in i direction, m/s; u j is the velocity in j direction, m/s; f i is the body force in the i direction; μ is the laminar viscosity; t is the time, s; μ t is the turbulent viscosity; α v is the volume fraction of vapor; and R E and R C respectively represent the source terms for evaporation and condensation, kg/(m·s). The mixture density ρ m is defined as follows:
ρ m   =   ρ V α v   +   ρ l ( 1 α v )
where ρ l is the liquid volume density.
The RNG k-ε (Renormalization Group k-ε) model can simulate the region of cavitation clearly and has better adaptability to the simulation of cavitation flow [36,37,38]. Therefore, under the assumption of mixture homogeneous flow model, the RNG k-ε model was selected to calculate the cavitation characteristics of the waterjet propulsion system.
The cavitation model is a mathematical model that describes the mutual transformation between the liquid volume and the vapor volume. The transport equation model is the most commonly used cavitation model, which mainly includes three types: the Zwart–Gerber–Belamri model [39], the Kunz model [40], and the Schnerr–Sauer model [41]. In this paper, the Zwart model in ANSYS-CFX software was selected to simulate and analyze the cavitation process.
R e = F v a p 3 α r u c ( 1 α v ) ρ V R B 2 3 ( P V P ) ρ l   P < P v
R c = F c o n d 3 α v ρ V R B 2 3 ( P P V ) ρ l   P > P v
where P V is the vapor pressure; P is the flow field pressure; F v a p and F c o n d are empirical coefficients for the vaporization and condensation processes, respectively; α r u c is the non-condensable gas fraction in the liquid; and R B is the typical bubble size in the water. According to numerous literature discussions [42,43,44], α r u c takes the value of 5 × 10⁻⁴; R B takes the value of 1 × 10⁻⁶ m; and F v a p and F c o n d take the values 50 and 0.01, respectively.

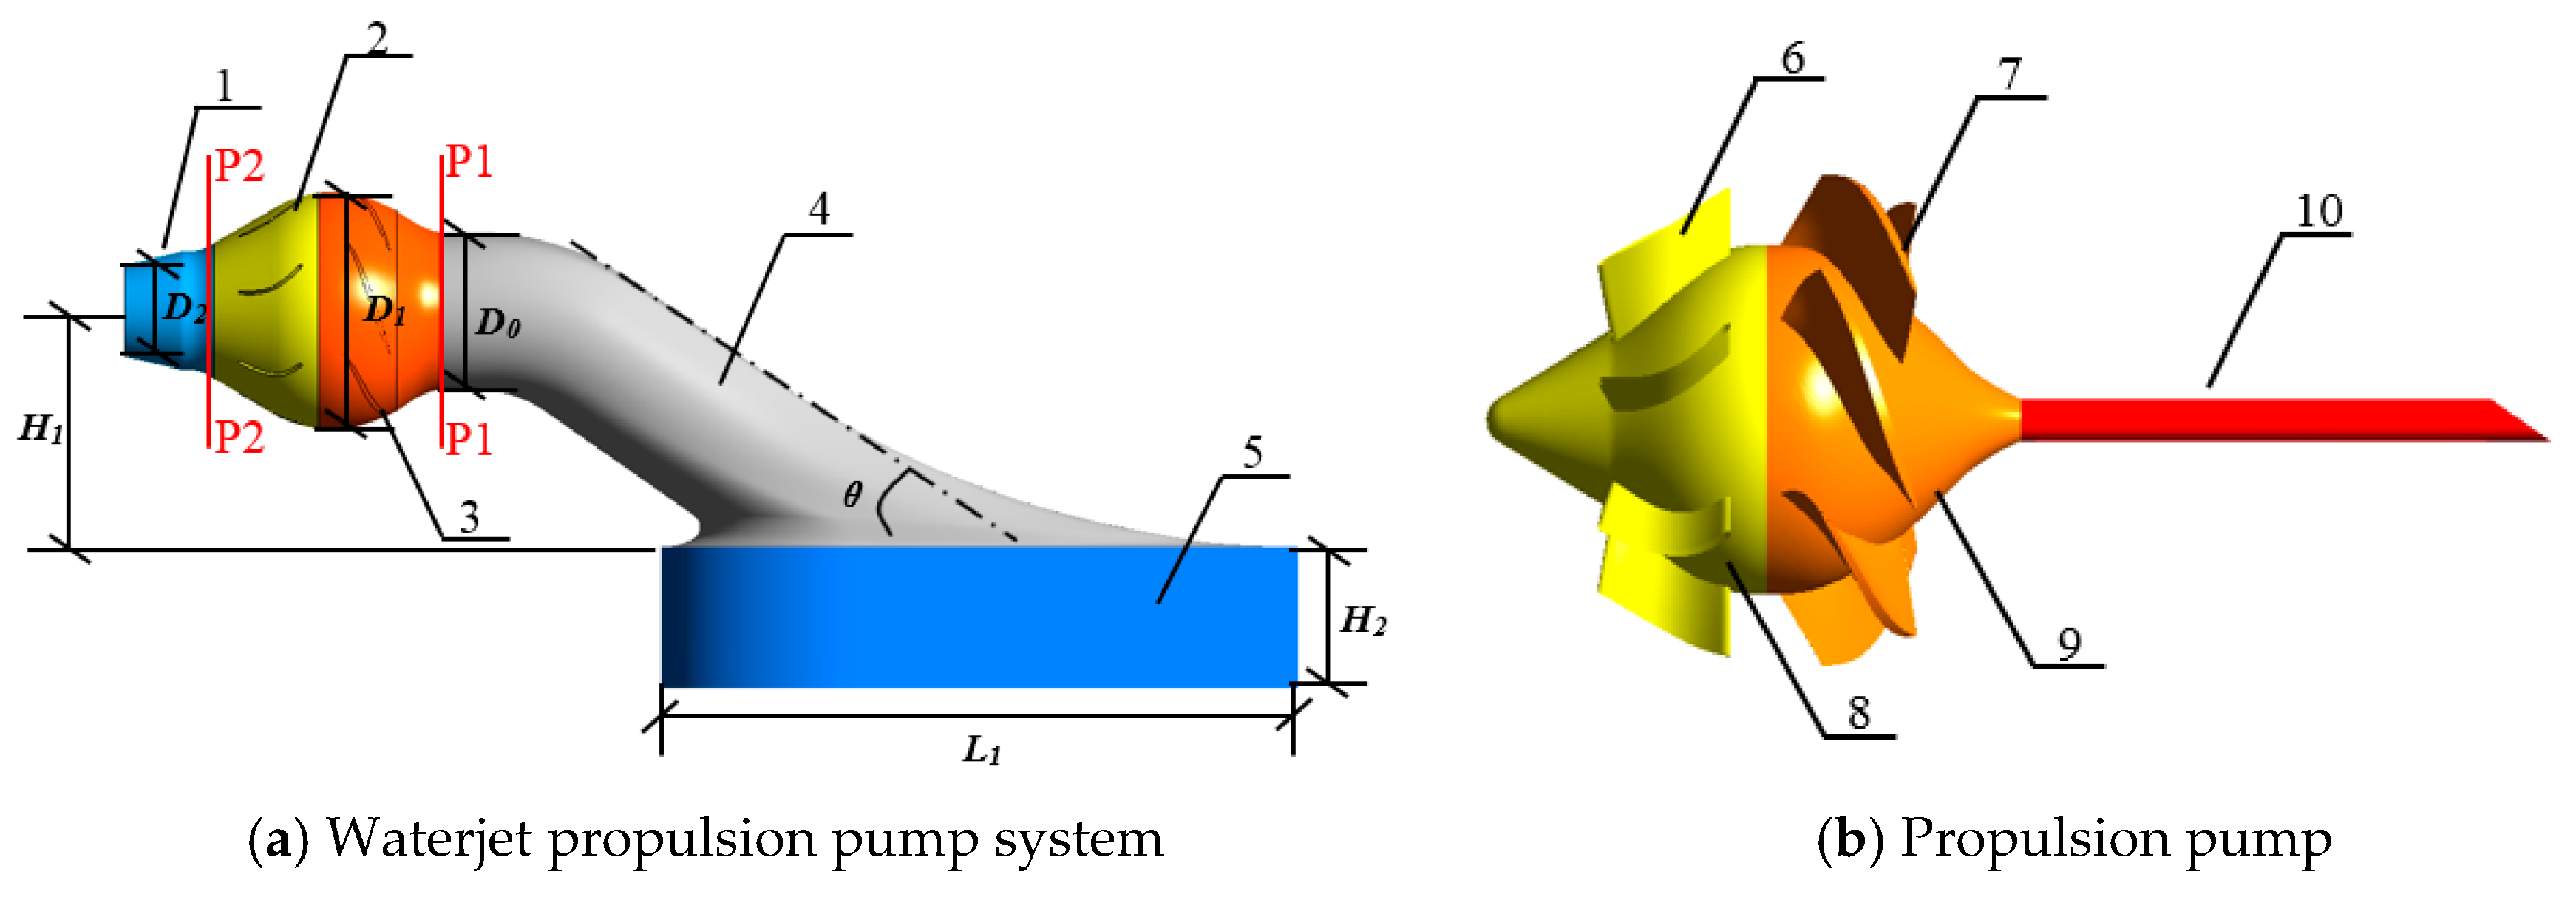
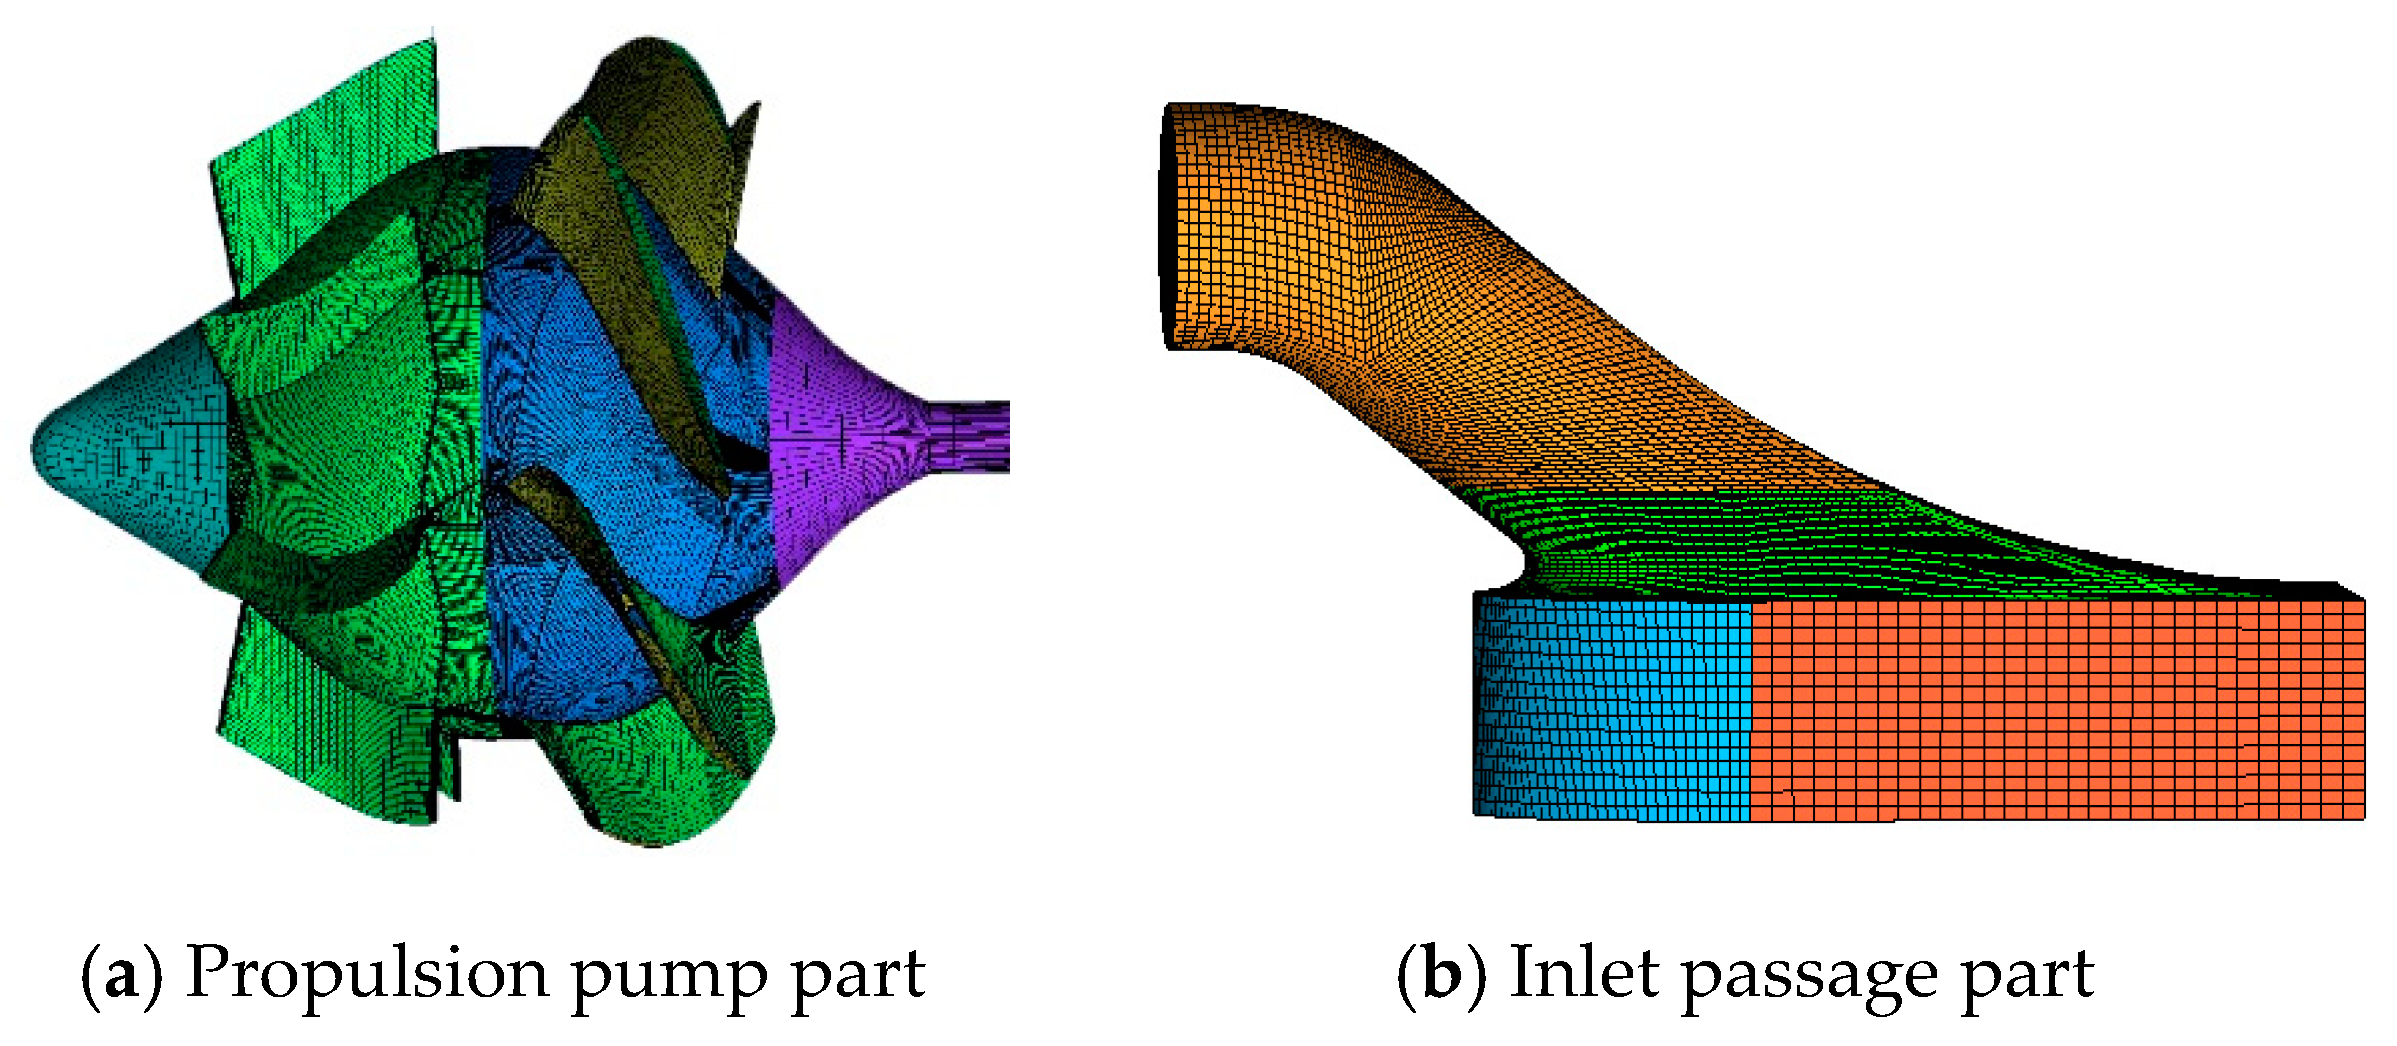
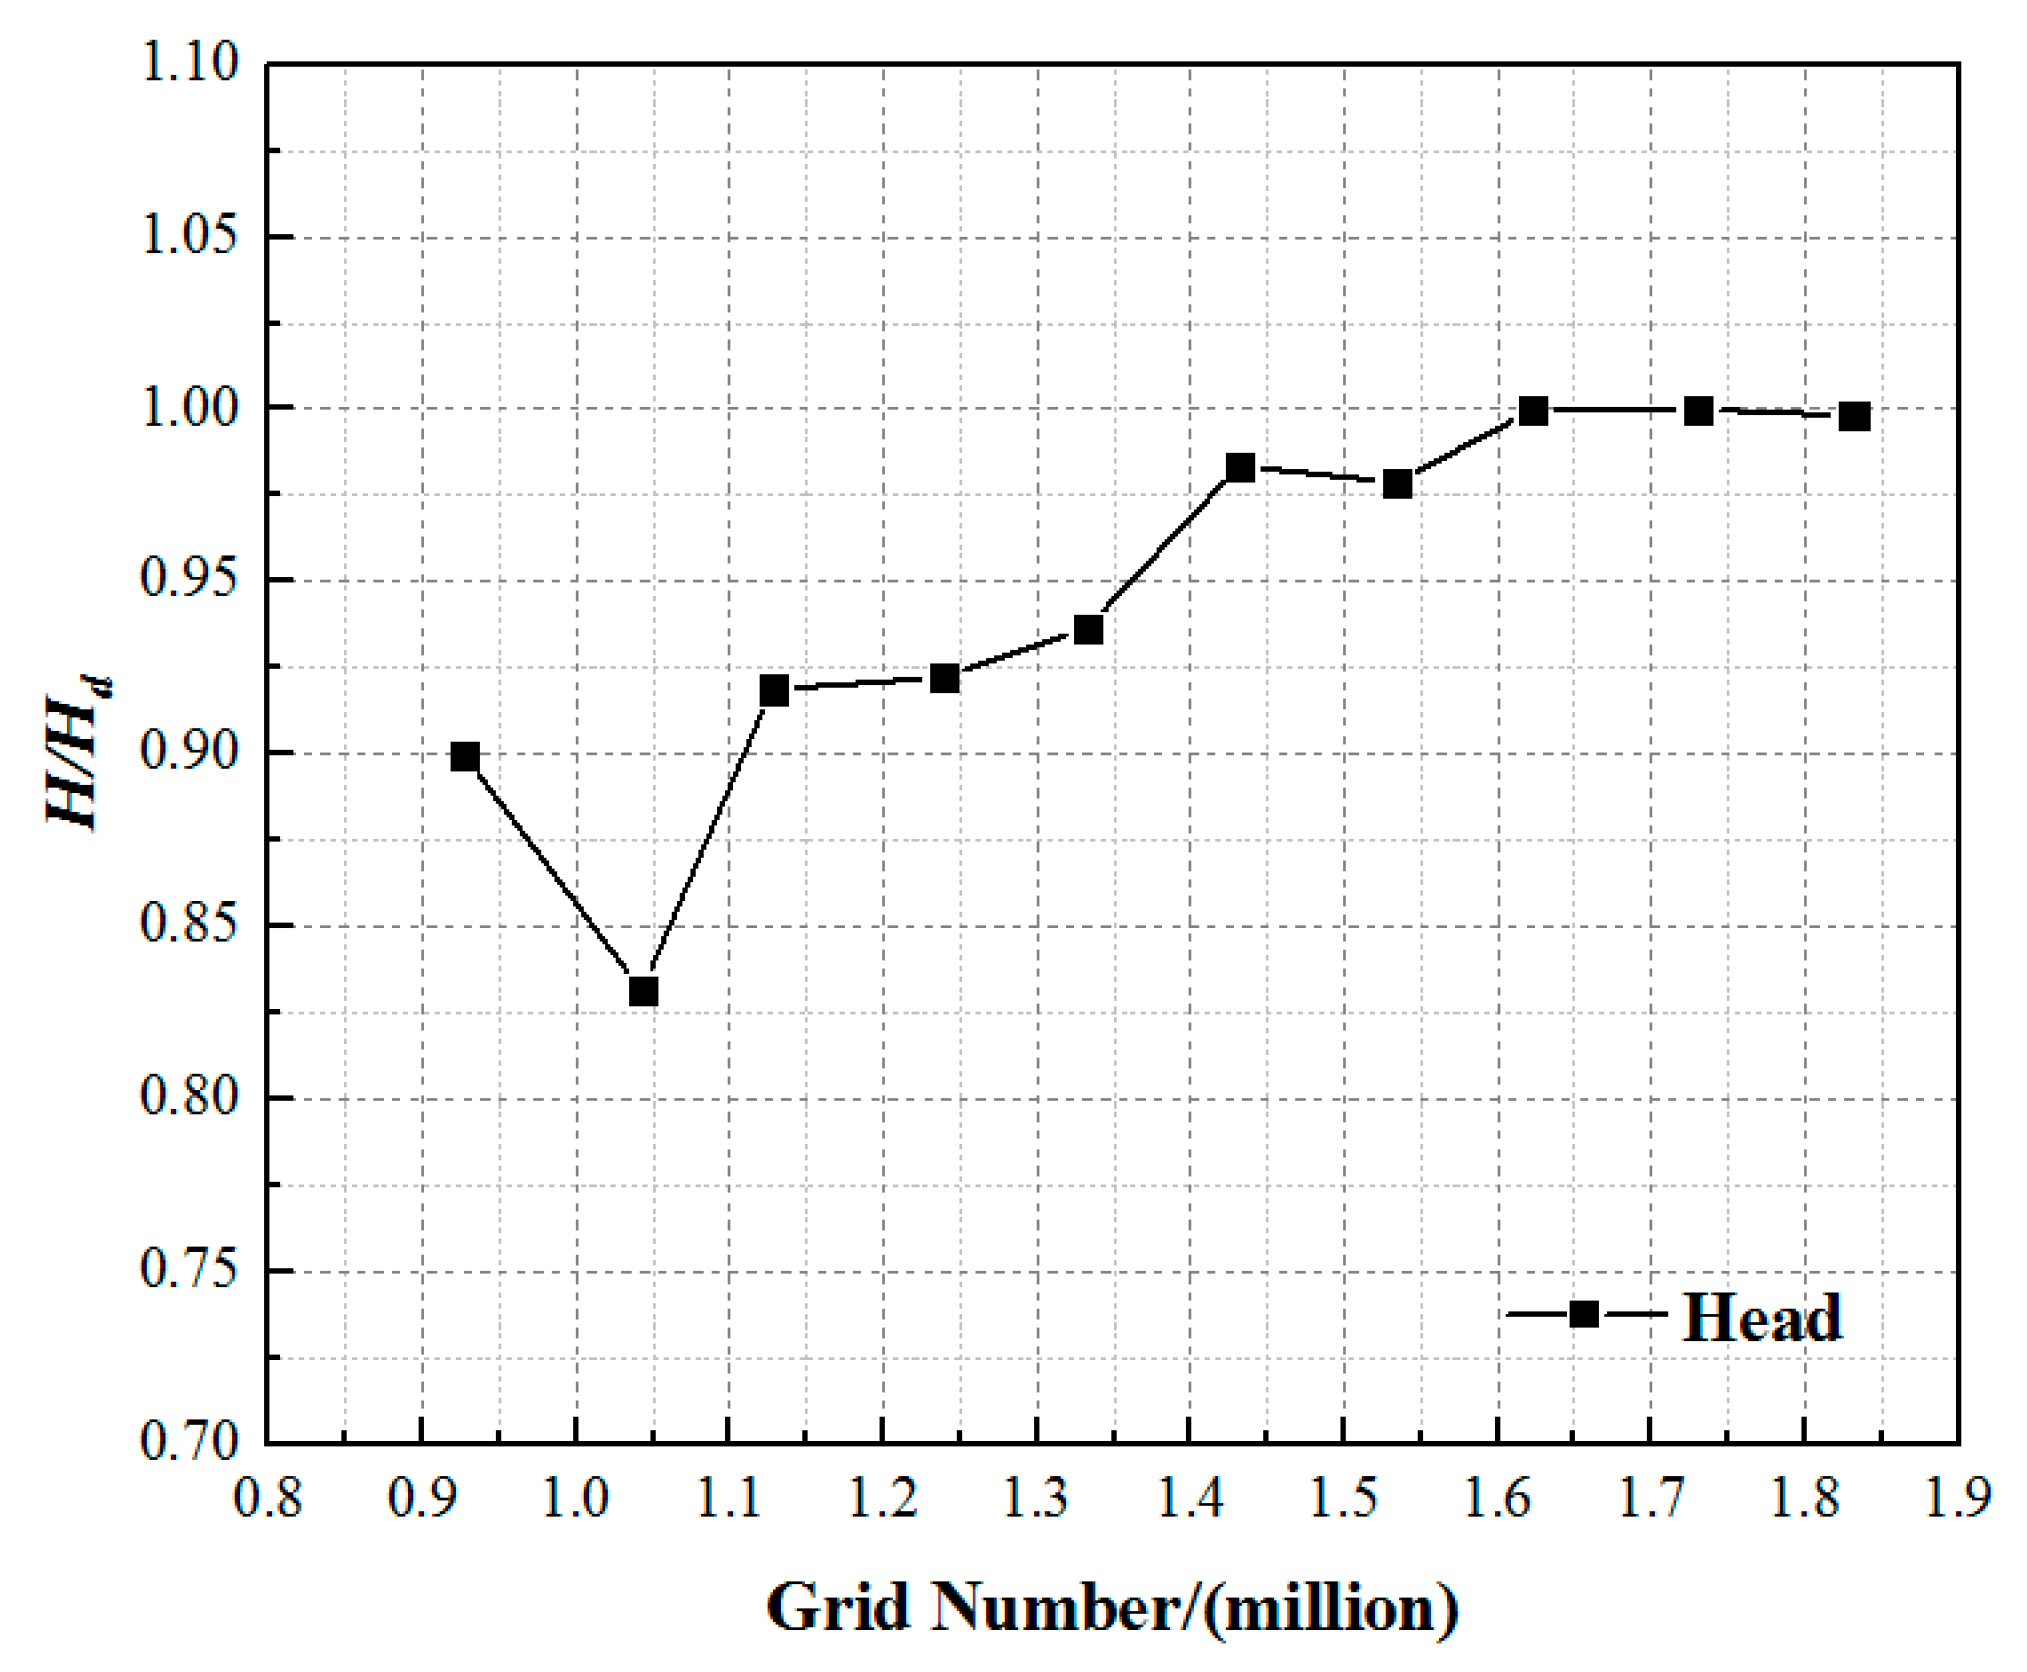
2.2. Geometric Model and Mesh Generation

As can be seen from Figure 1 that the propulsion pump is the core component of waterjet propulsion pump system, which consists of an impeller with six blades and a guide vane with seven vanes. Therefore, in order to ensure that the pump system has better anti-cavitation ability, it is necessary to require the pump itself to have a good anti-cavitation performance. As shown in Figure 1, the waterjet propulsion pump system is the main research object. The calculation domain of the waterjet propulsion pump system includes import extension, inlet passage, impeller, guide vane and nozzle. The inlet flow of the inlet passage is a non-uniform flow, so the inlet section needs to be extended by a distance to guarantee the accuracy and convergence of the calculation, as shown in the import extension in Figure 1a. The basic geometrical parameters of the waterjet propulsion pump system are shown in Table 1. The rotational speed of the waterjet propulsion pump is 700 r/min. D0 represents the inlet diameter of the impeller. Section P1 and Section P2 are respectively the inlet and outlet sections for calculating the head of the pump section.
The entire computational domain was divided into three parts to generate mesh, namely, the nozzle part, the propulsion pump part and the inlet passage part. Structured mesh with hexahedral cells can improve the computational efficiency of CFD (Computational Fluid Dynamics), so the meshes of the computational domain in this paper are divided into structured mesh by ICEM CFD software (ANSYS Inc., Pittsburgh, PA, USA). ICEM CFD is the integrated computer engineering and manufacturing code for computational fluid dynamics, which is a professional preprocessing software. Since both the impeller and guide vane are periodic meshes, the generated single channel meshes are rotated and duplicated to generate the computational domain of impeller and guide vane. Since different turbulence models have different requirements for grid Y plus values, the RNG k-ε model requires y+ values between 30 and 100. The grid size of the boundary layer was controlled to ensure that Y plus meets the requirements of turbulence model in this paper. The grid of the computational domain is shown in Figure 2.
The number of grids has a great influence on the calculation accuracy and the solution speed. In theory, the denser the calculation domain grid is, the higher the calculation accuracy is. However, in the actual calculation process, too many grids will greatly increase the calculation period and waste computing resources. In order to find the appropriate mesh size, a mesh sensitivity analysis was carried out. For this calculation model, the impeller is the core of the whole calculation domain. The mesh sensitivity of the propulsion pump section was verified by changing the size of the impeller mesh. As shown in Figure 3, when the grid number of the impeller reaches 1.6 × 10⁶, the head of the pump section changes less. Equation (6) was used to calculate the head of the pump section. The calculated cross sections are sections P1 and P2 in Figure 1. Finally, the number of meshes of the impeller is 1.72 million, and the total number of calculation domain grids of the waterjet propulsion pump system is 5.23 million.
H = P 2 2 P 1 1 ρ g
where P1-1 and P2-2 are the pressure of the sections P1 and P2, respectively, Pa; ρ is water density, kg/m3; and g is gravitational acceleration, m/s2.

2.3. Setting of the Boundary Condition

The unsteady cavitating turbulent flow was simulated using the high-performance computational fluid dynamics software (ANSYS CFX 14.5, ANSYS Inc., Pittsburgh, PA, USA) based on the Reynolds-averaged Navier–Stokes (RANS) equation with the RNG k- ε turbulence model. The total pressure condition was applied as outlet boundary condition, and mass flow rate was adopted as the outlet boundary condition. The process of cavitation was controlled by changing the total pressure of the inlet. Assuming that there are no bubbles in the inlet fluid, the volume fractions of the liquid phase and the vapor phase at the inlet were set to 1 and 0, respectively. No slip condition was applied at solid boundaries. The effect of temperature was not considered in the calculation [45]. The mixture model was chosen as the multiphase flow model, the Zwart model was chosen as the cavitation model, and the Rayleigh–Plesset equation was used to control bubble motion. Before the calculation of the cavitation model was embedded, the pump segment under the condition of no cavitation was calculated, and the calculation result was used as the initial value of the cavitation simulation to improve the convergence speed and calculation accuracy. When applying the cavitation model, two physical parameters were given: the vaporization pressure of the liquid at normal temperature (25 °C) PV = 3574 Pa, and the surface tension of the cavitation bubble, 0.074 N/m.

3. Experiment

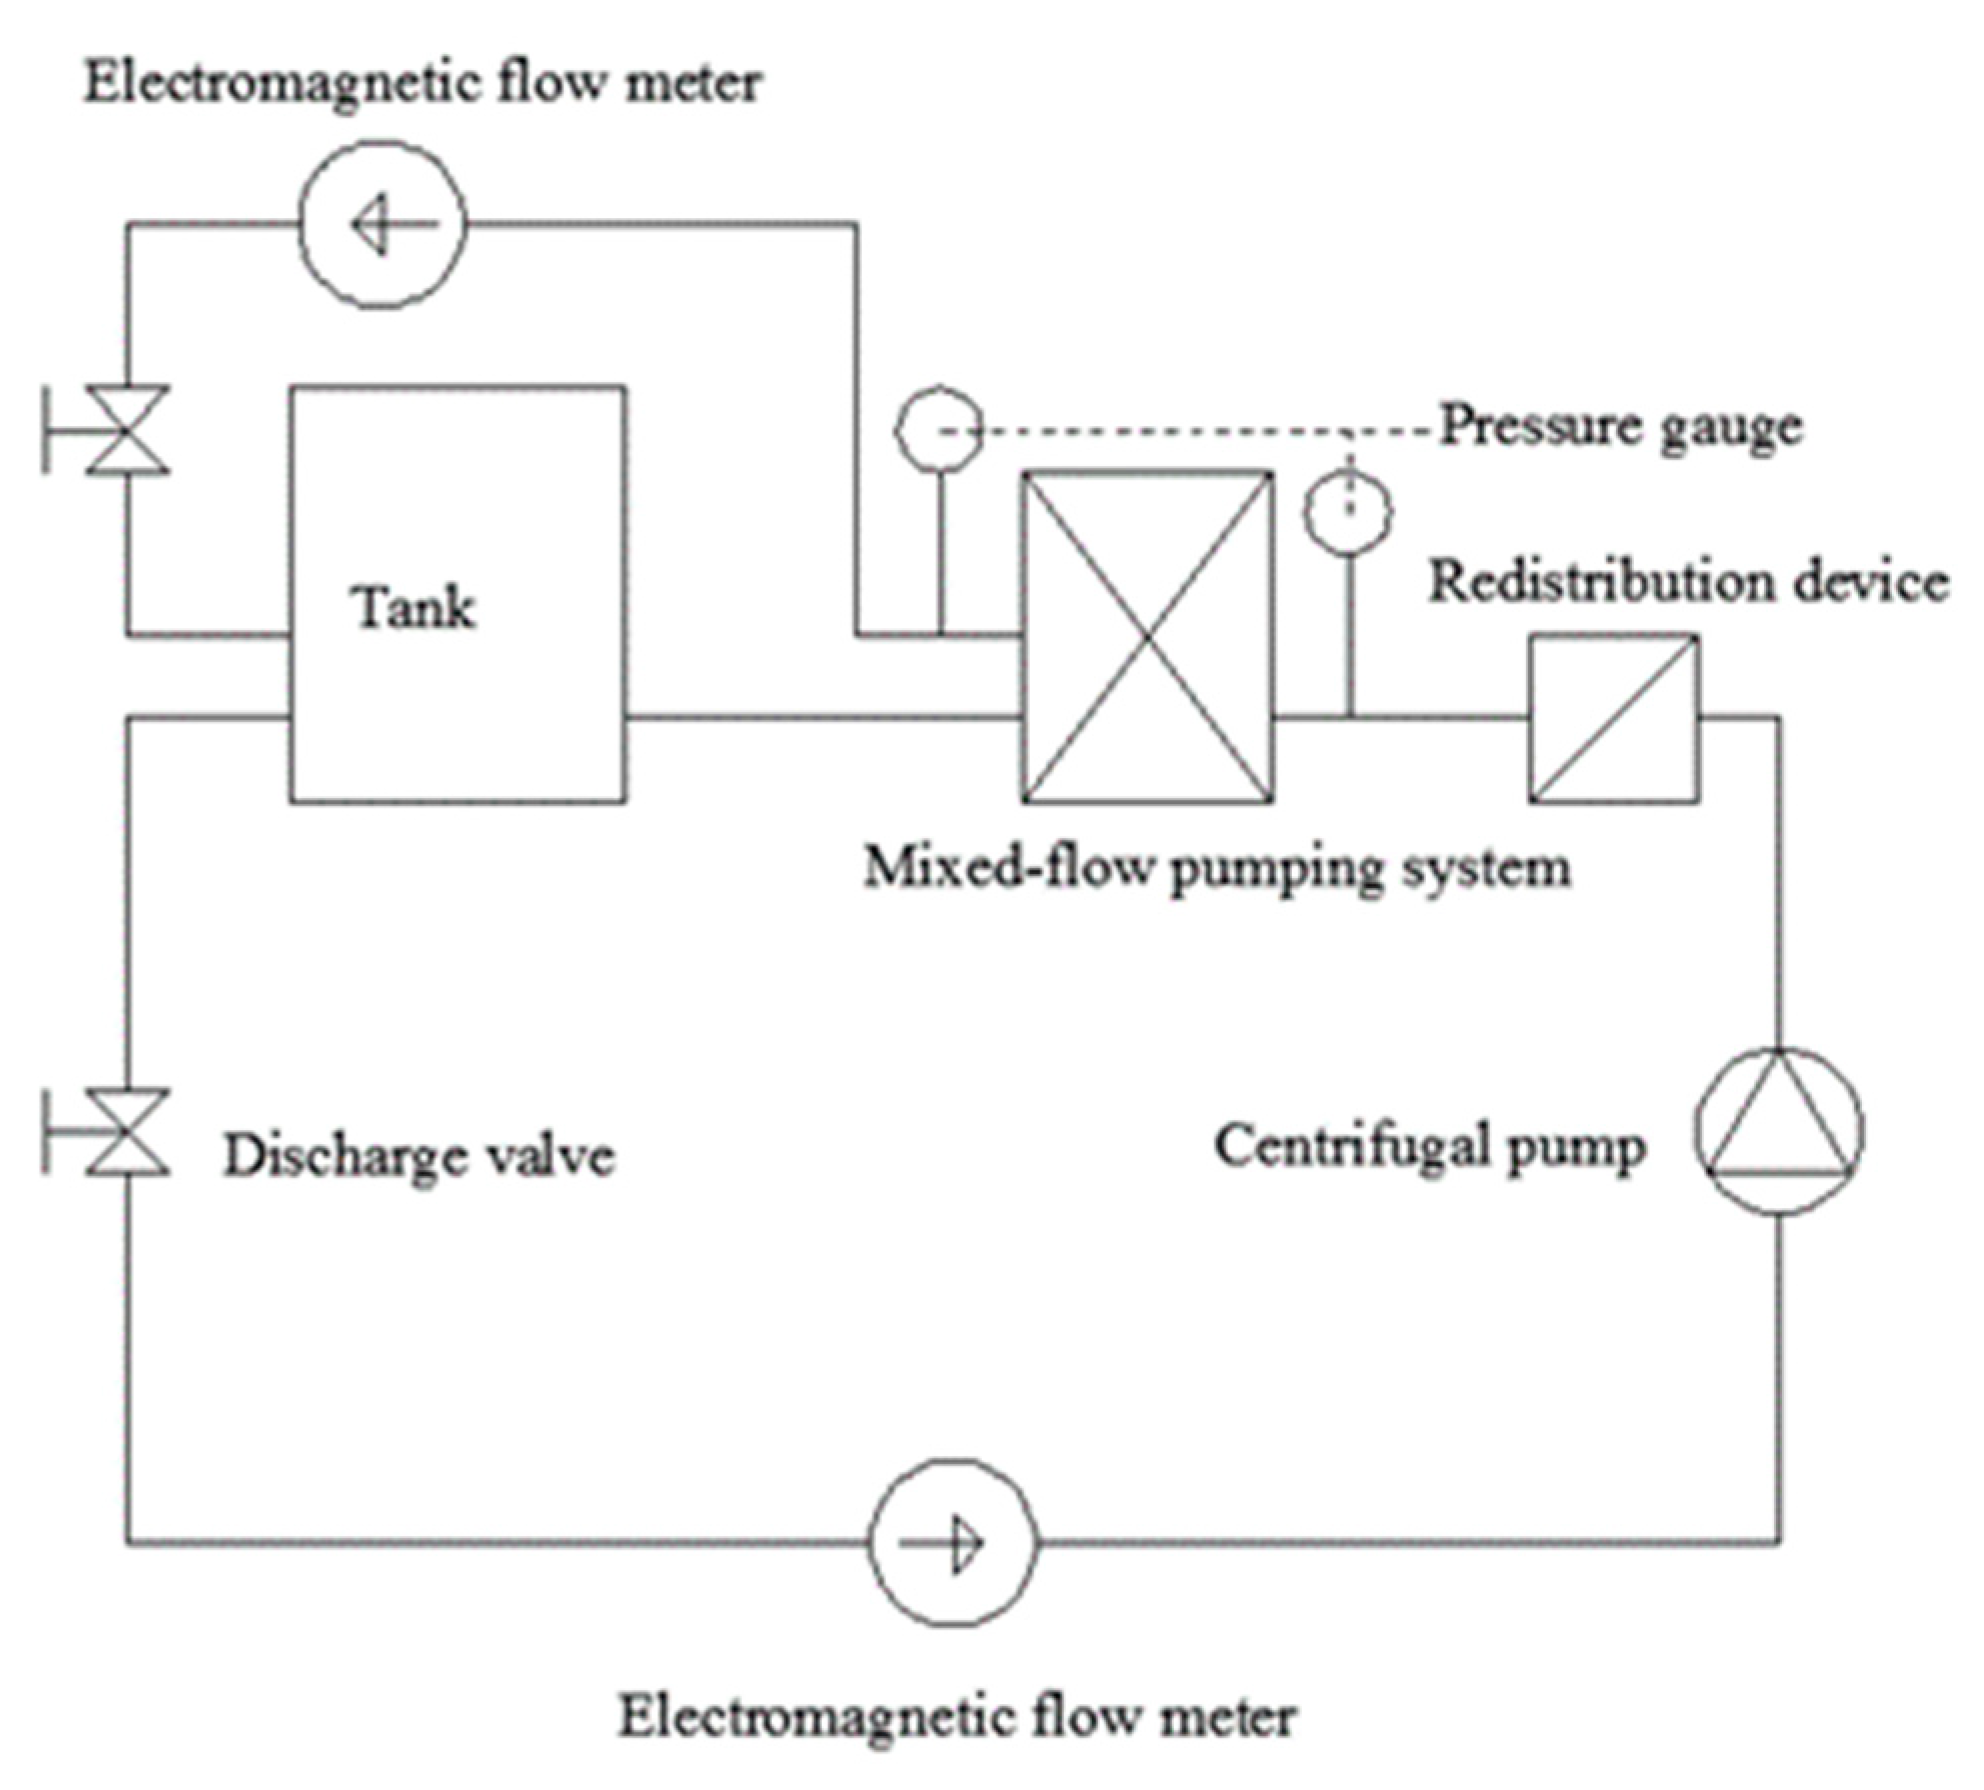
3.1. Establishment of the Test Bed

The test bed of waterjet propulsion system is shown in Figure 4. The test bed consists of two closed loops. The main function of the first loop is to ensure the water circulation of the test bed and provide the bottom speed. The main function of the second loop is to test the performance of the waterjet propulsion pump. The size and shape of impeller and guide vane in the test device are consistent with the numerical model. The head, flow rate, torque, and speed were tested to obtain the hydraulic performance of the waterjet propulsion pump. The pump is driven by a DC electromotor (Changchuan, Nanjing, Jiangsu, China) at speeds varying from 700 rev/min to 2400 rev/min and equipped with an auxiliary axial pump to regulate the flow rate. The test rig has two electromagnetic flowmeters (Shanghai Guanghua Instrument Co., Ltd., Shanghai, China) with an absolute accuracy of ±0.5%. These flowmeters are used to test the flow rate of the main circulation pipeline system and second circulation pipeline system. The head of the waterjet propulsion pump is measured by the differential pressure transmitter (Yokogawa Sichuan Instrument Co., Ltd., Chongqing, China) with an absolute accuracy of ±0.2%.

3.2. Test Verification

The external characteristics of the pump system was calculated for the numerical model without cavitation. Figure 5 shows the comparison of test results and numerical simulation results. As shown in Figure 5, under the design flow condition, the difference between the numerical prediction result of the head and the experimental result is the smallest. At the design flow rate, the head difference between the test data and the numerical data is 1.2%. The comparison between numerical simulation results and experimental results shows the numerical results are relatively reliable.

4. Results and Discussion

The most important factors affecting cavitation are pressure and velocity, so the cavitation number σ is used as a parameter to characterize the possibility of cavitation, σ , defined as:
σ = P s P V 1 2 ρ U 2
where P s is the reference static pressure, which is expressed as the pump inlet pressure in this study; P V is the vapor pressure; and U is the reference velocity, which is expressed as the inlet tip speed.
The net positive suction head (NPSH) is the difference between the total head of the liquid at the pump inlet and the pressure head when the liquid is vaporized. The net positive suction head-available (NPSHa) refers to the excess energy of the liquid at the pump inlet that exceeds the vaporization pressure at that temperature.
N P S H a = P s ρ g + v s 2 2 g P c a v ρ g = P a ρ g H x h s P c a v ρ g
where P s ρ g is the pressure head of pump inlet section; v s 2 2 g is the velocity head of pump inlet section; P c a v ρ g is the vaporization pressure value; P a ρ g is the atmospheric pressure; H x is the actual water suction head of the pump; and h s is the hydraulic loss from the intake surface to the pump inlet.
Since the calculation model is based on the center of the impeller, the installation height is 0. The NPSHa of the propulsion pump is calculated by the following formula:
N P S H a = ( P l o c a l P V ) / ρ g
where Plocal is total pressure of inlet section.

4.1. Cavitation Characteristics of Impeller in Waterjet Propulsion Pump

The propulsion pump is the core component of the waterjet propulsion pump system. Therefore, to ensure that the pump system has better anti-cavitation capability, it is necessary to require the pump itself to have excellent anti-cavitation performance. The analysis and research on the cavitation characteristics of the propulsion pump can provide reference for the study of the cavitation performance of the whole waterjet pump system. This paper predicts the cavitation characteristics of the impeller by analyzing the cavitation form, cavitation occurrence region and development trend of the impeller, and the influence of cavitation on head and efficiency of the propulsion pump. As shown in Figure 6, the propulsion pump inlet is extended for a distance to guarantee the accuracy and convergence of the calculation, and the outlet section is connected to the nozzle. The inlet of the extension section is chosen as the inlet of the overall calculation domain, and the nozzle outlet is the outlet of the overall calculation domain. The setting of the boundary conditions is not changed.
Based on the calculation results of the performance curve, the design flow rate Qbep corresponding to the highest efficiency point was chosen for the simulation calculation of the cavitation flow. During the process of gradually reducing the total pressure of the inlet section from 0.5 atm to 0.1 atm, the pressure distribution of the working surface and suction surface of impeller blade and the change of the area of the cavitation region were simulated. The pressure distribution on the suction surface of the impeller under different NPSHa is shown in Figure 7. The blue region represents the lowest air content region, and the red region represents the highest air content region. The air content represents the number of vacuoles per unit volume on the blade surface. In the figure, the blue region represents the low pressure region and the red region represents the high pressure region. It can be seen from the figure that when the value of NPSHa is greater than 1.87 m, the low pressure region is mainly concentrated at the leading edge of the blade. When the NPSHa value decreases, the area of the low pressure region along the edge of the airfoil gradually increases, indicating that the area and possibilities of the cavitation occurrence become larger.
Pressure distribution on pressure surface of blade with different NPSHa values as shown in Figure 8. When the NPSHa value is less than 0.96 m, the region on the pressure surface of the blade which is lower than the vaporization pressure begins to appear and the region becomes larger gradually. As the NPSHa value decreases, the low pressure region on the pressure surface of the blade gradually develops from the hub near the blade leading edge to the rim.
Figure 9 shows the vapor volume fraction distribution of suction surface of propulsion pump blade in different cavitation stages. The overall distribution trend of vapor volume fraction is consistent with the pressure distribution curve, and cavitation occurs in the low pressure region. The red region indicates the existence of the largest vapor volume fraction in this region, while the blue region indicates the existence of the smallest vapor volume fraction in this region. It can be seen from the figure that the cavitation of the impeller in the propulsion pump first appears around the leading edge of the blade suction surface. The flow pattern at the inlet of the impeller has a great effect on the cavitation performance. When the NPSHa value is equal to 1.87 m, the cavitation mainly collects on the leading edge of the blade suction surface near the rim of the impeller. The vapor volume fraction near the rim is the largest. With the decrease of the total pressure, the vapor region gradually spreads along the blade trailing edge and hub direction. When the NPSHa value is equal to 1.38 m, cavitation begins to appear in the middle of the surface of the blade, and the cavitation area accounts for about half of the area of the suction surface of the blade. In the process of reducing the NPSHa value from 2.41 to 0.76, the maximum vapor volume fraction appeared at the leading edge of the blade near the rim, and as the NPSHa value decreased, the maximum vapor volume fraction area gradually expanded toward the blade trailing edge along the water flow direction. As the total pressure of the inlet further decreases, the vapor region gradually spreads to the entire blade. At the same time, the maximum vapor volume fraction area is gradually moving towards the outlet side of the blade. From Figure 9h, it can be seen that when the NPSHa value is reduced to 0.76 m, the suction surface of impeller blade is basically covered by bubbles, and cavitation has been fully developed. As shown in Figure 10, when suction surface cavitation develops completely, bubbles begin to propagate towards the trailing edge of the blade pressure surface. When the cavitation develops completely, the cavitation occupies almost the entire blade surface. At this time, the cavitation will block the flow passage and destroy the continuity of liquid flow in the impeller, resulting in the decrease of pump efficiency and head. In summary, according to the classification of cavitation types in the pump, it can be seen that the main type of blade cavitation shown in the figure is airfoil cavitation.
Figure 11 presents the static pressure distribution along the chord on the suction and pressure surfaces of the blades under three spans at different NPSHa values. As can be seen from the figure, the static pressure on the hub side is lower than that on the rim side, and the pressure distribution at the span of 0.9 times shows that the rim produces a lower pressure zone lower than the vaporization pressure (Pv = 3574 Pa) earlier than the hub. As the value of NPSHa decreases, the continuous development of cavitation causes the velocity and pressure distribution in the impeller passage to change, resulting in a decrease in the pressure of the blade working face and an increase in the area of the low pressure region.
Figure 12 shows the pressure variation from hub to rim with different NPSHa values. The calculation results show that the pressure close to the hub edge is less than the rim edge. The pressure at the same point of the blade surface increases as the value of NPSHa increases.
As shown in Figure 13, the figure presents the distribution of the vapor volume fraction in the impeller passage (facing the incoming flow direction). The figure shows that the vapor in the impeller flow passage first appears at the rim. Moreover, the vapor mainly occurs on the leading edge of the blade, and the vapor gradually extends toward the trailing edge as the value of NPSHa decreases. As shown in Figure 13c–e, the vapor at the hub first appears near the trailing edge of the airfoil root, and its gas content is significantly higher than the rim. When the value of NPSHa is 0.76m, the maximum vapor volume fraction of the rim is about 51.69%, and the maximum value of the gas content of the hub is 97.11%. The reason may be due to the large distortion of the blade root airfoil and the flow separation of the water flow, resulting in a local low pressure region.
The pump efficiency η, shaft power N, and head H were used to define the hydraulic characteristics of the waterjet propulsion system. The calculation formula is as follows:
η = 30 ρ g Q H π n M × 100 %
where T is the torque of blades, N∙m, n is the rotating speed of the impeller, r/min, Q is the flow rate, m3/s, and N is the shaft power, kW.
The cavitation performance curve of the pump under the designed flow rate is shown in Figure 14. As shown in Figure 10, the main type of blade cavitation is airfoil cavitation. When the NPSHa value decreases from 2.41 m to 1.47 m, cavitation can be found on the blade surface of the impeller. However, compared with Figure 14, it is found that the head and efficiency curves do not decrease sharply but increase slightly in this process, which is caused by the complexity and instability of cavitation flow. When the pump operates between the initial cavitation condition and the critical cavitation condition, the lift coefficient of the supercavitation will increase slightly as NPSHa gradually decreases toward the critical value, and the development of blade cavitation will lead to a certain degree of increase of the pump head before the breakdown cavitation condition. However, the increase of lift and the development of cavitation will also cause cavitation oscillation and damage the flow passage parts of the pump. Hence, pumps are generally not allowed to operate between these two conditions. As shown in Figure 14, the NPSHa corresponding to the critical cavitation point K is 1.29 m, and the head decreases by 3.28%. In fact, when the value of NPSHa is 1.27 m, it can be seen from the vapor fraction distribution of Figure 9 that cavitation has developed to a certain extent. When the value of NPSHa is less than 1.29 m, the head and efficiency of the pump drops sharply as the total pressure at the inlet decreases further. When the NPSHa value is reduced from 1.29 m to 1.21 m, the pump head is reduced by 23.23%. When the NPSHa value is less than 1.29 m, with the further decrease of NPSHa value, the cavitation rapidly covers the suction surface of the blade and gradually extends to the pressure surface, thus blocking the impeller passage and making the pump unable to work normally.

4.2. Cavitation Characteristics of Impeller in Waterjet Propulsion Pump System

In order to understand the cavitation characteristics of the water jet propulsion pump system more comprehensively, the waterjet propulsion pump equipped with inlet passage was calculated and analyzed. Figure 15 is the comparison between the cavitation characteristic curves of waterjet propulsion system and that of the waterjet propulsion pump at the designed flow rate. The figure shows that the head and efficiency of the pump have decreased after assembling the inlet passage. The flow rate of the pump has not changed under the same inlet condition, so the NPSHr of the pump remains unchanged. After assembling the inlet passage, the hydraulic loss and installation height increase, which reduces the NPSHa of the pump system and makes the cavitation performance of the pump worse.
Figure 16 shows the distribution of the vapor volume fraction on the suction surface of the blade in the waterjet propulsion pumping system. Compared with Figure 10, the cavitation form in the impeller is still airfoil cavitation after assembling the inlet passage. When the inlet passage was assembled, the distribution of cavitation region on the blade surface becomes uneven due to the influence of the flow pattern of the inlet passage. As shown in Figure 16, under the same NPSHa conditions the area of cavitation region on different blade surfaces is different, and the degree of cavitation development is also different. Comparing Figure 16a,b, it can be seen that when the NPSHa value is 1.71 m, the cavitation of the No. 3 blade develops the fastest, and the cavitation was first discovered at the rim of the No. 3 blade near the leading edge. This phenomenon is mainly due to the impeller rotation and the uneven distribution of the flow pattern at the outlet of the inlet passage. With the decrease of NPSHa value, cavitation began to appear in the rim position near the leading edge of the blade, except for blade No. 3. It can be seen that the cavitation characteristics of impeller blades are changed after assembling the inlet passage due to the influence of the passage. With the decrease of NPSHa, the cavitation on the suction surface of the blades gradually extends from the leading edge to the trailing edge. When the NPSHa value decreases from 2.03 m to 1.30 m, it can be seen from Figure 16 that cavitation gradually occurs in the impeller blade during this process. When the NPSHa value is 1.3 m, 50% of the suction surface of the No. 2 and No. 3 blades are covered by vapors. At the same time, it can be seen from Figure 15 that the head and efficiency of the pump system are declining in this process. However, the head and efficiency of the pump device in Figure 13 have a certain upward trend when the NPSHa value decreases from 1.30 m to 1.15 m. Compared with Figure 16d,e, it can be seen that the distribution of vapors on suction surface of the No. 2, No. 3, and No. 4 blades becomes uneven. As can be seen from Figure 16h, when the cavitation is fully developed, the regions with large vapor volume fraction are mainly concentrated in the middle and trailing edges of the blades. Therefore, cavitation erosion is more serious in the middle and trailing edges of suction surfaces of blades.
The uneven distribution of cavitation region in impeller is related to the flow pattern at the inlet of impeller. The cavitation development in impeller is affected by the change of inlet structure after assembling the inlet passage. Figure 17 shows the velocity distribution contour of the passage outlet with different NPSHa values. It can be seen form the figure that the flow velocity distribution at the outlet of the flow passage is not uniform. The flow velocity around the wall of the flow passage is high, while that near the drive shaft is low. According to the law of conservation of energy, the flow velocity around the wall of the passage is high, so the corresponding low pressure region will first occur at the rim of the blade, which results in the initial position of cavitation near the leading edge of the blade. The red color region in Figure 17a represents the high-speed region, so the region where the blade under high-speed impact first produces cavitation in Figure 16d.
The inlet passage has a great influence on the flow pattern of impeller inlet, mainly because the inlet shape of the passage is irregular, especially the lip. The lip curvature changes greatly, so the flow pattern at the flow passage inlet is uneven, and the lip is the most prone part of cavitation in the passage. Moreover, there is a diffusion section between the impeller inlet and the outlet of the runner, and the diffusion angle affects the influent flow pattern. At the same time, the curved section in front of the impeller inlet causes a change in the flow rate, and the curved section is also a potential region where cavitation occurs. It can be seen from Figure 18 and Figure 19 that critical cavitation occurs at the lip location. As NPSHa decreases, the cavitation region of the curved connecting section on the lower side of the drive shaft gradually increases, and the cavitation region begins to appear on the upper and lower sides of the drive shaft.

5. Conclusions

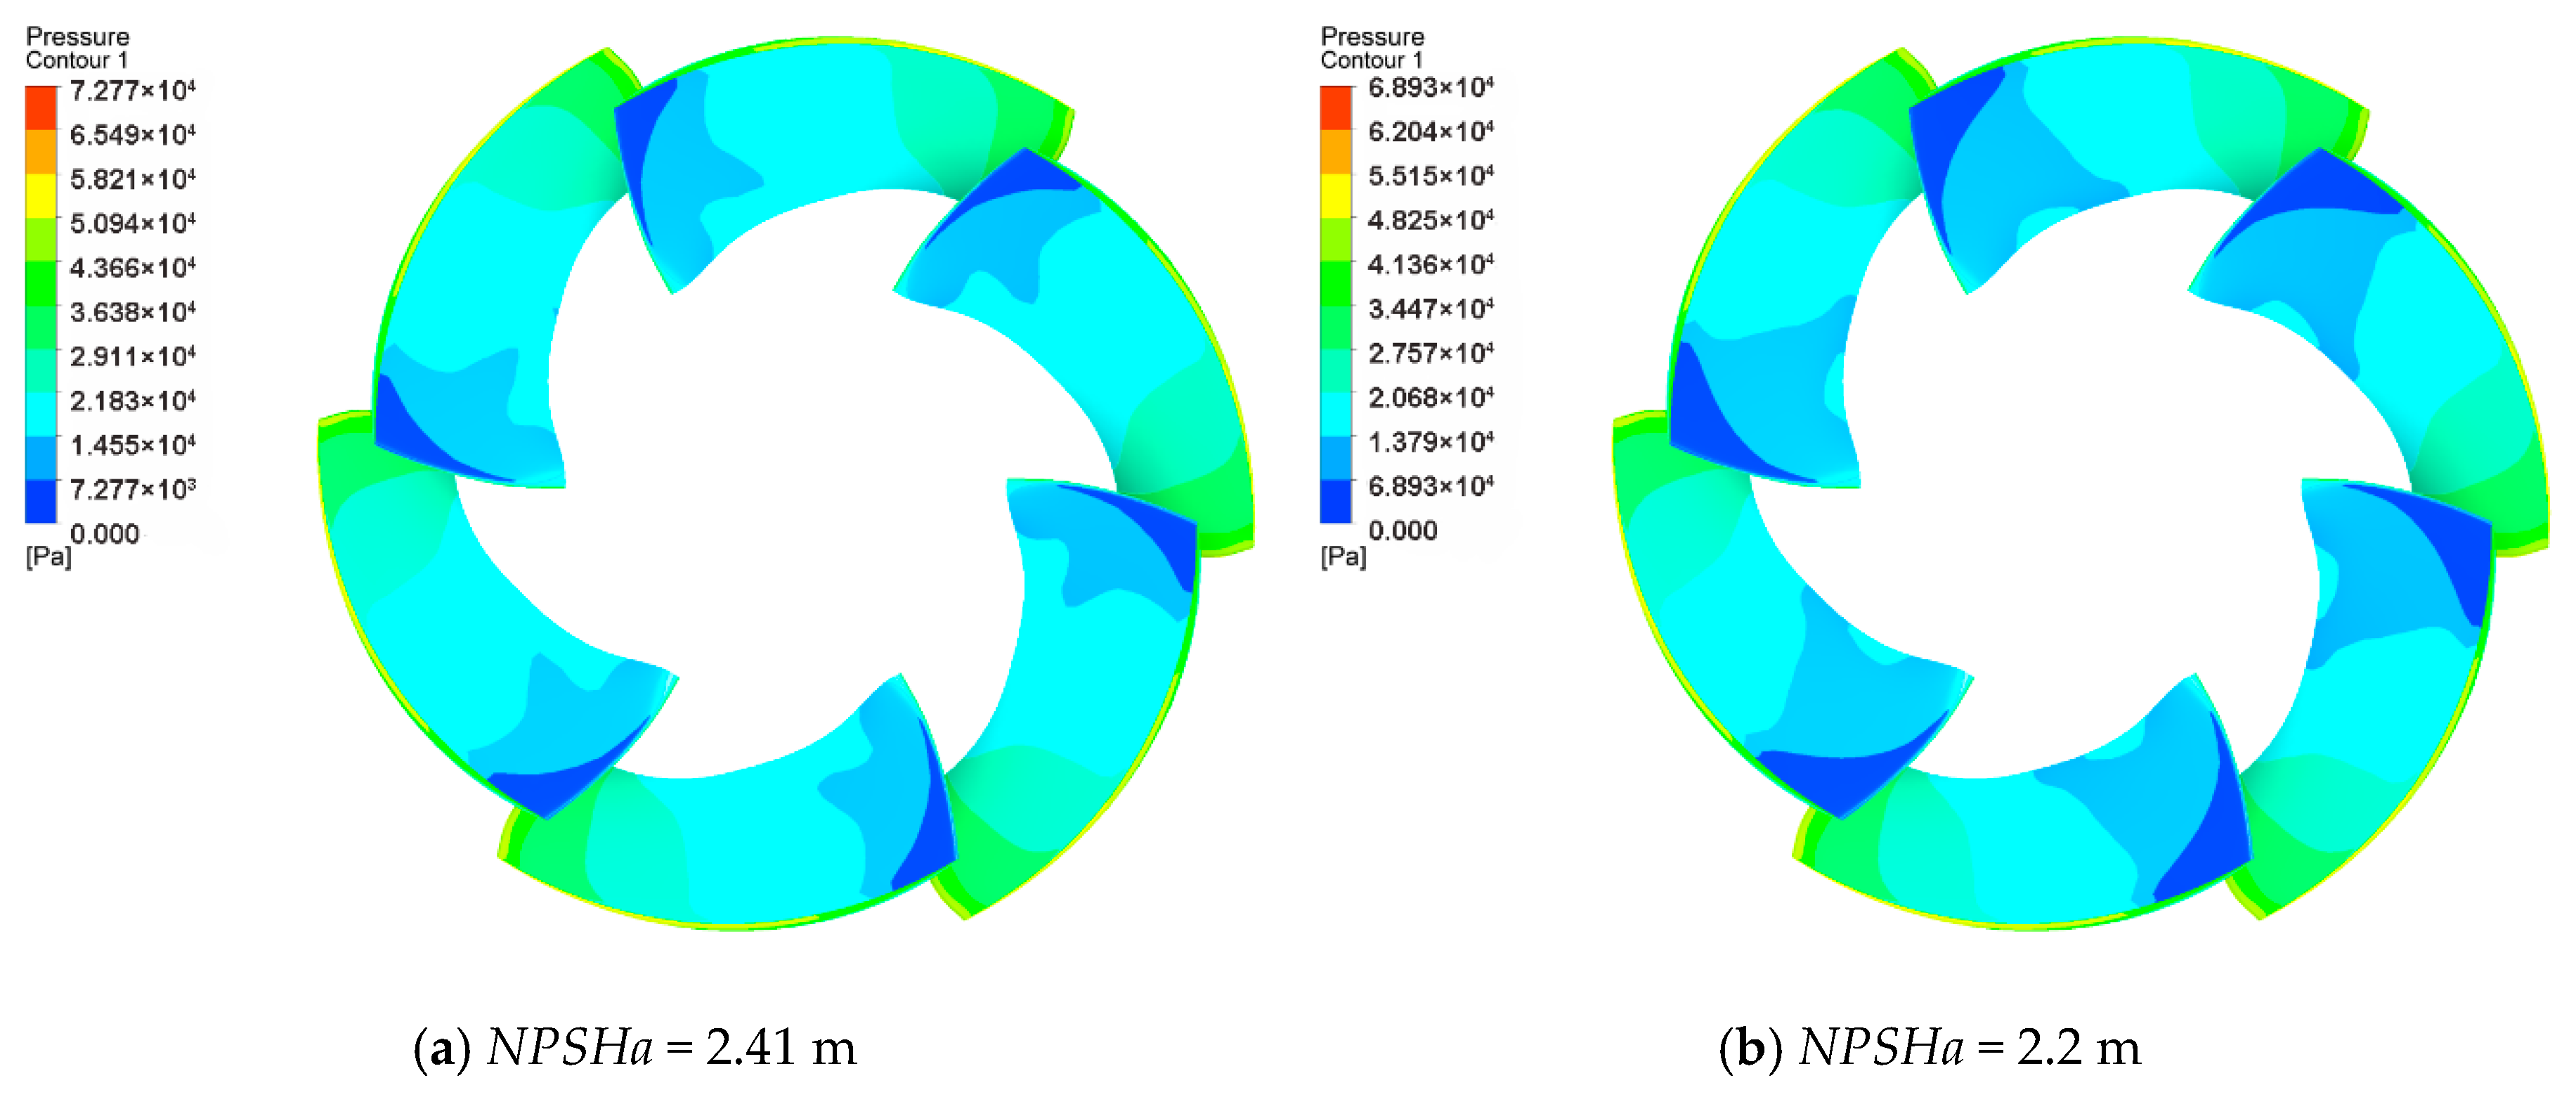
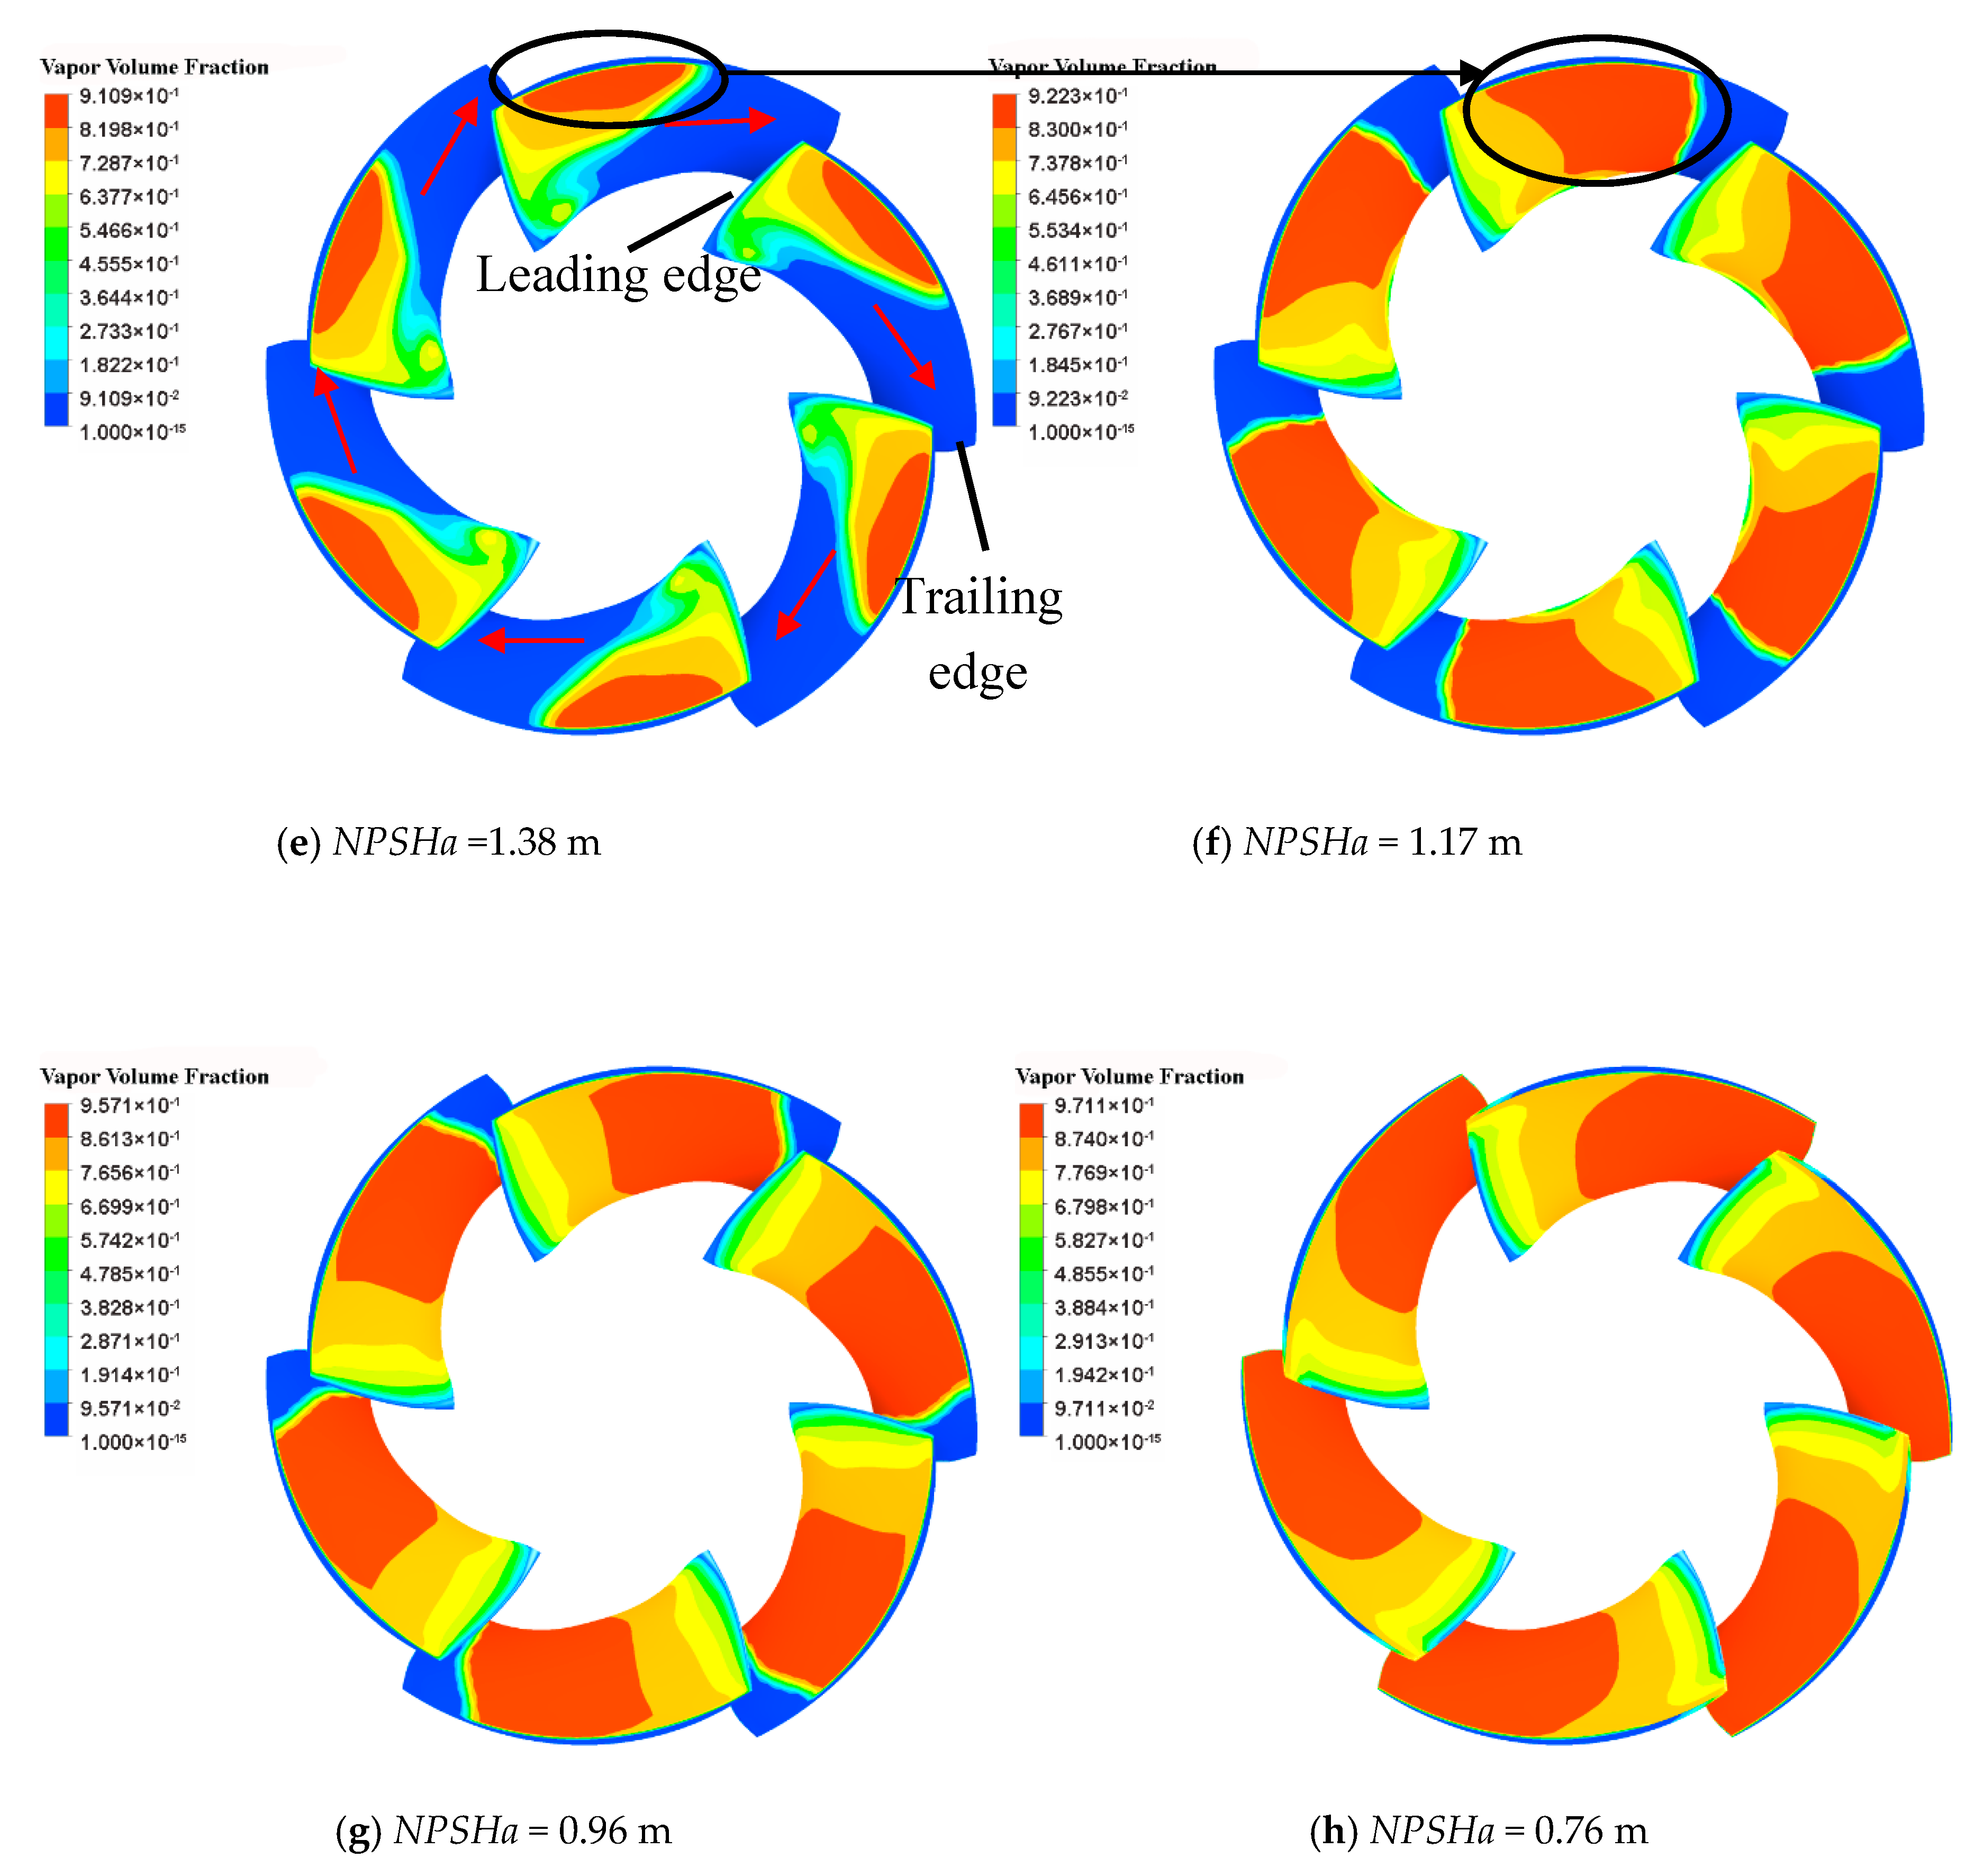
  • Under the designed flow rate condition, vapors in the process of cavitation initiation first accumulate on the leading edge of the blade’s suction surface, which is close to the impeller rim. With the decrease of inlet total pressure, the cavitation region extended towards the trailing edge and the vapor fraction volume become gradually larger. When the value of NPSHa is equal to 1.38 m, vapors begin to appear in the middle of the blade surface, and the area of cavitation region accounts for about half of the surface area of the blade suction surface. When the value of NPSHa is equal to 0.76 m, the cavitation is fully developed. The suction surface and pressure surface of the blade are covered by vapors and the impeller passage is blocked, which makes the pump unable to work properly.
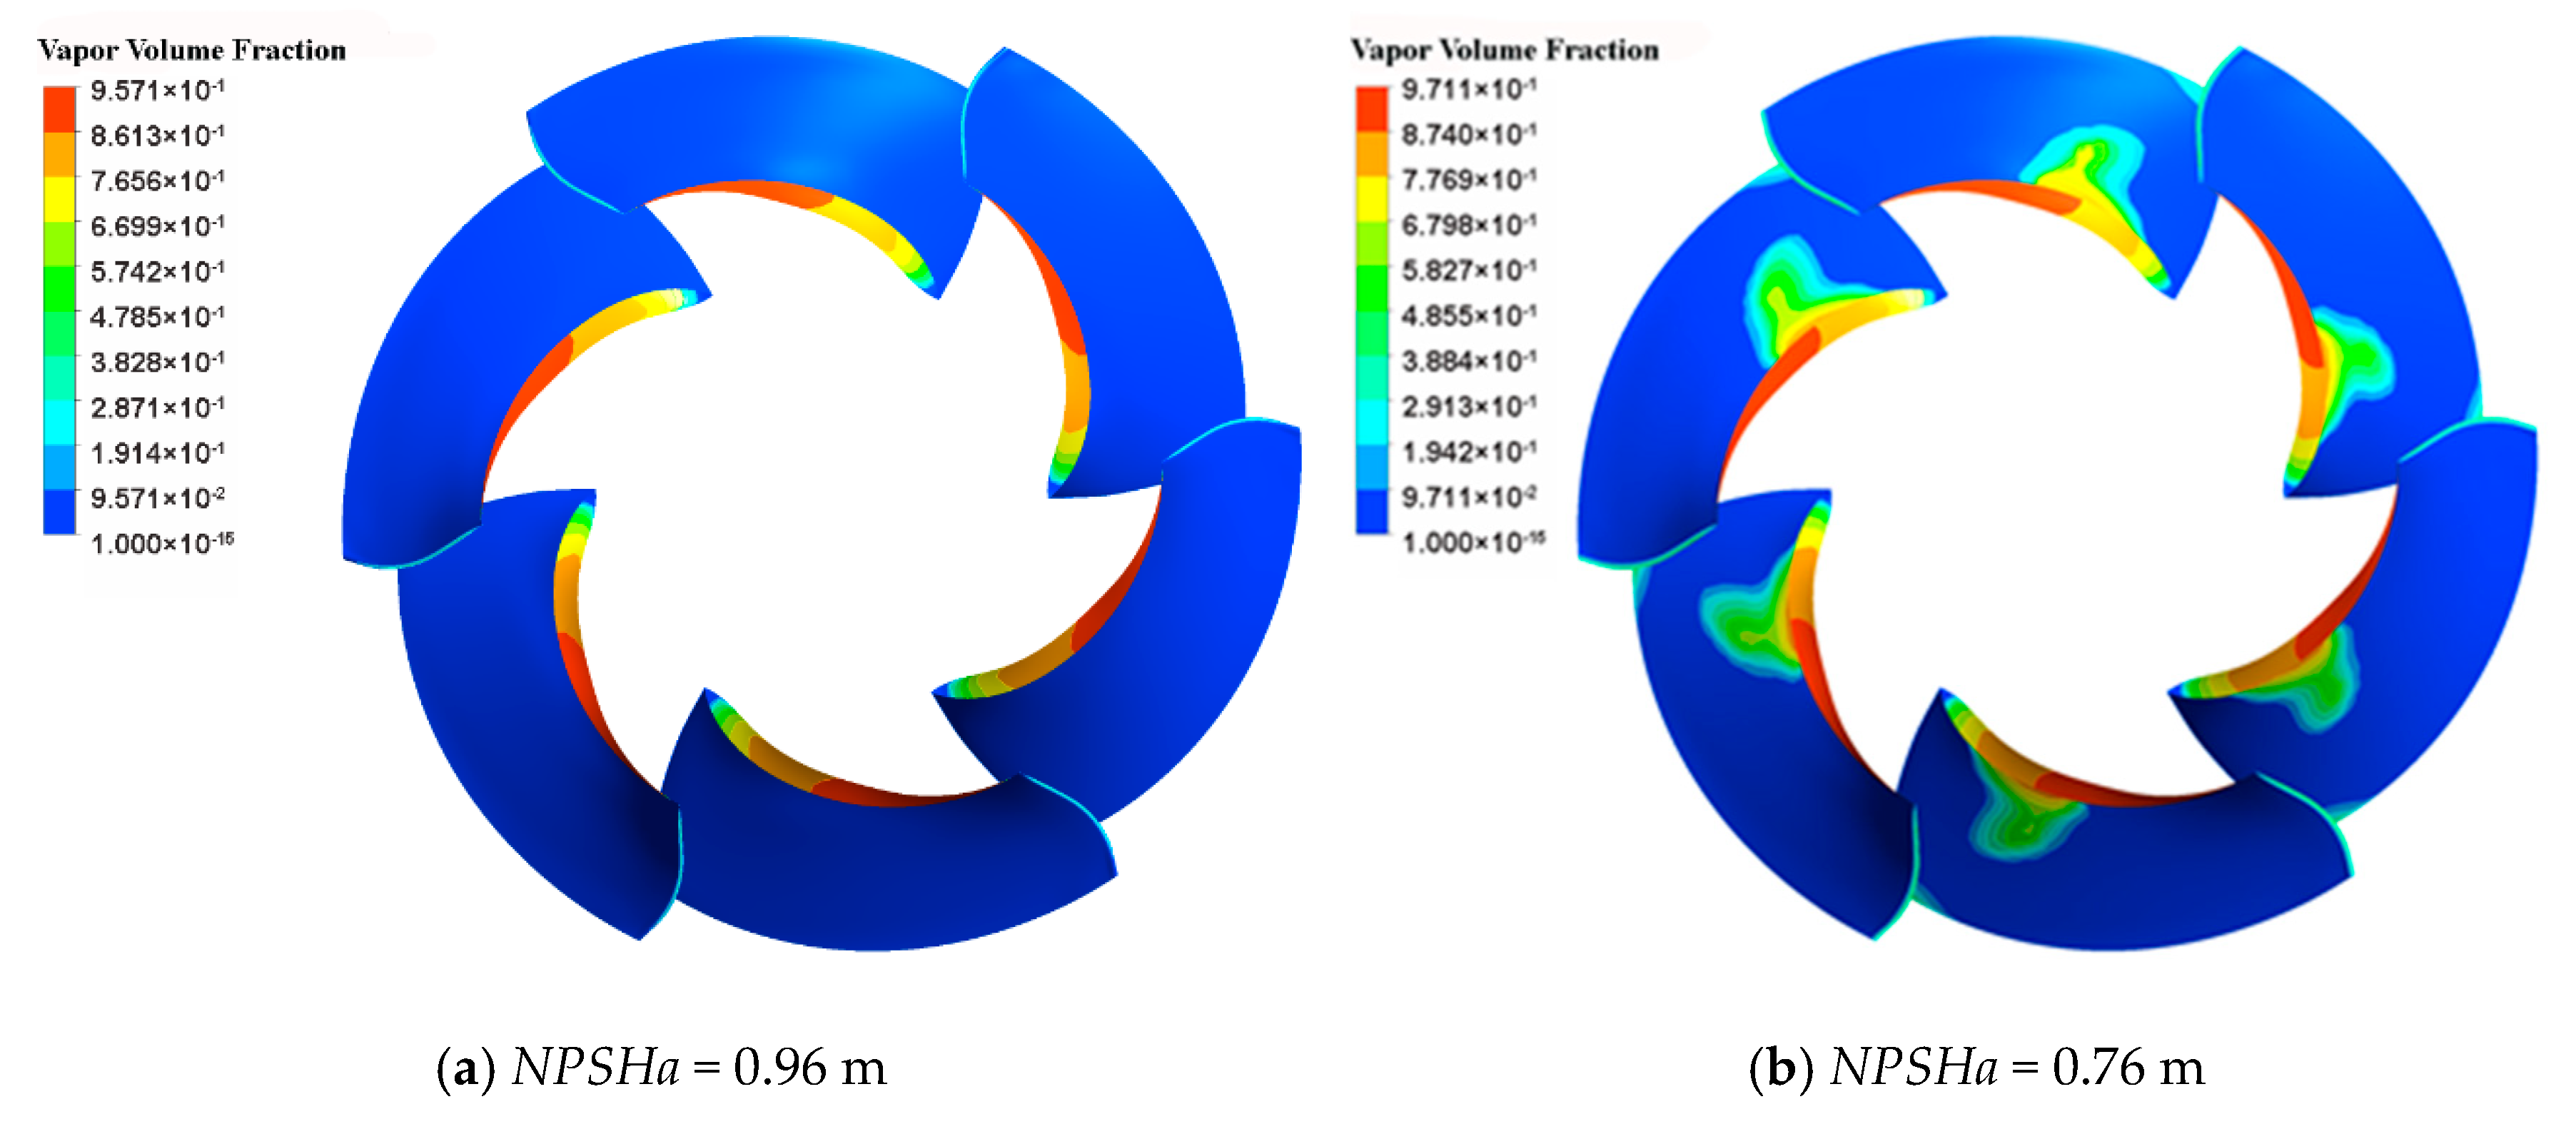
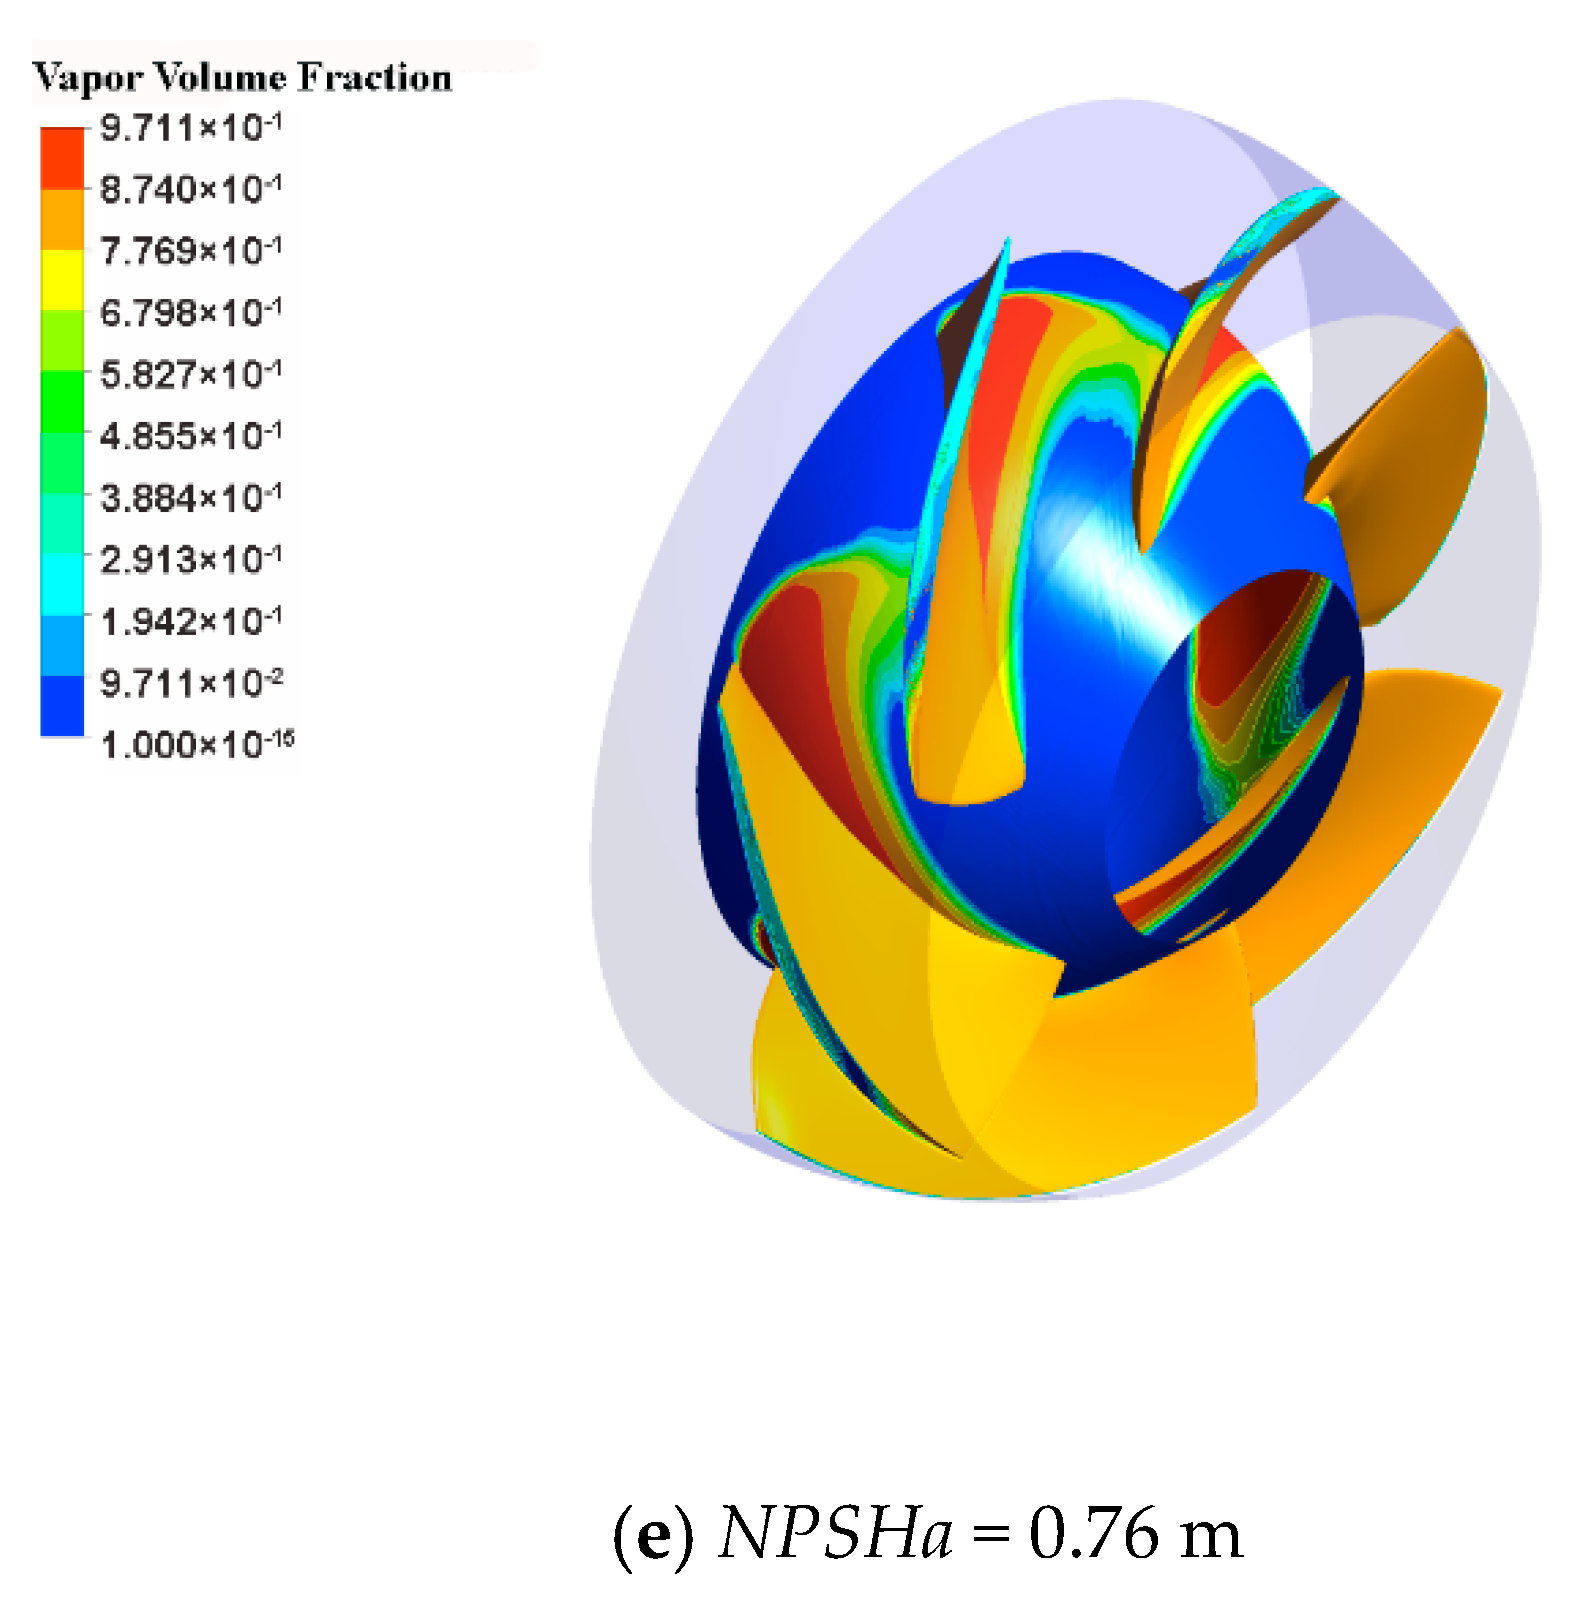
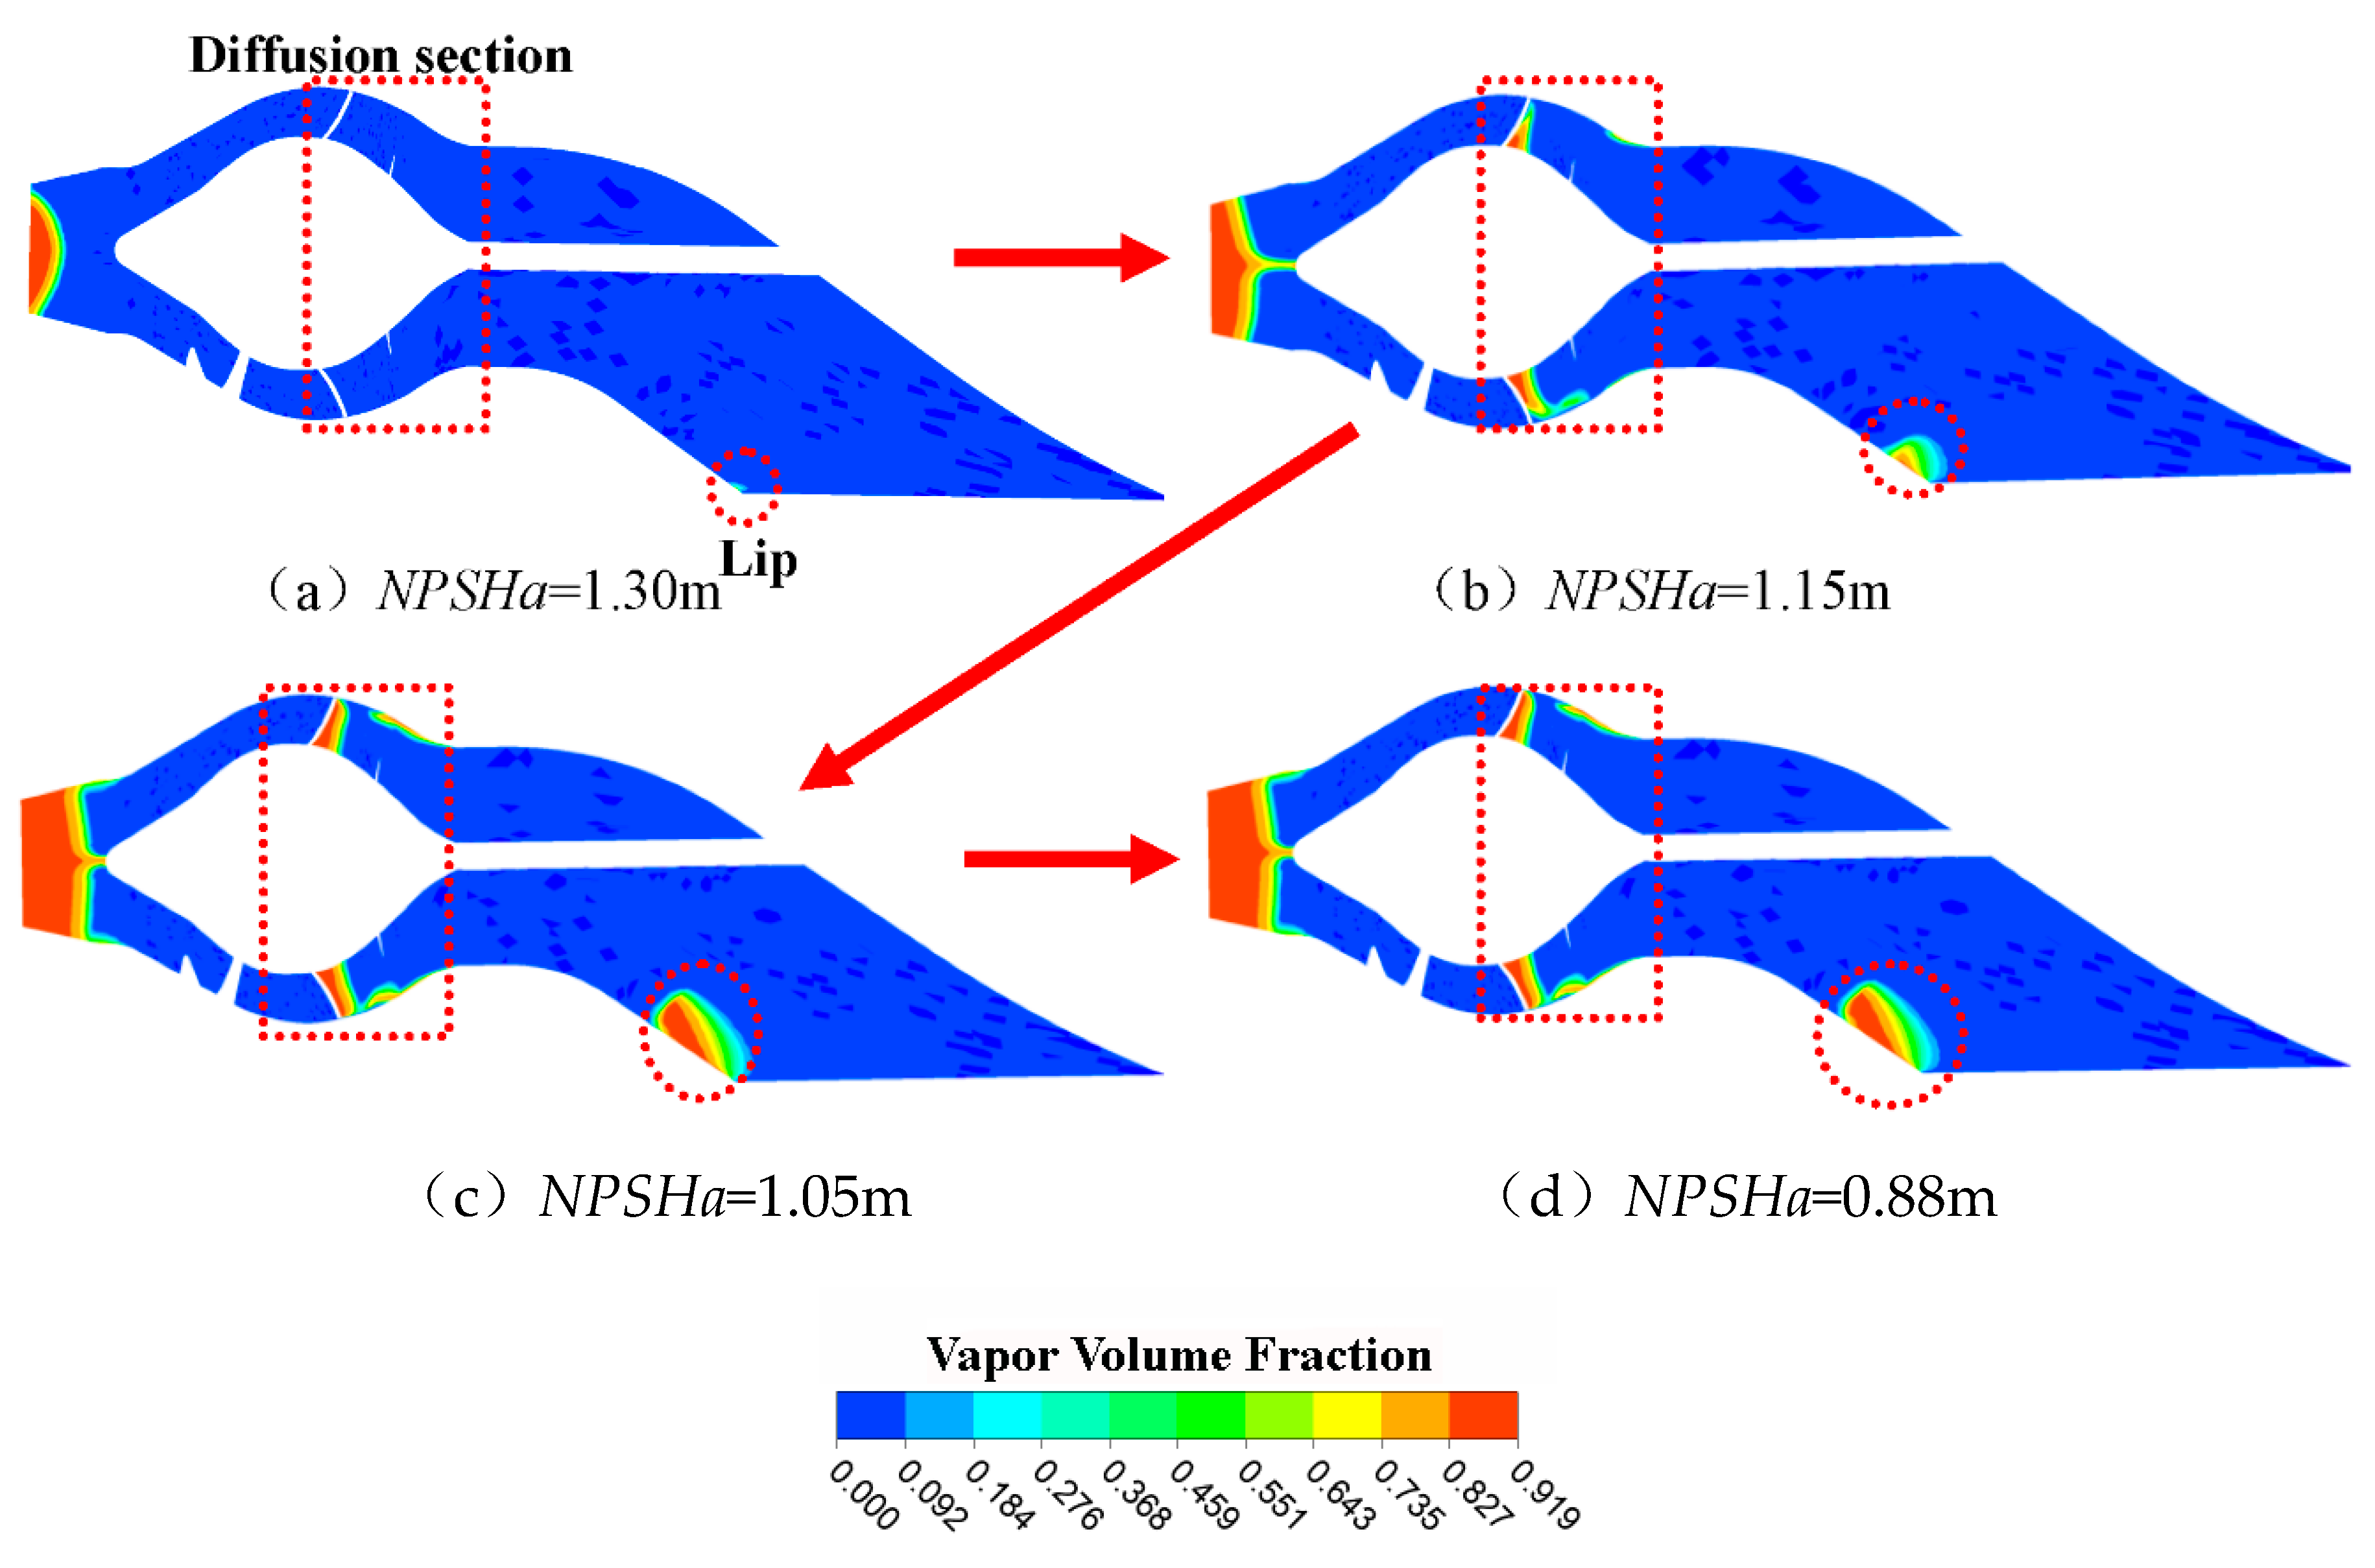
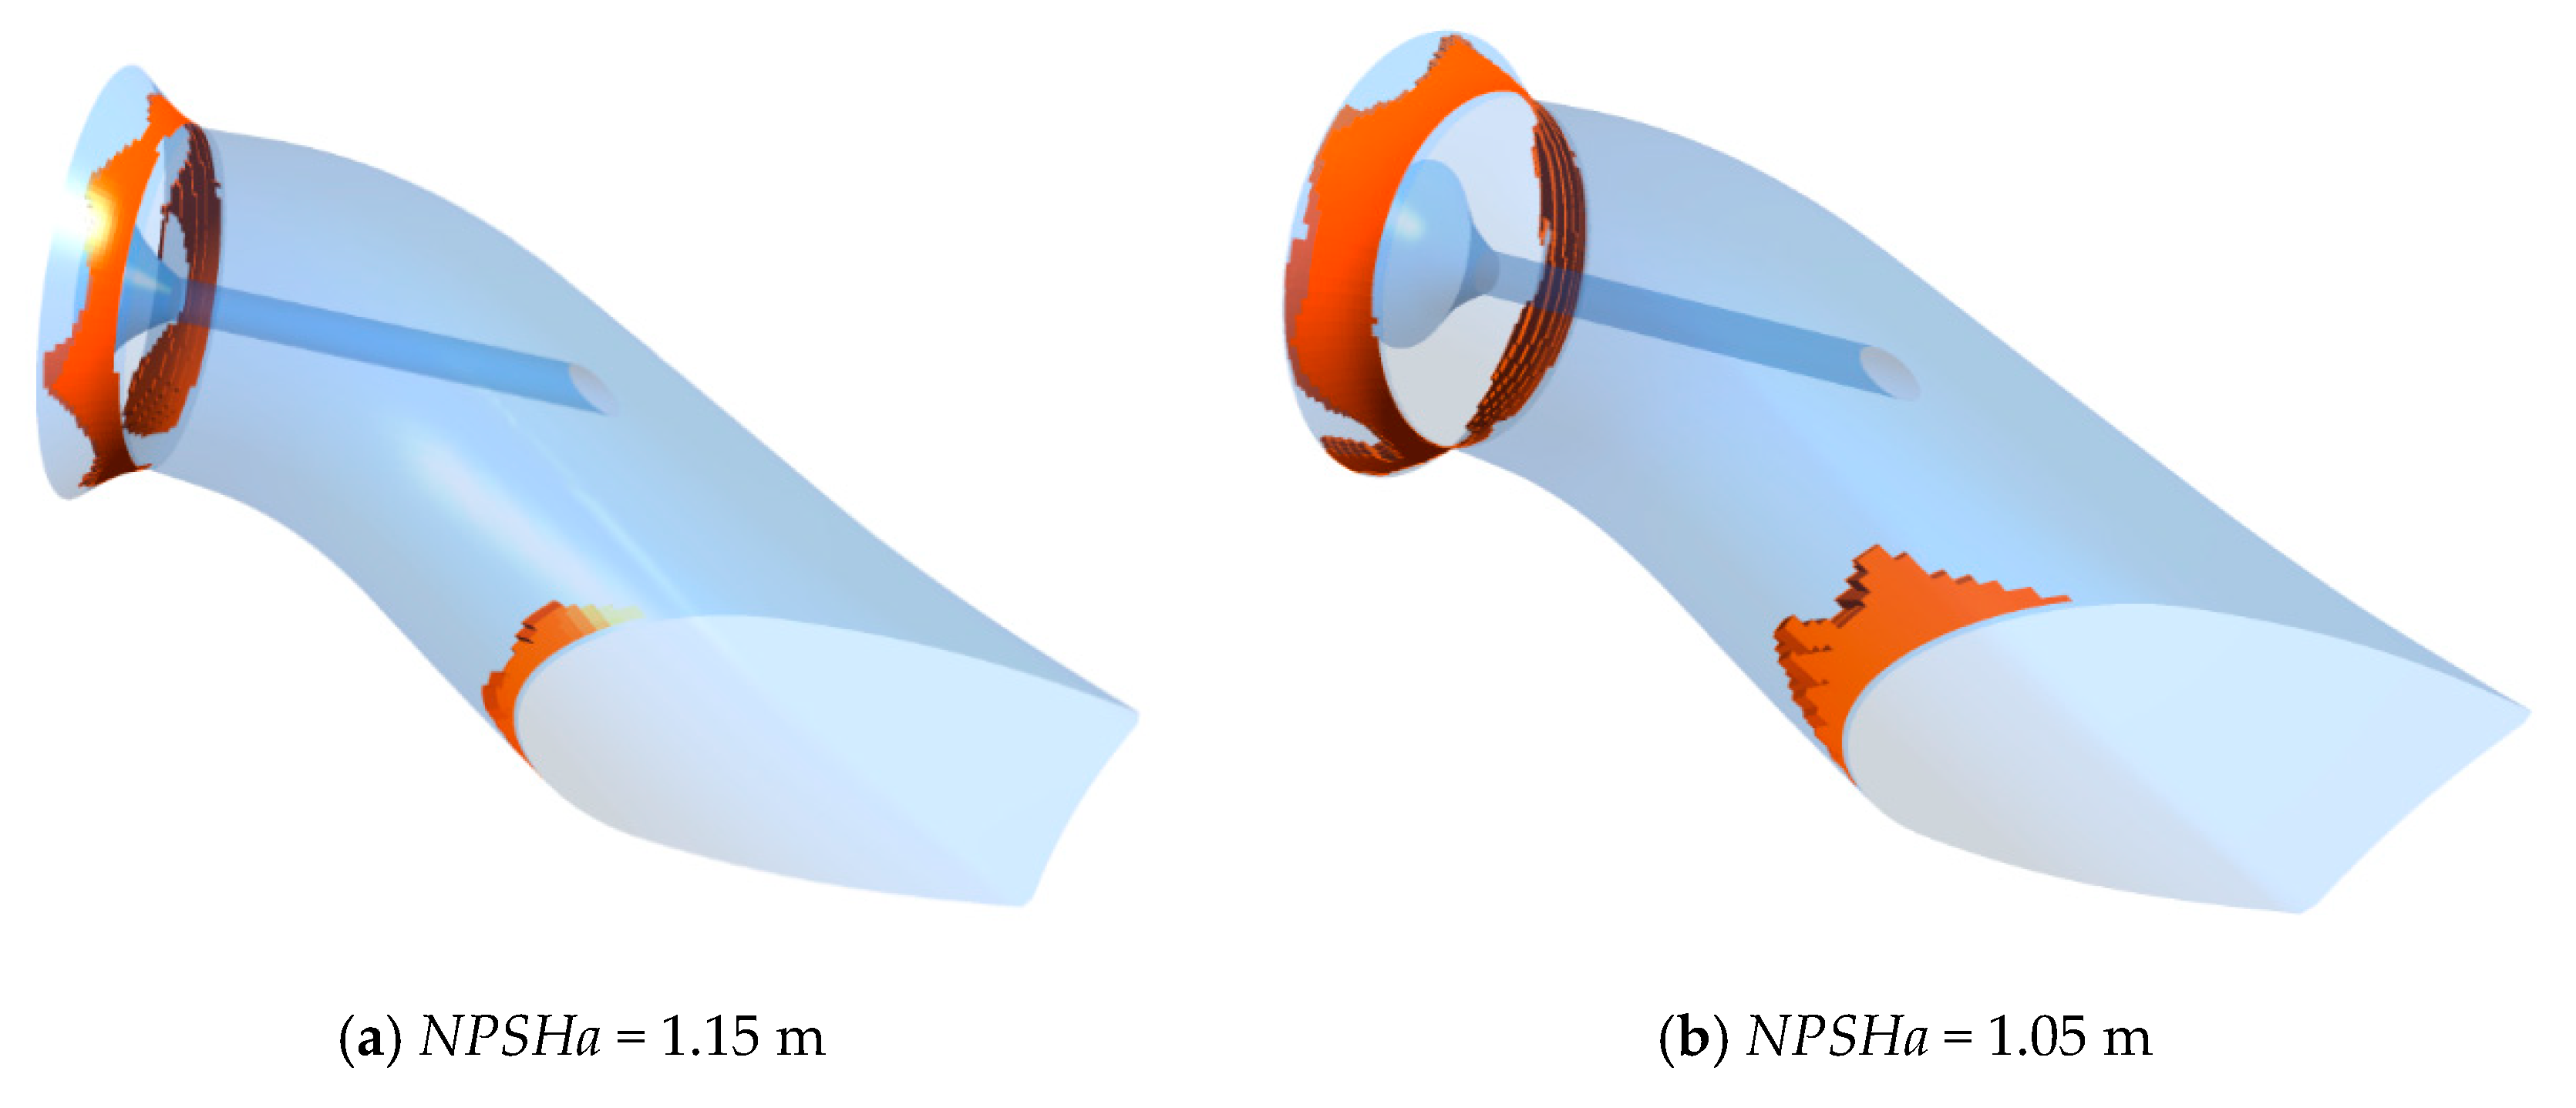
  • After assembling the inlet passage, the flow pattern at the impeller inlet is affected by the passage, resulting in the uneven distribution of the cavitation region of the impeller. This is more disadvantageous to the cavitation performance of the waterjet propulsion pump. The potential danger regions of cavitation are the lip of inlet passage and the upper and lower connecting curved section of the inlet passage. The occurrence time of cavitation in impeller is prior to that in the inlet passage.

Author Contributions

Data curation, L.C.; Formal analysis, W.J. and L.C.; Methodology, W.J.; Writing – original draft, W.J.; Writing – review & editing, L.C., C.W. and J.X.

Funding

This research was funded by the National Natural Science Foundation of China (Grant No.51779214 and No.51609105), the Peak Six Talents Plan in the Jiangsu Province (Grant No.2015-JXQC-007), the Jiangsu Province 333 High-Level Talents Training Project (BRA2018382). And the APC a project funded by the Priority Academic Program Development of Jiangsu Higher Education Institutions (PAPD).

Conflicts of Interest

The authors declare no conflict of interest.

References

  1. Bulten, N.W.H. Numerical Analysis of a Waterjet Propulsion System. Ph.D. Thesis, Library Eindhoven University of Technology, Eindhoven, The Netherlands, 2006. [Google Scholar]
  2. Park, W.G.; Jang, J.H.; Chun, H.H.; Kim, M.C. Numerical flow and performance analysis of waterjet propulsion system. Ocean. Eng. 2004, 32, 1740–1761. [Google Scholar] [CrossRef]
  3. Xia, C.; Cheng, L.; Luo, C.; Jiao, W.; Zhang, D. Hydraulic Characteristics and Measurement of Rotating Stall Suppression in a Waterjet Propulsion System. Trans. FAMENA 2018, 4, 85–100. [Google Scholar] [CrossRef]
  4. Laberteaux, K.; Ceccio, S.; Mastrocola, V.; Lowrance, J. High speed digital imaging of cavitating vortices. Exp. Fluids 1998, 24, 489–498. [Google Scholar] [CrossRef] [Green Version]
  5. Cheng, H.; Long, X.; Ji, B.; Zhu, Y.; Zhou, J. Numerical investigation of unsteady cavitating turbulent flows around twisted hydrofoil from the Lagrangian viewpoint. J. Hydrodyn. 2016, 28, 709–712. [Google Scholar] [CrossRef]
  6. Stephen, C.; Kumaraswamy, S. Experimental Determination of Cavitation Characteristics of Low Specific Speed Pump using Noise and Vibration. J. Inst. Eng. (India) 2019, 100, 64–74. [Google Scholar] [CrossRef]
  7. Wang, C.; He, X.; Shi, W.; Wang, X.; Wang, X.; Qiu, N. Numerical study on pressure fluctuation of a multistage centrifugal pump based on whole flow field. AIP Adv. 2019, 9, 035118. [Google Scholar] [CrossRef] [Green Version]
  8. Zhang, J.; Xia, S.; Ye, S.; Xu, B.; Song, W.; Zhu, S.; Tang, H.; Xiang, J. Experimental investigation on the noise reduction of an axial piston pump using free-layer damping material treatment. Appl. Acoust. 2018, 139, 1–7. [Google Scholar] [CrossRef]
  9. Ye, S.; Zhang, J.; Xu, B.; Zhu, S.; Xiang, J.; Tang, H. Theoretical investigation of the contributions of the excitation forces to the vibration of an axial piston pump. Mech. Syst. Signal Proc. 2019, 129, 201–217. [Google Scholar] [CrossRef]
  10. Zhu, Y.; Qian, P.; Tang, S.; Jiang, W.; Li, W.; Zhao, J. Amplitude-frequency characteristics analysis for vertical vibration of hydraulic AGC system under nonlinear action. AIP Adv. 2019, 9, 035019. [Google Scholar] [CrossRef] [Green Version]
  11. Long, X.; Zhang, J.; Wang, Q.; Xiao, L.; Xu, M.; Qiao, L.; Ji, B. Experimental investigation on the performance of jet pump cavitation reactor at different area ratios. Exp. Therm. Fluid Sci. 2016, 78, 309–321. [Google Scholar] [CrossRef]
  12. Tan, L.; Zhu, B.; Cao, S.; Wang, Y.; Wang, B. Influence of Prewhirl Regulation by Inlet Guide Vanes on Cavitation Performance of a Centrifugal Pump. Energies 2014, 7, 1050–1065. [Google Scholar] [CrossRef]
  13. Christopher, E. Brennen. Cavitation and Bubble Dynamics; Oxford University Press: Oxford, UK, 1995. [Google Scholar]
  14. He, X.; Jiao, W.; Wang, C.; Cao, W. Influence of surface roughness on the pump performance based on Computational Fluid Dynamics. IEEE Access 2019, 7, 105331–105341. [Google Scholar] [CrossRef]
  15. Jayaprakash, A.; Kapahi, A.; Choi, J.; Chahine, G. Modelling of material pitting from cavitation bubble collapse. J. Fluid Mech. 2014, 755, 142–175. [Google Scholar] [Green Version]
  16. Wang, C.; Chen, X.; Qiu, N.; Zhu, Y.; Shi, W. Numerical and experimental study on the pressure fluctuation, vibration, and noise of multistage pump with radial diffuser. J. Braz. Soc. Mech. Sci. Eng. 2018, 40, 481. [Google Scholar] [CrossRef]
  17. Zhang, D.; Shi, L.; Shi, W.; Zhao, R.; Wang, H.; van Esch, B.P.M. Numerical analysis of unsteady tip leakage vortex cavitation cloud and unstable suction-side-perpendicular cavitating vortices in an axial flow pump. Int. J. Multiph. Flow 2015, 77, 244–259. [Google Scholar] [CrossRef]
  18. Monte Verde, W.; Biazussi, J.; Sassim, N.; Bannwart, A. Experimental study of gas-liquid two-phase flow patterns within centrifugal pumps impellers. Exp. Therm. Fluid Sci. 2017, 85, 37–51. [Google Scholar] [CrossRef]
  19. Ji, B.; Luo, X.; Peng, X.; Wu, Y. Three-dimensional large eddy simulation and vorticity analysis of unsteady cavitating flow around a twisted hydrofoil. J. Hydrodyn. 2013, 25, 510–519. [Google Scholar] [CrossRef]
  20. Wang, C.; Hu, B.; Zhu, Y.; Wang, X.; Luo, C.; Cheng, L. Numerical study on the gas-water two-phase flow in the self-priming process of self-priming centrifugal pump. Processes 2019, 7, 330. [Google Scholar] [CrossRef]
  21. Li, C.; Qi, W. Rotating stall region of water-jet pump. Trans. FAMENA 2014, 38, 31–40. [Google Scholar]
  22. Duplaa, S.; Coutierdelgosha, O.; Dazin, A.; Roussette, O.; Bois, G.; Caignaert, G. Experimental Study of a Cavitating Centrifugal Pump During Fast Startups. J. Fluids Eng. 2010, 132, 365–368. [Google Scholar] [CrossRef]
  23. Ji, B.; Long, Y.; Long, X.; Qian, Z.D.; Zhou, J. Large eddy simulation of turbulent attached cavitating flow with special emphasis on large scale structures of the hydrofoil wake and turbulence-cavitation interactions. J. Hydrodyn. Ser. B 2017, 29, 27–39. [Google Scholar] [CrossRef]
  24. Rayleigh, L., VIII. On the pressure developed in a liquid during the collapse of a spherical cavity. Philos. Mag. 1917, 34, 94–98. [Google Scholar] [CrossRef]
  25. Bal, S.; Kinnas, S.; Lee, H. Numerical Analysis of 2-D and 3-D Cavitating Hydrofoils Under a Free Surface. J. Ship Res. 2001, 45, 34–49. [Google Scholar]
  26. Brennen, C.; Acosta, A. Fluid-induced Rotordynamic Forces and Instabilities. Struct. Control Health Monit. 2005, 13, 10–26. [Google Scholar] [CrossRef]
  27. Singhal, A.; Athavale, M.M.; Li, H.; Jiang, Y. Mathematical basis and validation of the full cavitation model. J. Fluids Eng. 2002, 124, 617–624. [Google Scholar] [CrossRef]
  28. Schmidt Steffen, J.; Sezal Ismail, H.; Schnerr Günter, H. Compressible simulation of high-speed hydrodynamics with phase change. In Proceedings of the European Conference on Computational Fluid Dynamics, Egmond aan Zee, The Netherlands, 5–8 September 2006. [Google Scholar]
  29. Gopalan, S.; Katz, J. Flow structure and modeling issues in the closure region of attached cavitation. Phys. Fluids 2000, 12, 895–911. [Google Scholar] [CrossRef]
  30. Escaler, X.; Egusquiza, E.; Farhat, M.; Avellan, F.; Coussirat, M. Detection of cavitation in hydraulic turbines. Mech. Syst. Signal Proc. 2006, 20, 983–1007. [Google Scholar] [CrossRef] [Green Version]
  31. Johnson, M.; Moore, J. The development of wake flow in a centrifugal impeller. J. Eng. Gas Turbines Power 1980, 102, 382–389. [Google Scholar] [CrossRef]
  32. Wang, C.; He, X.; Zhang, D.; Hu, B.; Shi, W. Numerical and experimental study of the self-priming process of a multistage self-priming centrifugal pump. Int. J. Energy Res. 2019, 1–19. [Google Scholar] [CrossRef]
  33. Zhu, Y.; Tang, S.; Quan, L.; Jiang, W.; Zhou, L. Extraction method for signal effective component based on extreme-point symmetric mode decomposition and Kullback-Leibler divergence. J. Braz. Soc. Mech. Sci. Eng. 2019, 41, 100. [Google Scholar] [CrossRef]
  34. Qian, J.; Chen, M.; Liu, X.; Jin, Z. A numerical investigation of the flow of nanofluids through a micro Tesla valve. J. Zhejiang Univ. Sci. A 2019, 20, 50–60. [Google Scholar] [CrossRef]
  35. Zhou, L.; Wang, Z. Numerical simulation of cavitation around a hydrofoil and evaluation of a RNG k-ε model. J. Fluids Eng. 2008, 130, 1–7. [Google Scholar] [CrossRef]
  36. Ji, B.; Luo, X.; Arndt, R.E.; Wu, Y. Numerical simulation of three dimensional cavitation shedding dynamics with special emphasis on cavitation–vortex interaction. Ocean Eng. 2014, 87, 64–77. [Google Scholar] [CrossRef]
  37. Qian, J.; Gao, Z.; Liu, B.; Jin, Z. Parametric study on fluid dynamics of pilot-control angle globe valve. J. Fluids Eng. 2018, 140, 111103. [Google Scholar] [CrossRef]
  38. Wang, C.; Shi, W.; Wang, X.; Jiang, X.; Yang, Y.; Li, W.; Zhou, L. Optimal design of multistage centrifugal pump based on the combined energy loss model and computational fluid dynamics. Appl. Energy 2017, 187, 10–26. [Google Scholar] [CrossRef]
  39. Zwart, P.; Gerber, A.; Belamri, T. A two-phase model for predicting cavitation dynamics. In Proceedings of the ICMF 2004 International Conference on Multiphase Flow, Yokohama, Japan, 30 May–4 June 2004; pp. 1–11. [Google Scholar]
  40. Kunz, R.; Boger, D.; Stinebring, D.; Chyczewski, T.; Lindau, J.; Gibeling, H. A preconditioned Navier-Stokes method for two-phase flows with application to cavitation prediction. Comput. Fluids 2000, 29, 849–875. [Google Scholar] [CrossRef]
  41. Schnerr, G.H.; Sauer, J. Physical and numerical modeling of unsteady cavitation dynamics. In Proceedings of the ICMF 2001 International Conference on Multiphase Flow, New Orleans, LA, USA, 27 May–1 June 2001; pp. 1–8. [Google Scholar]
  42. Ji, B.; Luo, X.; Wu, Y.; Peng, X.; Xu, H. Partially-Averaged Navier-Stokes method with modified k–ε model for cavitating flow around a marine propeller in a non-uniform wake. Int. J. Heat Mass Transf. 2012, 55, 6582–6588. [Google Scholar] [CrossRef]
  43. Li, X.; Yuan, S.; Pan, Z.; Yuan, J.; Fu, Y. Numerical simulation of leading edge cavitation within the whole flow passage of a centrifugal pump. Sci. China Technol. Sci. 2013, 56, 2156–2162. [Google Scholar] [CrossRef]
  44. Ji, B.; Luo, X.; Wu, Y.; Peng, X.; Duan, Y. Numerical analysis of unsteady cavitating turbulent flow and shedding horse-shoe vortex structure around a twisted hydrofoil. Int. J. Multiph. Flow 2013, 51, 33–43. [Google Scholar] [CrossRef] [Green Version]
  45. Shi, S.; Wang, G.; Chen, G.; Zhang, M. Experimental investigation of the thermal effect on the unsteady cavitating flow structure. J. Ship Mech. 2013, 17, 327–335. [Google Scholar]
Figure 1. Three-dimensional schematic diagram of the waterjet propulsion pump system. 1. Nozzle; 2. Guide vane; 3. Impeller; 4. Inlet passage; 5. Import extension; 6. Guide vane blades; 7. Impeller blades; 8. Guide vane hub; 9. Impeller hub; 10. Shaft; P1. Impeller inlet section; P2. Guide vane outlet section.
Processes 07 00690 g001
Figure 2. Grid of the computational domain by using ICEM CFD software.
Processes 07 00690 g002
Figure 3. Mesh sensitivity analysis.
Processes 07 00690 g003
Figure 4. Test rig.
Figure 4. Test rig.
Processes 07 00690 g004
Figure 5. Comparison of calculation and experiment result. * Qd represents the design flow rate; and Hd represents the head of the waterjet propulsion pump system under the designed flow rate condition.
Processes 07 00690 g005
Figure 6. Three-dimensional schematic diagram of the waterjet propulsion pump.
Processes 07 00690 g006
Figure 7. Pressure distribution on suction surface of blade with different net positive suction head-available (NPSHa) values.
Processes 07 00690 g007aProcesses 07 00690 g007b
Figure 8. Pressure distribution on pressure surface of blade with different NPSHa values.
Processes 07 00690 g008
Figure 9. Vapor volume fraction distribution on suction surface of blade.
Processes 07 00690 g009aProcesses 07 00690 g009b
Figure 10. Vapor volume fraction distribution on pressure surface of blade.
Processes 07 00690 g010
Figure 11. Static pressure distribution at different spans on blade surface.
Processes 07 00690 g011aProcesses 07 00690 g011b
Figure 12. Pressure variation from hub to rim with different NPSHa values.
Processes 07 00690 g012
Figure 13. Vapor volume distribution of impeller rim and hub.
Processes 07 00690 g013aProcesses 07 00690 g013b
Figure 14. Cavitation characteristic curve of pump under design flow condition.
Processes 07 00690 g014
Figure 15. Cavitation characteristic curve of the waterjet propulsion system.
Processes 07 00690 g015
Figure 16. Distribution of vapor volume fraction on suction surface of blade.
Processes 07 00690 g016aProcesses 07 00690 g016b
Figure 17. Velocity distribution contour of the passage outlet with different NPSHa values.
Processes 07 00690 g017aProcesses 07 00690 g017b
Figure 18. Vapor volume distribution in the inlet passage with different NPSHa values.
Processes 07 00690 g018
Figure 19. Cavitation volume distribution in the inlet passage with different NPSHa values.
Processes 07 00690 g019
Table 1. Basic geometrical parameters of the waterjet propulsion pump system.
Geometric ParameterValueGeometric ParameterValue
Inlet diameter of the impeller D0 1 D0Outlet diameter of the impeller D1 1.19 D0
Outlet diameter of the nozzle D2 0.55 D0Height of the inlet passage H11.2 D0
Height of the import extension H20.9 D0Length of the import extension L14 D0
Number of the impeller blades Z26Number of the guide vane blades Z17
Dip angle of the inlet passage θ 28°Rotational speed n (r/min)700

