Article

Basic Dye Removal with Sorption onto Low-Cost Natural Textile Fibers

by
George Z. Kyzas
1,*,
Evi Christodoulou
2 and
Dimitrios N. Bikiaris
2,*
1
Hephaestus Advanced Laboratory, Eastern Macedonia and Thrace Institute of Technology, GR 65404 Kavala, Greece
2
Department of Chemistry, Aristotle University of Thessaloniki, GR 54124 Thessaloniki, Greece
*
Authors to whom correspondence should be addressed.
Processes 2018, 6(9), 166; https://doi.org/10.3390/pr6090166
Submission received: 30 August 2018 / Revised: 10 September 2018 / Accepted: 12 September 2018 / Published: 14 September 2018
(This article belongs to the Special Issue Wastewater Treatment Processes)

Abstract

:
Over the last several years, the trend of researchers has been to use some very low-cost materials as adsorbents. For this purpose, some already commercially used bast fibers were selected as potential adsorbent materials to remove basic dye from synthetic effluents. The adsorption of basic yellow 37 dye was studied using three different bast fibers under the names of flax, ramie, and kenaf. Their morphological structure was examined using several techniques such as scanning electron microscopy (SEM), crystallinity, X-Ray diffraction (XRD) and Fourier transform infrared spectroscopy (FTIR), as well as those characterizations being a useful tool to propose a mechanism of the whole adsorption process. The adsorption evaluation was achieved by studying at first the pH (12) and temperature effects (25–55 °C). Two isotherm models (Langmuir and Freundlich) were also applied to the experimental equilibrium data revealing the superiority of ramie fibers (327, 435, and 460 mg·g−1 (25 °C) for kenaf, flax, and ramie, respectively). The crucial adsorbent’s dosage was found to be 0.1 g per litre for all fibers, while the completed desorption study (eluant’s pH and reuse cycles) also confirmed the strong potential of these kinds of fibers as adsorbents. The latter may be attributed to the cellulosic content.

1. Introduction

Natural fibers, such as cotton, hemp, and flax, are widely used for industrial applications, such as textiles additives [1,2], in order to increase the biodegradability of polymers [3], absorbent materials [4], etc. The excess of those materials are then considered as wastes with a special need for treatment. Based on the above, an idea to use some of those fibers as alternative materials (i.e., adsorbents for treatment of effluents) is of great interest due to their low cost and simplicity.
An important question, which needs to be clearly answered, is: why apply adsorption for the decontamination of effluents? Recently, adsorption has been widely applied on wastewater decontamination [5,6,7,8,9], mainly because of its removal efficiency from dilute solutions. Usual materials like activated carbon [10], chitosan [11], zeolite, and clay [12] are still in high demand due to their great adsorption capacity, but these are relatively costly. Therefore, there is a rising interest in finding relatively effective, low-cost, and simply accessible adsorbents. As such, the scientific community looks to inexpensive adsorbent materials to further reduce the process cost. The most recent trend in adsorbent material science are the so-called “low-cost” or “zero-cost” materials [13,14,15]. According to the literature, plenty of low-cost materials have already been tested in wastewater decontamination by adsorbing several pollutants, such as dyes [16,17,18,19], heavy metal ions [20,21,22,23,24,25], pesticides, drugs, etc. [26,27]. Some possible alternative materials can be natural fibers. There is a need for green/sustainable process development, besides the green adsorbents themselves, and in the last few years, many examples of them have been given in the literature [28,29,30,31,32].
Plant fibers are classified according to their origin as seed, leaf, bast, or core fibers [33]. Especially, flax (Linum usitatissimum), ramie (family of Urticaceae), and kenaf (Hibiscus cannabinus L.) belong to the large group of bast fibers, while their constitution is basically constructed by three main polymers, i.e., cellulose, hemicellulosic polysaccharides, and the aromatic compound lignin, along with some proteins, extractives, minerals, etc.
The overall scope of the present study is to quantify the adsorption potential of flax, ramie, and kenaf fibers for basic dye removal (basic yellow 37). Until now, there is no other study regarding the removal of basic/cationic dyes and those fibers (with cellulosic content).
Over the last two decades, cellulose has been utilized as an adsorbent component due to its unique properties [34]. Its high surface activity due to the supramolecular structure provides several applications in adsorption, swelling, and sorption of dye molecules [16,17,18,19,35,36,37]. In addition, this semicrystalline physical polymer presents many available areas for the adsorption of molecules in both the amorphous phases and the surfaces of the crystalline domains [38,39,40]. Among these advantages, fibers from plants have already been extensively examined for their ability to adsorb dyes and heavy metals. All of the above indicate the clear impact of cellulosic content in dye removal. Few works have been published so far about the sorption by bast fibers. In contrary, most of them are based on the use of hemp fibers [41,42].
The structure of this work can be classified into four main steps: (i) fibers characterization with Fourier transform infrared spectroscopy (FTIR), scanning electron microscopy (SEM), and X-Ray diffraction (XRD); (ii) adsorption experiments using a cationic dye (basic yellow 37) as a model pollutant; (iii) adsorptive evaluation studying the impact of pH, the initial dye concentration, temperature (isotherms and thermodynamics), and the mass of the fibers (adsorbents’ dosage); and (iv) reuse potential of the fibers performing desorption experiments first (deionized water as eluent in different pH values) and then reuse cycles (adsorption-desorption experiments).

2. Experimental Section

2.1. Materials

Basic yellow 37 (abbreviated as BY37) (C21H29N3; M.W. = 323.48 g·mol−1; dye purity = 55% w/w) was used as a model dye pollutant. Kenaf, flax, and ramie fibers (thickness 40 μm; length 3 cm) were used as natural bast fibers. The fibers were supplied from Beijing, China. Double distilled water was employed in all of the adsorption/reuse tests. Following adsorption, the analysis of the liquid phase was carried out to estimate the BY37 residual concentration. The samples were collected from the supernatant and then filtered through fixed pore-sized membranes (0.45 μm) purchased by Schleicher & Schuell-MicroScience. BY37 concentration was determined using a UV-vis spectrophotometer (Perkin-Elmer 1100 B, Dresden, Germany) at λmax (440 nm).

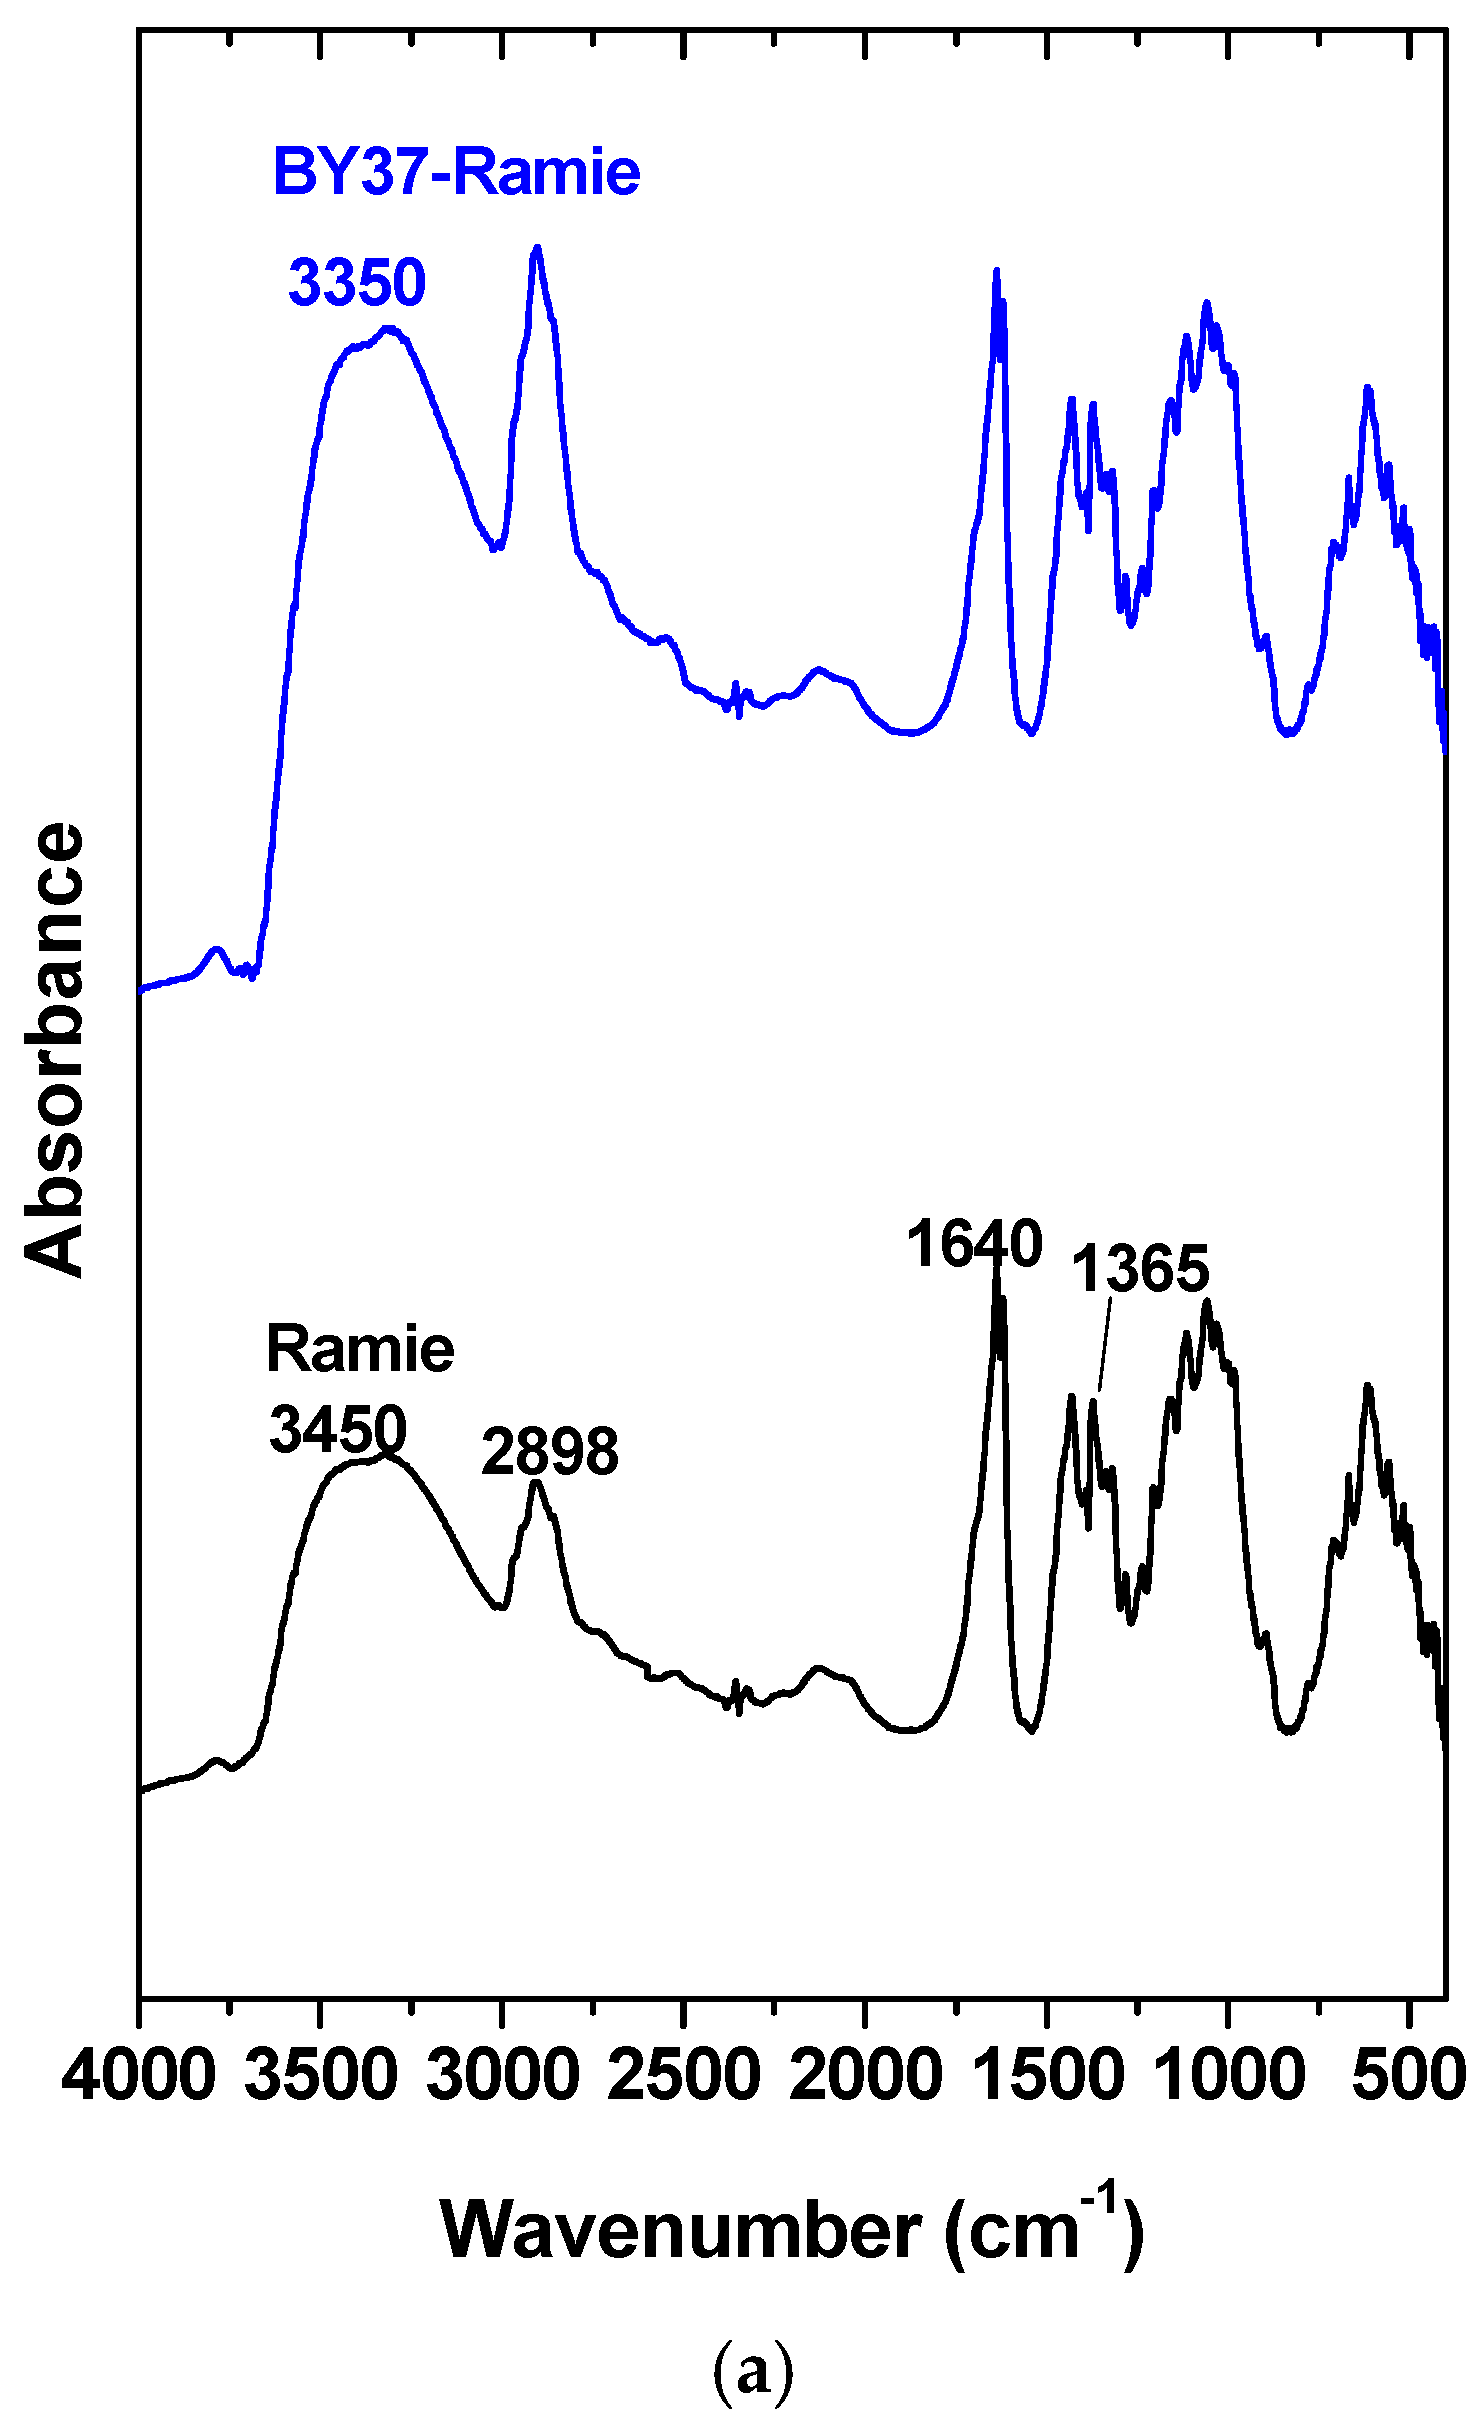
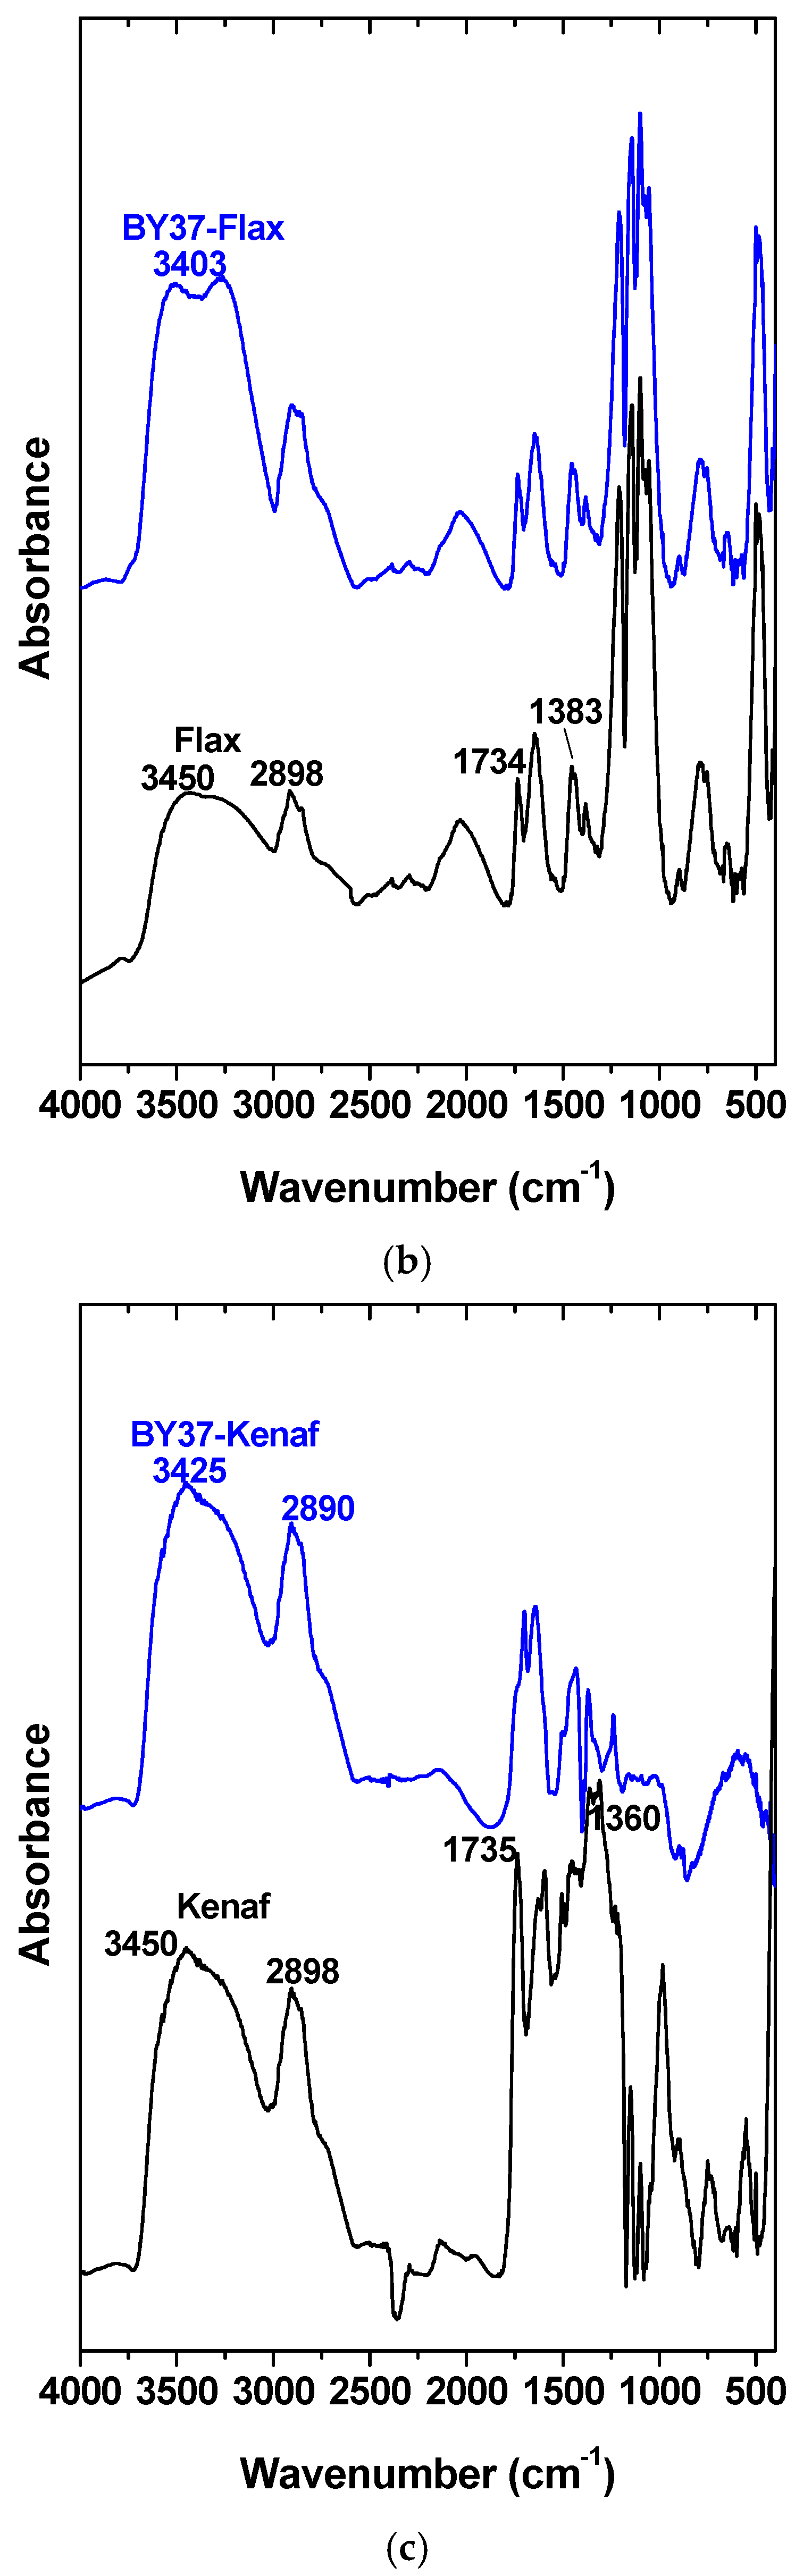
2.2. Characterization Techniques

XRD patterns were obtained using an XRD diffractometer (model PW1820, Philips, New York, NY, USA) at 40 kV and 40 mA in the angular range of 2θ = 5–60° using CuKα radiation (0.15405 nm) to identify the crystalline phase. SEM images were obtained using an electron microscope (model Zeiss Supra 55 VP, Jena, Germany). The accelerating voltage was 15.00 kV, and the measurement was performed in situ on a sample powder. The FTIR spectra of the samples were recorded using a FTIR spectrometer (model FTIR-2000, Perkin Elmer, Dresden, Germany) by mixing the finely ground specimen with potassium bromide (thickness ≈ 500 μm). They were recorded from 4000 to 400 cm−1 with a resolution of 2 cm−1 (64 co-added scans), presented with a baseline correction and converted to the absorbance mode. Crystallinity index (CI) and percentage crystallinity (Xc) were calculated from Equations (1) [43] and (2) [44], respectively (where I002 (counts) was the intensity of the 002 crystalline peak at 22° and Iam (counts) was the height of the minimum between the 002 and 110 crystalline peaks):
CI = I 002 I am I 002
X c = ( I 002 I 002 + I am ) × 100 %

2.3. Adsorption Experiments
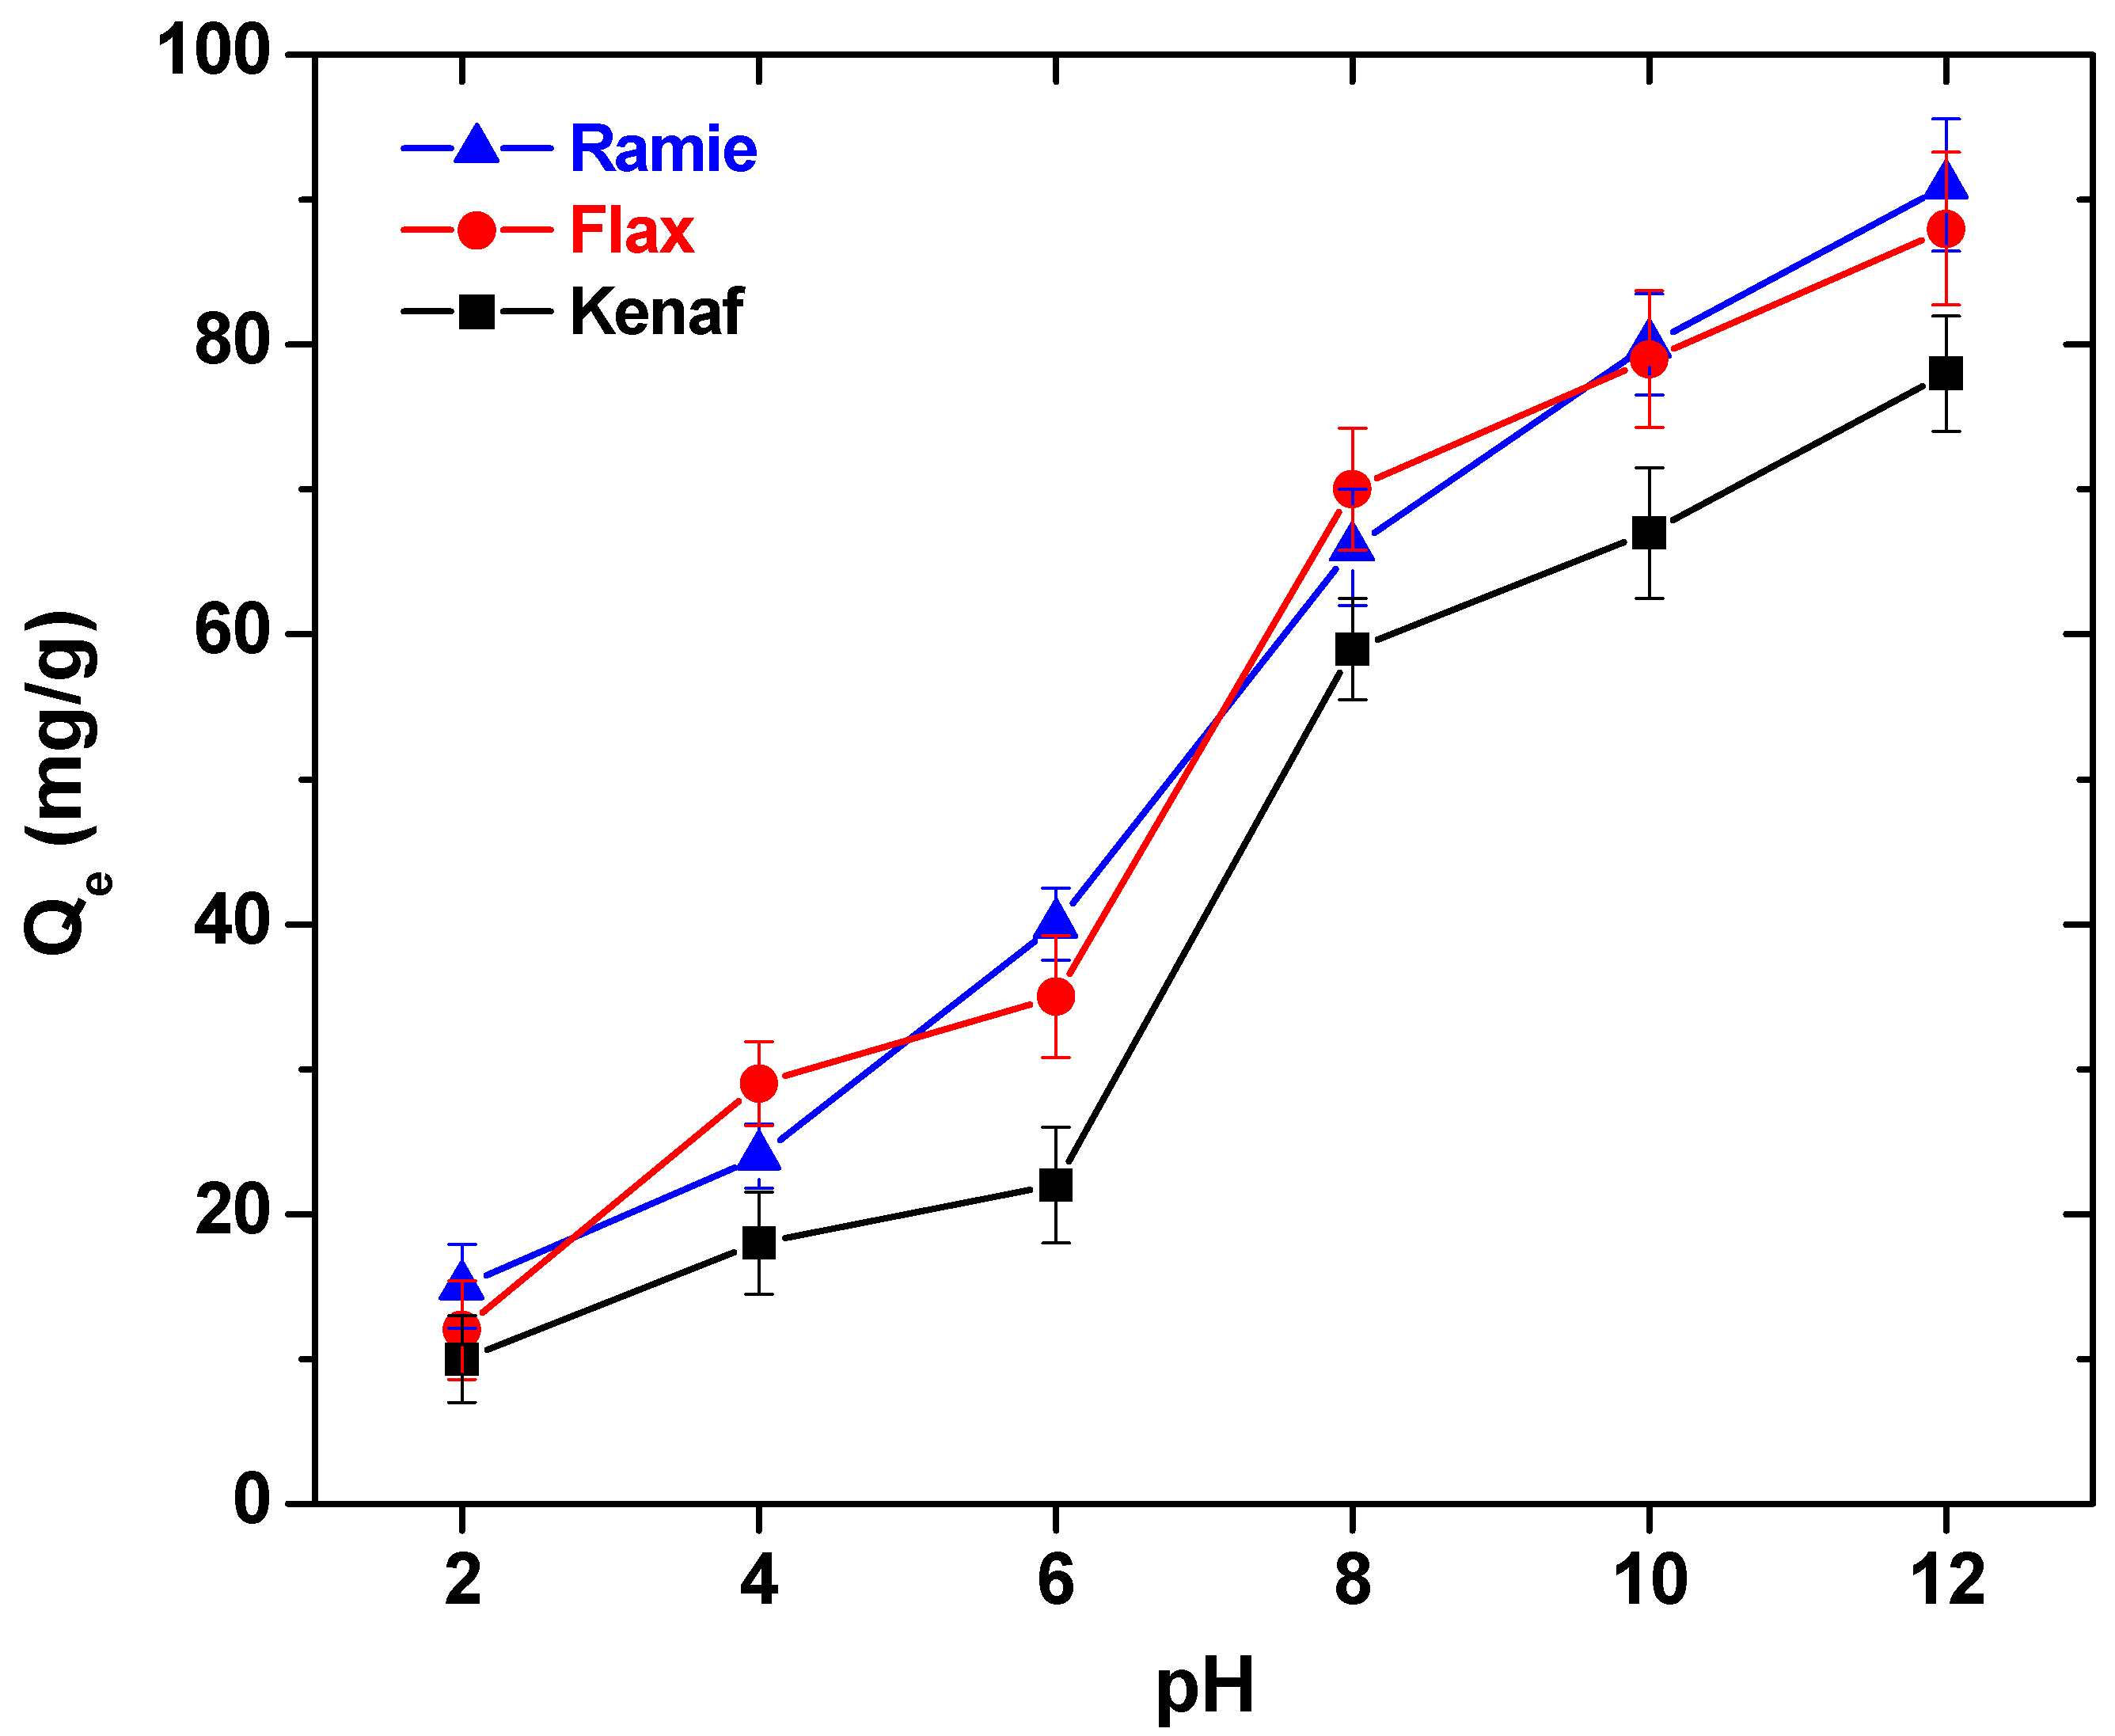
The adsorption experiments could be divided into four main groups: (i) effect of pH, (ii) effect of the initial dye concentration on equilibrium; (iii) effect of the temperature on equilibrium; and (iv) effect of the adsorbent’s mass. The aforementioned experiments are briefly described below. All experiments were performed in triplicate in order to provide more accurate results and evaluation.

2.3.1. Effect of pH

The used amount of adsorbents (fibers) was 0.1 g (m) and they were added to six conical flasks containing 100 mL of the adsorbate solution (V). The initial dye concentration (C0) was 100 mg·L−1. Then, the initial pH was adjusted to particular values (2, 4, 6, 8, 10, and 12) using an acid (0.1 M HNO3) or base (0.1 M NaOH). Those pH values were selected in order to cover all of the pH range and study the adsorption behavior in either strong acidic or alkaline conditions. Then, the conical flasks were put into a temperature-controlled shaking water bath (model Julabo SW-21C, Seelbach, Germany), setting the temperature (T) and agitation speed (N) at 25 °C and 160 rpm, respectively. The agitation lasted for 24 h (t), and afterwards the residual dye concentration was determined as described in Section 2.1.

2.3.2. Effect of the Initial Dye Concentration and Temperature on Equilibrium (Isotherms)

A mass of 0.1 g of fibers were added to 11 conical flasks containing 100 mL of the adsorbate solution (V). The initial dye concentration was varied (C0 = 10, 30, 50, 75, 100, 150, 200, 300, 500, 750, and 1000 mg·L−1). The conical flasks used for these batch experiments were again placed into the temperature-controlled shaking water bath using the fixed conditions (N = 160 rpm). The pH was adjusted to 12 because this pH values was the optimum valued found from the pH effect experiments. The flasks were agitated for 24 h (t), because this time was the optimum, in which the adsorption reached the equilibrium for all fibers. This series of experiments was done at four temperatures (T = 25, 35, 45, and 55 °C), and then the equilibrium dye concentration in the solid phase (Qe) was calculated using the mass balance equation:
Q e = ( C 0 C e ) V m
Then the equilibrium data found were fitted to the Langmuir (Equation (4)) [45] and Freundlich (Equation (5)) [46] isotherm equations [47]. Although there are also other common (and more recent) isotherm models (Dubinn-Radushkevich, Toth, Khan, Langmuir-Freundlich, etc.), the major aim of the present study was the quantitative evaluation of the adsorption results. Therefore, the most widely-used models (Langmuir and Freundlich) were primarily selected for fitting.
Q e = Q m K L C e 1 + K L C e
Q e = K F ( C e ) 1 n
where Qm (mg·g−1) is the maximum amount of adsorption, KL (L·mg−1) is the Langmuir adsorption equilibrium constant, KF ( mg ( 1 1 n ) L ( 1 n ) g 1 ) is the Freundlich constant, and n (dimensionless) is the constant depicting the adsorption intensity.
The overall purpose of the various temperatures was to evaluate the adsorption process thermodynamically. For this purpose, three key parameters have been estimated based on the isotherms curves that resulted at 25, 35, 45, and 55 °C: the change of Gibbs free energy (ΔG0, kJ·mol−1), enthalpy (ΔH0, kJ·mol−1), and entropy (ΔS0, kJ·mol−1·K−1). The system of equations below was employed for the calculation of the previously mentioned parameters (where Cs (mg·L−1) is the amount adsorbed on a solid at equilibrium and R (8.314 J·mol−1·K−1) is the universal gas constant [48]:
K c = C s C e
Δ G 0 = RTln ( K c )
Δ G 0 = Δ H 0 T Δ S 0
ln ( K c ) = ( Δ H 0 R ) 1 T + Δ S 0 R
ΔG0 was given from Equation (7), while ΔH0 and ΔS0 were given from the slope and intercept of the chart between ln(Kc) versus 1/T (Equation (9)).

2.3.3. Effect of the Adsorbent’s Mass

To evaluate the impact of the adsorbent’s amount, particular masses of fibers were added to each flask. Therefore, m = 0.01, 0.02, 0.03, 0.04, 0.05, 0.07, 0.10, 0,15, 0.20, and 0.50 g were added to 10 conical flasks containing 100 mL of the adsorbate solution (V). The initial dye concentration was C0 = 100 mg·L−1 and the pH was adjusted to 12. The conical flasks used for this run of experiments were placed into the temperature-controlled shaking water bath using the fixed conditions (T = 25 °C, and N = 160 rpm). The agitation once again lasted for 24 h (t), and after that, the equilibrium dye concentration in the solid phase (Qe) was calculated using the mass balance equation (Equation (3)).

2.4. Desorption and Reuse Experiments

These experiments were performed in batch mode using the following constant (optimum) adsorption conditions: pHads = 12, C0ads = 100 mg·L−1, T = 25 °C, tads = 24 h, and N = 160 rpm. They were parted into two main groups: (i) desorption pH-effect experiments, and (ii) reuse cycles with successive adsorption-desorption experiments. When the adsorption process was finished, the adsorbents (fibers) were separated from the supernatant using filtration membranes. Then, the separated fibers were placed in six conical flasks with pH-adjusted values (2, 4, 6, 8, 10, and 12), and filled with deionized water as an eluant. The flasks were then placed into the temperature-controlled shaking water bath using the fixed conditions (T = 25 °C and N = 160 rpm). The agitation lasted for 24 h. Τhe quantitative evaluation of desorption was performed afterwards using desorption percentages, simply by calculating the difference between the amount of dye loaded on fibers after adsorption and the amount of dye found in the solution after desorption. To examine the reuse ability of adsorbents, the above procedure was repeated 10 times using the exact same conditions (first adsorption and then desorption), keeping the optimum eluant pH value (2).

3. Results and Discussion

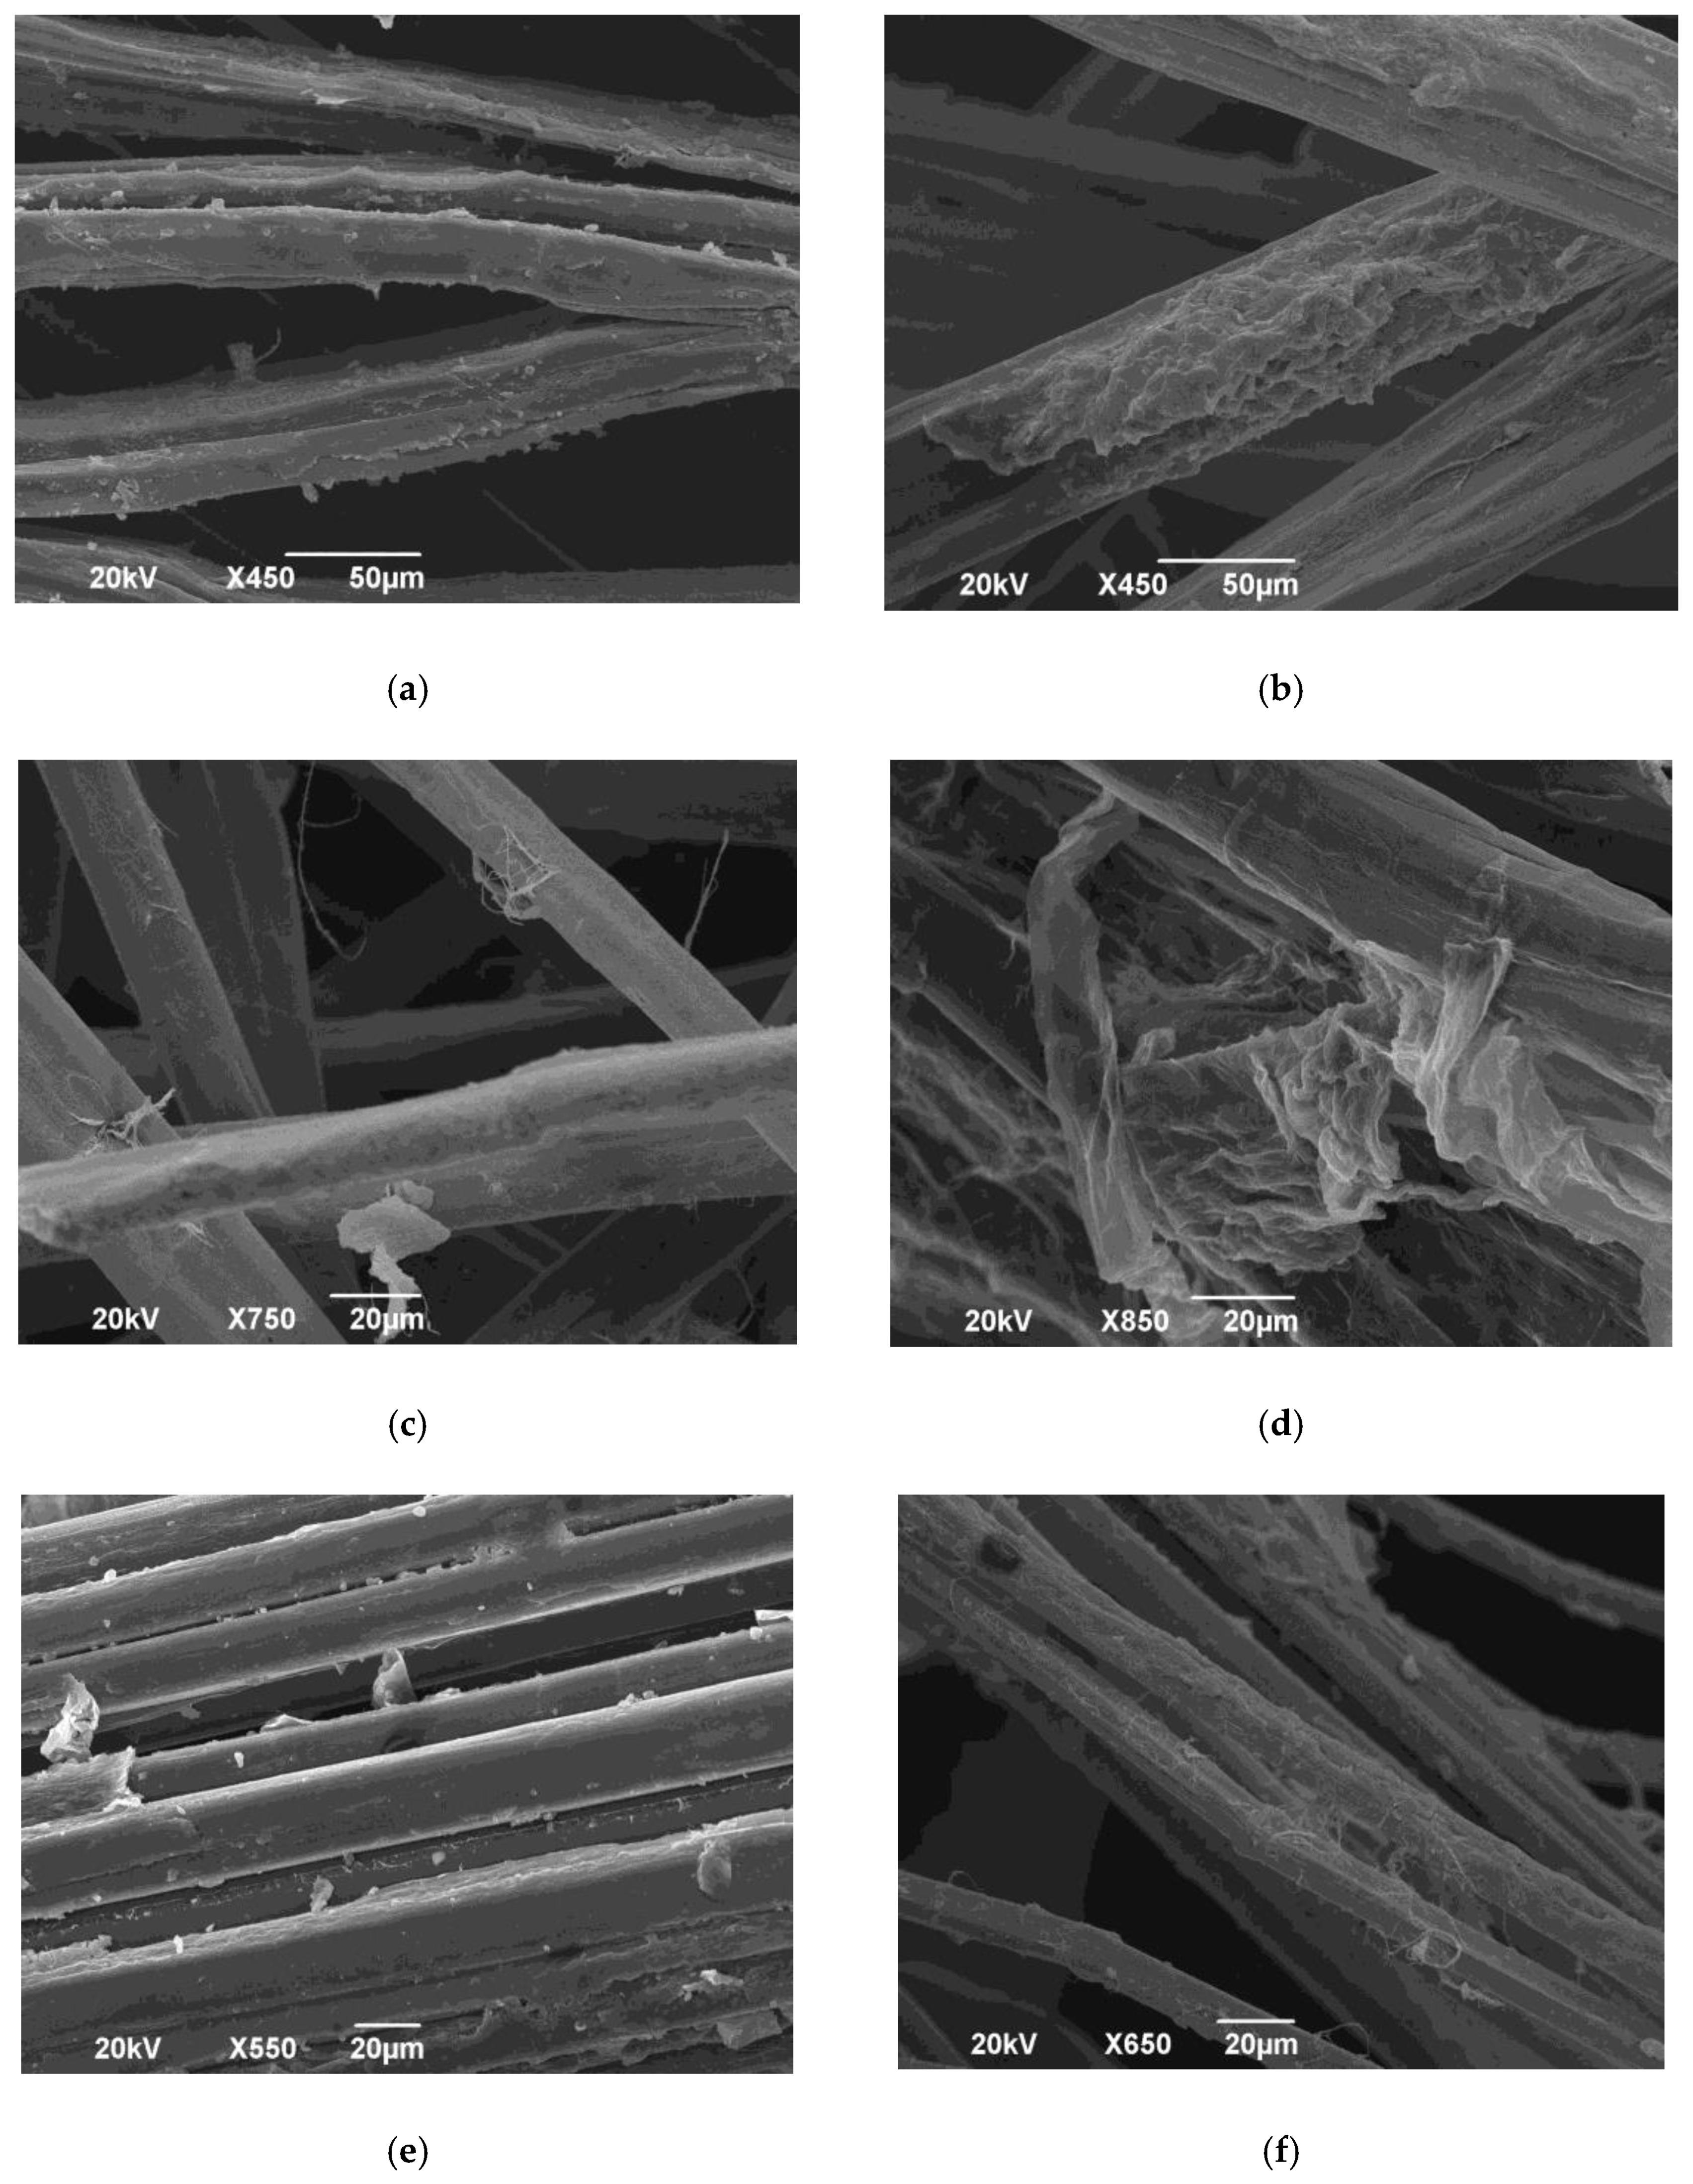
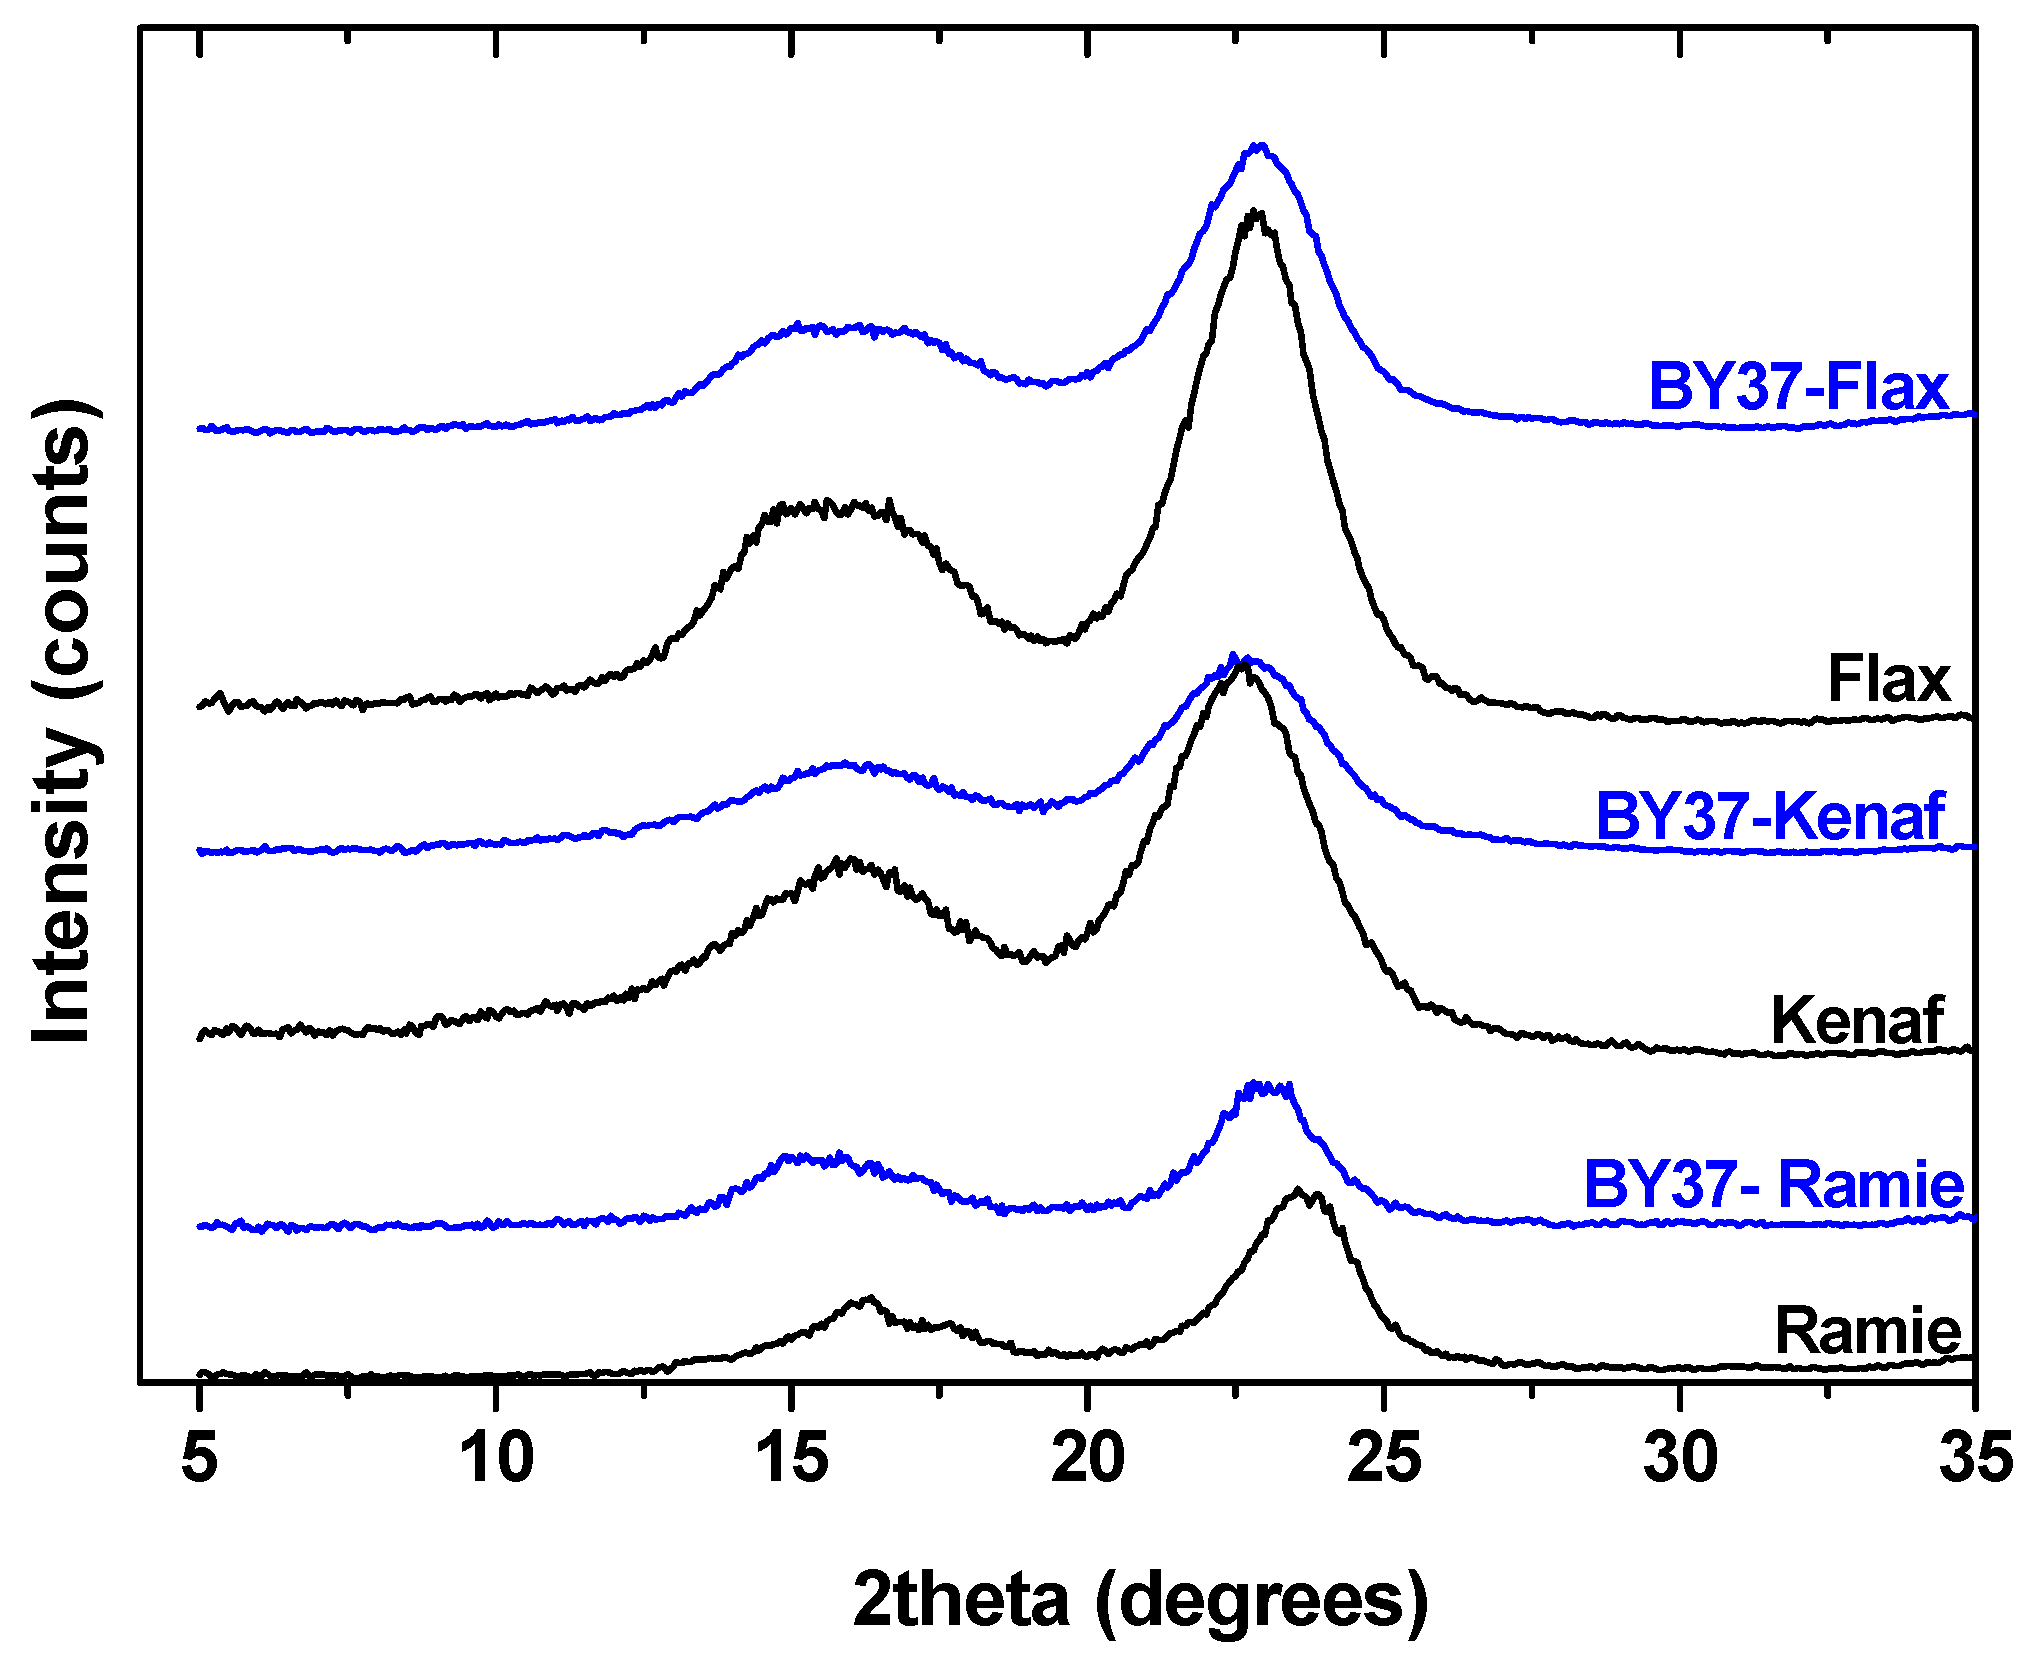
3.1. SEM, XRD, and Crystallinity

Figure 1 shows the surface morphology of neat and dye-loaded fibers. In the case of kenaf, some small particles, which probably correspond to the dye molecules, were observed on the surface of the fiber after adsorption. For ramie fibers, it is clear that the dye adsorption did not affect the morphology, but small dye particles were also seen here. In accordance, ramie fibers before the adsorption were covered by non-cellulose compounds like waxes or fats [49], while after the dye adsorption, some bigger particles existed.
Figure 2 shows XRD diffractograms of flax, ramie, and kenaf fibers. All patterns exhibited the same intense peak at 2θ = 22° (I200). This peak was attributed to the crystalline region of the fiber. On the other hand, the valley at 2θ = 18° corresponded to the non-crystalline area of the fiber. After BY37 adsorption, the crystalline peak was broadened and its intensity was reduced [50].
Crystallinity index (CI) and percentage crystallinity (Xc) were estimated using the XRD peak height method, a useful comparative analysis of crystallinity variations before and after dye adsorption were made [43]. Table 1 presents the calculated CI and Xc. In all fibers, the values of Xc were decreased after dye adsorption at a rate of approximately 2%. These values can give an insight into the relation between the adsorption capacity and the crystallinity. Further comments on that can be found in Section 3.3.
Figure 3 presents photos of the fibers before and after the adsorption experiment. It is clear that despite the same nature of the fibers (natural bast textile), the shape of them was different. Kenaf and flax fibers were slimmer in shape than ramie fibers.

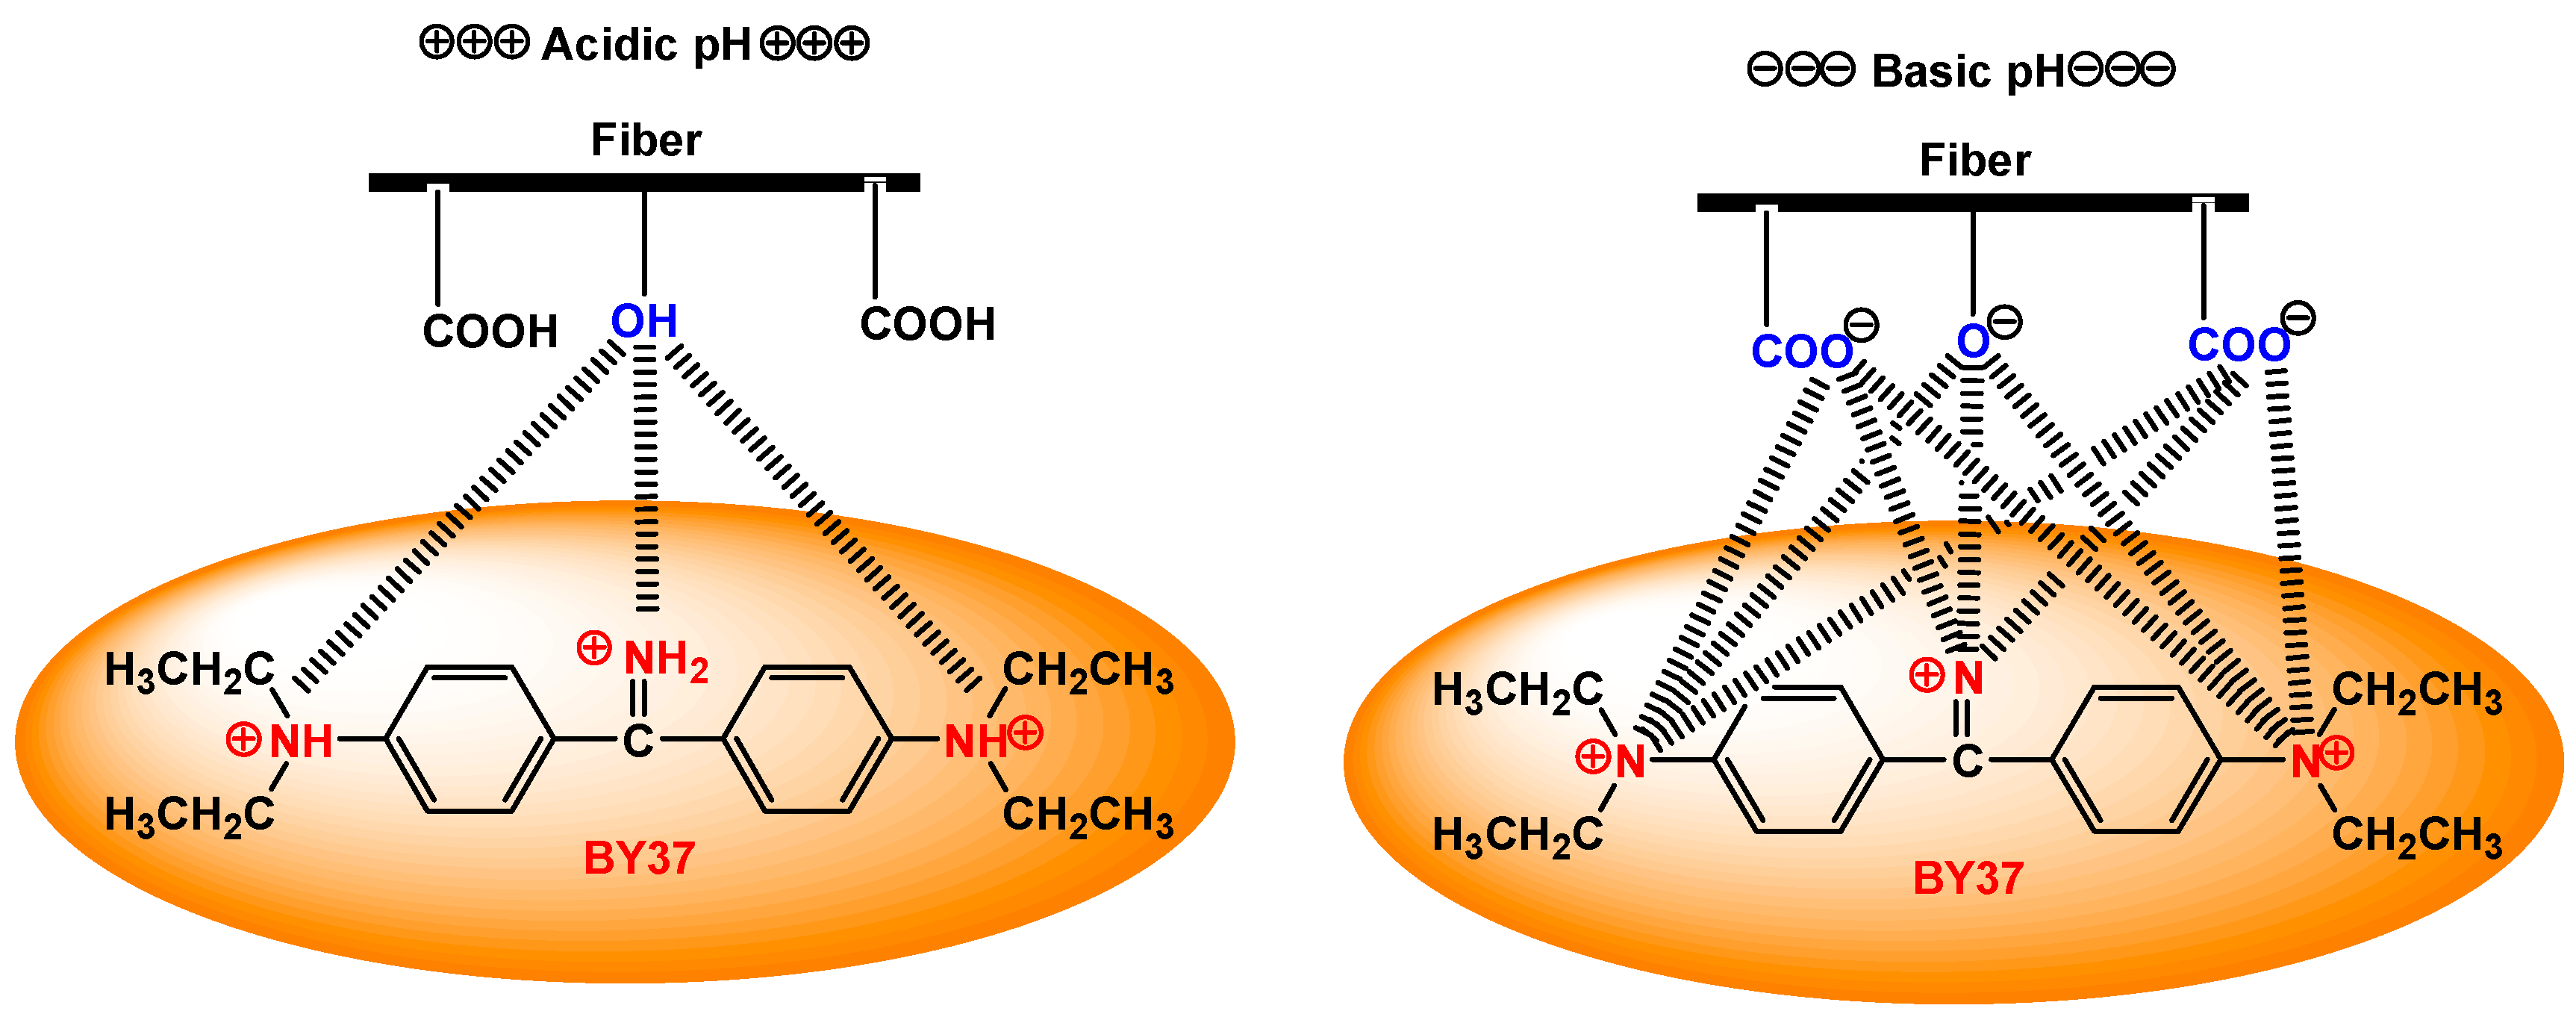
3.2. Effect of pH: Adsorption Mechanism

The key parameter in each adsorption process is the solution pH. The nature of the adsorption medium was very important with regard to investigating the adsorption mechanism. For this reason, many adsorbents alter their behaviour (either increase or decrease) according to the alteration of pH conditions. Preliminary tests were performed to estimate the optimum adsorption pH value for BY37 removal (Figure 4). Based on the pH effect results, some interesting remarks about possible interactions between the dye molecule and fibers could be made. At first glance, it was clear that the pH behaviour of all fibers was similar. Only some quantitative differences were observed. This was expected since the substrate for all fibers was the same (cellulose, lignin, hemicelluloses, etc.).
The removal of BY37 dye at pH 2 was low (15%, 12%, and 10% for ramie, flax, and kenaf fibers, respectively). By increasing the solution pH to 4, 6, and 8, the dye uptake was also raised for all fibers (ramie: 24%, 40%, and 66%, respectively; flax: 29%, 65%, and 70%, respectively; kenaf: 18%, 22%, and 59%, respectively). The higher dye uptake was observed at pH 12 (91%, 88%, and 78% for ramie, flax, and kenaf fibers, respectively). The interesting finding here is that the big increase was observed between pH 6 and 8. At this pH value, it was clear that some change in the nature of the process was taking place. An additional interesting finding was the slight adsorption superiority of ramie over flax, but a clear difference between these two dyes compared to kenaf was also found (3% difference between ramie and flax, while 10% between ramie and kenaf fiber). The different amount of cellulose in each fiber could be a reasonable explanation for this difference.
It is true that the industrial dyeing effluents (especially those of basic/cationic dyes) present extreme physicochemical parameters (pH, salinity, auxiliaries, etc.). This can be attributed to the mixing of numerous reagents for successful textile dyeing. The dyeing process of textiles involves unit operations such as (i) desizing, (ii) scouring, (iii) bleaching, (iv) dyeing, and (v) finishing. Therefore, the waste streams from each individual sub-operation are collected to an “equalization tank,” where they are mixed and homogenized. In particular, the wastewater produced by the dyeing bath reactor contains hydrolyzed dyes, dyeing auxiliaries, electrolytes (≈60–100 g·L−1 of NaCl and Na2CO3). The latter are responsible for the high saline content of the wastewater, which exhibits high pH values (10–12) [51]. This means that the pH environment is already alkaline (as found with the optimum pH adsorption value of this present study). Therefore, in the case of basic dye effluents, one can suggest omitting the stage of pH equalization, but this is not sure.
In an attempt to explain the above pH behaviour, it was necessary to speculate about some possible interactions that may have occurred at these studied pH values. At strong acidic conditions, the amino groups (nitrogen) of the dye molecule is protonated (NH+). Therefore, bonds (relatively weak) between the hydroxyl groups of the fiber and the protonated amino groups of BY37 can be formed (Figure 5 and Equation (10)).
BY 37 NH + + Fiber OH strong   acidic   pH weak   attraction Fiber OH NH + BY 37
By increasing the pH value of the solution (to 12), the functional groups of fibers (–COOH, –OH) are deprotonated (–COO, –O). Also, the amino groups of fibers slightly miss the protonated nature (N+) but have a strong electrostatic attraction between BY37 (N+) and the deprotonated groups (Figure 5 and Equation (11)).
BY 37 N + + Fiber O Fiber CO O basic   pH electrostatic   attraction Fiber O Fiber CO O N + BY 37
FTIR spectroscopy can help confirm this above proposed interaction hypothesis by comparing the respective spectra before and after adsorption (Figure 6a–c).
As shown in Figure 6, all fibers had characteristic peaks like a broad peak in the area of 3450–3464 cm−1, which corresponds to the O–H stretching frequency, whereas the peaks at 2898 cm−1 and 2899 cm−1 were attributed to the C–H stretching. The absorbance at about 1380–1320 cm−1 (for all fibers) arose mainly from the bending vibration of C–H and C–O groups of polysaccharides. Another peak at 1735–1730 cm−1 corresponds to the C=O stretching of the acetyl group in lignin and/or hemicellulose [52,53]. In the dye adsorbed fibers, the hydroxyl peak was shifted to 3427–3420 cm−1, indicating that some hydrogen-bonding evolution was taking place between the fiber’s reactive groups (–OH groups) and the dye. Moreover, another difference could be found in the area of carbonyl groups, where their absorbance was also shifted to 2718–2711 cm−1. This was also an indication that the ester groups could participate to interactions with the –NH groups of the dye. However, these peaks were detected very weakly in the alkaline-treated fibers, which could be attributed to the partial removal of the lignin [54]. Therefore, in this case, more –OH groups of fibers were available to interact with the –NH of dye and to increase its absorbance on fibers.

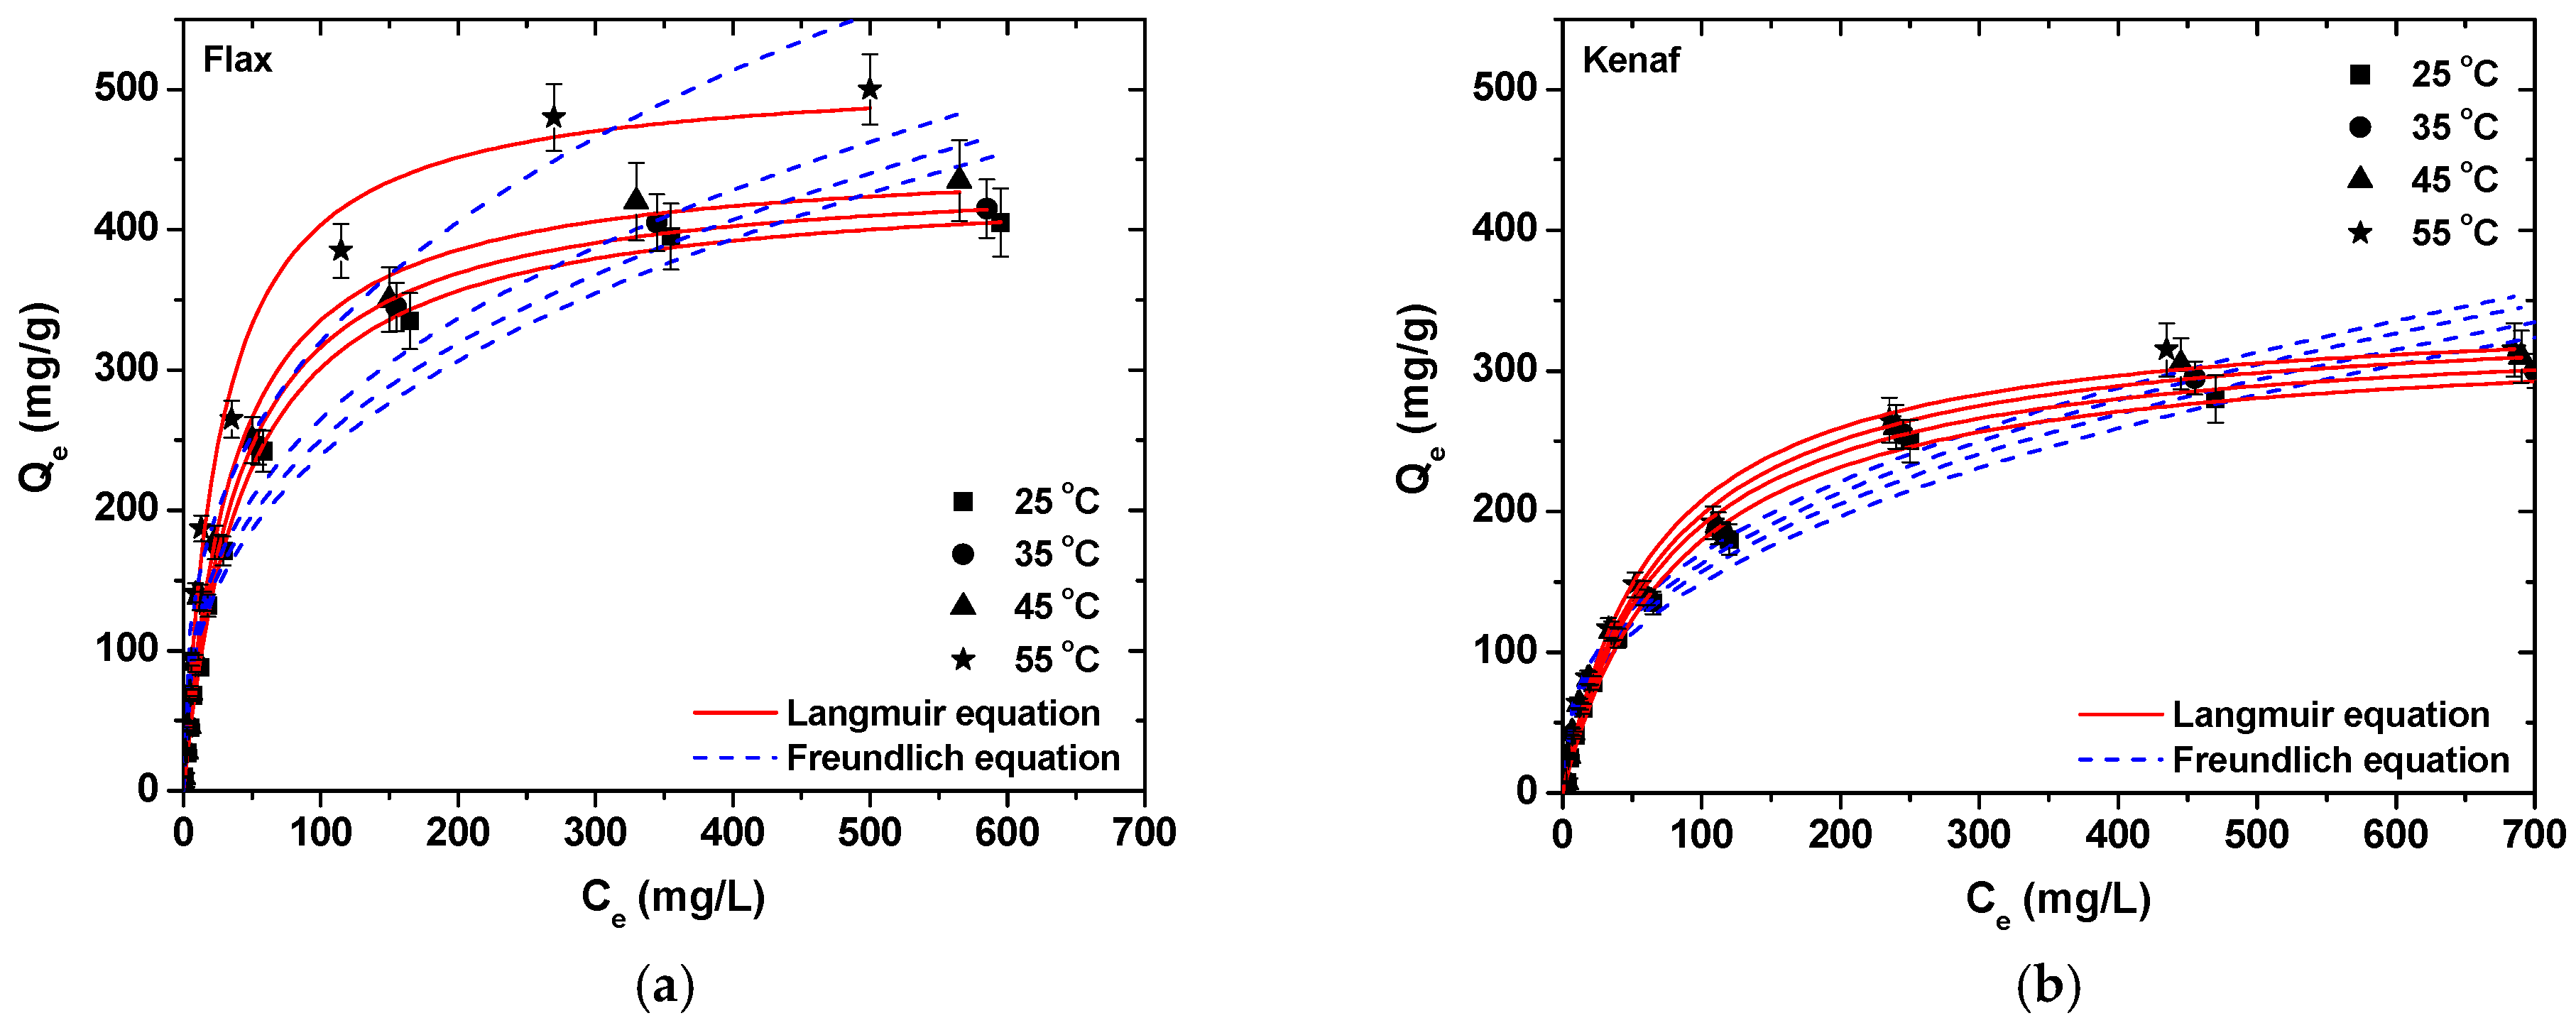
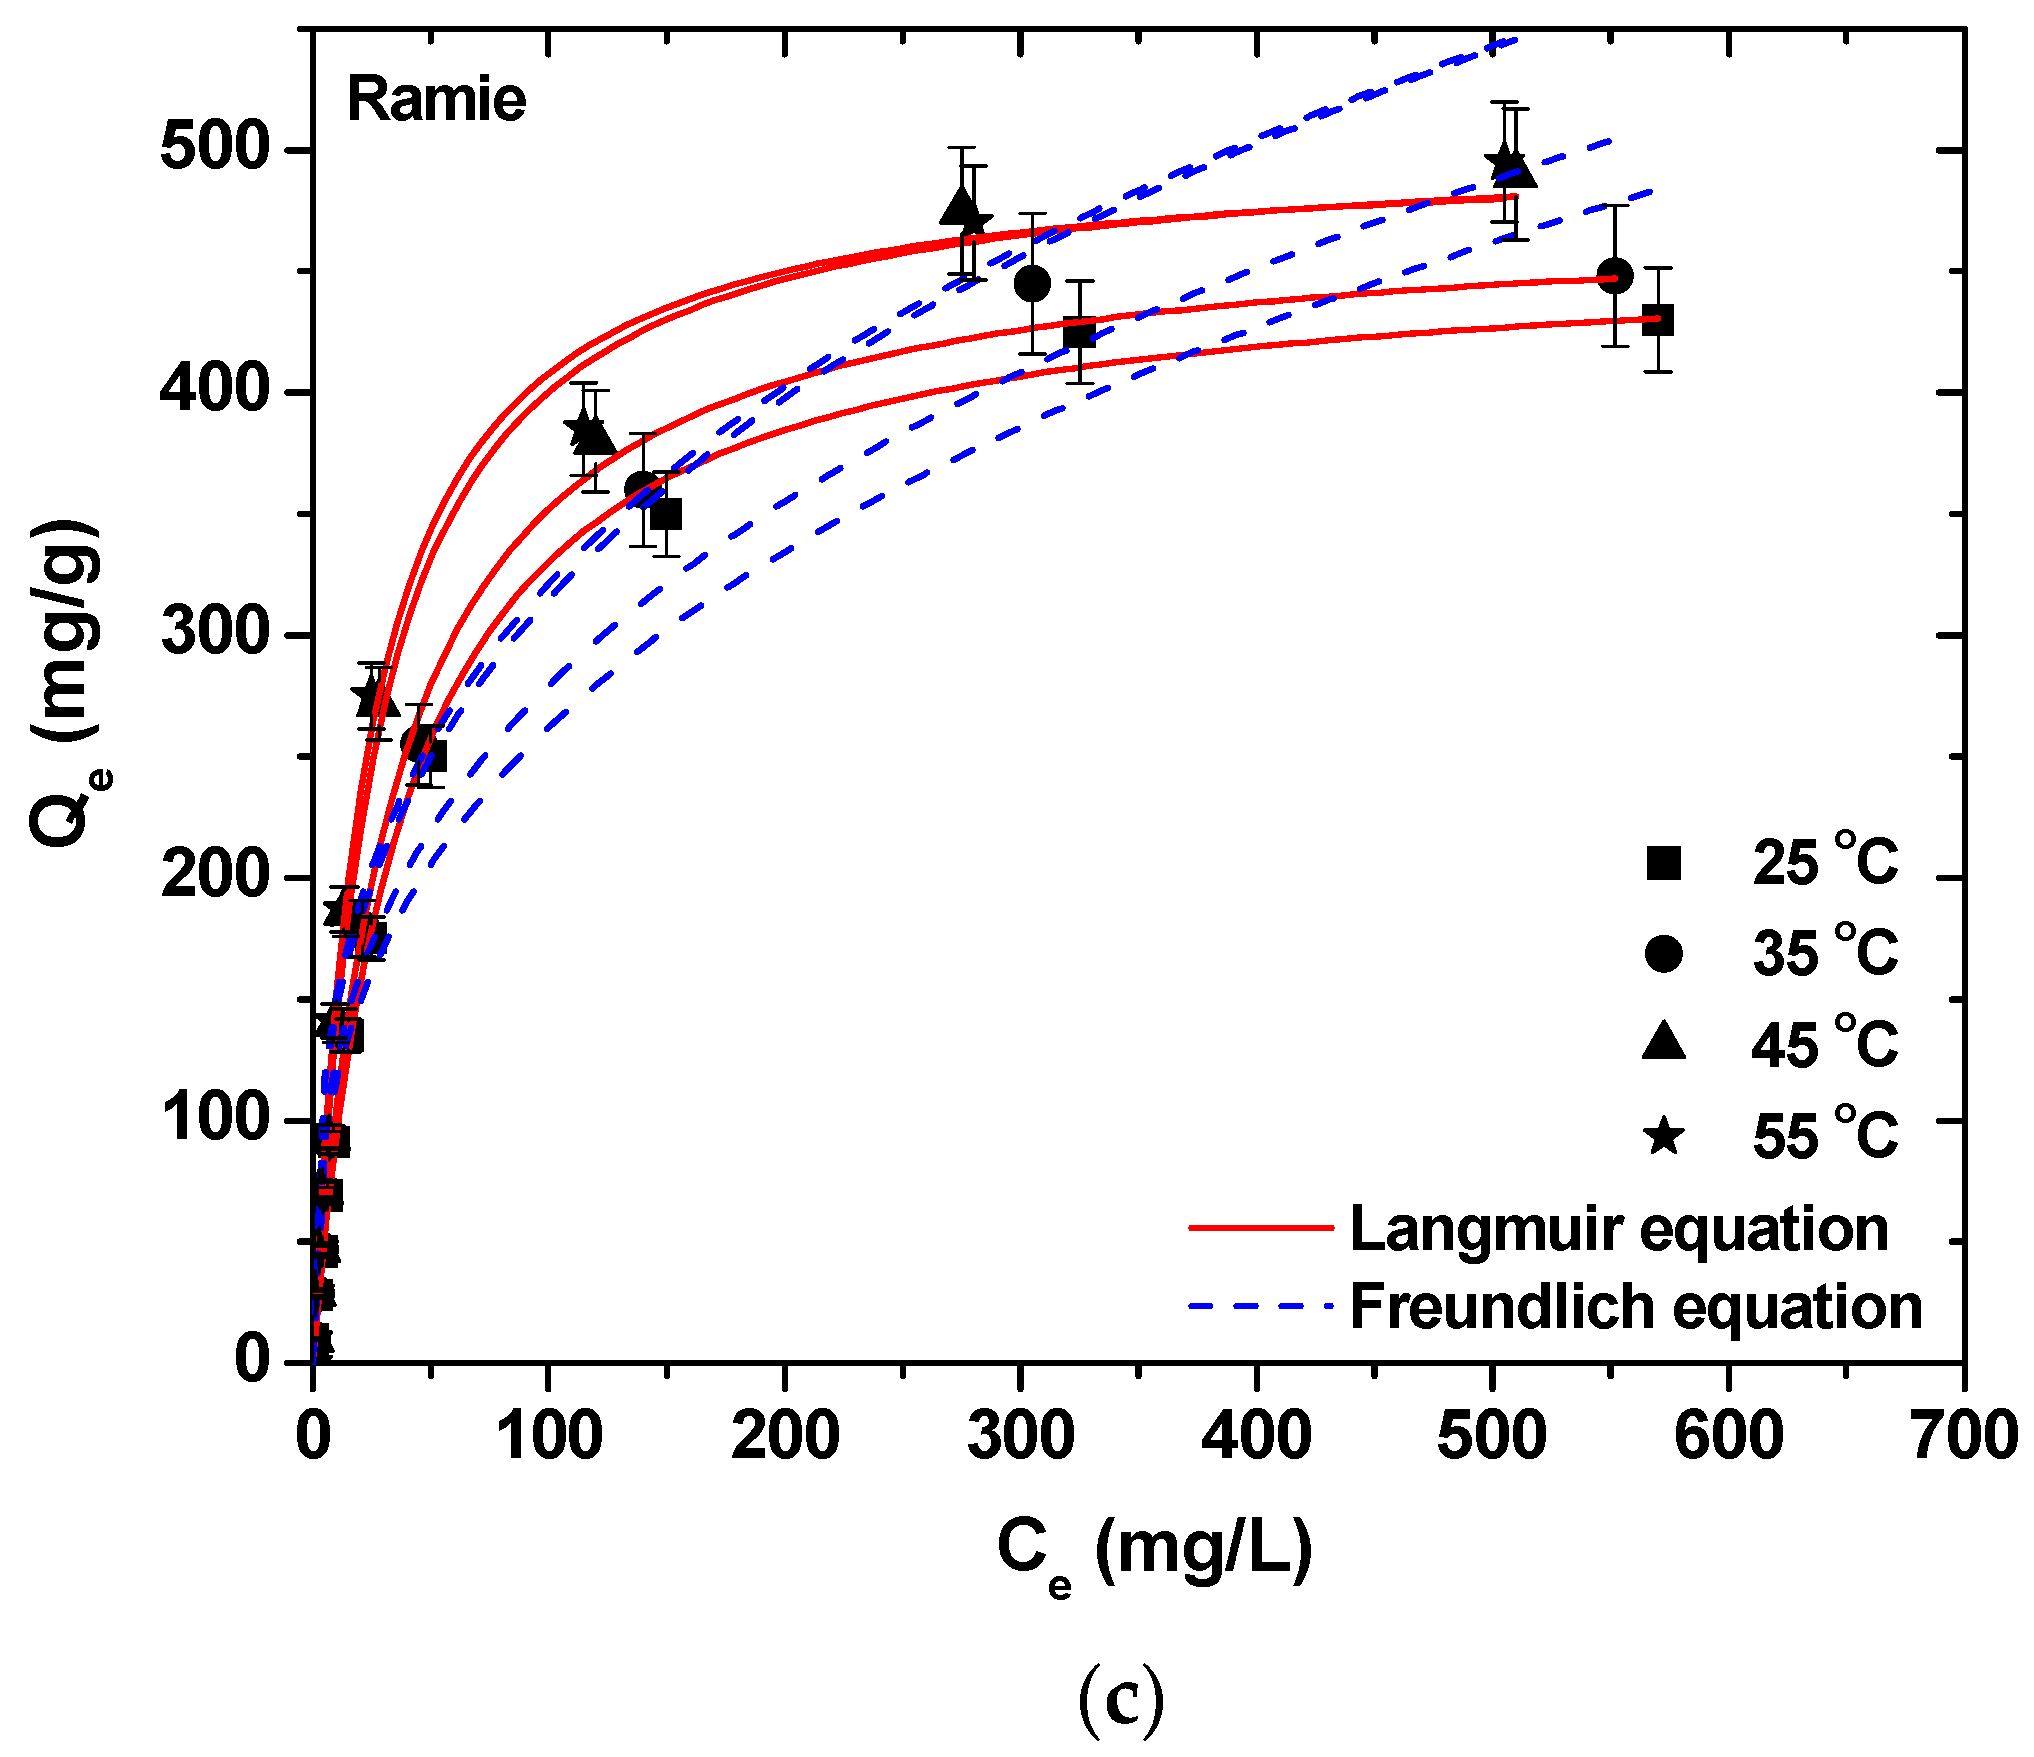
3.3. Isotherms and Thermodynamics

It has been noticed that for all fibers studied, the initial dye concentration, using a constant dosage of adsorbent (1 g·L−1), had an effect on the equilibrium dye uptake. In the case of low initial concentrations, a very intense dye adsorption was observed, which reached the equilibrium rapidly (Figure 7). This fact suggests the possible formation of a monolayer of dye molecules at the outer interface of the absorbent. Additionally, when suggesting low initial dye concentrations (0–50 mg·L−1), the ratio of the initial number of dye molecules to the available adsorption sites was low. Consequently, the fractional adsorption became independent of the initial concentration [55]. Brunauer et al. [56] categorized the isotherms of adsorption into five types. Type I isotherms represented monomolecular adsorption and were related to non-porous, microporous, or adsorbents with small pore sizes (not much larger than the molecular diameter of the adsorbate). Therefore, according to the BET (Brunauer-Emmett-Teller (BET)) classification [56], the form of these curves (Figure 7) implied that the isotherms for all fibers-BY37 systems belonged to Type I, and they were characterized by a high rate of adsorption at low concentrations. At higher concentrations, the adsorption sites were limited, and subsequently, the process was dependent on the initial dye concentration.
Figure 7 clearly demonstrates the difference in fitting models (Langmuir and Freundlich), which can be also be observed in Table 2. The results gave a better fitting to the Langmuir equation (RL2 = 0.989–0.998) rather than the Freundlich (RF2 = 0.945–0.964) equation. The maximum adsorption capacities of fibers were calculated accordingly and were found to be 327, 435, and 460 mg·g−1 (25 °C) for kenaf, flax, and ramie, respectively. As it was stated above, these variations were due to the percentage of cellulose present in each fiber separately, which hindered or enhanced the possible interactions between the dye molecule and the functional groups of the fibers. A brief comment can also be added here after linking the crystallinity results found in previous section. It can be seen that the adsorption ability of each fiber can be directly linked with the CI (XC,Ramie > XC,Flax > XC,Kenaf), as it can be observed that QRamie > QFlax > QKenaf. This can be attributed to the cellulosic content of each fiber.
Quantitatively, the capacity of flax fibers (435 mg·g−1) to adsorb and therefore remove BY37 was 33% greater than that of kenaf fibers (327 mg·g−1) at 25 °C. A similar observation can be made for ramie fibers (460 mg·g−1), which was 40% greater than that of kenaf (327 mg·g−1). What is most significant, though, is how those capacities changed while increasing the temperature. Each fiber had a different behavior with the increase of temperature. The adsorption capacities of kenaf fibers estimated by the Langmuir model were quite similar; 327, 333, 342, and 346 mg·g−1 for experiments at 25, 35, 45, and 55 °C, respectively. This means that the total change between the two temperature limits (25 and 55 °C) was only 13%. In the case of flax fibers, the calculated adsorption capacities were similar at 25, 35, and 45 °C, namely 435, 443, and 453 mg·g−1, respectively. However, it was very different (this is easily illustrated in Figure 7a) at 55 °C (512). This means that from 25 to 45 °C, the change was only 4%, while from 45 to 55 °C, the change was 13%. In the case of ramie fibers, the adsorption capacities calculated by the Langmuir model were similar for the temperature couples 25 and 35 °C (460 and 475 mg·g−1, respectively), and 45 and 55 °C (506 and 507 mg·g−1, respectively). From all of the above, it can be concluded that despite the same nature of the fibers used (textile bast), the adsorption behavior was not the same, especially with the increase in temperature.
Based on the above adsorption equilibrium data at varying temperatures, the thermodynamic analysis was carried out (Table 3). The positive ΔH0 values revealed an endothermic process. By increasing the dye concentration, these values were decreased. This could be explained by the fact that in an endothermic process, the adsorbates (BY37 molecules in this work) need to displace more than one water molecule in order to be adsorbed. The latter results in the endothermicity of the process, and for that, ΔH0 would be positive. The magnitude of enthalpy could also give a clue about the type of adsorption. Furthermore, it was also found that the values of ΔS0 were positive, which is evidence of the affinity between the adsorbent and the adsorbate. The positive entropy value also indicates an increased randomness at the solid-solution interface, along with some structural changes to both the adsorbent and the adsorbate. The gain in translational entropy by the adsorbed molecules of the solvent that were dislocated by the adsorbate species was greater than the one that was lost by the adsorbate dye molecules, thereby introducing the predominance of randomness in the system. Finally, the positive ΔS0 is linked to a rise in the degree of freedom of the adsorbed [57].

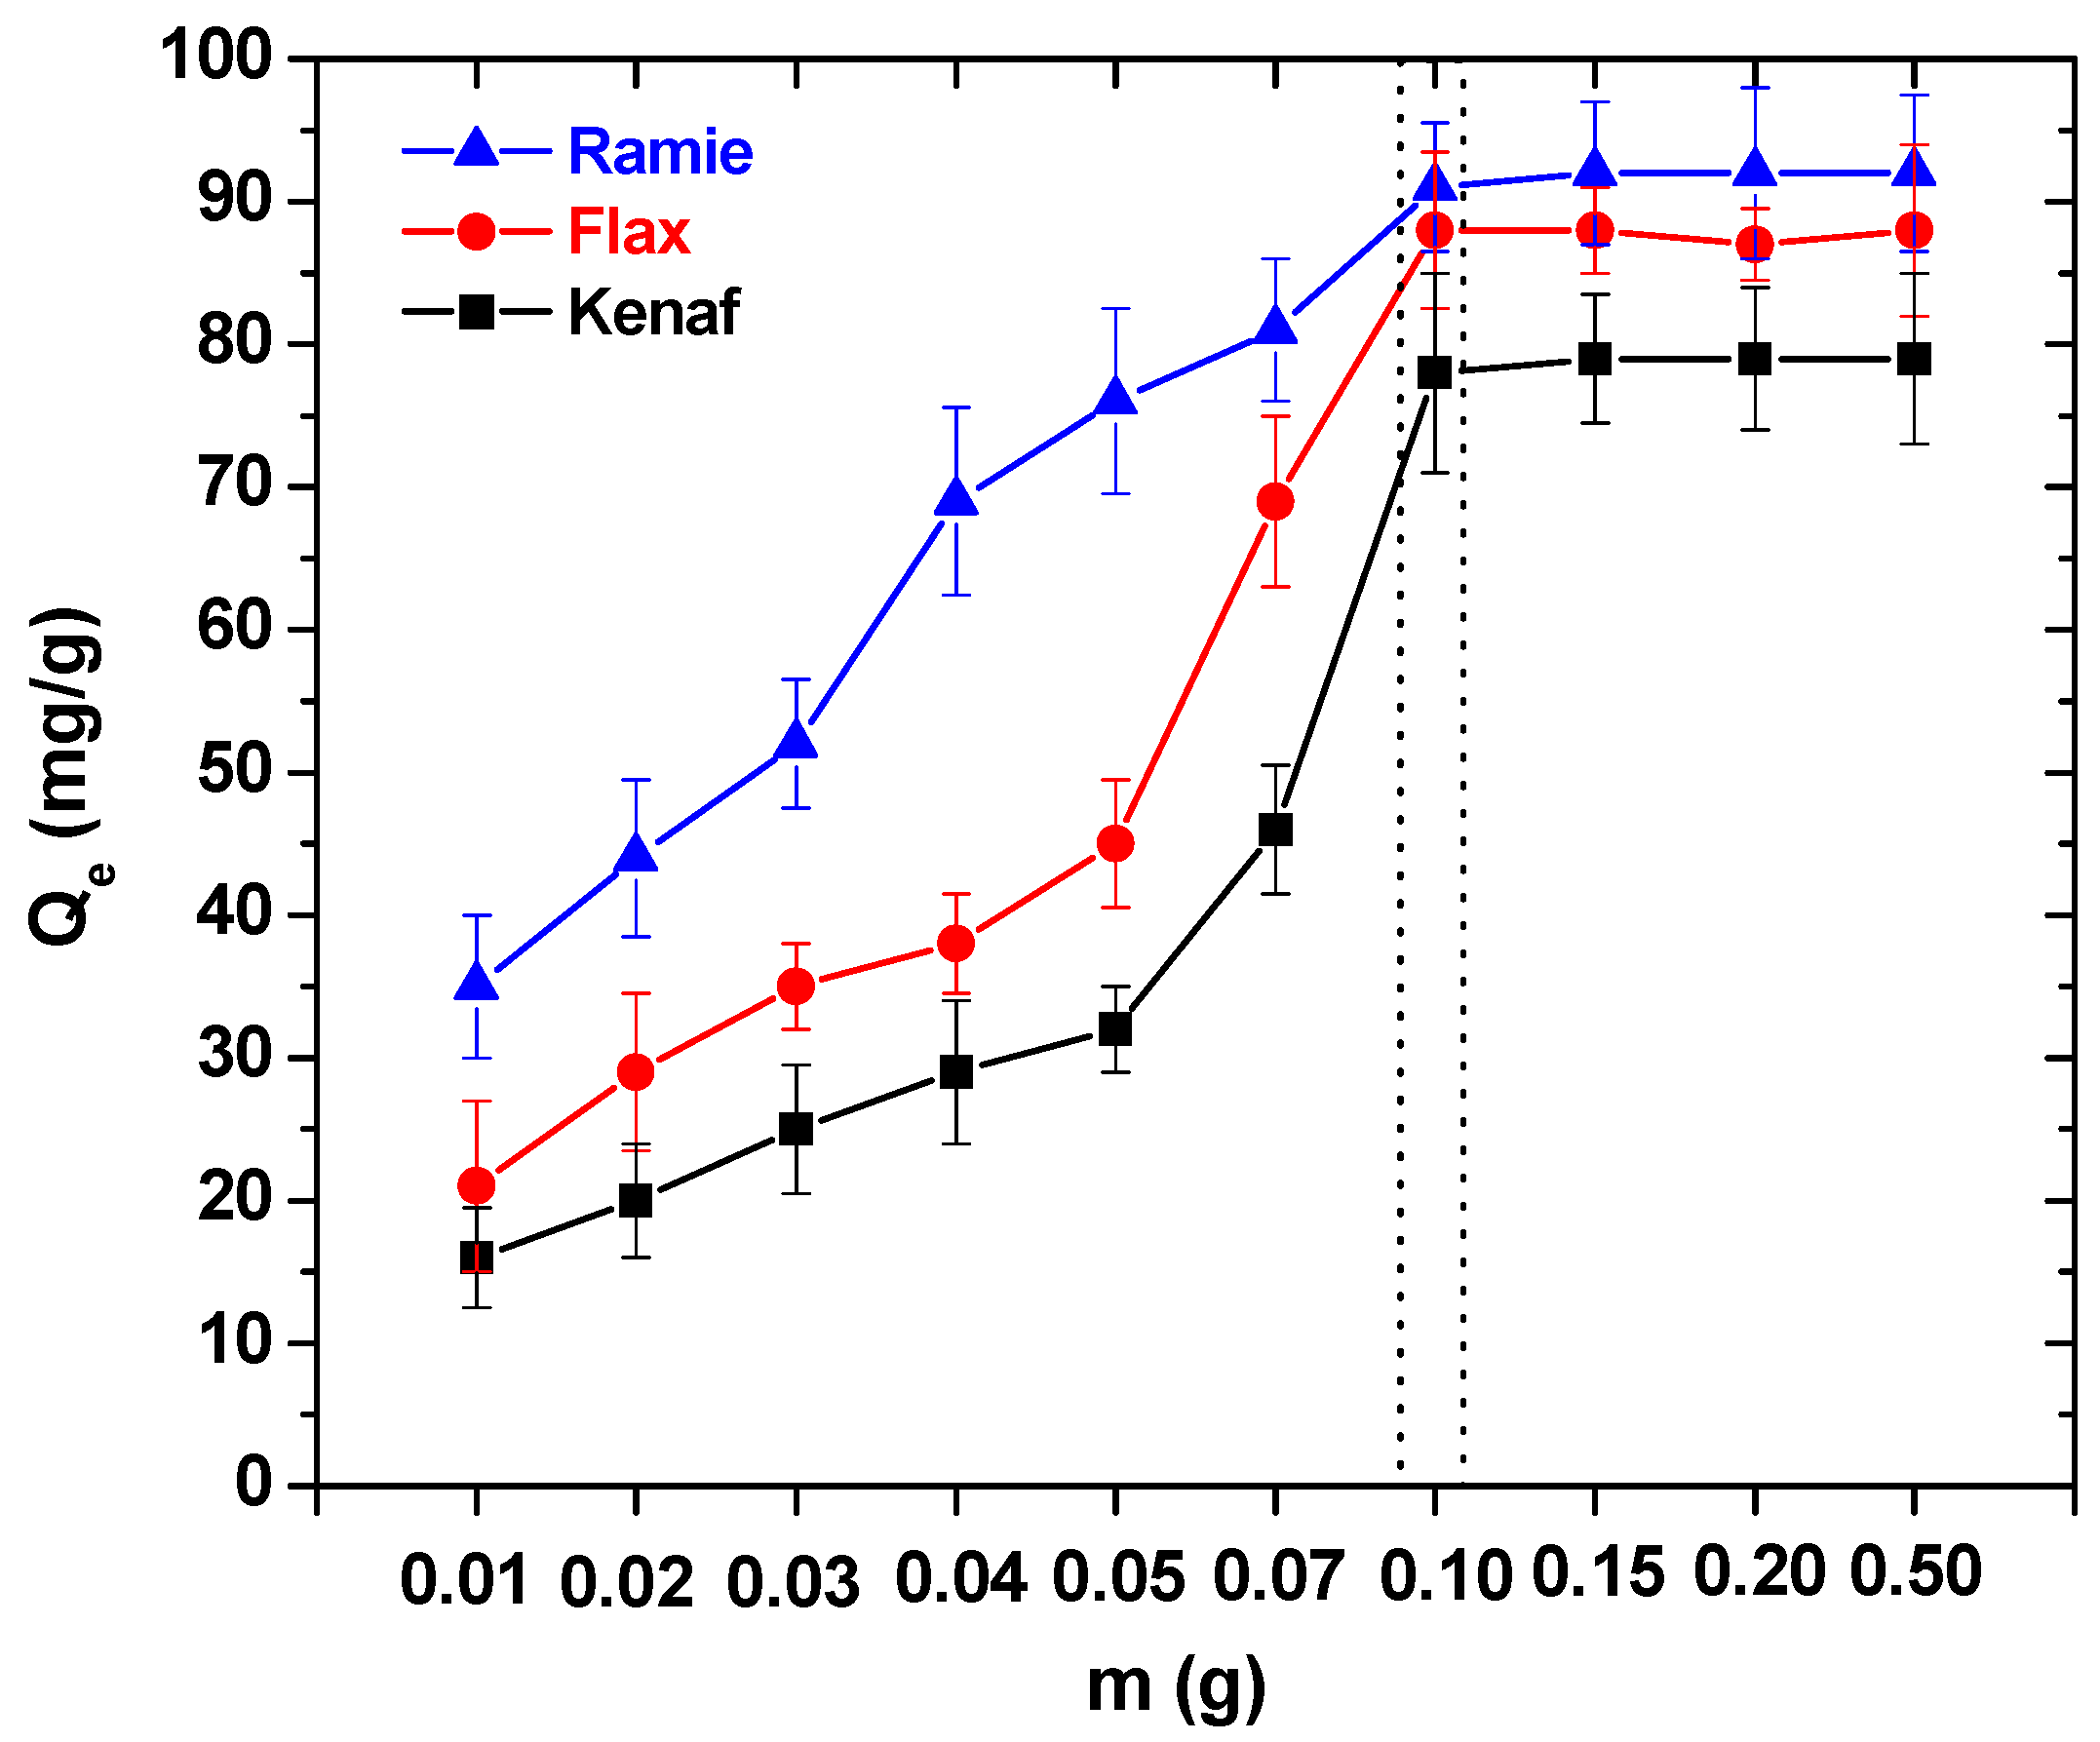
3.4. Effect of Adsorbent’s Dosage

Figure 8 illustrates how the dosage of the adsorbent affected the BY37 removal. The major aim of this experiment series was to investigate if there was any experimental dosage point over which no other increase in adsorption capacity could be observed. According to the results, the trend of the increase of adsorption capacity remained the same. That means that by raising the adsorbent’s dosage, an improvement of BY37 was achieved. However, the critical point was at m = 0.1 g, where the maximum adsorption capacity was observed for all fibers. After that, no any significant improvement was demonstrated. For example, the adsorption equilibrium capacity was the same, even at 0.5 g·L−1. So, it was clear that the most suitable adsorbent’s dosage was 0.1 g per L.

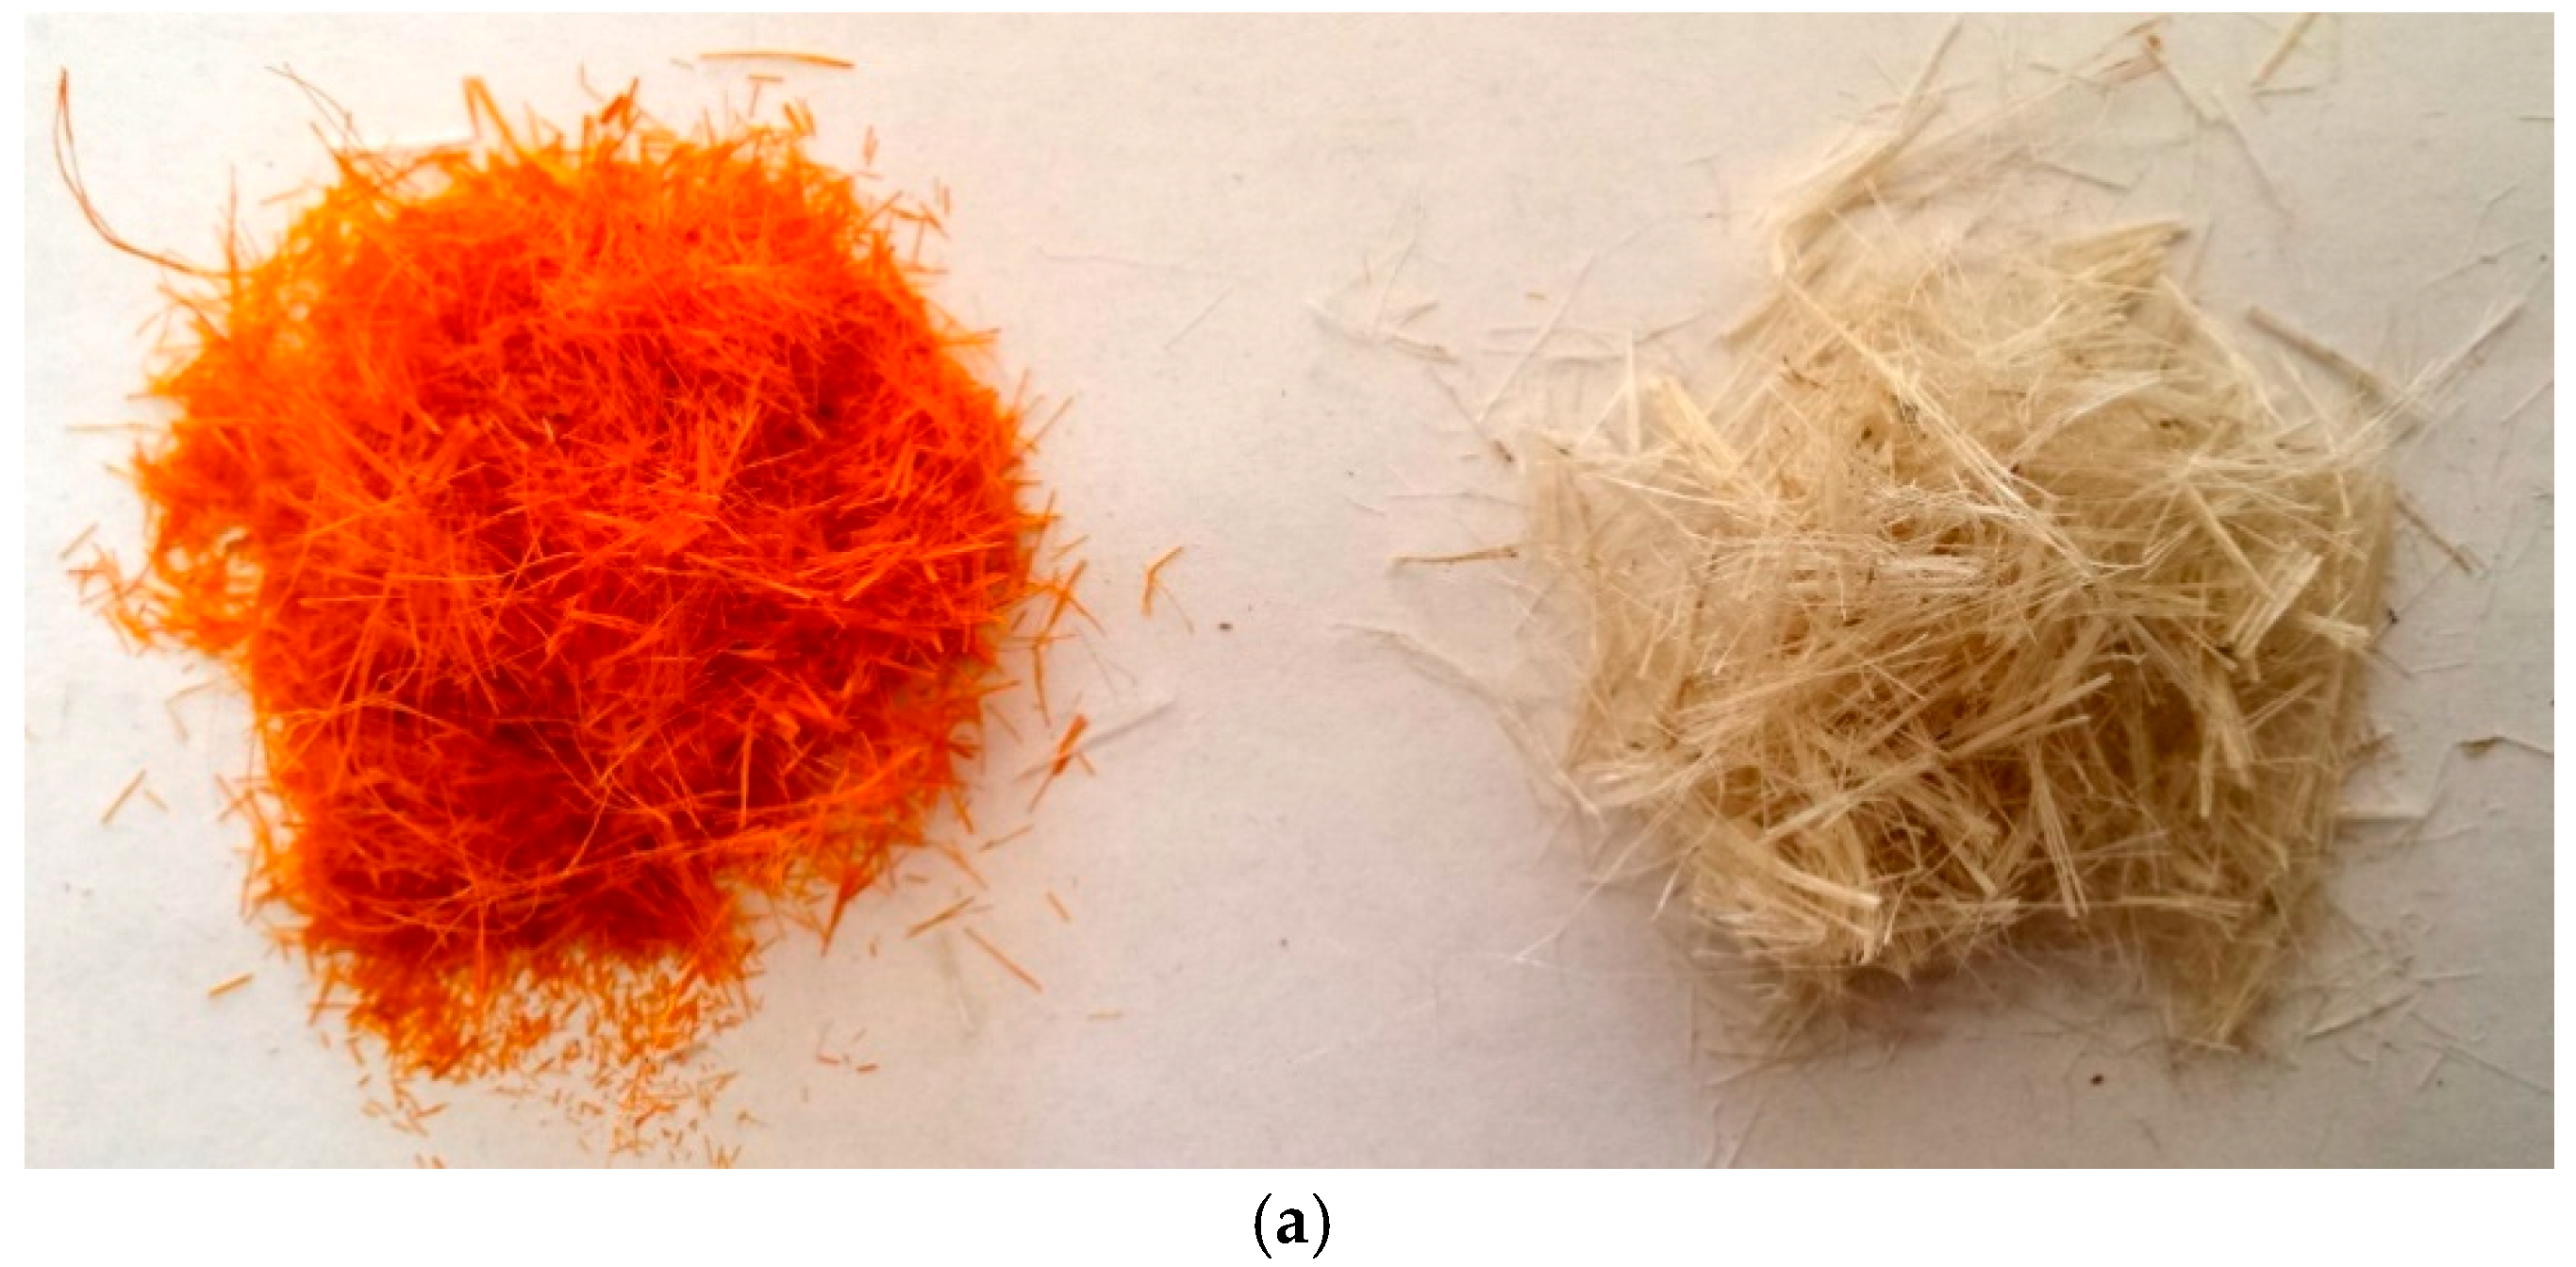
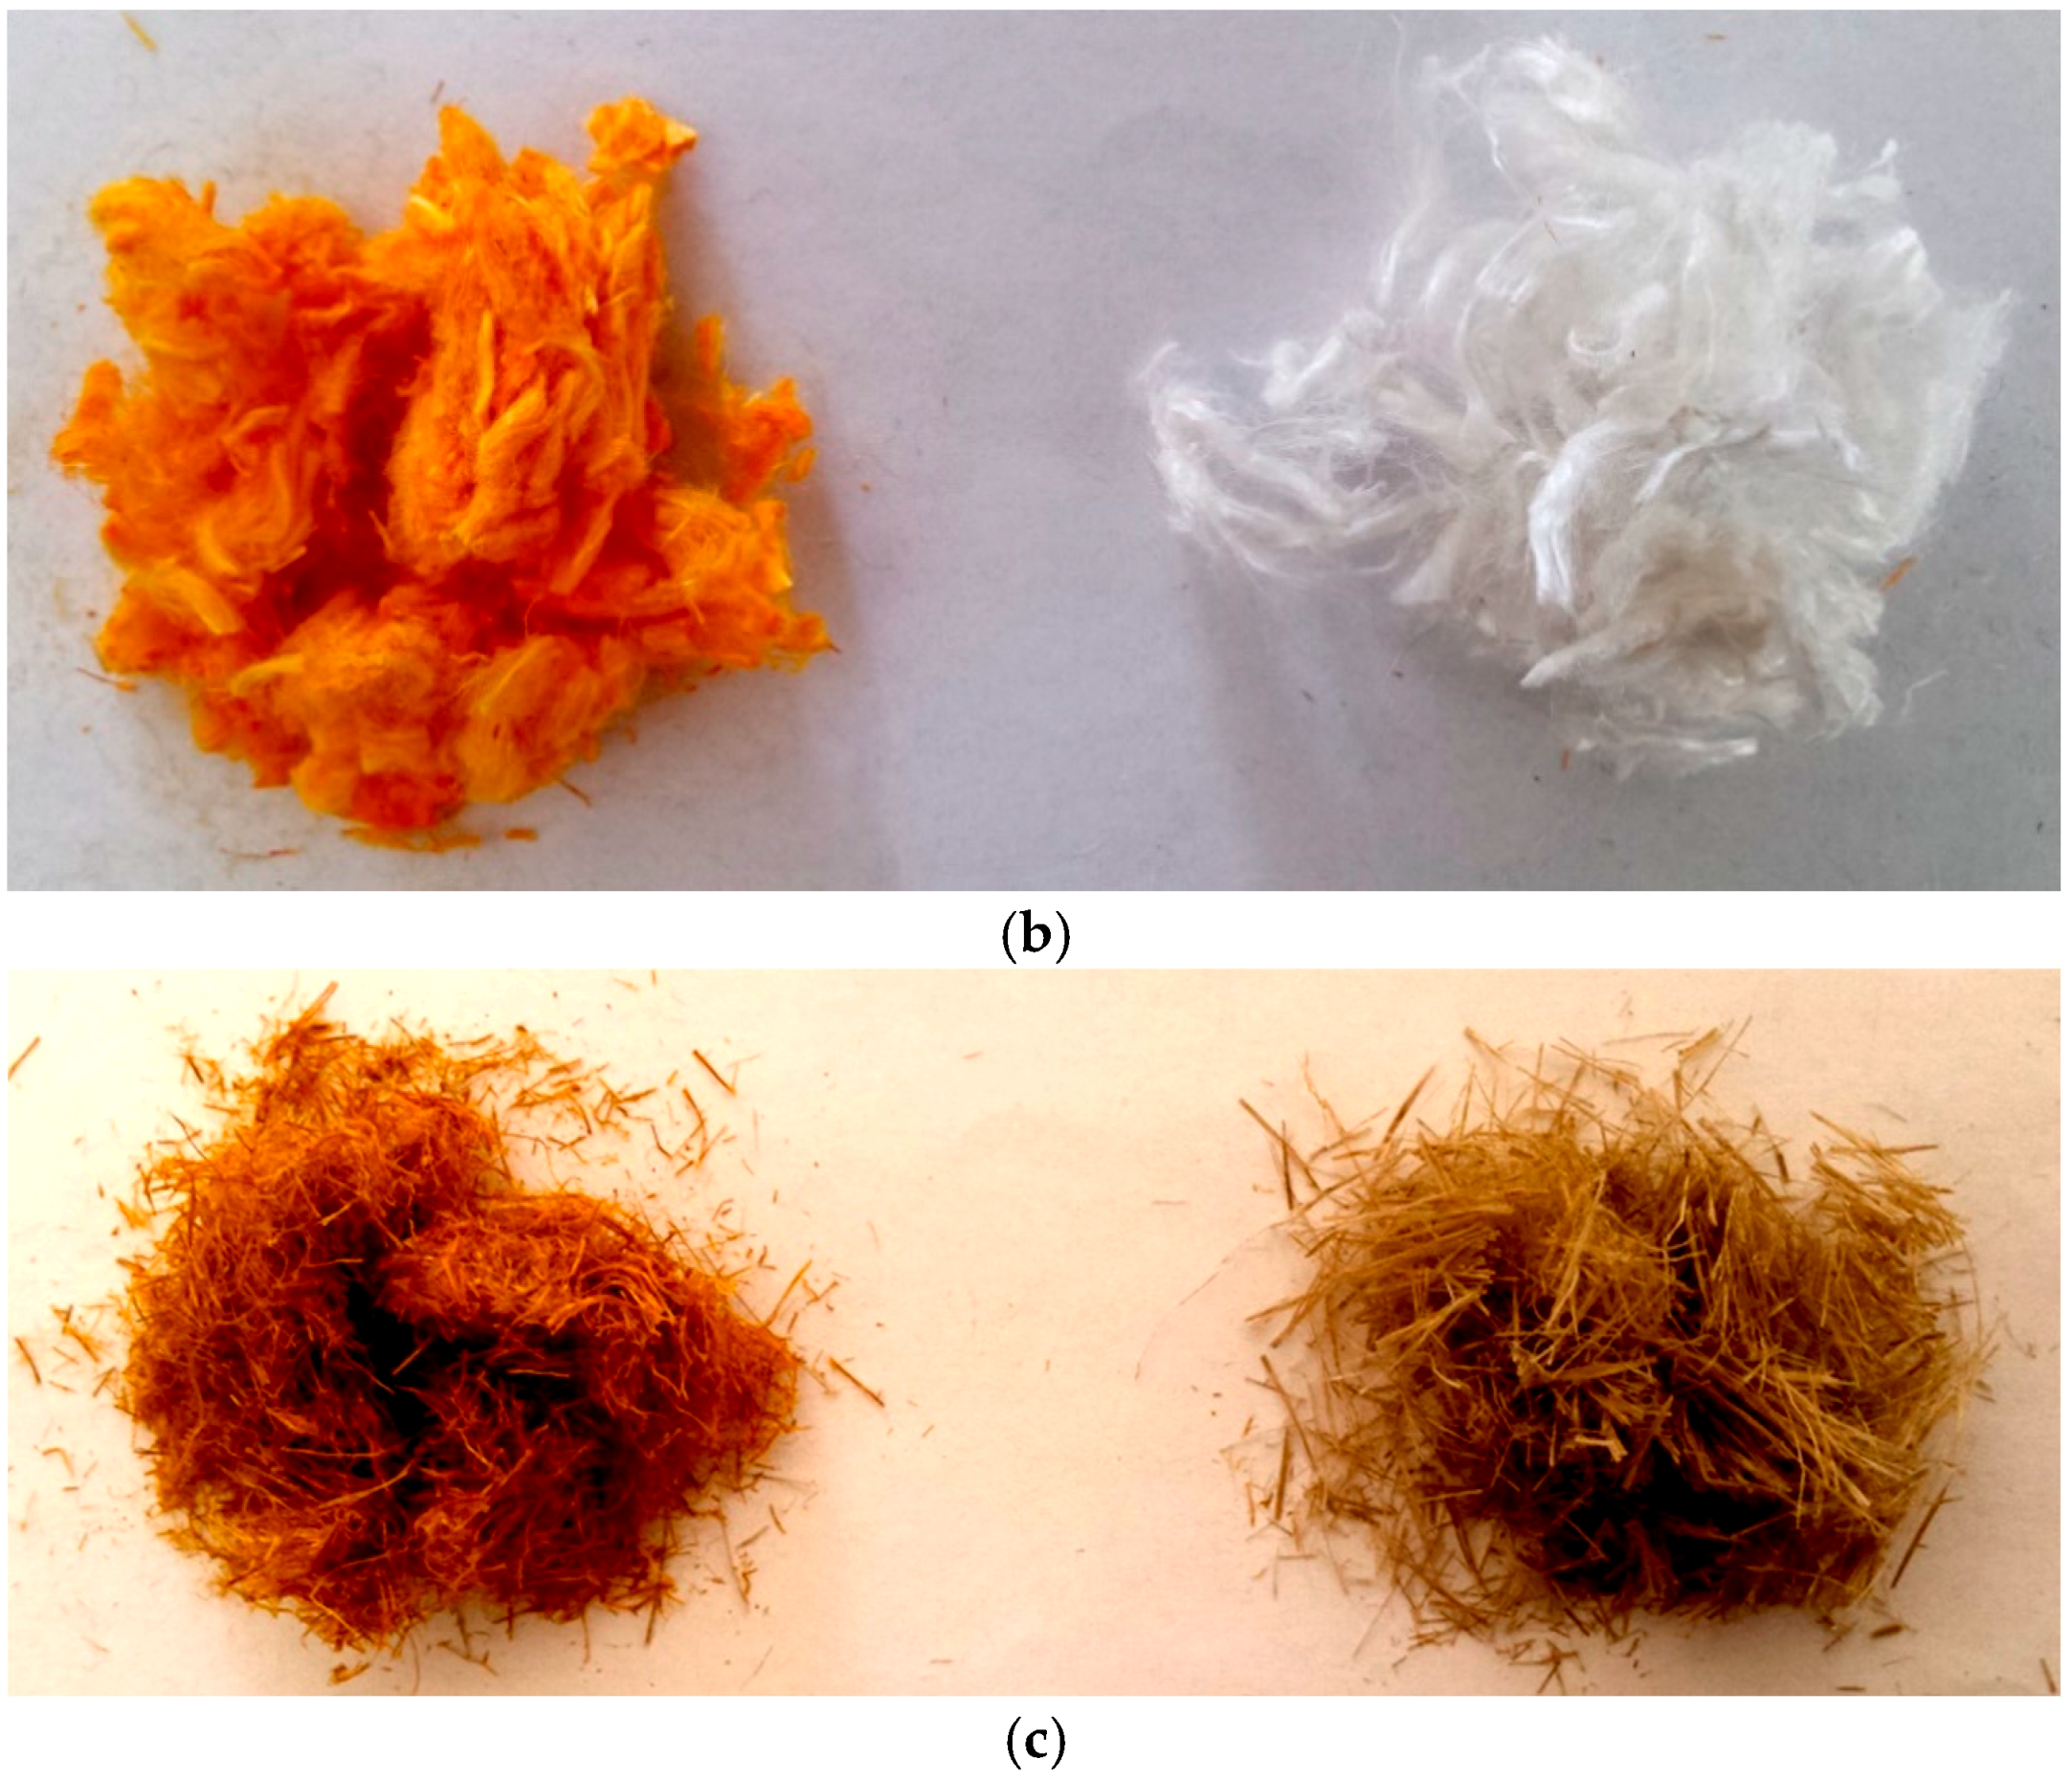
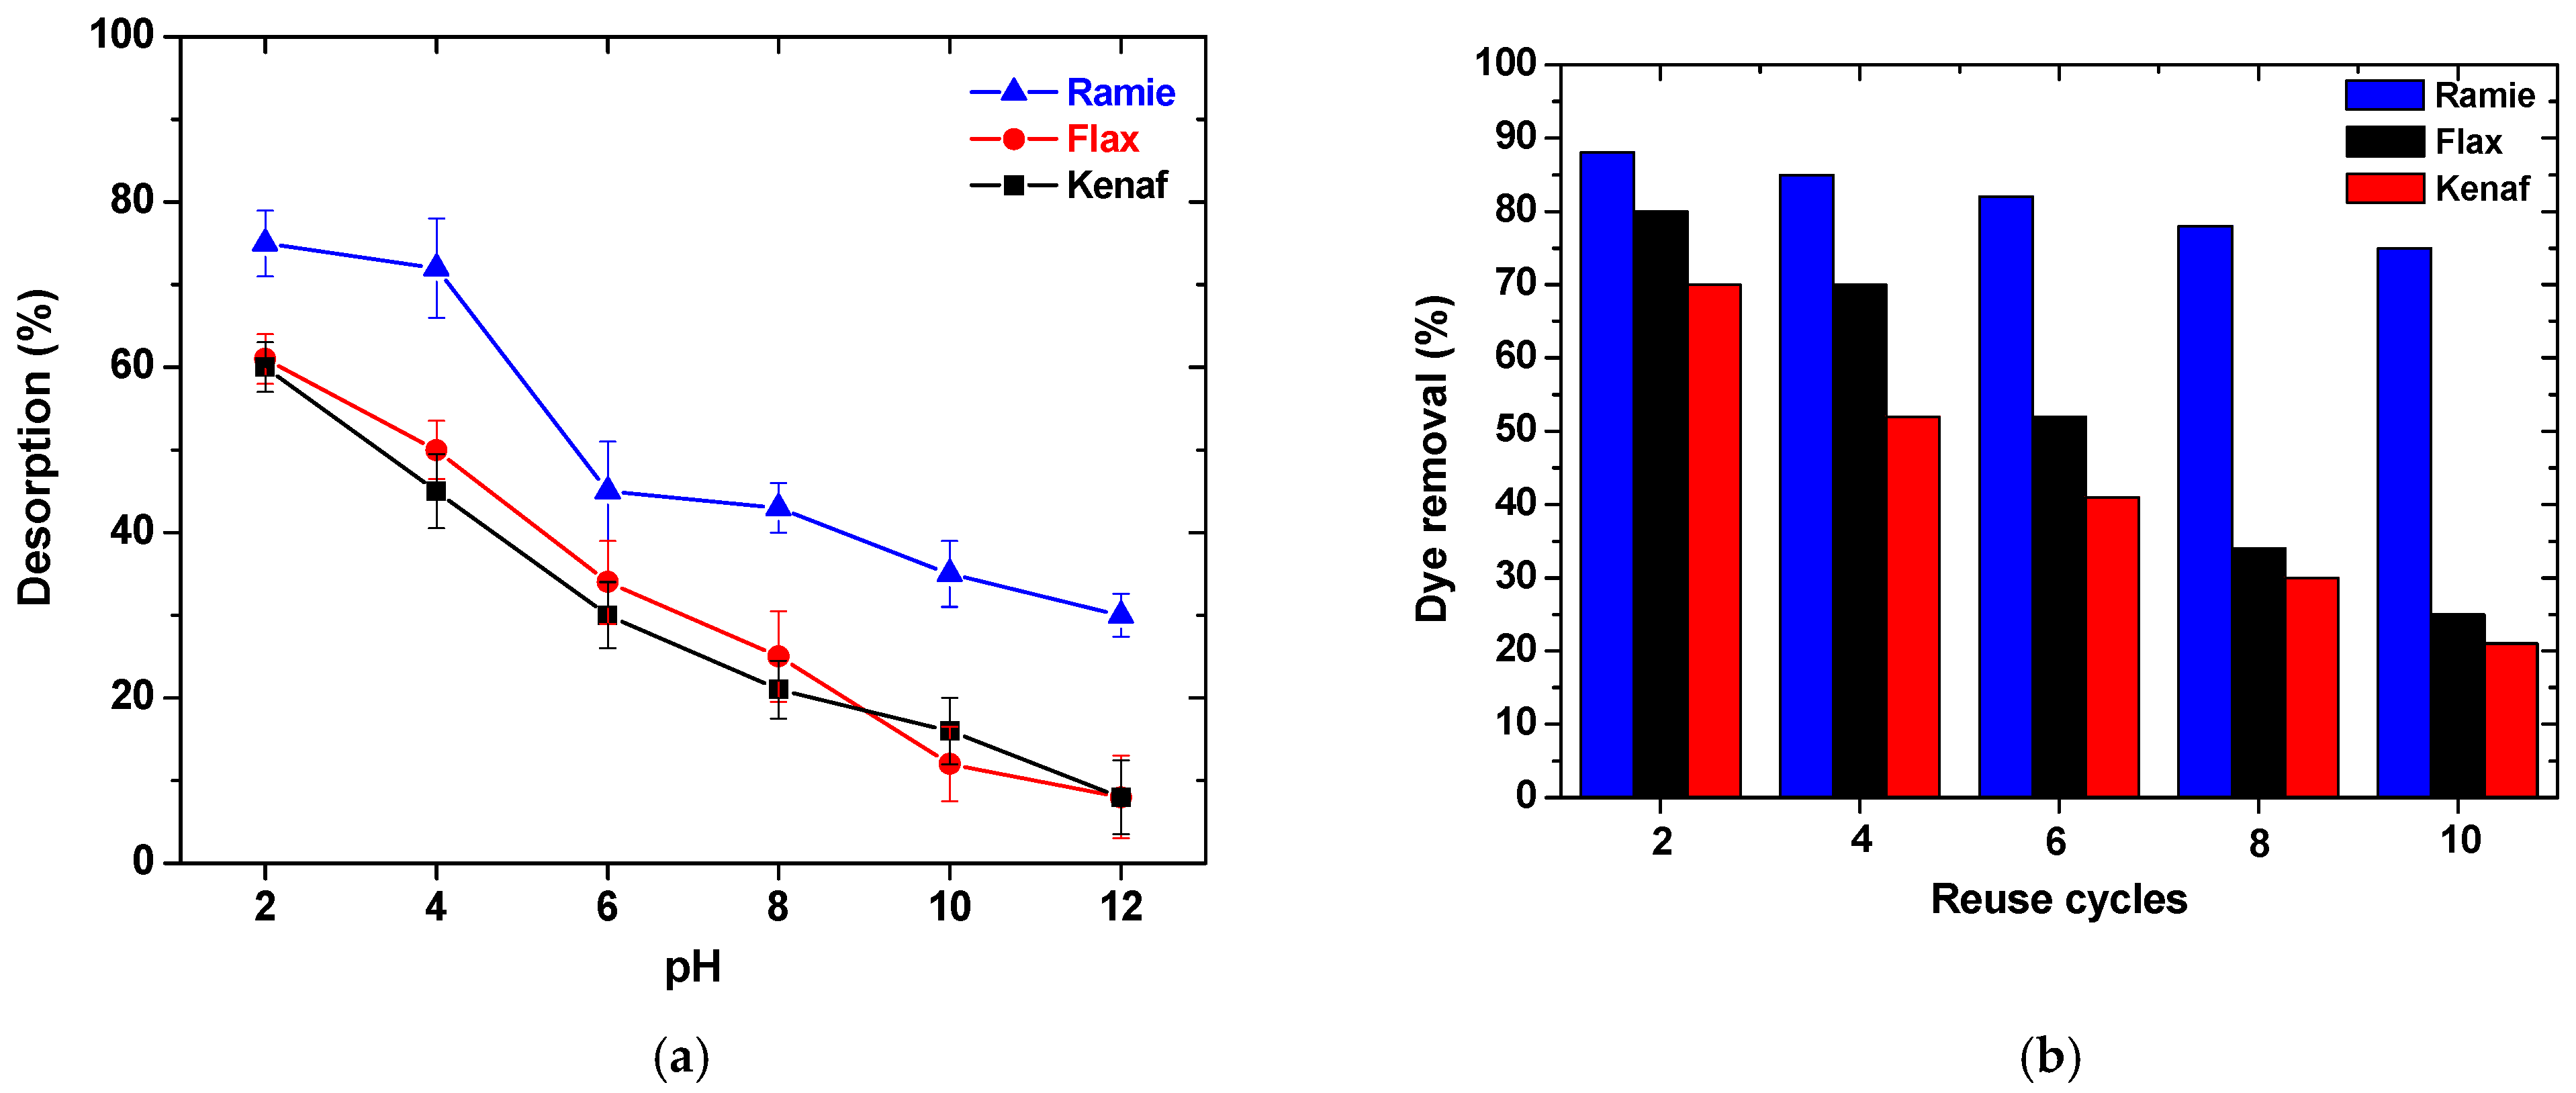
3.5. Desorption and Reuse

The initial run of desorption experiments was to evaluate/find the optimum pH conditions. The optimum pH was at 2 (ramie, 75%; kenaf, 60%; flax, 61%), because the forces (contributed to adsorption) were entirely weakened at this pH value (Figure 9a). Decreasing the solution pH (to 2), the functional groups of fibers (–COO, –O) were protonated (–COOH, –OH), so again the whole bonding was weakened. Another important parameter that was investigated was the possibility to reuse this kind of low-cost adsorbent materials. The regeneration of the fibers was estimated through a set of adsorption-desorption experiments. The results (Figure 9b) revealed the similar qualitative reuse behavior of fibers but a different quantitative one. Ramie, which was found to be the most efficient fiber for adsorption, reduced its adsorption capacity from 88 to 85% after the initial cycle, whereas the total loss by the sixth cycle was 3% (from 85 to 82%), and finally reached a 75% adsorption capacity by the last cycle (10th). Flax’s adsorption ability was reduced from 80 to 70% after the first cycle, proceeding to an 18% loss by the sixth cycle (from 70 to 52%), and achieving a 25% loss by the last cycle (10th). Finally, kenaf marked an 18% loss (from 70 to 52%) of its adsorption ability after the first cycle, further reduced by 11% by the sixth cycle (from 52 to 41%), and by the last cycle (10th) the total loss was 21%. So, it was clear that flax does not have good reuse behavior, while ramie had the best. Similarly, this could be attributed to the cellulosic content of each fiber, and possibly some mechanical properties of them.
The decrease of the adsorption during reuse cycles is very common and can mostly be attributed to the sequential reversal of extreme pH conditions of the aqueous solution/medium (from 1 to 2 and vice versa). Proceeding to the reuse cycles, the desorption ability (mainly) deteriorated and therefore the possible adsorption sites reduced in number. Less sites were free, so less sites could be used as adsorption centers. The latter is very common in adsorbent materials and can be overcome with the use of “mild” eluants. However, with the use of milder eluants, the desorption will not be good. So, there is no standard way to overcome the problem of the adsorption reduction during reuse cycles.

4. Conclusions

The major conclusion of this work is the potential of the bast fibers selected (ramie, kenaf, and flax) as low-cost sorbents for basic yellow 37 dye (cationic) removal from synthetic aqueous solutions. Specifically, the optimum pH during the adsorption stage was found to be alkaline (12), and FTIR confirmed the experimental results with the shift bands of the fibers’ functional groups. Flax’s adsorption ability for BY37 removal (435 mg·g−1) was 33% greater than that of kenaf fibers (327 mg·g−1) at 25 °C. A similar observation was made for ramie fibers (460 mg·g−1), which was 40% higher than that of kenaf (327 mg·g−1). Another basic conclusion was the reuse opportunity of those fibers in sequential adsorption-desorption cycles (10), even in extremely reversed pH conditions (from 12 to 2). The adsorption ability of the ramie fiber had only reduced by 13% by the last (10th) cycle.

Author Contributions

This article was written by G.Z.K. (he is the guest editor) and D.N.B. after personal invitation for the Special Issue “Wastewater Treatment Processes”. E.C. contributed to the experimental characterizations.

Funding

This research received no external funding.

Conflicts of Interest

The authors declare no conflict of interest.

References

  1. Reddy, N.; Yang, Y. Biofibers from agricultural byproducts for industrial applications. Trends Biotechnol. 2005, 23, 22–27. [Google Scholar] [CrossRef] [PubMed] [Green Version]
  2. Gao, X.; Gao, B.; Wang, X.; Shi, R.; Rehman, R.U.; Gu, X. The influence of cation treatments on the pervaporation dehydration of naa zeolite membranes prepared on hollow fibers. Processes 2018, 6, 70. [Google Scholar] [CrossRef]
  3. Terzopoulou, Z.N.; Papageorgiou, G.Z.; Papadopoulou, E.; Athanassiadou, E.; Reinders, M.; Bikiaris, D.N. Development and study of fully biodegradable composite materials based on poly(butylene succinate) and hemp fibers or hemp shives. Polym. Compos. 2016, 37, 407–421. [Google Scholar] [CrossRef]
  4. Gamal, A.M.; Abo Farha, S.A.; Sallam, H.B.; Mahmoud, G.E.A.; Ismail, L.F.M. Kinetic study and equilibrium isotherm analysis of reactive dyes adsorption onto cotton fiber. Nat. Sci. 2010, 8, 95–110. [Google Scholar]
  5. Chetima, A.; Wahabou, A.; Zomegni, G.; Rahman, A.N.; Nde, D.B. Bleaching of neutral cotton seed oil using organic activated carbon in a batch system: Kinetics and adsorption isotherms. Processes 2018, 6, 22. [Google Scholar] [CrossRef]
  6. Di Marcoberardino, G.; Vitali, D.; Spinelli, F.; Binotti, M.; Manzolini, G. Green hydrogen production from raw biogas: A techno-economic investigation of conventional processes using pressure swing adsorption unit. Processes 2018, 6, 19. [Google Scholar] [CrossRef]
  7. Yang, F.; Chen, S.; Shi, C.; Xue, F.; Zhang, X.; Ju, S.; Xing, W. A facile synthesis of hexagonal spinel λ-MnO2 ion-sieves for highly selective Li+ adsorption. Processes 2018, 6, 59. [Google Scholar] [CrossRef]
  8. You, Z.; Zhang, L.; Zhang, S.; Sun, Y.; Shah, K. Treatment of oil-contaminated water by modified polysilicate aluminum ferric sulfate. Processes 2018, 6, 95. [Google Scholar] [CrossRef]
  9. Bian, Y.; Xiong, N.; Zhu, G. Technology for the remediation of water pollution: A review on the fabrication of metal organic frameworks. Processes 2018, 6, 122. [Google Scholar] [CrossRef]
  10. Bailey, S.E.; Olin, T.J.; Bricka, R.M.; Adrian, D.D. A review of potentially low-cost sorbents for heavy metals. Water Res. 1999, 33, 2469–2479. [Google Scholar] [CrossRef]
  11. Kyzas, G.; Bikiaris, D. Recent modifications of chitosan for adsorption applications: A critical and systematic review. Mar. Drugs 2015, 13, 312–337. [Google Scholar] [CrossRef] [PubMed]
  12. Boonamnuayvitaya, V.; Chaiya, C.; Tanthapanichakoon, W.; Jarudilokkul, S. Removal of heavy metals by adsorbent prepared from pyrolyzed coffee residues and clay. Sep. Purif. Technol. 2004, 35, 11–22. [Google Scholar] [CrossRef]
  13. Bharathi, K.S.; Ramesh, S.T. Removal of dyes using agricultural waste as low-cost adsorbents: A review. Appl. Water Sci. 2013, 3, 773–790. [Google Scholar] [CrossRef]
  14. Prashantha Kumar, T.K.M.; Mandlimath, T.R.; Sangeetha, P.; Revathi, S.K.; Ashok Kumar, S.K. Nanoscale materials as sorbents for nitrate and phosphate removal from water. Environ. Chem. Lett. 2018, 16, 389–400. [Google Scholar] [CrossRef]
  15. Vukelic, D.; Boskovic, N.; Agarski, B.; Radonic, J.; Budak, I.; Pap, S.; Turk Sekulic, M. Eco-design of a low-cost adsorbent produced from waste cherry kernels. J. Clean. Prod. 2018, 174, 1620–1628. [Google Scholar] [CrossRef]
  16. Monte Blanco, S.P.D.; Scheufele, F.B.; Módenes, A.N.; Espinoza-Quiñones, F.R.; Marin, P.; Kroumov, A.D.; Borba, C.E. Kinetic, equilibrium and thermodynamic phenomenological modeling of reactive dye adsorption onto polymeric adsorbent. Chem. Eng. J. 2017, 307, 466–475. [Google Scholar] [CrossRef]
  17. Ranjith, K.S.; Manivel, P.; Rajendrakumar, R.T.; Uyar, T. Multifunctional zno nanorod-reduced graphene oxide hybrids nanocomposites for effective water remediation: Effective sunlight driven degradation of organic dyes and rapid heavy metal adsorption. Chem. Eng. J. 2017, 325, 588–600. [Google Scholar] [CrossRef]
  18. Cai, K.; Shen, W.; Ren, B.; He, J.; Wu, S.; Wang, W. A phytic acid modified CoFe2O4 magnetic adsorbent with controllable morphology, excellent selective adsorption for dyes and ultra-strong adsorption ability for metal ions. Chem. Eng. J. 2017, 330, 936–946. [Google Scholar] [CrossRef]
  19. Abdi, J.; Vossoughi, M.; Mahmoodi, N.M.; Alemzadeh, I. Synthesis of metal-organic framework hybrid nanocomposites based on go and cnt with high adsorption capacity for dye removal. Chem. Eng. J. 2017, 326, 1145–1158. [Google Scholar] [CrossRef]
  20. Kim, J.; Kwak, S.Y. Efficient and selective removal of heavy metals using microporous layered silicate amh-3 as sorbent. Chem. Eng. J. 2017, 313, 975–982. [Google Scholar] [CrossRef]
  21. Li, Z.; Chen, J.; Ge, Y. Removal of lead ion and oil droplet from aqueous solution by lignin-grafted carbon nanotubes. Chem. Eng. J. 2017, 308, 809–817. [Google Scholar] [CrossRef]
  22. Lingamdinne, L.P.; Chang, Y.Y.; Yang, J.K.; Singh, J.; Choi, E.H.; Shiratani, M.; Koduru, J.R.; Attri, P. Biogenic reductive preparation of magnetic inverse spinel iron oxide nanoparticles for the adsorption removal of heavy metals. Chem. Eng. J. 2017, 307, 74–84. [Google Scholar] [CrossRef]
  23. Naushad, M.; Ahamad, T.; Al-Maswari, B.M.; Abdullah Alqadami, A.; Alshehri, S.M. Nickel ferrite bearing nitrogen-doped mesoporous carbon as efficient adsorbent for the removal of highly toxic metal ion from aqueous medium. Chem. Eng. J. 2017, 330, 1351–1360. [Google Scholar] [CrossRef]
  24. Yuan, G.; Tian, Y.; Liu, J.; Tu, H.; Liao, J.; Yang, J.; Yang, Y.; Wang, D.; Liu, N. Schiff base anchored on metal-organic framework for co(ii) removal from aqueous solution. Chem. Eng. J. 2017, 326, 691–699. [Google Scholar] [CrossRef]
  25. Zhou, Y.; Xia, S.; Zhang, J.; Nguyen, B.T.; Zhang, Z. Insight into the influences of ph value on pb(ii) removal by the biopolymer extracted from activated sludge. Chem. Eng. J. 2017, 308, 1098–1104. [Google Scholar] [CrossRef]
  26. Kyzas, G.Z.; Kostoglou, M. Green adsorbents for wastewaters: A critical review. Materials 2014, 7, 333–364. [Google Scholar] [CrossRef] [PubMed]
  27. Anastopoulos, I.; Kyzas, G.Z. Agricultural peels for dye adsorption: A review of recent literature. J. Mol. Liq. 2014, 200, 277–285. [Google Scholar] [CrossRef]
  28. Didaskalou, C.; Buyuktiryaki, S.; Kecili, R.; Fonte, C.P.; Szekely, G. Valorisation of agricultural waste with an adsorption/nanofiltration hybrid process: From materials to sustainable process design. Green Chem. 2017, 19, 3116–3125. [Google Scholar] [CrossRef]
  29. Kim, J.F.; Székely, G.; Valtcheva, I.B.; Livingston, A.G. Increasing the sustainability of membrane processes through cascade approach and solvent recovery—Pharmaceutical purification case study. Green Chem. 2014, 16, 133–145. [Google Scholar] [CrossRef]
  30. Razali, M.; Kim, J.F.; Attfield, M.; Budd, P.M.; Drioli, E.; Lee, Y.M.; Szekely, G. Sustainable wastewater treatment and recycling in membrane manufacturing. Green Chem. 2015, 17, 5196–5205. [Google Scholar] [CrossRef] [Green Version]
  31. Ko, D.; Siriwardane, R.; Biegler, L.T. Optimization of a pressure-swing adsorption process using zeolite 13x for CO2 sequestration. Ind. Eng. Chem. Res. 2003, 42, 339–348. [Google Scholar] [CrossRef]
  32. Agarwal, A.; Biegler, L.T.; Zitney, S.E. Superstructure-based optimal synthesis of pressure swing adsorption cycles for precombustion CO2 capture. Ind. Eng. Chem. Res. 2010, 49, 5066–5079. [Google Scholar] [CrossRef]
  33. Faruk, O.; Bledzki, A.K.; Fink, H.P.; Sain, M. Biocomposites reinforced with natural fibers: 2000–2010. Prog. Polym. Sci. 2012, 37, 1552–1596. [Google Scholar] [CrossRef]
  34. Yamaki, S.B.; Barros, D.S.; Garcia, C.M.; Socoloski, P.; Oliveira, O.N., Jr.; Atvars, T.D.Z. Spectroscopic studies of the intermolecular interactions of congo red and tinopal cbs with modified cellulose fibers. Langmuir 2005, 21, 5414–5420. [Google Scholar] [CrossRef] [PubMed]
  35. Ciovica, S.; Vlaic, M.; Stanciu, C.; Chiuaru, R.; Asandei, N. Some aspects concerning viscose fibres dyeing uniformity. I. Staple viscose dyeing uniformity. Cellul. Chem. Technol. 1990, 24, 251–261. [Google Scholar]
  36. Tsai, B.; Garcia-Valdez, O.; Champagne, P.; Cunningham, M.F. Poly(poly(ethylene glycol) methyl ether methacrylate) grafted chitosan for dye removal from water. Processes 2017, 5, 12. [Google Scholar] [CrossRef]
  37. Zhong, D.; Liu, Y.H.; Cheung, N.T.; Kan, C.W.; Chua, H. A parameter study of the effect of a plasma-induced ozone colour-fading process on sulphur-dyed cotton fabric. Processes 2018, 6, 81. [Google Scholar] [CrossRef]
  38. Zografi, G.; Kontny, M.J.; Yang, A.Y.S.; Brenner, G.S. Surface area and water vapor sorption of microcrystalline cellulose. Int. J. Pharm. 1984, 18, 99–116. [Google Scholar] [CrossRef]
  39. Demirbas, A. Heavy metal adsorption onto agro-based waste materials: A review. J. Hazard. Mater. 2008, 157, 220–229. [Google Scholar] [CrossRef] [PubMed]
  40. Mihranyan, A.; Llagostera, A.P.; Karmhag, R.; Strømme, M.; Eka, R. Moisture sorption by cellulose powders of varying crystallinity. Int. J. Pharm. 2004, 269, 433–442. [Google Scholar] [CrossRef] [PubMed]
  41. Tofan, L.; Teodosiu, C.; Paduraru, C.; Wenkert, R. Cobalt (ii) removal from aqueous solutions by natural hemp fibers: Batch and fixed-bed column studies. Appl. Surf. Sci. 2013, 285, 33–39. [Google Scholar] [CrossRef]
  42. Mahmoud, D.K.; Salleh, M.A.M.; Karim, W.A.W.A.; Idris, A.; Abidin, Z.Z. Batch adsorption of basic dye using acid treated kenaf fibre char: Equilibrium, kinetic and thermodynamic studies. Chem. Eng. J. 2012, 181–182, 449–457. [Google Scholar] [CrossRef]
  43. Park, S.; Baker, J.; Himmel, M.; Parilla, P.; Johnson, D. Cellulose crystallinity index: Measurement techniques and their impact on interpreting cellulase performance. Biotechnol. Biofuels 2010, 3, 10. [Google Scholar] [CrossRef] [PubMed]
  44. Jayaramudu, J.; Guduri, B.R.; Rajulu, A.V. Characterization of natural fabric sterculia urens. Int. J. Polym. Anal. Charact. 2009, 14, 115–125. [Google Scholar] [CrossRef]
  45. Langmuir, I. The adsorption of gases on plane surfaces of glass, mica and platinum. J. Am. Chem. Soc. 1918, 40, 1361–1403. [Google Scholar] [CrossRef]
  46. Freundlich, H. Over the adsorption in solution. Z. Phys. Chem. 1906, 57, 385–470. [Google Scholar]
  47. Tien, C. Adsorption Calculations and Modeling; Butterworth-Heinemann: Boston, MA, USA, 1994. [Google Scholar]
  48. Smith, J.M.; Van Ness, H.C. Introduction to Chemical Engineering Thermodynamics, 4th ed.; McGraw-Hill: New York, NY, USA, 1987. [Google Scholar]
  49. Bismarck, A.; Aranberri-Askargorta, I.; Springer, J.; Lampke, T.; Wielage, B.; Stamboulis, A.; Shenderovich, I.; Limbach, H.-H. Surface characterization of flax, hemp and cellulose fibers; surface properties and the water uptake behavior. Polym. Compos. 2002, 23, 872–894. [Google Scholar] [CrossRef]
  50. Razak, N.I.A.; Ibrahim, N.A.; Zainuddin, N.; Rayung, M.; Saad, W.Z. The influence of chemical surface modification of kenaf fiber using hydrogen peroxide on the mechanical properties of biodegradable kenaf fiber/poly(lactic acid). Compos. Mol. 2014, 19, 2957–2968. [Google Scholar] [CrossRef] [PubMed]
  51. Allègre, C.; Moulin, P.; Maisseu, M.; Charbit, F. Treatment and reuse of reactive dyeing effluents. J. Membr. Sci. 2006, 269, 15–34. [Google Scholar] [CrossRef]
  52. Alemdar, A.; Sain, M. Isolation and characterization of nanofibers from agricultural residues—Wheat straw and soy hulls. Bioresour. Technol. 2008, 99, 1664–1671. [Google Scholar] [CrossRef] [PubMed]
  53. Sgriccia, N.; Hawley, M.C.; Misra, M. Characterization of natural fiber surfaces and natural fiber composites. Compos. Part A Appl. Sci. Manuf. 2008, 39, 1632–1637. [Google Scholar] [CrossRef]
  54. Cao, Y.; Chan, F.; Chui, Y.-H.; Xiao, H. Characterization of flax fibres modified by alkaline, enzyme, and steam-heat treatments. BioResources 2012, 7, 4109–4121. [Google Scholar]
  55. Chatterjee, S.; Chatterjee, B.P.; Das, A.R.; Guha, A.K. Adsorption of a model anionic dye, eosin y, from aqueous solution by chitosan hydrobeads. J. Colloid Interface Sci. 2005, 288, 30–35. [Google Scholar] [CrossRef] [PubMed]
  56. Brunauer, S.; Deming, L.S.; Deming, W.E.; Teller, E. On a theory of the van der waals adsorption of gases. J. Am. Chem. Soc. 1940, 62, 1723–1732. [Google Scholar] [CrossRef]
  57. Kyzas, G.Z.; Kostoglou, M.; Lazaridis, N.K. Copper and chromium(vi) removal by chitosan derivatives-equilibrium and kinetic studies. Chem. Eng. J. 2009, 152, 440–448. [Google Scholar] [CrossRef]
Figure 1. SEM images of (a) kenaf fiber, (b) BY37-kenaf, (c) ramie fiber, (d) BY37-ramie, (e) flax fiber, and (f) BY37-flax.
Processes 06 00166 g001
Figure 2. XRD patterns of kenaf fiber, BY37-kenaf, ramie fiber, BY37-ramie, flax fiber, and BY37-flax.
Processes 06 00166 g002
Figure 3. Photos of fibers before (right column) and after (left column) BY37 adsorption for (a) kenaf, (b) ramie, and (c) flax.
Processes 06 00166 g003aProcesses 06 00166 g003b
Figure 4. Effect of pH on the BY37 removal with adsorption onto fibers (adsorption conditions: C0 = 100 mg·L−1, pH = 2–12, T = 25 °C, N = 160 rpm, m = 0.1 g, V = 100 mL, and t = 24 h).
Processes 06 00166 g004
Figure 5. Proposed adsorption mechanism between the fiber with BY37 at acidic and basic pH conditions.
Processes 06 00166 g005
Figure 6. FTIR spectra of the fibers used for BY37 removal. (a) Ramie fiber before and after BY37 adsorption, (b) flax fiber before and after BY37 adsorption, and (c) kenaf fiber before and after BY37 adsorption.
Processes 06 00166 g006aProcesses 06 00166 g006b
Figure 7. Isotherms for the adsorption of BY37 at 25, 35, 45, and 55 °C onto (a) flax, (b) kenaf, and (c) ramie fibers (adsorption conditions: C0 = 10–1000 mg·L−1, pH = 12, T = 25–55 °C, N = 160 rpm, m = 0.1 g, V = 100 mL, and t = 24 h).
Processes 06 00166 g007aProcesses 06 00166 g007b
Figure 8. Effect of the adsorbent’s mass for the removal of BY37 by adsorption onto flax, kenaf, and ramie fibers (adsorption conditions: C0 = 100 mg·L−1, pH = 12, T = 25 °C, N = 160 rpm, m = 0.01–0.5 g, V = 100 mL, and t = 24 h).
Processes 06 00166 g008
Figure 9. (a) Effect of pH on BY37 desorption from fibers. (b) Reuse cycles of adsorption-desorption (adsorption conditions: C0 = 100 mg·L−1, pH = 12, T = 25 °C, N = 160 rpm, m = 0.1 g, V = 100 mL, and t = 24 h; and desorption conditions: pH = 2–12 (2 as optimum for cycles), T = 25 °C, N = 160 rpm, m = 0.1 g, V = 100 mL, and t = 24 h).
Processes 06 00166 g009
Table 1. XRD data of the adsorbents before and after BY37 removal.
Before AdsorptionAfter Adsorption
FiberCIXc
(%)
CIXc
(%)
Kenaf0.70076.920.68175.70
Ramie0.88589.700.87288.60
Flax0.82084.090.79583.01
Table 2. Equilibrium parameters for the adsorption of BY37 at 25, 35, 45, and 55 °C onto ramie, flax, and kenaf fibers.
Langmuir EquationFreundlich Equation
FiberT
(°C)
Qm
(mg·g−1)
KL
(L·mg−1)
R2KF
( mg ( 1 1 n ) L ( 1 n ) g 1 )
nR2
Ramie254600.0250.99751.742.840.951
354750.0280.99556.722.890.953
455060.0380.99366.702.960.945
555070.0430.99271.613.060.947
Flax254350.0220.99845.642.780.947
354430.0250.99749.612.840.946
454530.0280.99353.682.890.954
555120.0370.99266.842.930.956
Kenaf253270.0120.99423.872.510.962
353330.0130.99326.242.570.961
453420.0140.99127.362.580.964
553460.0150.98929.822.840.962
Table 3. Thermodynamic parameters for the adsorption of BY37 at 25, 35, 45, and 55 °C onto ramie, flax, and kenaf fibers.
FiberC0
(mg·L−1)
T
(K)
Qe
(mg·g−1)
KcΔG0
(kJ·mol−1)
ΔH0
(kJ·mol−1)
ΔS0
(kJ·mol−1·K−1)
Ramie102989.9099.00−11.39+26.31+0.126
3089.92124.02−12.34
3189.95199.07−14.00
3289.96249.08−15.05
10029891.0410.11−5.73+11.79+0.052
30892.0911.50−6.25
31893.4113.29−6.84
32893.5314.38−7.27
500298350.242.33−2.10+10.51+0.042
308360.352.57−2.42
318380.413.17−3.05
328385.363.35−3.30
1000298430.050.750.70+7.77+0.024
308448.090.810.53
318490.080.960.11
328495.870.980.05
Flax102989.8049.02−9.64+42.61+0.174
3089.8565.67−10.72
3189.9199.10−12.15
3289.96249.00−15.05
10029888.047.33−4.94+20.13+0.083
30889.098.09−5.35
31891.0710.11−6.12
32894.3215.67−7.50
500298335.442.03−1.75+12.43+0.047
308345.682.23−2.05
318350.712.33−2.24
328385.353.35−3.30
1000298405.590.680.95+9.92+0.030
308415.310.710.88
318435.420.770.69
328500.241.000.00
Kenaf102987.022.33−2.10+6.65+0.029
3087.503.00−2.81
3187.513.02−2.90
3287.523.03−3.00
10029878.043.55−3.14+6.25+0.033
30880.094.00−3.55
31881.124.26−3.83
32882.234.56−4.14
500298250.341.000.00+3.25+0.011
308255.411.04−0.10
318260.351.08−0.21
328265.951.13−0.33
1000298295.010.422.16+2.68+0.002
308300.340.432.17
318310.450.452.12
328315.550.462.12

