Article

Quantitative Estimates of Nonlinear Flow Characteristics of Deformable Rough-Walled Rock Fractures with Various Lithologies

State Key Laboratory for Geomechanics and Deep Underground Engineering, China University of Mining and Technology, Xuzhou 221116, China
*
Author to whom correspondence should be addressed.
Processes 2018, 6(9), 149; https://doi.org/10.3390/pr6090149
Submission received: 5 August 2018 / Revised: 22 August 2018 / Accepted: 24 August 2018 / Published: 1 September 2018

Abstract

:
The existence of surface roughness, various contact conditions and the occurrence of flow nonlinearity make the flow process in natural rock fractures more complicated. To evaluate the fluid flow regimes in deformable rough-walled rock fractures, a great many hydromechanical tests were conducted on nine real fractures artificially produced from a wide range of lithological diversity. For fractures with a certain JRC (fracture roughness coefficient) value, the confining pressure varied from 5 to 20 MPa, and the hydraulic pressure was increased from 0.4 to 6.0 MPa. The experimental results display that (i) regression analyses of the raw experimental data indicate that the Forchheimer’s law provides a perfect description for flow process through the fractures. The coefficients of viscous and inertial pressure drops undergo a growth of 2–3 orders of magnitude with an increase in the confining pressure; (ii) the hydraulic aperture decreases by approximately 87.41–92.81% as the confining pressure increases, and experiences a decrease of 1.52–2.96 times with the JRC values. A power-law function is used to evaluate the hydraulic aperture as a function of the nonlinear coefficient. The nonlinear coefficient decreases with increasing hydraulic aperture; (iii) using Forchheimer equation, the critical Reynolds number Rec was successfully assessed by choosing E percentage (generally 10%) of the nonlinear effect as the critical value between the linear and nonlinear flow regimes. The obtained Rec steadily increases with increasing confining pressure, while it diminishes with the JRC values; and (v) the transmissivity decreases as the pressure gradient increases. Additionally, transmissivity also exhibits a decreasing trend with both the confining pressures and JRC values due to fracture closure and tortuous and channeling flow paths in rougher fractures, and the rate of its decrease for a smaller confining pressure (5, 10 MPa) is more significant.

1. Introduction

Fluid flow through single rock fractures has been a matter of great concern over the past few decades in various engineering activities including oil and natural gas exploitation, geothermal extraction, CO2 geological sequestration, nuclear waste disposal, and underground coal gasification [1,2,3,4,5]. A sound understanding of fluid flow behaviors through single fractures, which vary with the in situ or disturbance stress, is essential and has a vital significance for ensuring safety and performance of these engineering applications [6,7,8].
Macroscopically, fluid flowing through single fractures is approximately estimated using the cubic law, which is achieved from the analogy of laminar flow through two perfectly smooth parallel plates separated from each other with a fixed gap [9,10,11]. However, fluid flow experimental findings on real rock factures indicated that the cubic law generally overestimates the transmissivity of fractures [12,13]. Additionally, a typical natural rock fracture often takes on the characteristics of rough surfaces and irregular asperity contacts between the opposing two fracture walls. Void space between the fracture surfaces provides the primary paths of fluid migration, bypassing the contact regions with twists and turns [14], which makes the flowing behaviors complicated and difficult to be accurately described. The geometrical characteristics therefore have great implications on fluid flow behaviors through rock fractures [15,16,17]. Departing from the linear Darcy’s law has already been recognized with an increase in the flow rate or fracture surface roughness, which cannot be ignored for accurate assessment of fluid flow regimes in certain flow situations [18,19]. More recently, many efforts have been devoted regarding nonlinear flow phenomena through rock fractures caused by roughness [20,21].
In engineering practices, both nature activities and human perturbations entail significant influences on the effective stress field of underground rock masses, which would then result in a significant disturbance on rock fracture geometries including fracture surface roughness, contact ratio, matching degree, and the hydraulic aperture, further complicating the evaluation of fluid flow through fractures and reducing the applicability of the existing theoretical models [17,22]. Under an applied load, the void space between the opposing surfaces can vary on account of normal stress-induced opening or closures [16,18,23] or shear stress-induced dilations [6,24,25]. As for loading effect, the fracture closes and the permeability decreases, which can be well described using Bandis’ hyperbolic function [26]. Therefore, the flowing behavior and transport characteristics of rough-walled rock fractures, and their coupling with deformation are stress-dependent, which have so far not been fully understood.
The absence of lithological diversity of rock fractures is another important missing aspect of evaluating nonlinear flow behaviors through rock fractures in the past endeavors. In reality, different lithologies represent the geological history [27], which has obvious influences on surface roughness and morphology of the natural fractures [9], and thereby the hydraulic properties. As a result, the aim of this paper is to experimentally elucidate the nonlinear flow in deformable rough-walled rock fractures with a wide spread of lithological diversity. A large number of hydromechanical tests were conducted on nine fractures subjected to different confining pressures (5–20 MPa) and various inlet hydraulic pressures (0.4–6.0 MPa). According to the test results, nonlinear fluid flow behaviors through the rough-walled fractures were investigated and the reasons that give rise to the flow nonlinearity were analyzed, as were the critical Reynolds number, hydraulic aperture and transmissivity of the fractures with increasing confining pressures and JRC (fracture roughness coefficient) values.

2. Theory and Background

For steady-state and incompressible Newtonian fluid, flowing through single rock fractures is generally described using the Navier–Stokes (NS) equations, which were obtained according to the Newton’s second law [8,19]. To get a closed-form solution, the principles of momentum conservation and continuity equation must be supplemented:
ρ [ u t + ( u ) u ] = P + T + ρ f ,
u = 0 ,
where u denotes the flow velocity vector, P denotes the hydraulic pressure, T denotes the shear stress tensor, ρ denotes the fluid density, t denotes the time, and f denotes the body force.
Given the complex geometries of real rock fractures and high nonlinearity of the preceding equations, exact solutions of the Navier–Stokes equations are extremely difficult to achieve [28]. Therefore, further simplifications are generally employed to reduce these equations to solvable forms. For certain cases with very low Reynolds number (Re) or flow rate, the inertial term ( u ) u in Equation (1) takes a small value that can be neglected or vanishes. The well-known cubic law has been established as follows [29]:
Q = w e h 3 12 μ P
in which Q is the total volume flow rate, w denotes the fracture width which is perpendicular to the flowing direction, e h is the hydraulic aperture, μ is the dynamic viscosity, and P is the pressure gradient.
The linear relationship between Q and P in Equation (3) can only be anticipated for idealized parallel-plate models with a sufficiently low flow velocity. With an increase in the flux, the increase in pressure gradient drop is more than the proportional increase in the flow rate, which is referred to as the flow nonlinearity, and Equation (3) is no longer applicable [30,31]. The most widely-adopted mathematical approach to evaluate the nonlinear flow through rock fractures is the Forchheimer’s law, where the pressure gradient is a quadratic function of the volume flow rate, and can be given as follows [32,33]:
P = a Q + b Q 2 ,
a = μ k A 0 = 12 μ w e h 3 ,
where aQ and bQ2 respectively denote energy losses as a result of viscous and inertial dissipation mechanisms for fluid flowing through fractures. k is the intrinsic permeability. A0 denotes the cross-sectional area.
To identify the ratio of inertial forces to the viscous forces in Equation (4), the Reynolds number was introduced and can be given by [34]:
R e = ρ Q μ w .
Additionally, in order to quantitatively assess the flowing nonlinearity in fractures, a nonlinear effect factor E was introduced and utilized to distinguish the fluid flow regimes [35]. It can be presented by:
E = b Q 2 a Q + b Q 2 .
This factor E represents the contribution proportion of nonlinear terms to the total pressure gradient. With regard to engineering purposes, a critical value of E = 10% was defined as the critical condition for flow regime transition in fractures, where the nonlinear effect can be appreciable and cannot be neglected [18,25].
The critical Reynolds number (Rec), which characterizes the termination of linear flow and the occurrence of flow nonlinearity, has become a crucial threshold of fluids flowing through fractures. It can be interpreted as the point where the pressure drop induced by the nonlinear term accounts for E percentage compared to the total pressure drop [15]. Combining Equations (6) and (7) yields the correlation between Rec and E as follows:
R e c = a ρ E b μ w ( 1 E ) .
Apparent transmissivity (T) has also been adopted to predict the onset of nonlinear flow regimes in rock fractures. Based on the well-known linear Darcy’s law, T can be given as follows [34,36]:
T = μ Q P w .
When the hydraulic head difference is especially small and the effects of inertial forces can be neglected, T is generally considered as a constant value due to linear relation between P and Q. However, with continuous increase in Re or P , fluid flow enters the nonlinear regime and T varies.

3. Experimental Procedure

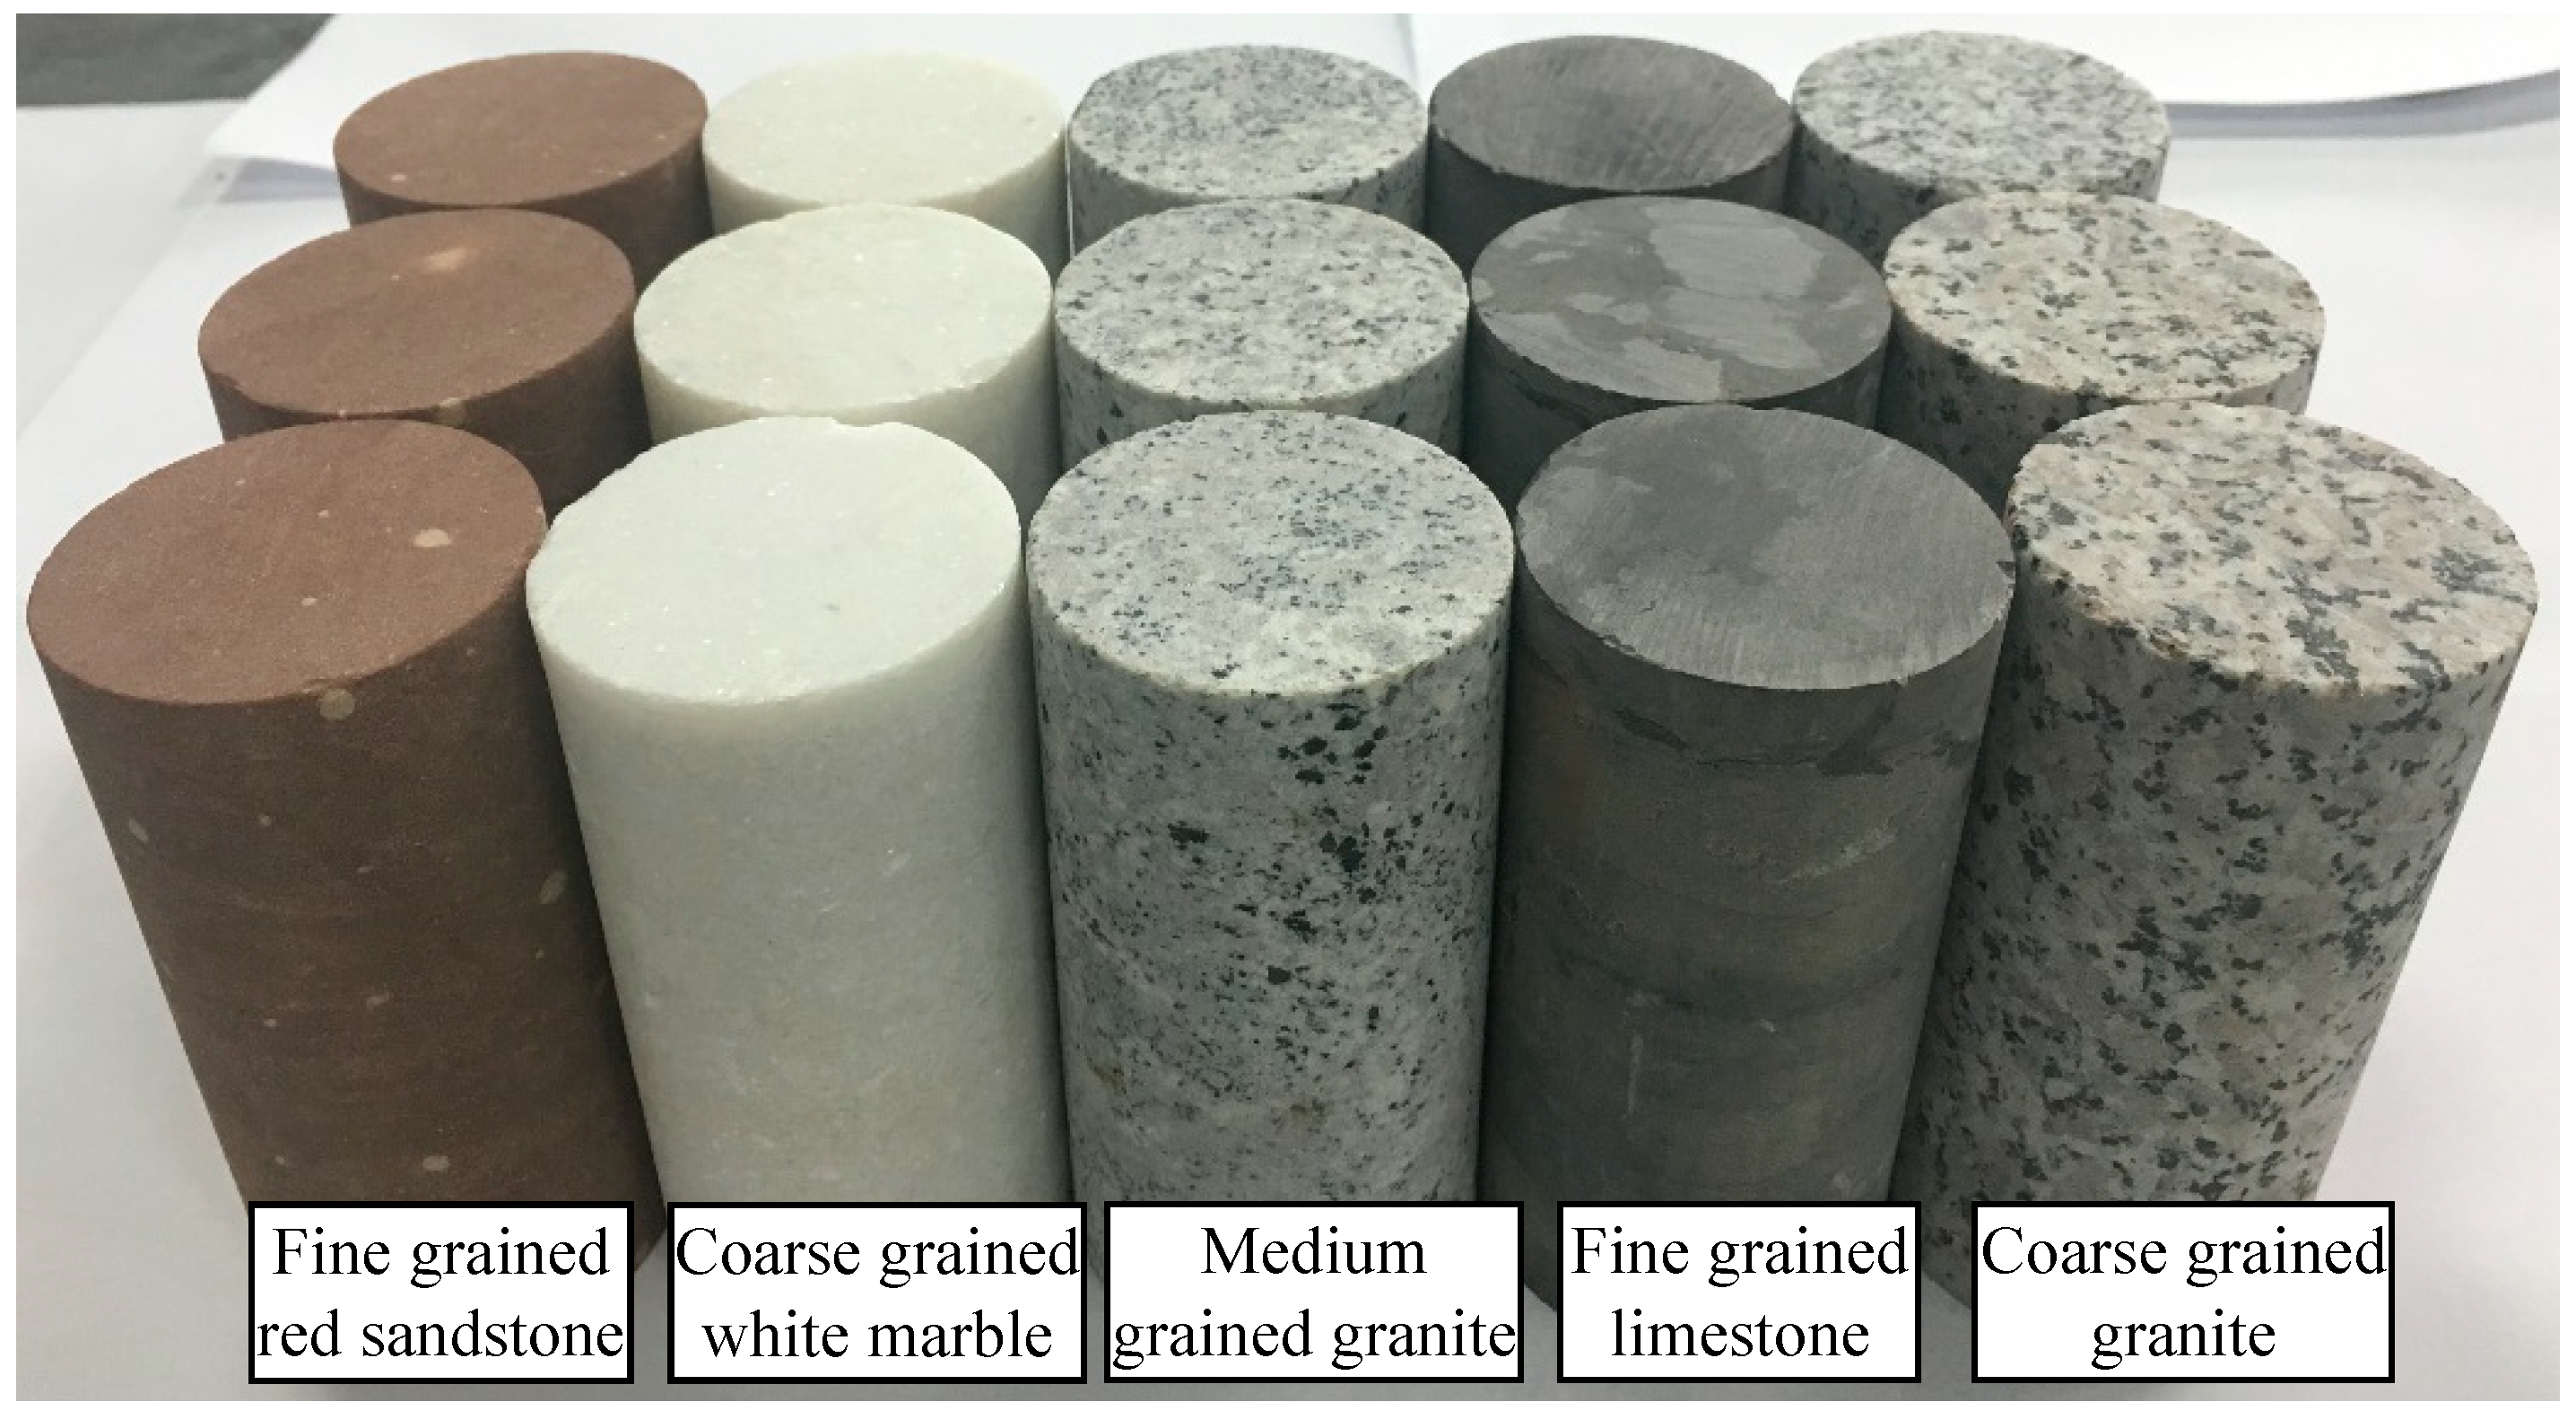
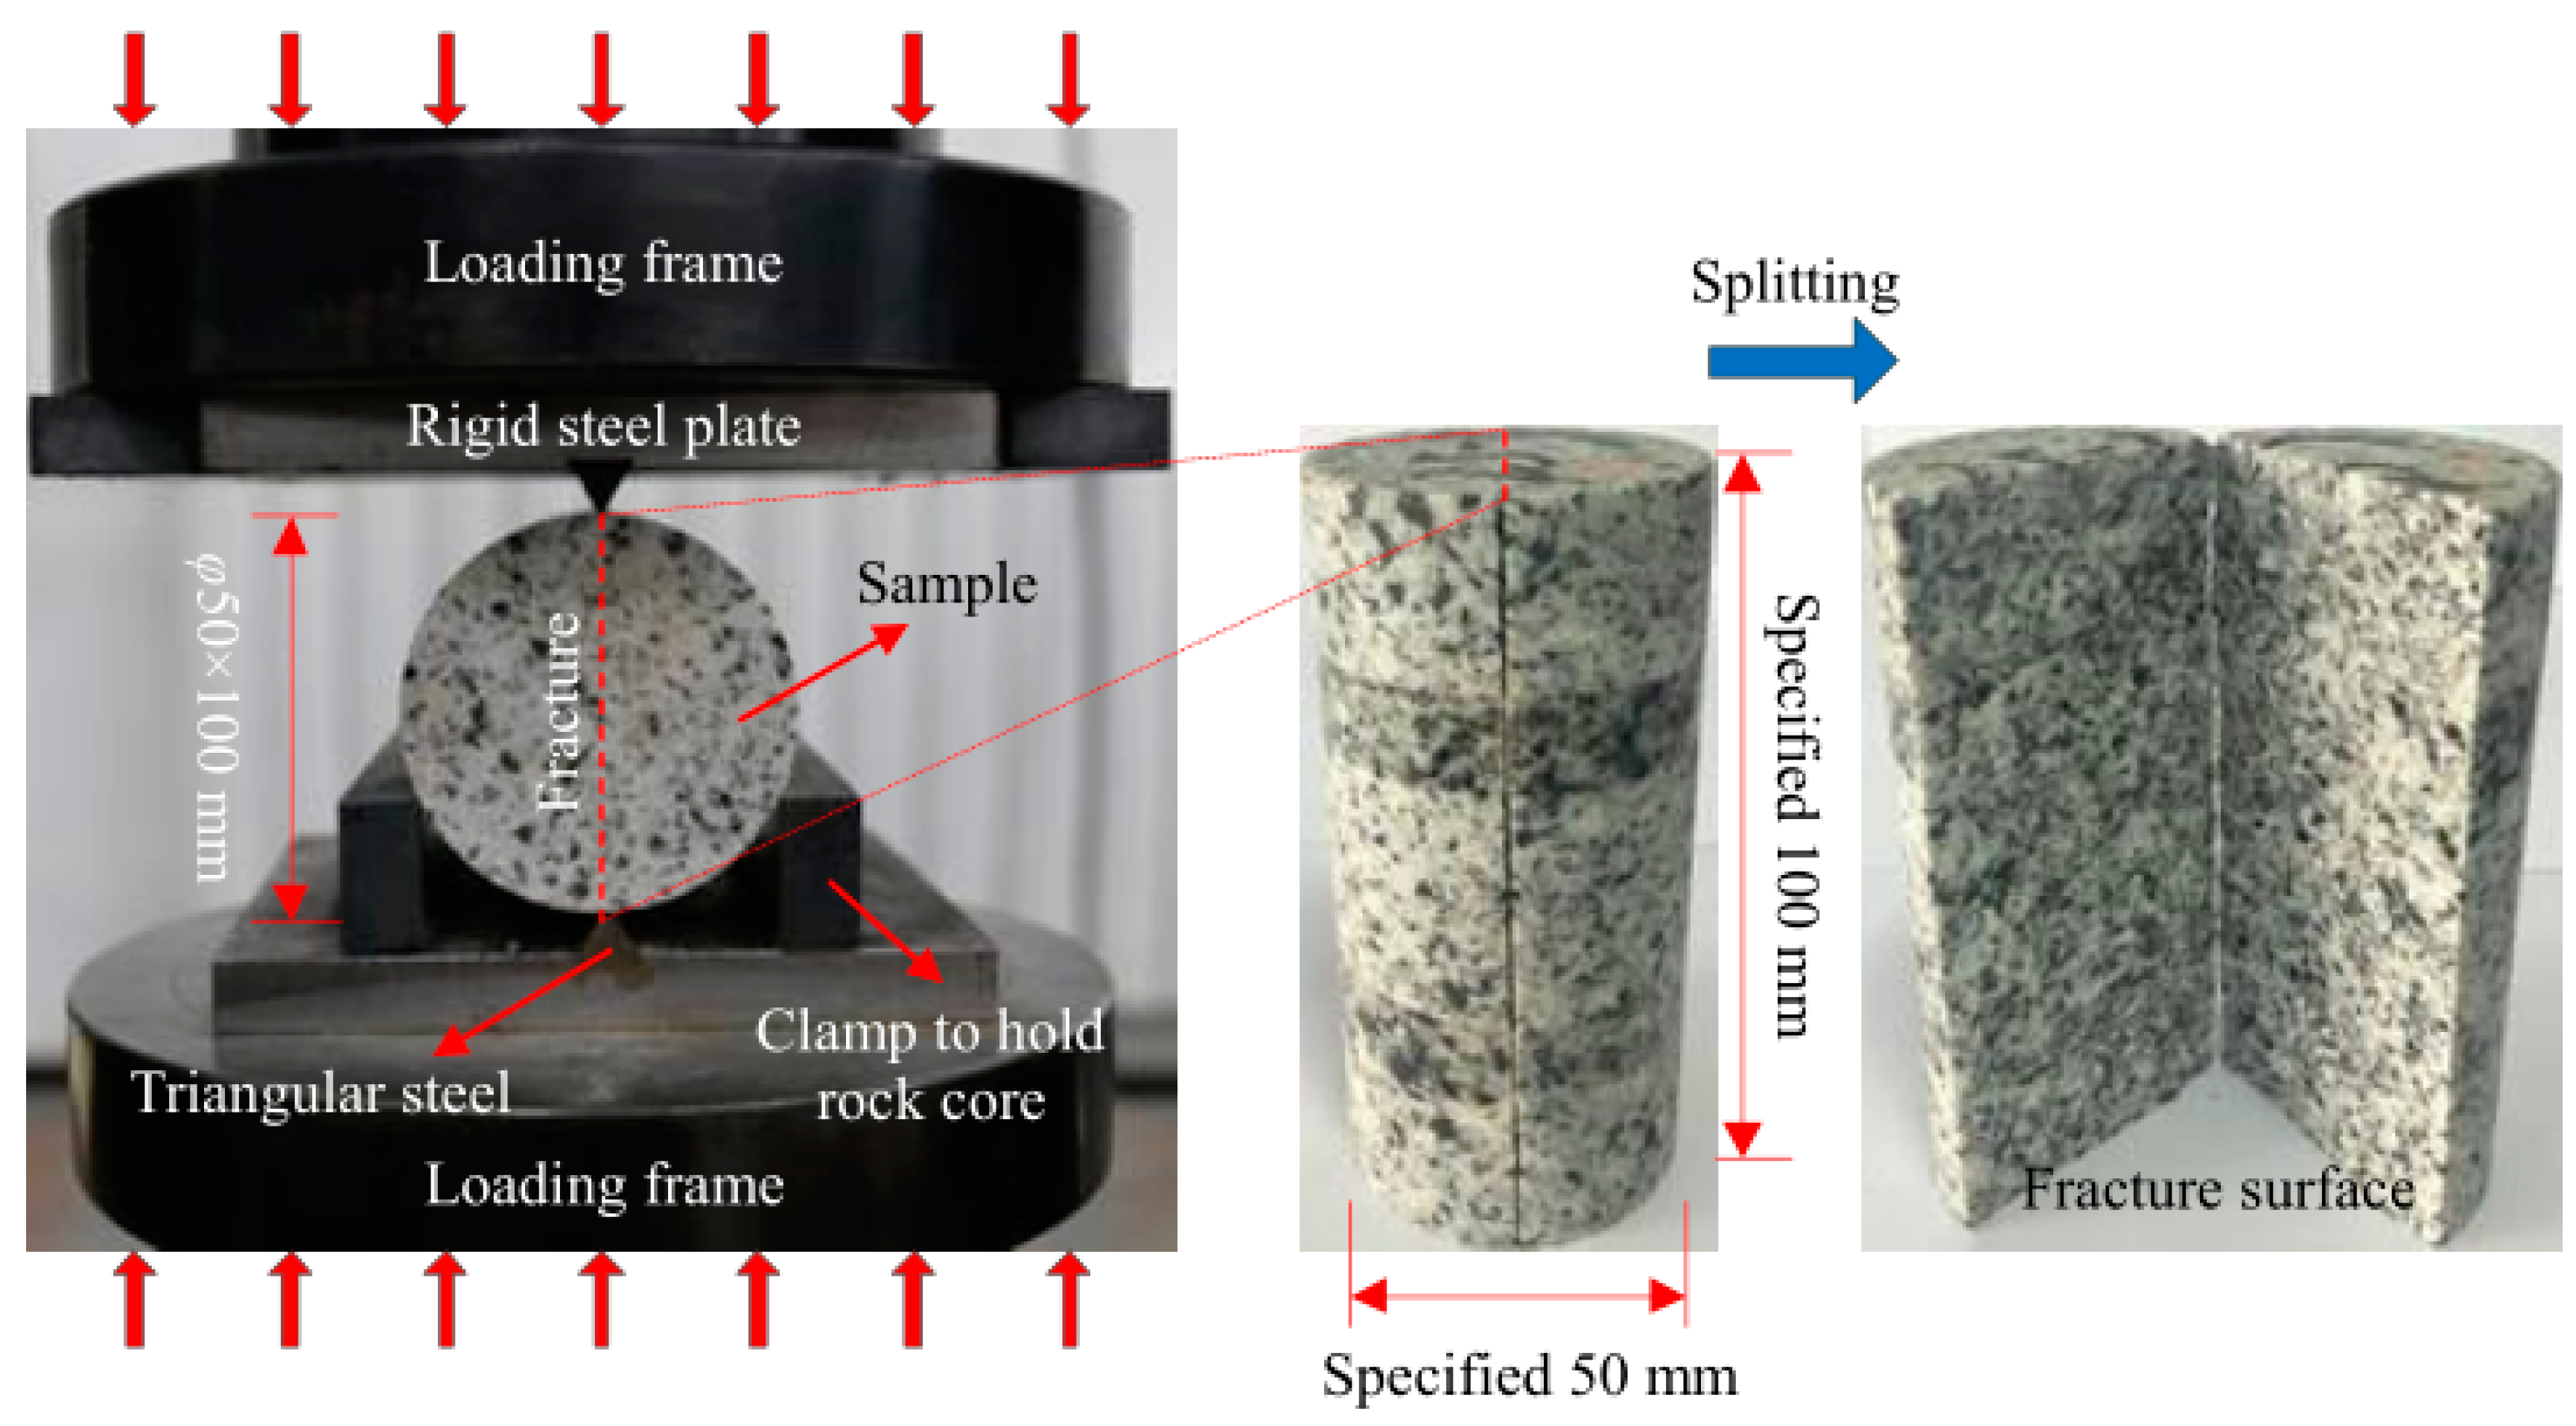
3.1. Sample Preparation

Fluid flow experiments were performed on nine rough-walled real rock fractures that were artificially produced from a wide range of lithological diversity (granite, marble, limestone, and sandstone). Based on the thin section inspections results with a polarized microscope, average crystallite sizes were analyzed for the tested rock materials, as tabulated in Table 1. The main reason for selecting rock samples with various lithologies was to achieve various fracture roughness profiles.
Nine cylindrical samples were cored from intact rock blocks to actual diameter of 50 mm and approximate 100 mm in height. Both two ends of the rock samples were carefully polished in order to obtain smooth parallel surfaces for the experiments (Figure 1). Then, indirect tensile stress was applied to the samples with a hydraulic press, which was similar to Brazilian splitting tests. When the tensile failure took place, each sample was fractured and commonly divided into two almost-equally halves along a rough fracture surface, as shown in Figure 2. The fresh tensile rock fractures chosen for the fluid flow tests here in this study generally illustrate exactly matching, tightly closed rough-walled single fractures, which would be regarded as a common situation deep beneath in the earth’s crust. In addition, no visible relative mechanical shifting was imposed to the two fracture surfaces, which may produce sheared fractures [36].

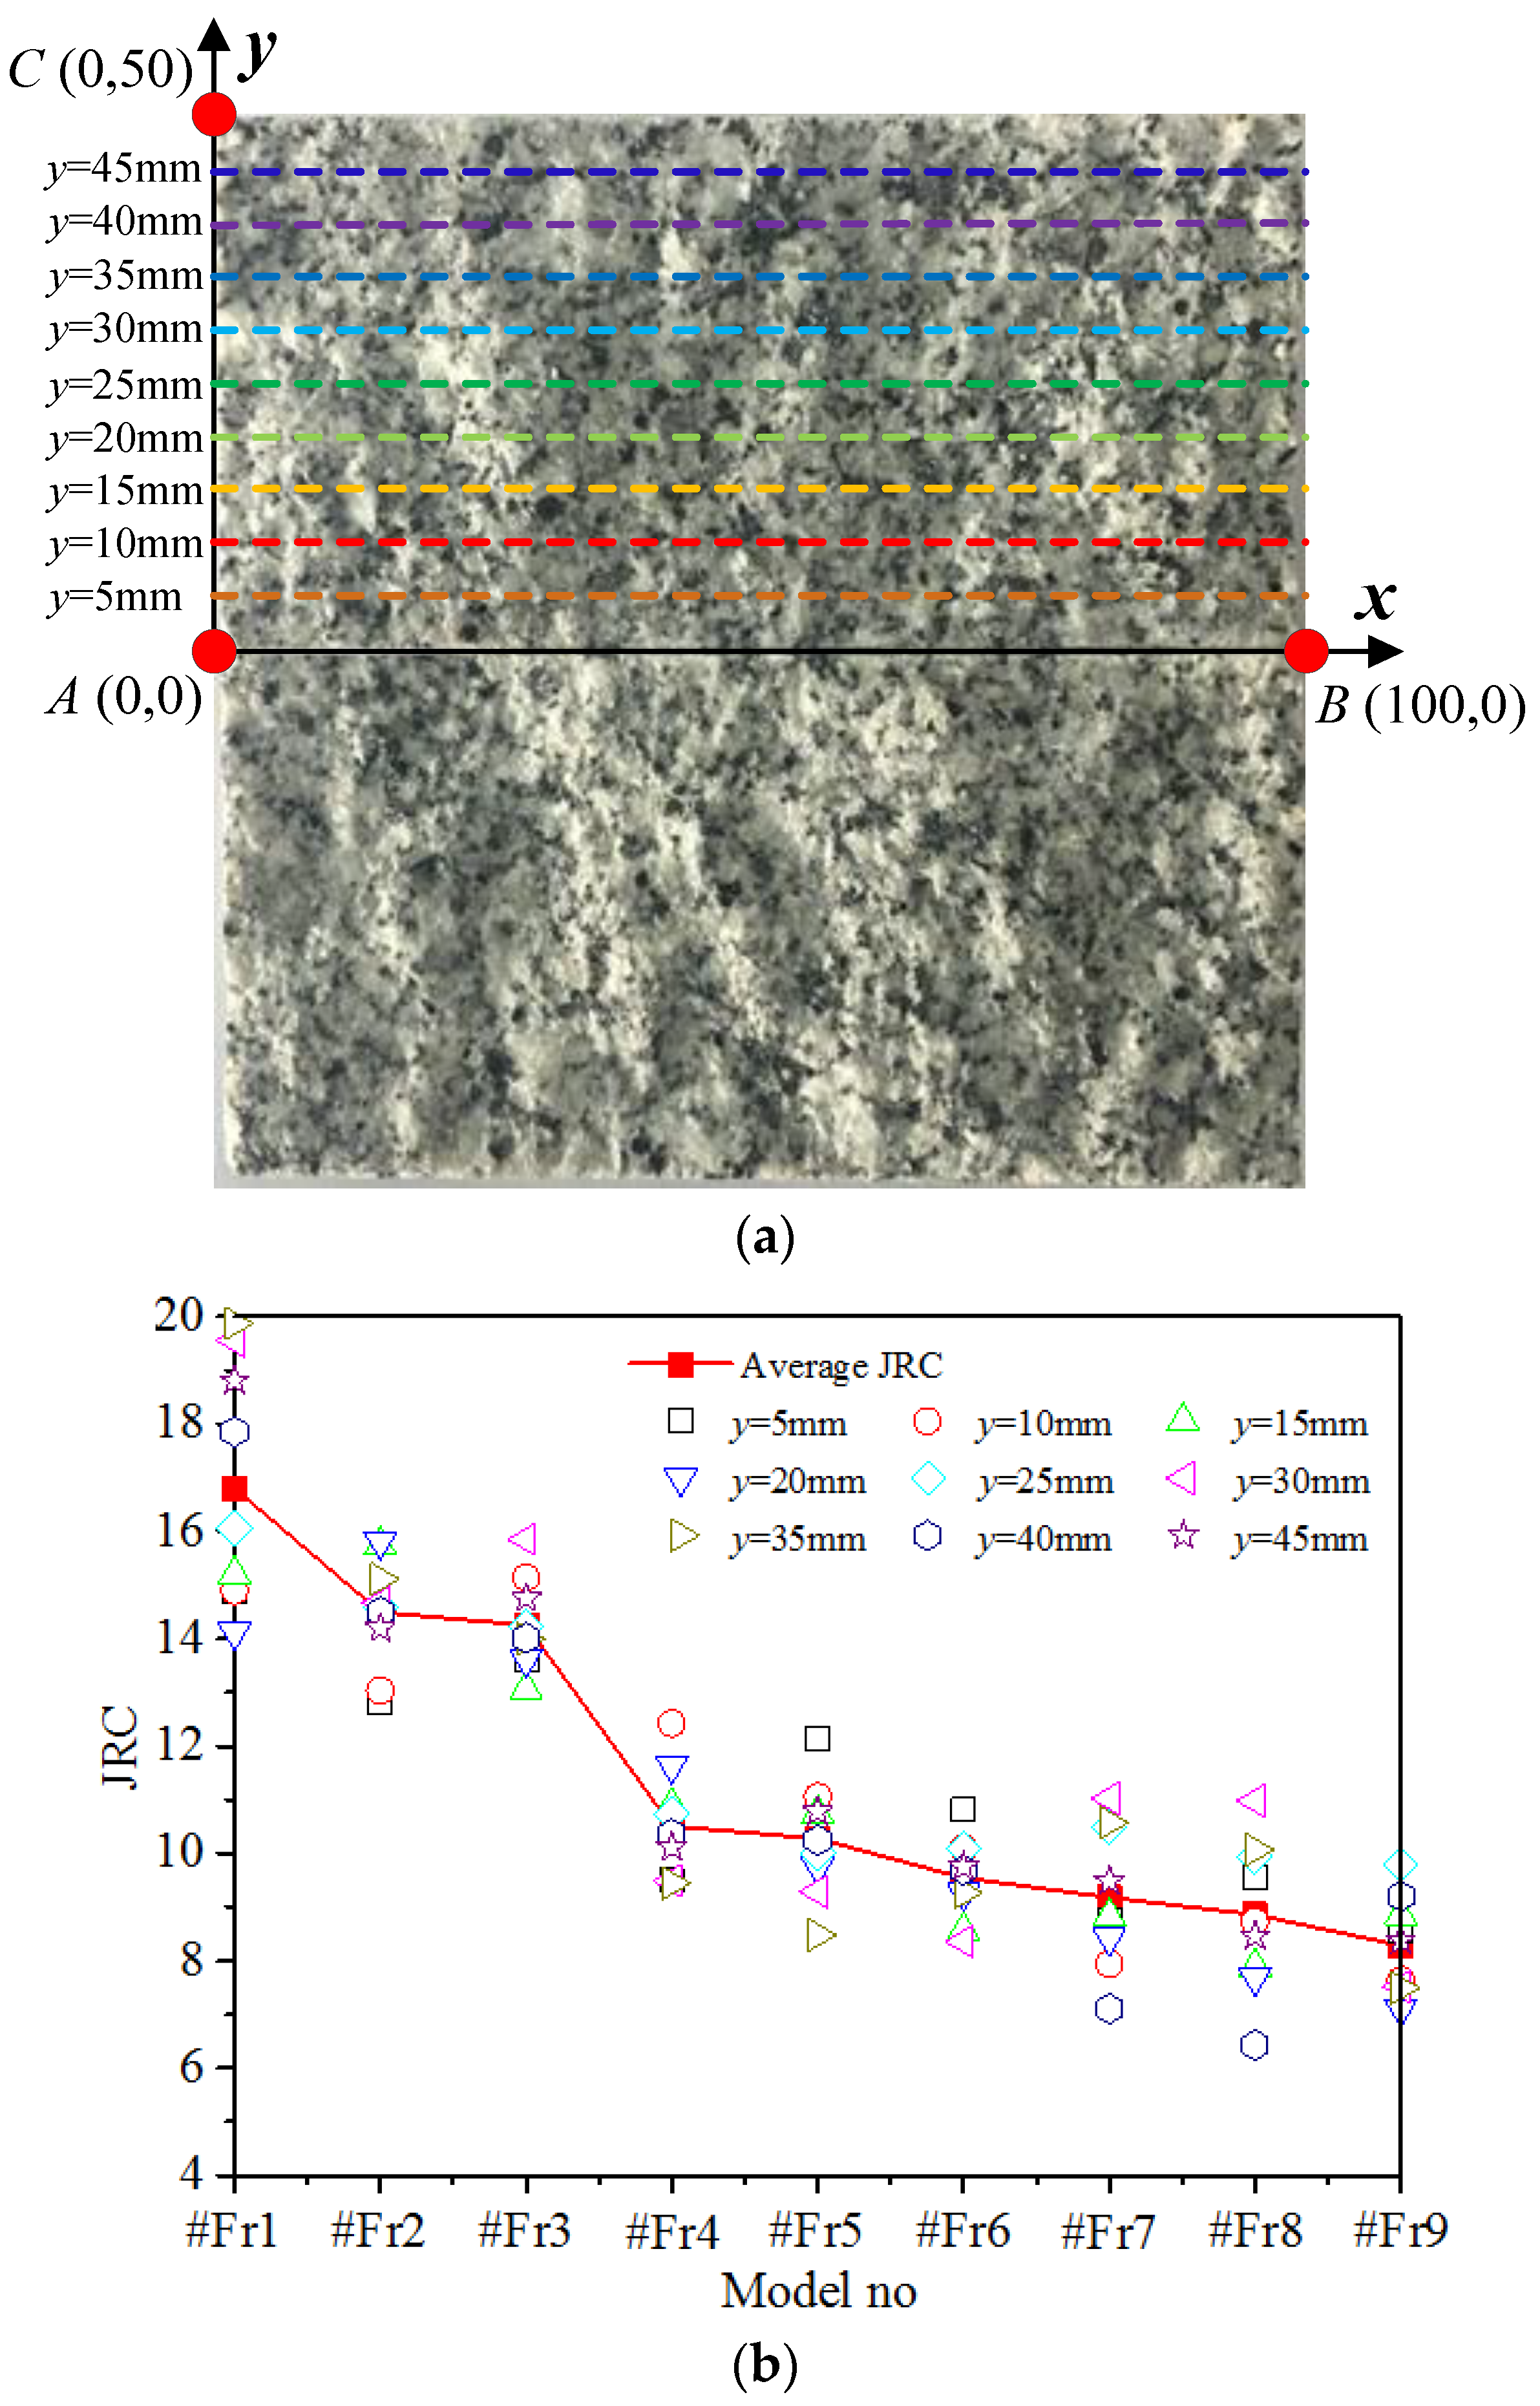
3.2. Quantification of Fracture Surface Roughness

In order to reveal the effects of fracture surface morphology on hydromechanical characteristics of rock fractures prior the flow-through experiments, accurate quantification of roughness for each rock fracture must be measured. A high-resolution noncontact 3D Laser Scanning (JR noncontact 3D Laser Scanning, Beijing Jirui Xintian Technology CO., LTD, Beijing, China), was adopted to achieve the rough rock fracture surface data, which were automatically recorded in a 0.1 mm internal in the fracture surface plane, and have a vertical (z-direction) precision of ±1 μm [8]. The 3D views of digitized surfaces of the tested fractures are displayed in Figure 3.
In order to quantitatively estimate the roughness coefficient of a fracture, nine 2D profiles were respectively extracted from each fracture by separating the fracture surface into nine equally-spaced lines parallel to the sample length direction with a constant spacing of 5 mm (Figure 4a). The JRC for fracture profile put forward by Barton and Choubey [37], which is a dimensionless factor ranged from 0 to 20, can be calculated using the following equations [38]:
JRC = 32 . 2 + 32 . 47 log Z 2 ,
Z 2 = [ 1 M ( z i 1 z i x i 1 x i ) 2 ] 1 / 2 ,
where Z2 is a dimensionless roughness parameter, which is defined as the mean square root of the first deviation of a certain 2D profile. xi and zi denote the coordinates of a profile. M represents the number of sample points along the fracture length.
During the JRC values calculation process, for each 2D profile, a point spacing of 0.25 mm, which has also been adopted by Wang et al. [39], was selected. The JRC values of these nine 2D profiles were respectively calculated and their mean value was approximately considered as the JRC value of a 3D fracture surface. Variations in the JRC values of these lithologically different rock fractures are plotted in Figure 4b. Specific values are tabulated in Table 1. Generally, the distribution of JRC of these fractures is as follows: coarse grained granite (#Fr1) > coarse grained white marble (#Fr2, #Fr3) > medium grained granite (#Fr4, #Fr5) > fine grained limestone (#Fr6, #Fr7) > fine grained red sandstone (#Fr8, #Fr9). JRC ranges from 8.284 to 16.804 for all of the fracture samples. Then, another fracture surface roughness factor Af/Ap was also calculated, defining as the ratio between the rough fracture surface area (Af) and planar surface area (Ap), in which Ap denotes the symmetrical surface area along the length direction at the half width position (1/2w) of the samples, and Af can be determined using the 3D surface profiles of the rock fractures in Figure 3. With an increase in JRC values, Af/Ap of the rough-walled fractures generally shows an ascending variation trend, as tabulated in Table 1.

3.3. Testing Procedure

The fluid flow tests of rock fracture samples were performed using the LDY-50 permeability behavior testing system (LDY-50, Haian Petroleum Research Instrument CO., LTD, Nantong, China). This system mainly comprised four units, namely, (i) water supplying system, (ii) triaxial cell clamping device, (iii) speed constant pressure pump, and (v) water measurement and collection system [40].
Before testing, the fractured rock samples were first wrapped in a Viton rubber jacket (Hebei Langfang Dacheng Sealing Material CO., LTD, Langfang, China) with the thickness of 3 mm, and mounted with a triaxial cell clamping device equipped with two porous steel platens over both ends to guarantee uniform distribution of fluid pressure over the end surfaces of the samples. By using a speed constant pressure pump, the samples were imposed with a confining pressure Pc. During the test, Pc was continuously measured using a pressure gauge with the precision of 0.01 MPa. After applying with a prescribed initial Pc of 0.5 MPa, the fracture was first saturated with distilled water which was injected at the left sample boundary with a sufficiently low pressure difference. The outlet of testing system was kept open with the atmospheric pressure. After complete saturation, the hydraulic test was repeated under various confining pressures (5 to 20 MPa in a 5 MPa interval) and various injection hydraulic pressures P (0.4–6 MPa). Here in the tests, the hydraulic gradient at the exit of the samples was regarded as zero. When the fluid flow stabilized at a given Pc and P, the volume flow rate can be measured by adopting a precise rotameter with a range of 5–3000 mL/min.
The whole hydromechanical tests were conducted at room temperature (25 °C). Additionally, the water was supposed to be incompressible, and the Reynolds number was established using water density of 1000 kg/m3 and dynamic viscosity of 0.001 Pa·s.

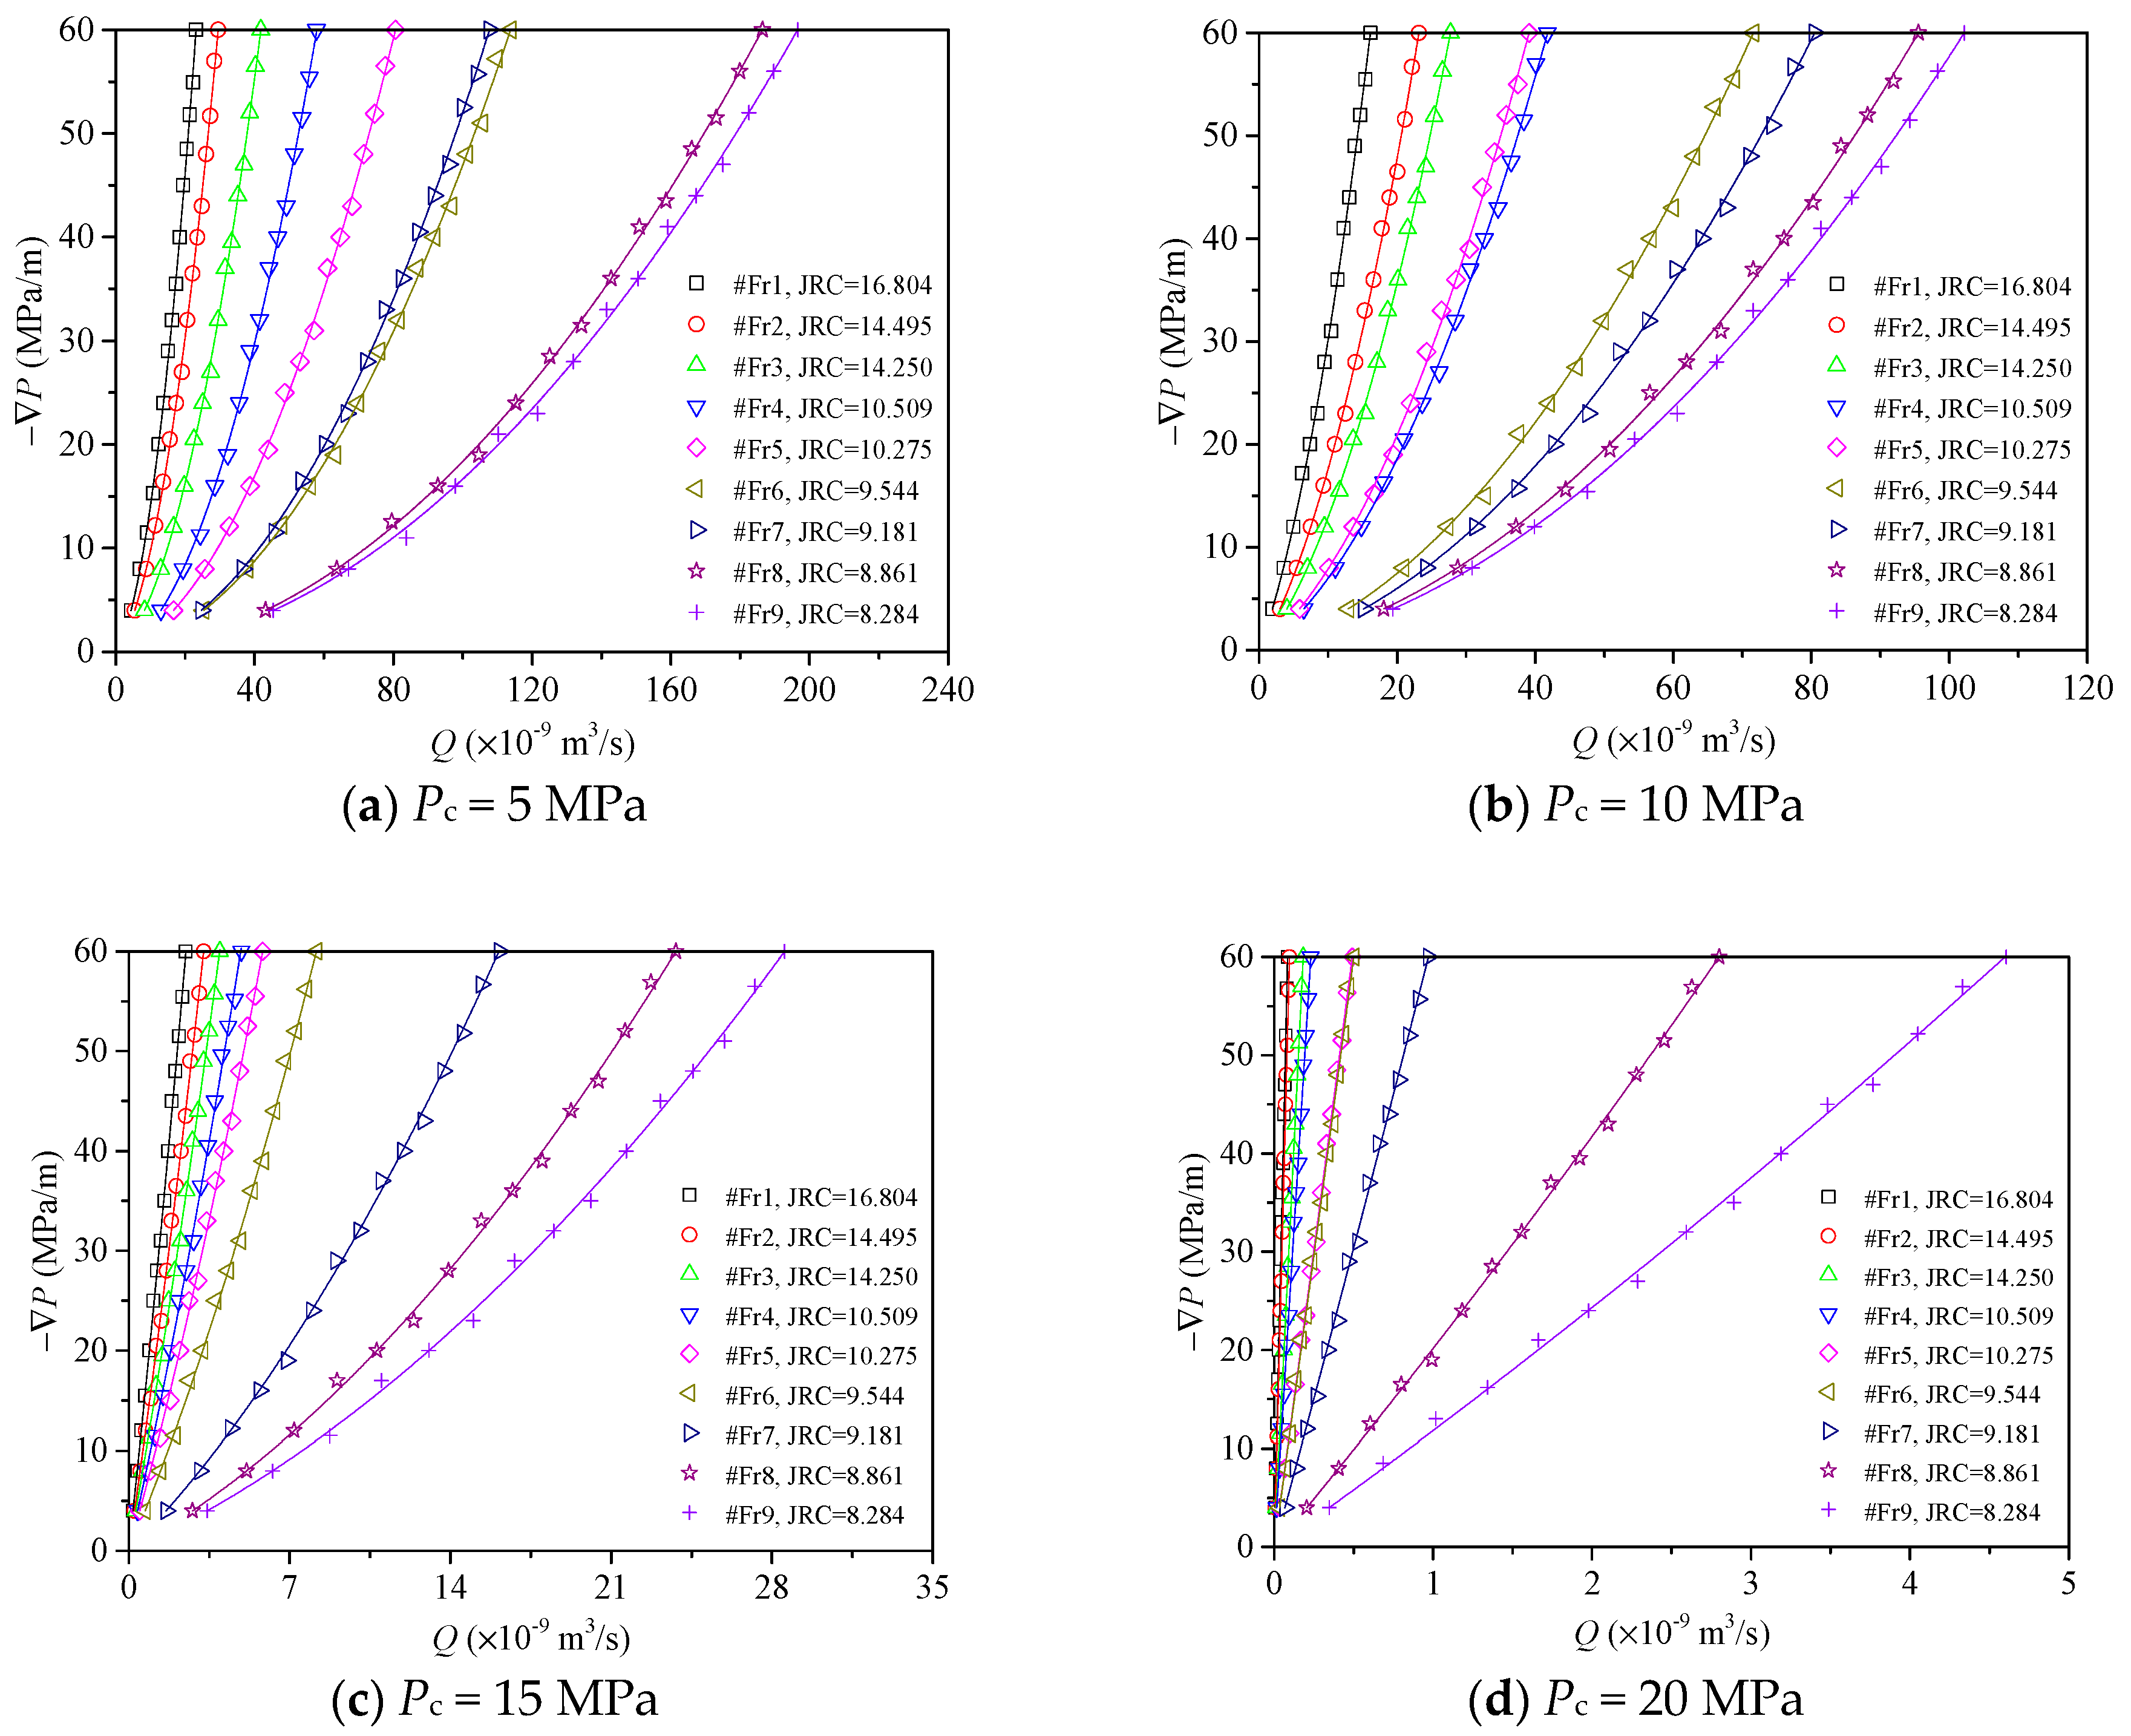
4. Results and Discussion

On account of extremely poor permeability of intact rock matrix, the water flow was supposed to migrate through the rough fractures only. Figure 5 plots the variations in volumetric flow rate versus the pressure gradient for fluid flow through the nine rough-walled fractures subjected to confining pressures ranged from 5 to 20 MPa. It shows that, the Forchheimer Equation (4) fits the raw flow data very well, with the correlation coefficient R2 values all larger than 0.99. With an increase in Pc, the slope of the P Q curves steepens, which indicates higher flow resistance owing to fracture closure under an applied Pc. Similarly, for the rock fracture with a larger JRC value, more flow energy is needed to attain a same volume flow rate, which is mainly due to tortuosity of flow paths and generation of eddy flow and backflow in a rough 3D fracture.
Based on Forchheimer Equation (4), both linear and nonlinear coefficients a and b of all test cases can be calculated, and plotted as a function of Pc in Figure 6. It indicates that coefficients a and b present a similar variation trend with Pc. In the range of Pc from 5 to 20 MPa, both coefficients increase by approximately 2–3 orders of magnitude. The increase in coefficient a is mainly as a result of fracture closure caused by the applied confining pressure. In the light of Equation (5), coefficient a can be used to reveal the changes in intrinsic permeability k and hydraulic aperture e h of the fractures. A larger value of linear coefficient a reflects a smaller e h value. Figure 7a displays the variations in e h as a function of Pc. It can be clearly observed that the hydraulic aperture undergoes a decrease in a hyperbolic form as the confining pressure increases. The variation trend of e h versus Pc has been widely reported in some other literature [5,18]. As Pc increases from 5 to 20 MPa, e h shows a decrease of 87.41–92.81% for all nine of the fractures. In addition, e h plots an ascending variation with the decreasing JRC values from model #Fr1 to #Fr9, indicating an increase of 1.52–2.96 times.
As Pc increases, the nonlinear coefficient b in the Forchheimer Equation (4) increases, while e h shows a decrease. Substantial endeavors have been devoted to establish the relation between e h and b for fluid flowing through fractured rocks subjected to different confining pressures, and a power-law equation has been proposed by Chen et al. [15]:
b = λ e h m
in which λ and m are fitting coefficients, which are affected by the fracture surface geometries.
Figure 7b shows the best-fitted curves using Equation (12), with the regression coefficients λ and m tabulated in Table 2. Obviously, the power-law function can provide a good fitting quality to the raw experimental data. For all nine of the rock fractures, with an increase in the JRC values, the coefficient λ shows an increase from 5.713 × 10¹⁸ to 11.459 × 10¹⁸, but the coefficient m generally keeps stable within a small range of 2.783–2.923. Notably, from Figure 7b, for rock fractures with a same e h , the nonlinear coefficient b varies, which might be attributed to different morphologies of rock fracture surfaces. The fluctuations of coefficients λ and m are due to different contact patterns of the fracture surfaces under an applied confining pressure.
Based on the linear and nonlinear fitting coefficients a and b in Equation (4), the factor E in Equation 7 was calculated. Figure 8 plots the variations in factor E in terms of the Reynolds number. It indicates that, with an increase in Re, the factor E all experiences an increase trend. It can be found that, for Pc = 5 MPa (Figure 8a), all the factor E values are larger than 0.4, which indicates that fluid flowing through the single rock fractures under the present hydraulic head differences shows significant nonlinearity. However, with an increase in Pc, the factor E declines, especially for Pc = 20 MPa, where all the E values are lower than 0.15. At this time, the contribution of the linear terms to the total pressure gradient becomes remarkable.
According to some previous reports [8,17,34], a critical E value of 0.1 was defined to classify the fluid flow regimes. Here, this value is assumed to mark a transition point where genuine turbulence occurs. Thus, at each prescribed Pc, using Equation (8), Rec can be determined. Figure 9 depicts the variations in Rec as a function of Pc and JRC values. As Pc increases, Rec exhibits an increasing trend. Taking fracture #Fr3 as an example, Rec values corresponding to Pc = 10, 15 and 20 MPa are 0.0361, 0.0487 and 0.0580, respectively, indicating increases of 0.873, 1.525 and 2.011 times over Rec value of 0.0193 for Pc = 5 MPa. For single fractures, e h sharply decreases responding to the increasing Pc. A small variation in eh leads to a large change in the flow velocity and Re as a result of the fact that Q is proportional to e h 3 , which would then influence the nonlinearity of flow. However, as JRC of the fractures increases, Rec decreases due to the variation in flow direction or rate along the flowing paths as a consequence of asperity contacts or obstructions and the localized vorticity formed by the inertial effects of flow. The flow nonlinearity in fractures can be caused with the increase of surface roughness [15,41]. Generally, the magnitude of Rec (0.0125–0.0749) is in accordance with some previous studies [42,43] but presents a large difference with the Rec ranges in some other literature [8,17]. This may ascribe to the fact that Rec ranges for flow transition in rock fractures vary with the surface roughness, applied stress, as well as the rock type [33].
Apparent transmissivity is the product of permeability and cross-sectional area of rock fractures. If the nonlinear deviation term (bQ2) is inappreciable and can be ignored, T would be the same with the true transmissivity T0 achieved from the Darcy’s law. Based on Equation (9), apparent transmissivities for all test cases were calculated using the raw flow data. Figure 10 shows the changes in T as a function of the pressure gradient. It indicates that T is not a fixed value but experiences a descending variation trend as the pressure gradient increases, and the decrease rate gradually diminishes, which further validates the deviation of flow from linearity. Generally, the reduction extent of T with P is more significant for the fracture with a small JRC value. For rock fractures subjected to the same Pc and P , T decreases with an increase in the JRC values. The hydraulic characteristics for rough-walled rock fractures depend largely on the surface roughness geometries, and the flow paths may become more channeling and tortuous in rougher fractures [14,41]. Additionally, T also exhibits a decrease with Pc. As P increases, the decrease extent of T is more remarkable for a small Pc (e.g., 5 and 10 MPa) than that for a large Pc (15 and 20 MPa). This is due to the fact that the variation in transmissivity is essentially associated with the changes in the hydraulic aperture of the fractures, and e h exhibits a sensitive reduction with an increase in the applied Pc.

5. Conclusions

This study experimentally explores the flow nonlinearity through real rock fractures. First, nine 3D rough-walled fractures were artificially produced from a great variety of rock types with different lithologies including granite, marble, limestone and sandstone. Then, a series of hydromechanical laboratory experiments using the rough fractures were carried out with respect to various hydraulic pressures (0.4–6.0 MPa) and various confining pressures (5–20 MPa). The nonlinear flow behaviors, hydraulic aperture, critical Reynolds number and transmissivity were systematically estimated.
By applying a high-resolution noncontact 3D Laser Scanning, digitized fracture surfaces of the nine rough-walled fractures of a wide range of lithologies were achieved. The coarse grained granite samples possess the largest JRC values, which is followed by the coarse grained white marble, medium grained granite, fine grained limestone, while the fine grained red sandstone ones are relatively smooth. With an increase in JRC values, the parameter Af/Ap (fracture surface area/planar surface area) shows an ascending variation.
The relationships between pressure gradient and the volume flow rate of rough rock fractures are demonstrated to be nonlinear. With increasing confining pressure from 5 to 20 MPa, both linear coefficient a and nonlinear coefficient b in the Forchheimer’s law increase by about 2–3 orders of magnitude, while the hydraulic aperture shows a downward trend of a hyperbola shape by 87.41–92.81%. As the JRC values increase, the hydraulic aperture also decreases. A power-law relationship between the hydraulic aperture and nonlinear coefficient was proposed.
As the Reynolds number increases, the factor E increases. The critical Reynolds number exhibits an increasing trend with the confining pressure while it decreases with JRC values due to channeling and tortuous flow paths in rougher fractures. The magnitude of critical Reynolds number (0.0125–0.0749) agrees with some previous reports. The transmissivity decreases with increasing pressure gradient, but the decrease rate diminishes. Additionally, the transmissivity also decreases with both the confining pressures and JRC values, and the extent of the decrease for small confining pressures is more significant than the decrease for larger confining pressures.

Author Contributions

Q.Y. and H.J. conceived and designed the experiments; L.H. and D.Z. performed the experiments; Q.Y. and H.J. analyzed the data; Q.Y. wrote the paper.

Funding

This research was funded by [the Fundamental Research Funds for the Central Universities, China] grant number [2018QNA32].

Conflicts of Interest

The authors declare no conflicts of interest.

References

  1. Berkowitz, B.; Miller, C.T.; Parlange, M.B.; Hassanizadeh, S.M. Characterizing flow and transport in fractured geological media: A review. Adv. Water Resour. 2002, 25, 861–884. [Google Scholar] [CrossRef]
  2. Crandall, D.; Ahmadi, G.; Smith, D.H. Computational modeling of fluid flow through a fracture in permeable rock. Transp. Porous Media 2010, 84, 493–510. [Google Scholar] [CrossRef]
  3. Ranjith, P.G.; Darlington, W. Nonlinear single-phase flow in real rock joints. Water Resour. Res. 2007, 43, 146–156. [Google Scholar] [CrossRef]
  4. Yin, Q.; Jing, H.; Su, H.; Wang, H. CO2 permeability analysis of caprock containing a single fracture subject to coupled thermal-hydro-mechanical effects. Math. Probl. Eng. 2017, 46, 1–13. [Google Scholar]
  5. Zhou, J.Q.; Hu, S.H.; Fang, S.; Chen, Y.F.; Zhou, C.B. Nonlinear flow behavior at low Reynolds numbers through rough-walled fractures subjected to normal compressive loading. Int. J. Rock Mech. Min. Sci. 2015, 80, 202–218. [Google Scholar] [CrossRef]
  6. Li, B.; Jiang, Y.; Koyama, T.; Jing, L.; Tanabashi, Y. Experimental study of the hydro-mechanical behavior of rock joints using a parallel-plate model containing contact areas and artificial fractures. Int. J. Rock Mech. Min. Sci. 2008, 45, 362–375. [Google Scholar] [CrossRef] [Green Version]
  7. Min, K.B.; Rutqvist, J.; Tsang, C.F.; Jing, L. Stress-dependent permeability of fractured rock masses: A numerical study. Int. J. Rock Mech. Min. Sci. 2004, 41, 1191–1210. [Google Scholar] [CrossRef]
  8. Yin, Q.; Ma, G.W.; Jing, H.W.; Wang, H.D.; Su, H.J.; Liu, R.C. Hydraulic properties of 3D rough-walled fractures during shearing: An experimental study. J. Hydrol. 2017, 555, 169–184. [Google Scholar] [CrossRef]
  9. Babadagli, T.; Ren, X.; Develi, K. Effects of fractal surface roughness and lithology on single and multiphase flow in a single fracture: An experimental investigation. Int. J. Multiph. Flow 2015, 68, 40–58. [Google Scholar] [CrossRef]
  10. Wang, Z.; Xu, C.; Dowd, P. A modified cubic law for single-phase saturated laminar flow in rough rock fractures. Int. J. Rock Mech. Min. Sci. 2018, 103, 107–115. [Google Scholar] [CrossRef]
  11. Watanabe, N.; Hirano, N.; Tsuchiya, N. Diversity of channeling flow in heterogeneous aperture distribution inferred from integrated experimental-numerical analysis on flow through shear fracture in granite. J. Geophys. Res. Solid Earth 2009, 114, BO4208. [Google Scholar] [CrossRef]
  12. Firdaouss, M.; Guermond, J.L.; Quéré, P.L. Nonlinear corrections to Darcy’s law at low reynolds numbers. J. Fluid Mech. 2000, 343, 331–350. [Google Scholar] [CrossRef]
  13. Konzuk, J.S.; Kueper, B.H. Evaluation of cubic law based models describing single-phase flow through a rough-walled fracture. Water Resour. Res. 2004, 40, 389–391. [Google Scholar] [CrossRef]
  14. Xiong, X.; Li, B.; Jiang, Y.; Koyama, T.; Zhang, C. Experimental and numerical study of the geometrical and hydraulic characteristics of a single rock fracture during shear. Int. J. Rock Mech. Min. Sci. 2011, 48, 1292–1302. [Google Scholar] [CrossRef]
  15. Chen, Y.F.; Zhou, J.Q.; Hu, S.H.; Hu, R.; Zhou, C.B. Evaluation of Forchheimer equation coefficients for non-Darcy flow in deformable rough-walled fractures. J. Hydrol. 2015, 529, 993–1006. [Google Scholar] [CrossRef]
  16. Durham, W.B.; Bonner, B.P. Self-propping and fluid flow in slightly offset joints at high effective pressures. J. Geophys. Res. Solid Earth 1994, 99, 9391–9399. [Google Scholar] [CrossRef]
  17. Javadi, M.; Sharifzadeh, M.; Shahriar, K.; Mitani, Y. Critical Reynolds number for nonlinear flow through rough-walled fractures: The role of shear processes. Water Resour. Res. 2014, 50, 1789–1804. [Google Scholar] [CrossRef] [Green Version]
  18. Zhang, Z.Y.; Nemcik, J. Fluid flow regimes and nonlinear flow characteristics in deformable rock fractures. J. Hydrol. 2013, 447, 139–151. [Google Scholar] [CrossRef]
  19. Zimmerman, R.W.; Bodvarsson, G.S. Hydraulic conductivity of rock fractures. Transp. Porous Media 1996, 23, 1–30. [Google Scholar] [CrossRef]
  20. Leung, C.T.O.; Zimmerman, R.W. Estimating the hydraulic conductivity of two-dimensional fracture networks using network geometric properties. Transp. Porous Media 2012, 93, 777–797. [Google Scholar] [CrossRef]
  21. Liu, R.C.; Li, B.; Jiang, Y.J.; Yu, L.Y. A numerical approach for assessing effects of shear on equivalent permeability and nonlinear flow characteristics of 2-D fracture networks. Adv. Water Resour. 2018, 111, 289–300. [Google Scholar] [CrossRef]
  22. Yin, Q.; Jing, H.; Liu, R.; Ma, G.; Yu, L.; Su, H. Experimental study on stress-dependent nonlinear flow behavior and normalized transmissivity of real rock fracture networks. Geofluids 2018. [Google Scholar] [CrossRef]
  23. Raven, K.G.; Gale, J.E. Water flow in a natural rock fracture as a function of stress and sample size. J. Steroid Biochem. 1985, 22, 251–261. [Google Scholar] [CrossRef]
  24. Esaki, T.; Du, S.; Mitani, Y.; Ikusada, K.; Jing, L. Development of a shear-flow test apparatus and determination of coupled properties for a single rock joint. Int. J. Rock Mech. Min. Sci. 1999, 36, 641–650. [Google Scholar] [CrossRef]
  25. Rong, G.; Yang, J.; Cheng, L.; Zhou, C.B. Laboratory investigation of nonlinear flow characteristics in rough fractures during shear process. J. Hydrol. 2016, 541, 1385–1394. [Google Scholar] [CrossRef]
  26. Bandis, S.C.; Lumsden, A.C.; Barton, N.R. Fundamentals of rock joint deformation. Int. J. Rock Mech. Min. Sci. 1983, 20, 249–268. [Google Scholar] [CrossRef]
  27. Olsson, R.; Barton, N. An improved model for hydromechanical coupling during shearing of rock joints. Int.J. Rock Mech. Min. Sci. 2001, 38, 317–329. [Google Scholar] [CrossRef]
  28. Liu, R.C.; Yu, L.Y.; Jiang, Y.J. Quantitative estimates of normalized transmissivity and the onset of nonlinear fluid flow through rough rock fractures. Rock Mech. Rock Eng. 2017, 50, 1063–1071. [Google Scholar] [CrossRef]
  29. Witherspoon, P.A.; Wang, J.S.Y.; Iwai, K.; Gale, J.E. Validity of Cubic Law for fluid flow in a deformable rock fracture. Water Resour. Res. 1980, 16, 1016–1024. [Google Scholar] [CrossRef] [Green Version]
  30. Yeo, I.W.; Ge, S. Solute dispersion in rock fractures by non-Darcian flow. Geophys. Res. Lett. 2001, 28, 3983–3986. [Google Scholar] [CrossRef]
  31. Yin, Q.; Jing, H.; Ma, G.; Su, H.; Liu, R. Investigating the roles of included angle and loading condition on the critical hydraulic gradient of real rock fracture networks. Rock Mech. Rock Eng. 2018. [Google Scholar] [CrossRef]
  32. Cherubini, C.; Giasi, C.I.; Pastore, N. Bench scale laboratory tests to analyze non-linear flow in fractured media. Hydrol. Earth Syst. Sci. Discuss. 2012, 9, 2511–2522. [Google Scholar] [CrossRef]
  33. Liu, R.C.; Li, B.; Jiang, Y.J. Critical hydraulic gradient for nonlinear flow through rock fracture networks: The roles of aperture, surface roughness, and number of interactions. Adv. Water Resour. 2016, 88, 53–65. [Google Scholar] [CrossRef]
  34. Zimmerman, R.W.; AL-Yaarubi, A.; Pain, C.C.; Grattoni, C.A. Non-linear regimes of fluid flow in rock fractures. Int. J. Rock Mech. Min. Sci. 2004, 41, 163–169. [Google Scholar] [CrossRef]
  35. Zeng, Z.; Grigg, R. A criterion for non-Darcy flow in porous media. Transp. Porous Media 2006, 63, 57–69. [Google Scholar] [CrossRef]
  36. Xia, C.C.; Qian, X.; Lin, P.; Xiao, W.M.; Gui, Y. Experimental investigation of nonlinear flow characteristics of real rock joints under different contact conditions. J. Hydraul. Eng. 2017, 143, 04016090. [Google Scholar] [CrossRef]
  37. Barton, N.; Choubey, V. The shear strength of rock joints in theory and practice. Rock Mech. Felsmechanik Mec. Roches 1977, 10, 1–54. [Google Scholar] [CrossRef]
  38. Tse, R.; Cruden, D.M. Estimating joint roughness coefficients. Int. J. Rock Mech. Min. Sci. Geomech. Abstr. 1979, 16, 303–307. [Google Scholar] [CrossRef]
  39. Wang, G.; Zhang, X.; Jiang, Y.; Wu, X.; Wang, S. Rate-dependent mechanical behavior of rough rock joints. Int. J. Rock Mech. Min. Sci. 2016, 83, 231–240. [Google Scholar] [CrossRef]
  40. He, L.; Yin, Q.; Jing, H. Laboratory investigation of granite permeability after high-temperature exposure. Processes 2018, 6, 36. [Google Scholar] [CrossRef]
  41. Wang, M.; Chen, Y.F.; Ma, G.W.; Zhou, J.Q.; Zhou, C.B. Influence of surface roughness on nonlinear flow behaviors in 3D self-affine rough fractures: Lattice Boltzmann simulations. Adv. Water Resour. 2016, 96, 373–388. [Google Scholar] [CrossRef]
  42. Brush, D.J.; Thomson, N.R. Fluid flow in synthetic rough-walled fractures: Navier-Stokes, Stokes, and local cubic law simulations. Water Resour. Res. 2003, 39, 1037–1041. [Google Scholar] [CrossRef]
  43. Radilla, G.; Nowamooz, A.; Fourar, M. Modeling non-Darcian single- and two-phase flow in transparent replicas of rough-walled rock fractures. Transp. Porous Media 2013, 98, 401–426. [Google Scholar] [CrossRef]
Figure 1. Intact cylindrical samples with various lithologies.
Processes 06 00149 g001
Figure 2. Preparation of rough-walled rock fractures using tensile splitting of an intact cylindrical sample.
Processes 06 00149 g002
Figure 3. 3D surface profiles of fracture surfaces of the nine samples, (ai) respectively corresponding to #Fr1–#Fr9, (all dimensions are in units of mm).
Processes 06 00149 g003
Figure 4. (a) Z2 values calculation, and (b) JRC values distribution of the tested rock.
Processes 06 00149 g004
Figure 5. Relations between volume flow rate and pressure gradient of the rough-walled fractures.
Processes 06 00149 g005
Figure 6. Variations of (a) linear coefficient a, and (b) nonlinear coefficient b of rough-walled fractures with the confining pressure.
Processes 06 00149 g006
Figure 7. (a) variations in hydraulic aperture e h with confining pressure, and (b) regression analysis of nonlinear coefficient b against e h .
Processes 06 00149 g007
Figure 8. Relationships between factor E and the Reynolds number.
Processes 06 00149 g008
Figure 9. Critical Reynolds number Rec of rough-walled fractures versus the confining pressure.
Processes 06 00149 g009
Figure 10. Relationships between pressure gradient and the transmissivity T.
Processes 06 00149 g010
Table 1. Rough characteristics of the tested model fractures.
Model NoRock TypeAverage JRC ValuesAf/Ap
#Fr1Coarse grained granite16.8041.050
#Fr2Coarse grained white marble14.4951.039
#Fr3Coarse grained white marble14.2501.038
#Fr4Medium grained granite10.5091.023
#Fr5Medium grained granite10.2751.022
#Fr6Fine grained limestone9.5441.018
#Fr7Fine grained limestone9.1811.019
#Fr8Fine grained red sandstone8.8611.018
#Fr9Fine grained red sandstone8.2841.017
JRC denotes fracture roughness coefficient; Af and Ap respectively denote the overall rough surface area and planar surface area of fractures.
Table 2. Best-fitted coefficients λ and m using Equation (12).
Model NoAverage JRC ValuesCoefficient λ (×1018)Coefficient m
#Fr116.80411.4592.863
#Fr214.49510.3412.803
#Fr314.2509.3412.834
#Fr410.5098.9612.842
#Fr510.2758.1492.779
#Fr69.5448.5092.868
#Fr79.1817.9932.923
#Fr88.8617.9422.897
#Fr98.2845.7132.783

