1. Introduction
Shale oil is distinguished by its liquid hydrocarbons, which are found within organic-rich rock formations, primarily in both free and adsorbed states [
1]. This distinguishes it from conventional oil, which is predominantly found in larger pores and cracks. Unlike conventional oil, shale oil is distributed throughout the minuscule pores of the rock matrix, characterized by a distribution of microfine particles. This distinctive storage mechanism introduces significant technical challenges for the extraction of shale oil [
2,
3]. The extraction difficulties primarily stem from the notably low permeability of shale, which restricts the natural movement of oil and gas towards the wellhead. Additionally, the geological complexity and diversity found in shale reservoirs, often characterized by unpredictable stratigraphic fractures, add layers of complication to drilling activities. The intricate geological formations, coupled with the shale oil reservoirs’ markedly low permeability, necessitate the formulation of a meticulously crafted development strategy for the extraction of resources on a large scale. A comprehensive grasp of the fluid dynamics and pivotal principles that regulate shale oil flow is of paramount importance in the creation of such a strategy.
The dynamics governing the flow of shale oil are particularly complex, and researchers have yet to reach a consensus understanding of the seepage mechanism. Currently, numerous researchers have employed laboratory experiments and numerical simulations to investigate the flow patterns in tight oil and gas reservoirs. Laboratory experiments focusing on flow characteristics generally use either steady-state or transient methods [
4,
5,
6,
7]. Ren et al. [
8] applied the steady-state method and capillary equilibrium technique to accurately delineate the seepage characteristics of tight oil. Wang et al. [
9] investigated the microscale pore structure and seepage mechanism of shale oil reservoirs using laboratory physical experiments and digital coring techniques. Chen et al. [
10] investigated the microporous structure and seepage dynamics of shale oil reservoirs based on a one-dimensional transient seepage model and formulated an experimental approach to analyze liquid permeability and the initiation pressure gradient under different fracture development conditions. Li [
11] developed a mathematical model that accounts for Fick diffusion, adsorption, and desorption in shale oil flow. Zhao et al. [
12] realized the accurate measurement of flow rate using a microflow meter and established a series of core seepage curve test methods for tight oil reservoirs. Ran et al. [
13] proposed a new simulation method for two-phase shale oil reservoirs that takes into account the effects of the nanoscale pore structure, including the phase change characteristics of oil and gas in shale nanopores and the processes of dissolved gas escape and aggregation. Li et al. [
14] developed a numerical model of fluid flow through shale pores using computed tomography (CT) scanning to reconstruct the shale pore structure and consider the boundary slip effect at the micro- and nanopore scales. The model demonstrated a high degree of fit with the experimental data and was able to reasonably characterize the nonlinear seepage of shale oil. In their study of non-Darcy flow in tight reservoirs, Diwu et al. [
15] proposed a modified pressure superposition principle that accounts for the threshold pressure gradient (TPG) and provides a mathematical proof.
In addition, molecular simulation techniques have also been applied to the study of shale oil flow laws. Zhang [
16] and Sui [
17] used molecular simulation methods to refine the diffusion model of shale oil and then investigated the effects of viscosity and density on the flowability of shale oil. Shale oil and gas are complex mixtures of alkanes, aromatic hydrocarbons, sulfur-containing compounds, nitrogen-containing compounds, oxygen-containing compounds, and more. In molecular simulations, hydrocarbon components are typically represented by n-alkanes. For example, methane is commonly used to represent shale gas, while liquid alkanes such as n-heptane and n-octane are used to represent shale oil [
18]. Xiong et al. [
19] investigated the fugitive state of methane in quartz nanopores. They found that methane molecules formed adsorption phases near the pore walls due to pore wall forces. An increase in pressure and a decrease in pore diameter caused an increase in adsorption, while an increase in temperature caused a decrease in adsorption. This was attributed to the transition between high energy adsorption sites and low energy adsorption sites. Despite these advances, it remains a challenge to accurately account for all factors that influence shale oil flowability, whether through numerical or molecular simulations. Laboratory core experiments provide the most realistic representation of reservoir flow capacity. However, the inherently low permeability of shale reservoirs, typically less than 0.1 mD, poses significant challenges to conventional flow experimental methods, often resulting in inaccurate flow rate measurements and monitoring—a critical issue faced by many researchers in the field.
In recent years, nuclear magnetic resonance technology has attracted considerable attention for its empirical contributions to the study of various reservoir types, including sandstones, carbonates, unconventional dense sandstones, and coal seams. Its application extends to shale oil core experiments as well. Liu et al. [
20] employed a combination of core centrifugation and NMR testing to investigate the mechanism of pore fluid imbibition under varying pressure conditions. This research shed light on the influence of wettability on imbibition processes. Li et al. [
21] utilized NMR technology to examine the impact of fissures on the efficiency of CO
2 throughput recovery in shale oil reservoirs. Ma et al. [
22] employed NMR techniques to investigate the spontaneous imbibition and absorption patterns in the shale oil reservoirs of the Luchaogou Formation within the Jimusar Depression. Their findings were integrated with analyses of wettability and the characteristics of sweet spot reservoirs. Cao et al. [
23] demonstrated that the injection of carbon dioxide can enhance recovery in tight reservoir development. To this end, they conducted carbon dioxide immersion experiments using natural tight cores with varying matrix permeabilities and artificial fracture conditions. The authors employed nuclear magnetic resonance technology to explore changes in the pore size range of oil-producing holes and the distribution of residual oil. The results indicated that increasing the permeability can enhance crude oil recovery. Nevertheless, it can also result in a reduction in the pressure of CO
2 within nanoscale pores due to a decrease in replacement pressure.
Furthermore, numerous scholars [
24,
25,
26,
27,
28] have conducted research into the imbibition and suction characteristics of shale oil reservoirs, microscopic fluid transport within cores, and the impact of surface activators on the imbibition and suction efficiency. NMR technology has emerged as a pivotal tool for studying the storage characteristics and imbibition laws of shale oil, as evidenced by the works of the aforementioned researchers. This dominance can be attributed to the limitations of conventional laboratory flow experimental methods, which involve fluid displacement through core grippers and face challenges due to the extremely low permeability of shale cores. Oilfield development practice has demonstrated that utilizing the imbibition absorption effect of capillary pressure in combination with differential pressure drive helps to improve the development effect [
29]. Consequently, the effective exertion of the imbibition absorption and driving effect between matrix and fracture and the increase in the degree of matrix mobilization based on the consideration of matrix and fracture coupled reservoir characteristics has become the key to improving the development effect of shale oil.
In the context of shale oil exploitation, the comprehension of the flow dynamics within the shale matrix is of crucial importance. Stratifications serve as primary conduits for oil and gas flow in shale matrix reservoirs. The degree of development of these stratifications directly influences the storage, transportation, and production performance of shale oil. Furthermore, the implementation of hydraulic fracturing and the injection of proppant can effectively enhance the permeability of shale oil reservoirs and enhance the capacity of crude oil flow [
30,
31]. Therefore, an in-depth investigation of the flow characteristics of shale oil across different developmental stages of stratification is of both theoretical and practical importance for better understanding and optimization of shale oil development.
The objective of this paper is to introduce a novel experimental method that integrates NMR technology to investigate the flowability of shale oil in a shale matrix. The flowability of shale oil can be identified based on four aspects: the degree of stratification development, injection pressures, the presence or absence of natural fractures, and the use of proppant. This provides a scientific basis and guidance for large-scale shale oil production.
2. Experiment Apparatus and Materials
2.1. Experimental Materials
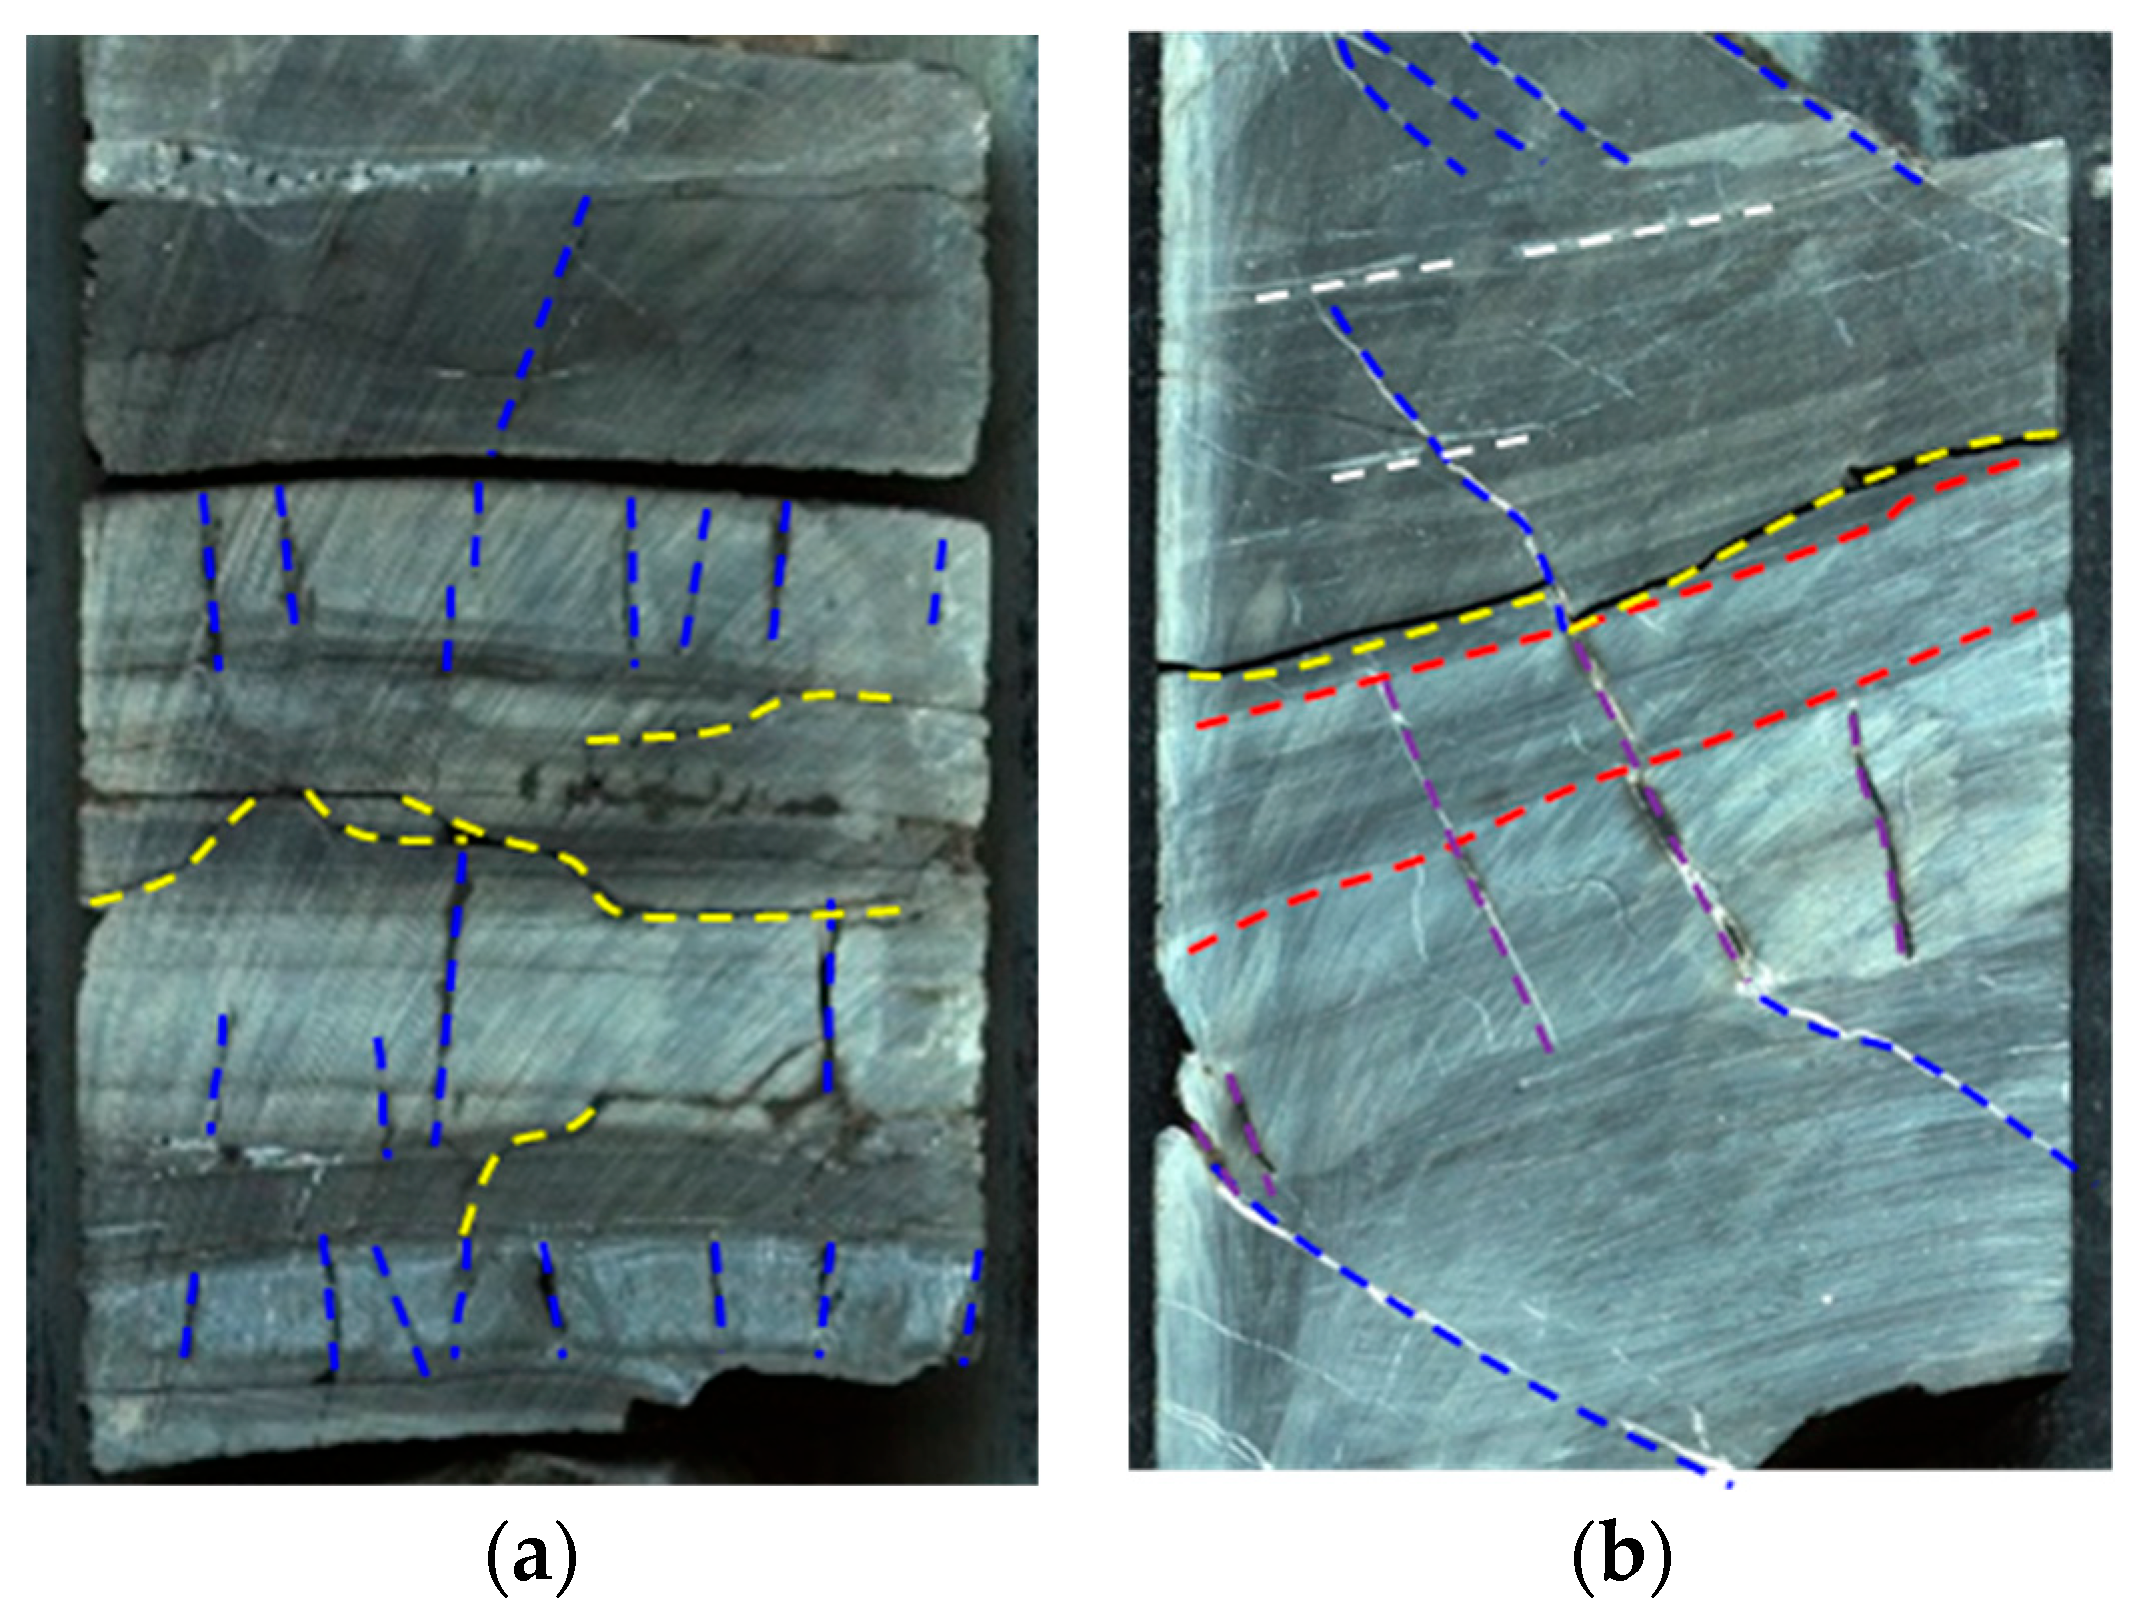
The cores presented in this paper were taken from the Funing II section of the North Jiangsu Basin, China. The depositional period of this block is associated with the basin argillic evolution stage. The lake basin exhibits a relatively gentle slope, with minimal elevation differences surrounding it. The basin maintains a pattern of being high in the west and low in the east. The deposition during this period was primarily in the form of lake-phase deposits. The end of the Funing Formation marks the conclusion of a series of tectonic activities that commenced with the Wubao event. This event brought an end to the depositional stage of the unified depression of the Great Lake Basin in the North Jiangsu Basin. Consequently, the basin was subdivided into a number of small, northeast-oriented, ski-shaped depressions that established the fundamental configuration of the basin. The Gaoyou depression represents a significant oil and gas-bearing depression in the southern region of the North Jiangsu Basin. It exhibits an overall northeast–southwest trend and is distinguished by a pronounced gradient in the south and a relatively gradual slope in the north. The Zhenwu and Wubao fractures in the southern boundary exert control over the sedimentary and depositional characteristics of the Gaoyou depression. The reservoir lithology in this block is primarily composed of dark gray mudstone, gray mudstone with cloud, and gray textured shale, as well as sandy textured mudstone (as depicted in
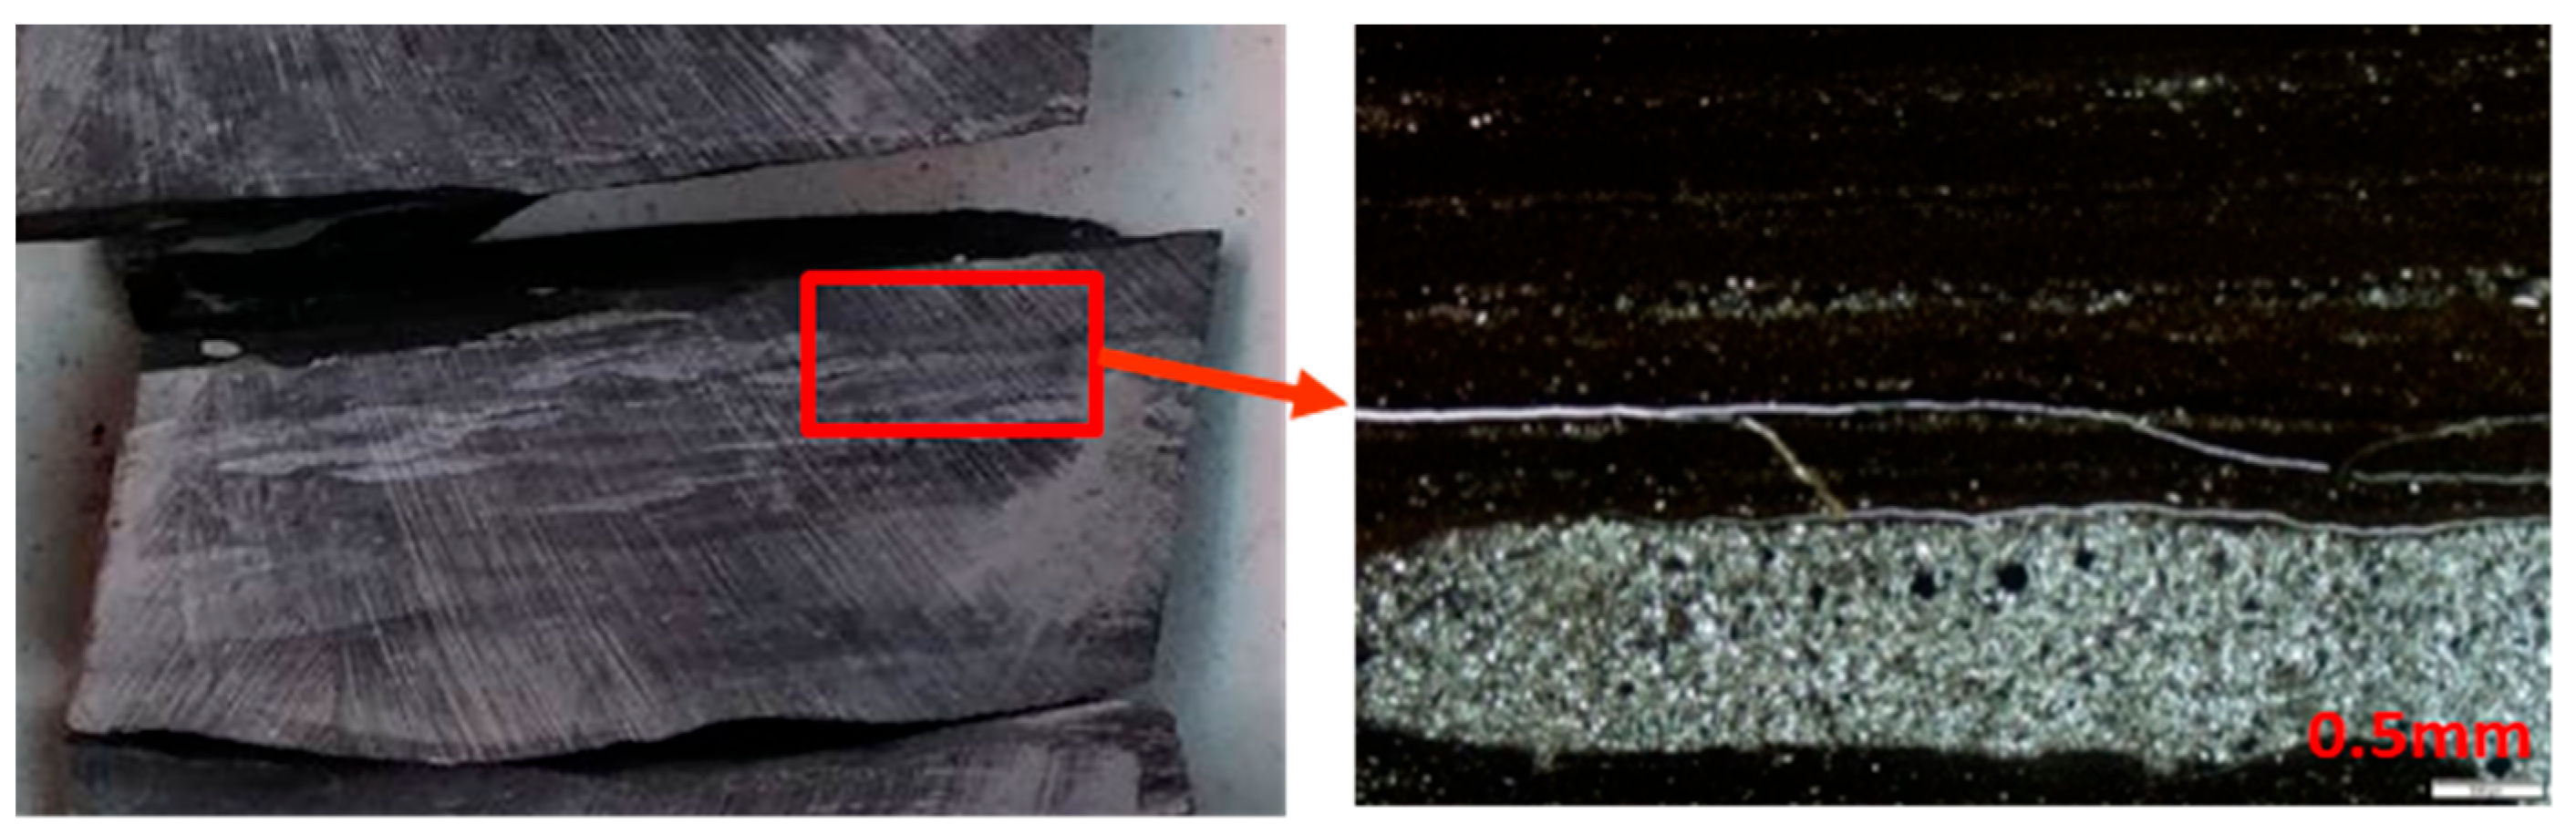
Figure 1). The dotted line in the figure indicates that the rock samples are open with natural cracks and developed laminae. The laminar seam density of the rock samples in
Figure 2 can reach 1500 lines/m, while the laminar seam density of the rock samples in
Figure 3 is only 400 lines/m. This indicates a significant gap in the development of stratigraphy in the study block. Consequently, it is imperative to examine the influence of varying degrees of stratigraphic advancement on the flow capacity of shale oil, as evidenced by the scanning electron microscope core analysis of the target window reservoir.
The experimental oil utilized in this study was sourced directly from the original reservoir. At the formation temperature of 78 °C, its viscosity was measured at 1.73 mPa·s. Consequently, to replicate the original reservoir conditions at surface conditions, where the oil exhibited a viscosity of 3.82 mPa·s, aviation kerosene was added to reduce the viscosity to its original state within the geological formation.
2.2. Experimental Equipment and Parameters
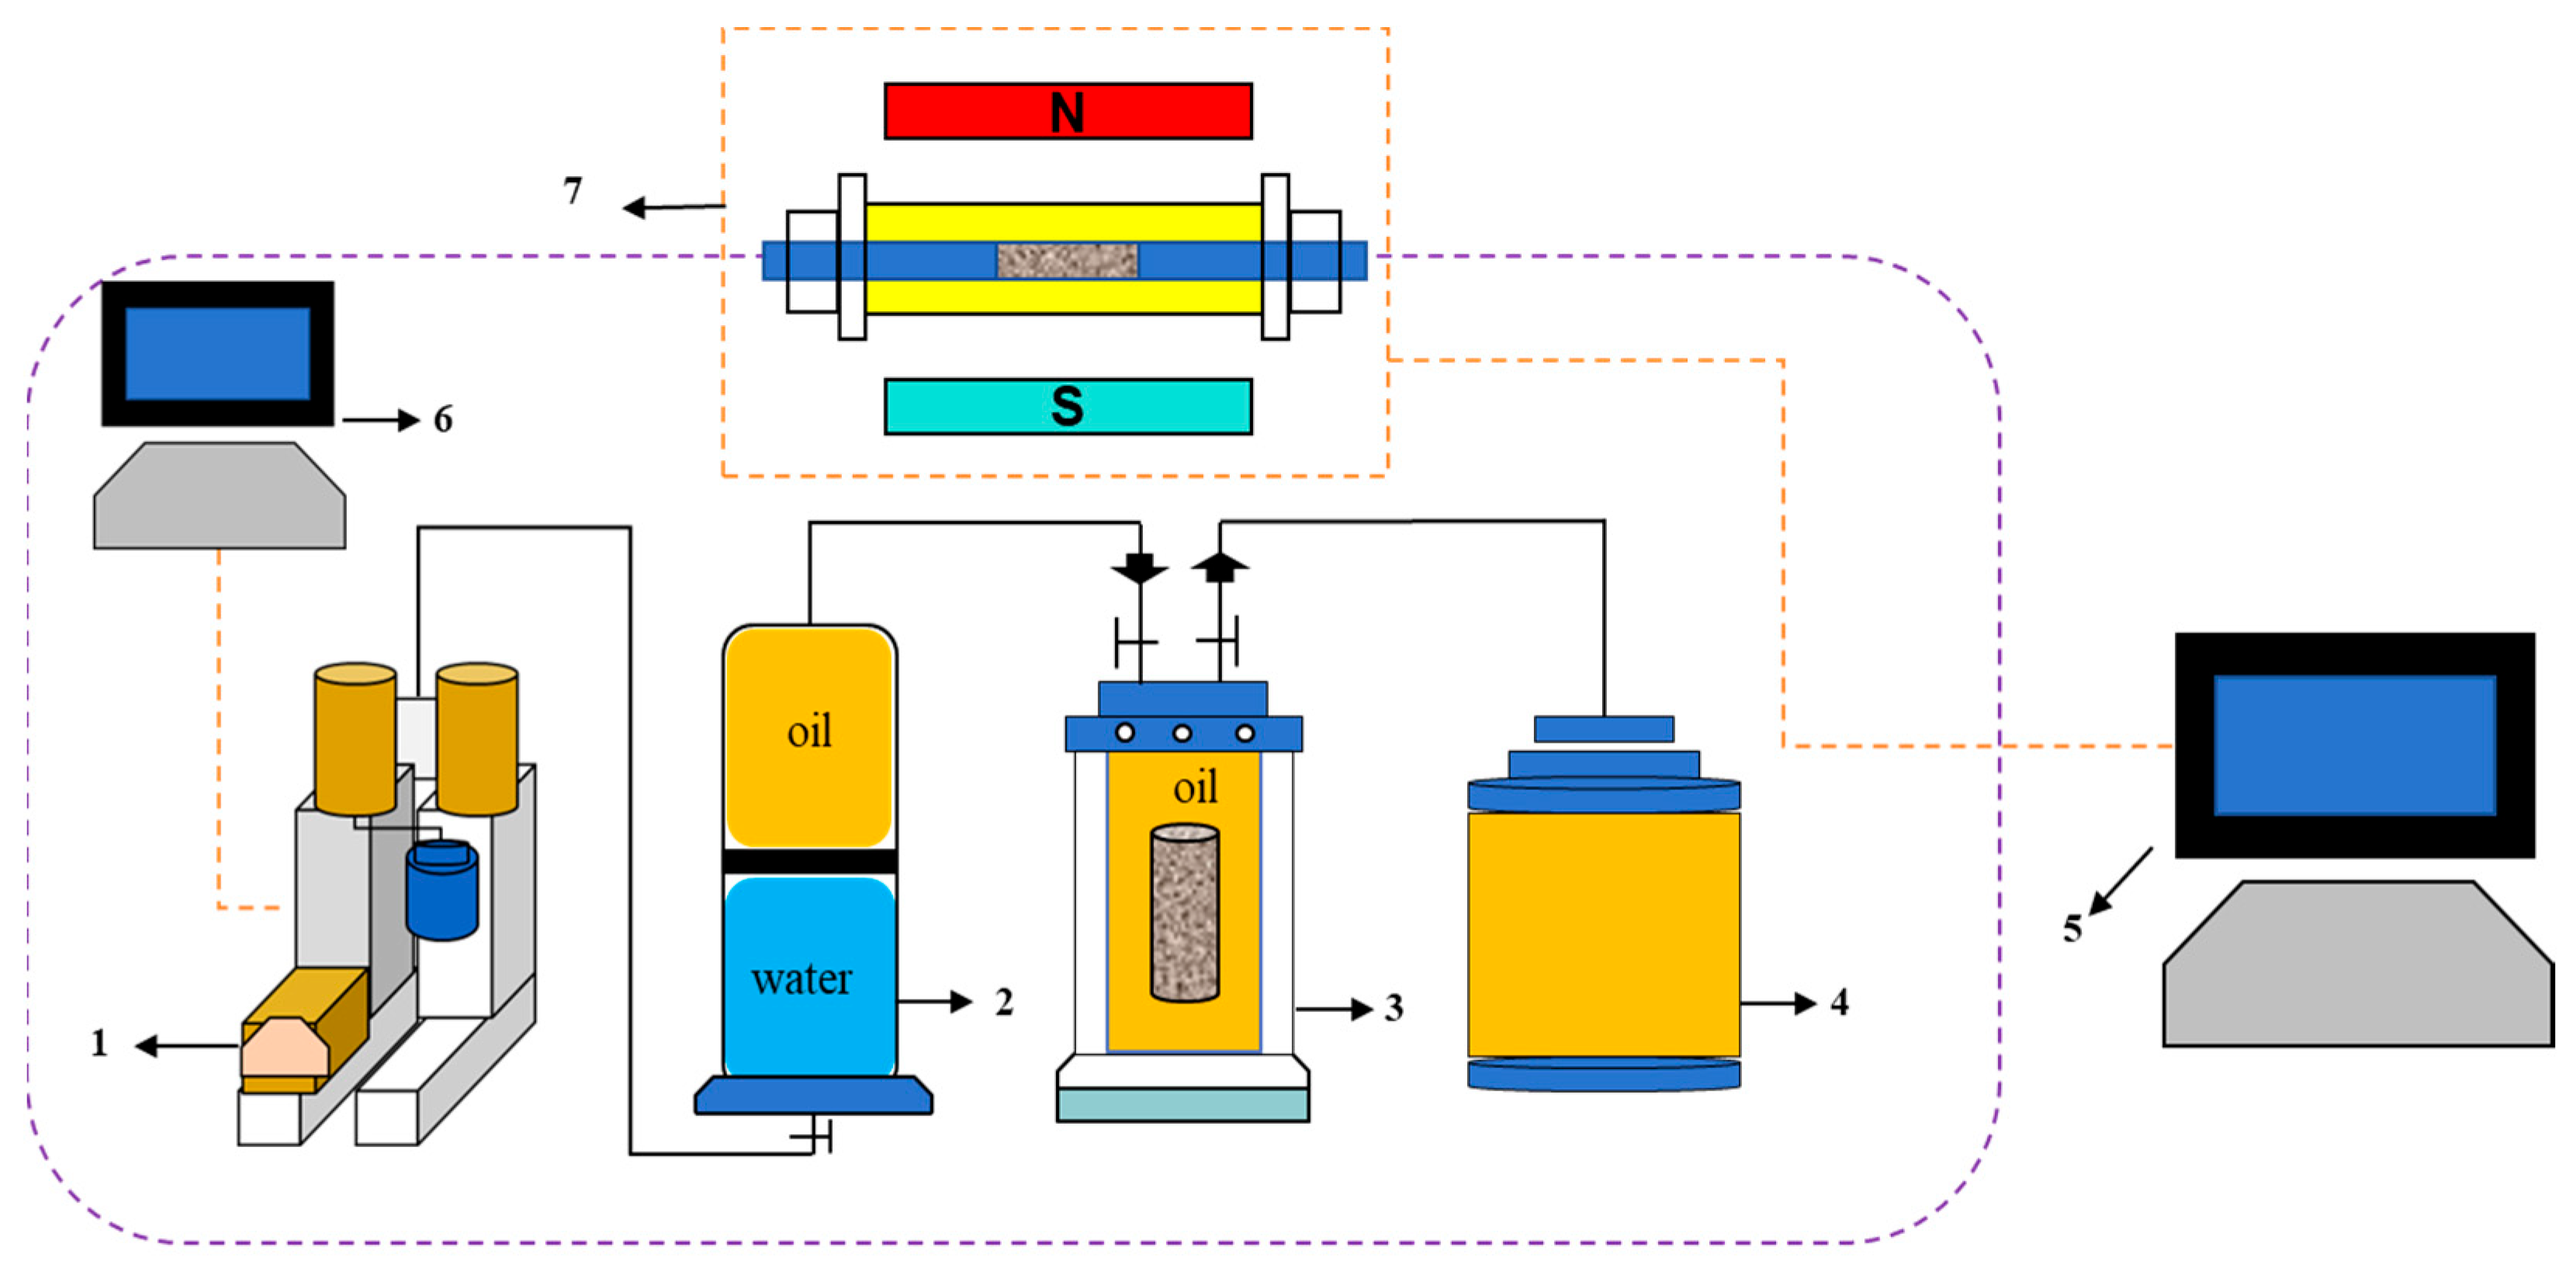
The experimental procedures were conducted using the MacroMR12-150H-I large-size nuclear magnetic resonance high-temperature and high-pressure imaging analyzer produced by Suzhou Niumag Analytical Instrument Co., Suzhou, China, as depicted in
Figure 4. This instrument operates at a resonance frequency of 12.798 MHz and features a magnet strength of 0.3 T. It is equipped with a repellent coil diameter of 25 mm, which accommodates a maximum sample diameter of 25 mm, and it maintains a magnet temperature of 32 °C. In addition to the aforementioned apparatus, the experiments employed the UXY-V core program-controlled automatic oil washer, a syringe pump, and a vacuum high-pressure saturation device, as well as computer numerical control (CNC) wire cutting and CNC milling devices.
Considering the development of nanopores in shale reservoirs and the high percentage of bands with short relaxation times, the experimental process requires the design of reasonable NMR acquisition parameters.
2.3. Pre-Experimental Preparation
The cores utilized in the experiments presented in this paper are columnar cores with a diameter of 2.5 cm, which were cut using a CNC wire-cutting instrument. The oil washing process involved a mixture of anhydrous ethanol and xylene, maintained at a temperature of 75 °C for a duration of 25 days. The core was subjected to an oil washing process, after which it was dried in an oven at a temperature of 90 °C for a period of 24 h. The core was then removed and weighed on an electronic balance until its quality remained unchanged. If this was not the case, the drying process was continued until the core reached the desired consistency. Post oil washing, the porosity and permeability characteristics of the experimental cores were assessed. The porosity was measured using the gasometric method, while the permeability was determined using the pressure pulse decay method, which is currently the most prevalent approach for shale [
32]. Additionally, the experiments demonstrated a notable deficiency in flowability in the exceptionally dense shale cores in the absence of a Brazilian splitting test. Given the pivotal role of hydraulic fracturing operations in the development of shale reservoirs, the cores utilized in this study, with the exception of cores No. 12-2 and No. 16, were subjected to a Brazilian splitting test to accurately reflect field conditions.
Table 1 presents the fundamental data pertaining to the cores utilized in this study.
2.4. Experimental Methods and Procedures
The experiments presented in this paper primarily focus on elucidating the flow law of shale oil, addressing four key aspects: (1) the impact of varying degrees of stratification development on the flowability of shale oil; (2) the influence of fractures on the flowability of shale oil; (3) the effect of different injection pressures on the flowability of shale oil; and (4) the role of proppant presence or absence on the flowability of shale oil. The detailed experimental procedures, along with the schematic diagrams (
Figure 5), are outlined as follows:
① Initial determination of core physical properties: Prior to experimentation, essential physical property parameters such as porosity, permeability, and the dry weight of the column core were measured. Subsequently, the NMR T2 spectral curve of the core in its initial state was collected.
② Preparation for simulated oil saturation: The core was placed in an empty piston container, which was then sealed and connected to a vacuum pump for evacuation.
③ Simulated oil injection: The vacuum pump was turned off, utilizing the negative pressure within the container to draw in the simulated oil.
④ The injection pump was used to inject the simulated oil at a constant flow rate of 0.01 mL/min. After the pressure rose to 30 MPa, the injection mode was changed, and injection was continued at a constant pressure of 30 MPa. The core was subjected to high-pressure saturation for 96 h.
⑤ Post-saturation procedure: Upon the completion of saturation, the lower valve of the piston container was closed. The pressure within the container was then gradually released until it stabilized, allowing for the removal of the core.
⑥ Final analysis: The core was extracted with any surface oil wiped off, and its weight was measured to calculate the degree of oil saturation. Finally, the NMR T2 spectral curve of the core post-flow experiment was collected.
The analysis and treatment of the situation during the experiment was as follows: ① if the amount of simulated oil is low (simulated oil loss in each experiment), this may lead to poor saturation; ② if the top surface of the core is too close to the top of the piston container, this may lead to core fracture during pump pressurization; ③ after making a seam treatment of the core with a thin strap to tie the core, we ensured that most of the side area of the core was exposed to the simulation of the oil; ④ the core should be evacuated when it is saturated for the first time, and the target pressure of the core in the experiment was 30 MPa.
For the nuclear magnetic resonance detection data, we analyzed the microscopic transport characteristics of the shale oil by collecting the amount of signal from the NMR T2 spectral curves inside the pores at different scales before and after the simulated oil flow experiments.
3. Discussion of the Experimental Results
The process of pumping shale oil involves a vacuum and high-pressure saturation, which allows the crude oil to enter the core through osmosis. This process enables the analysis of the minimum pore space that the crude oil can enter and the characteristics of crude oil transport.
3.1. Influence of Different Levels of Stratification Development on Shale Oil Flowability
The degree of development of the stratifications in shale plays a pivotal role in determining both the seepage path and velocity of the shale oil. In scenarios where these joints are highly developed, shale oil can rapidly migrate towards the wellbore through these natural conduits, thereby increasing the fluid’s seepage rate. Conversely, in cases with poorly developed stratifications, the seepage of shale oil occurs predominantly through the micropores within the rock matrix. This results in a more constricted and slower flow path. To investigate these phenomena, crude oil saturation experiments were carried out on three distinct cores (numbered 5, 9-2, and 20-1). The NMR T2 spectral curves were recorded and analyzed both before and after saturation, as depicted in
Figure 6,
Figure 7,
Figure 8,
Figure 9 and
Figure 10.
(1) The basic conditions of Core 5 are shown in
Table 2.
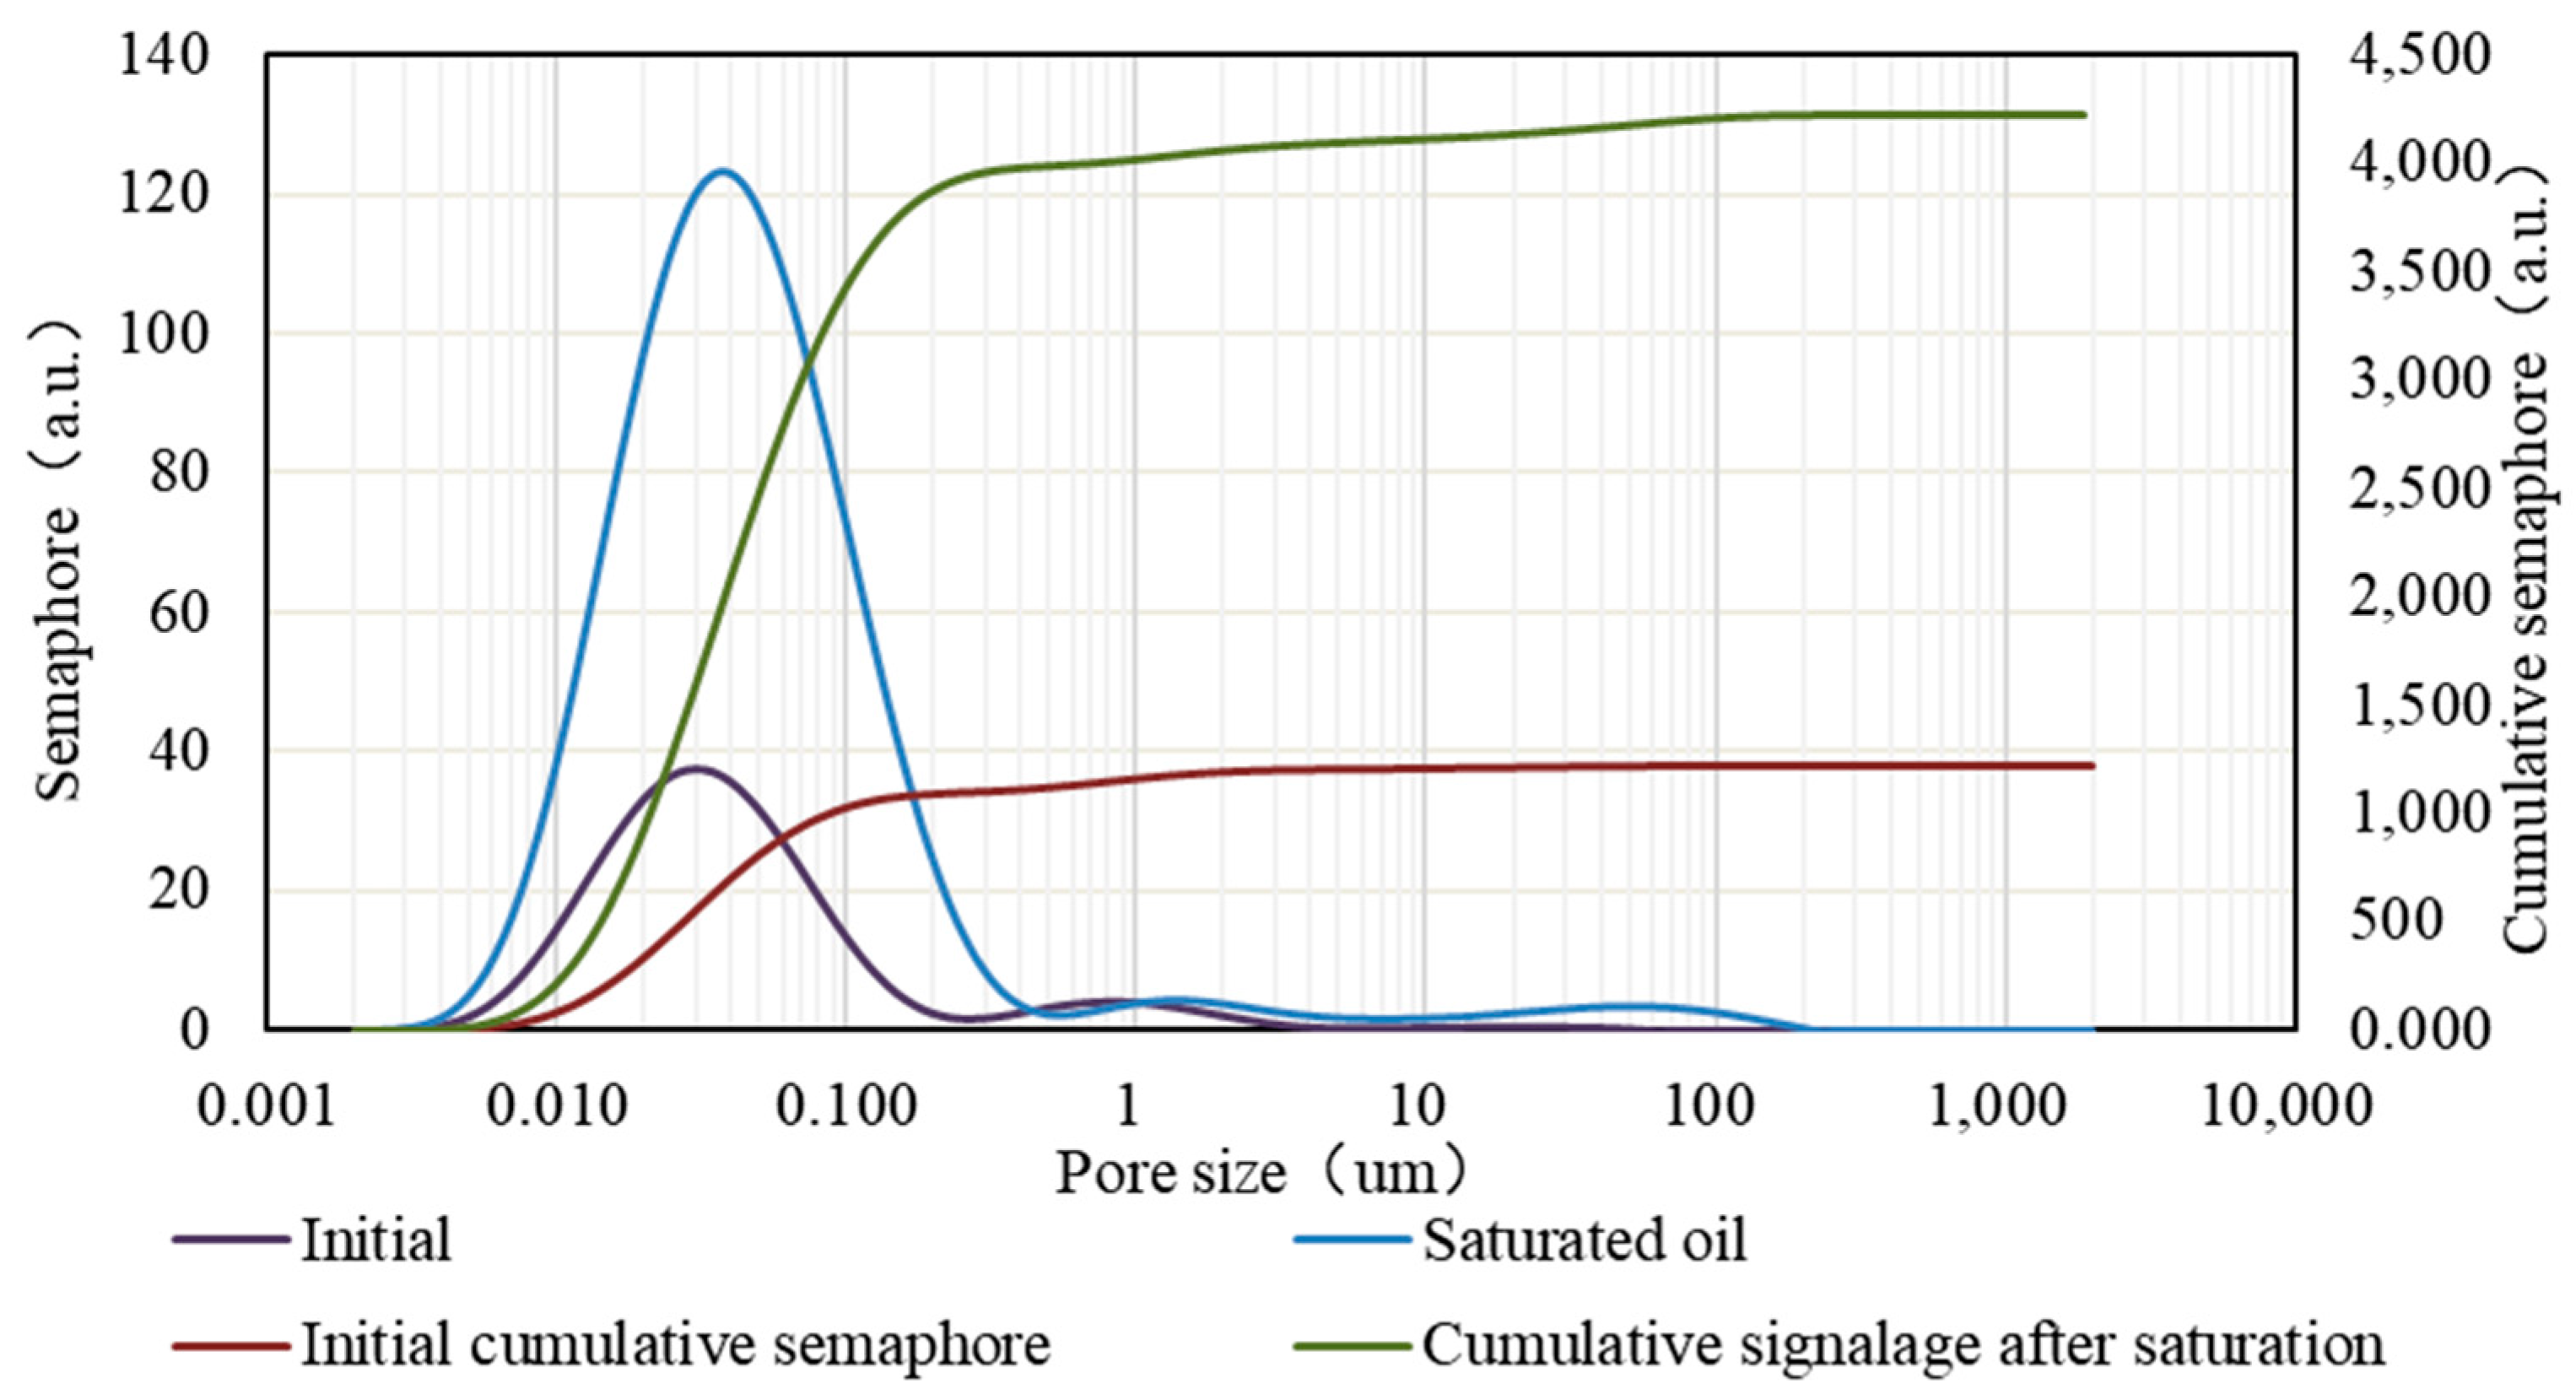
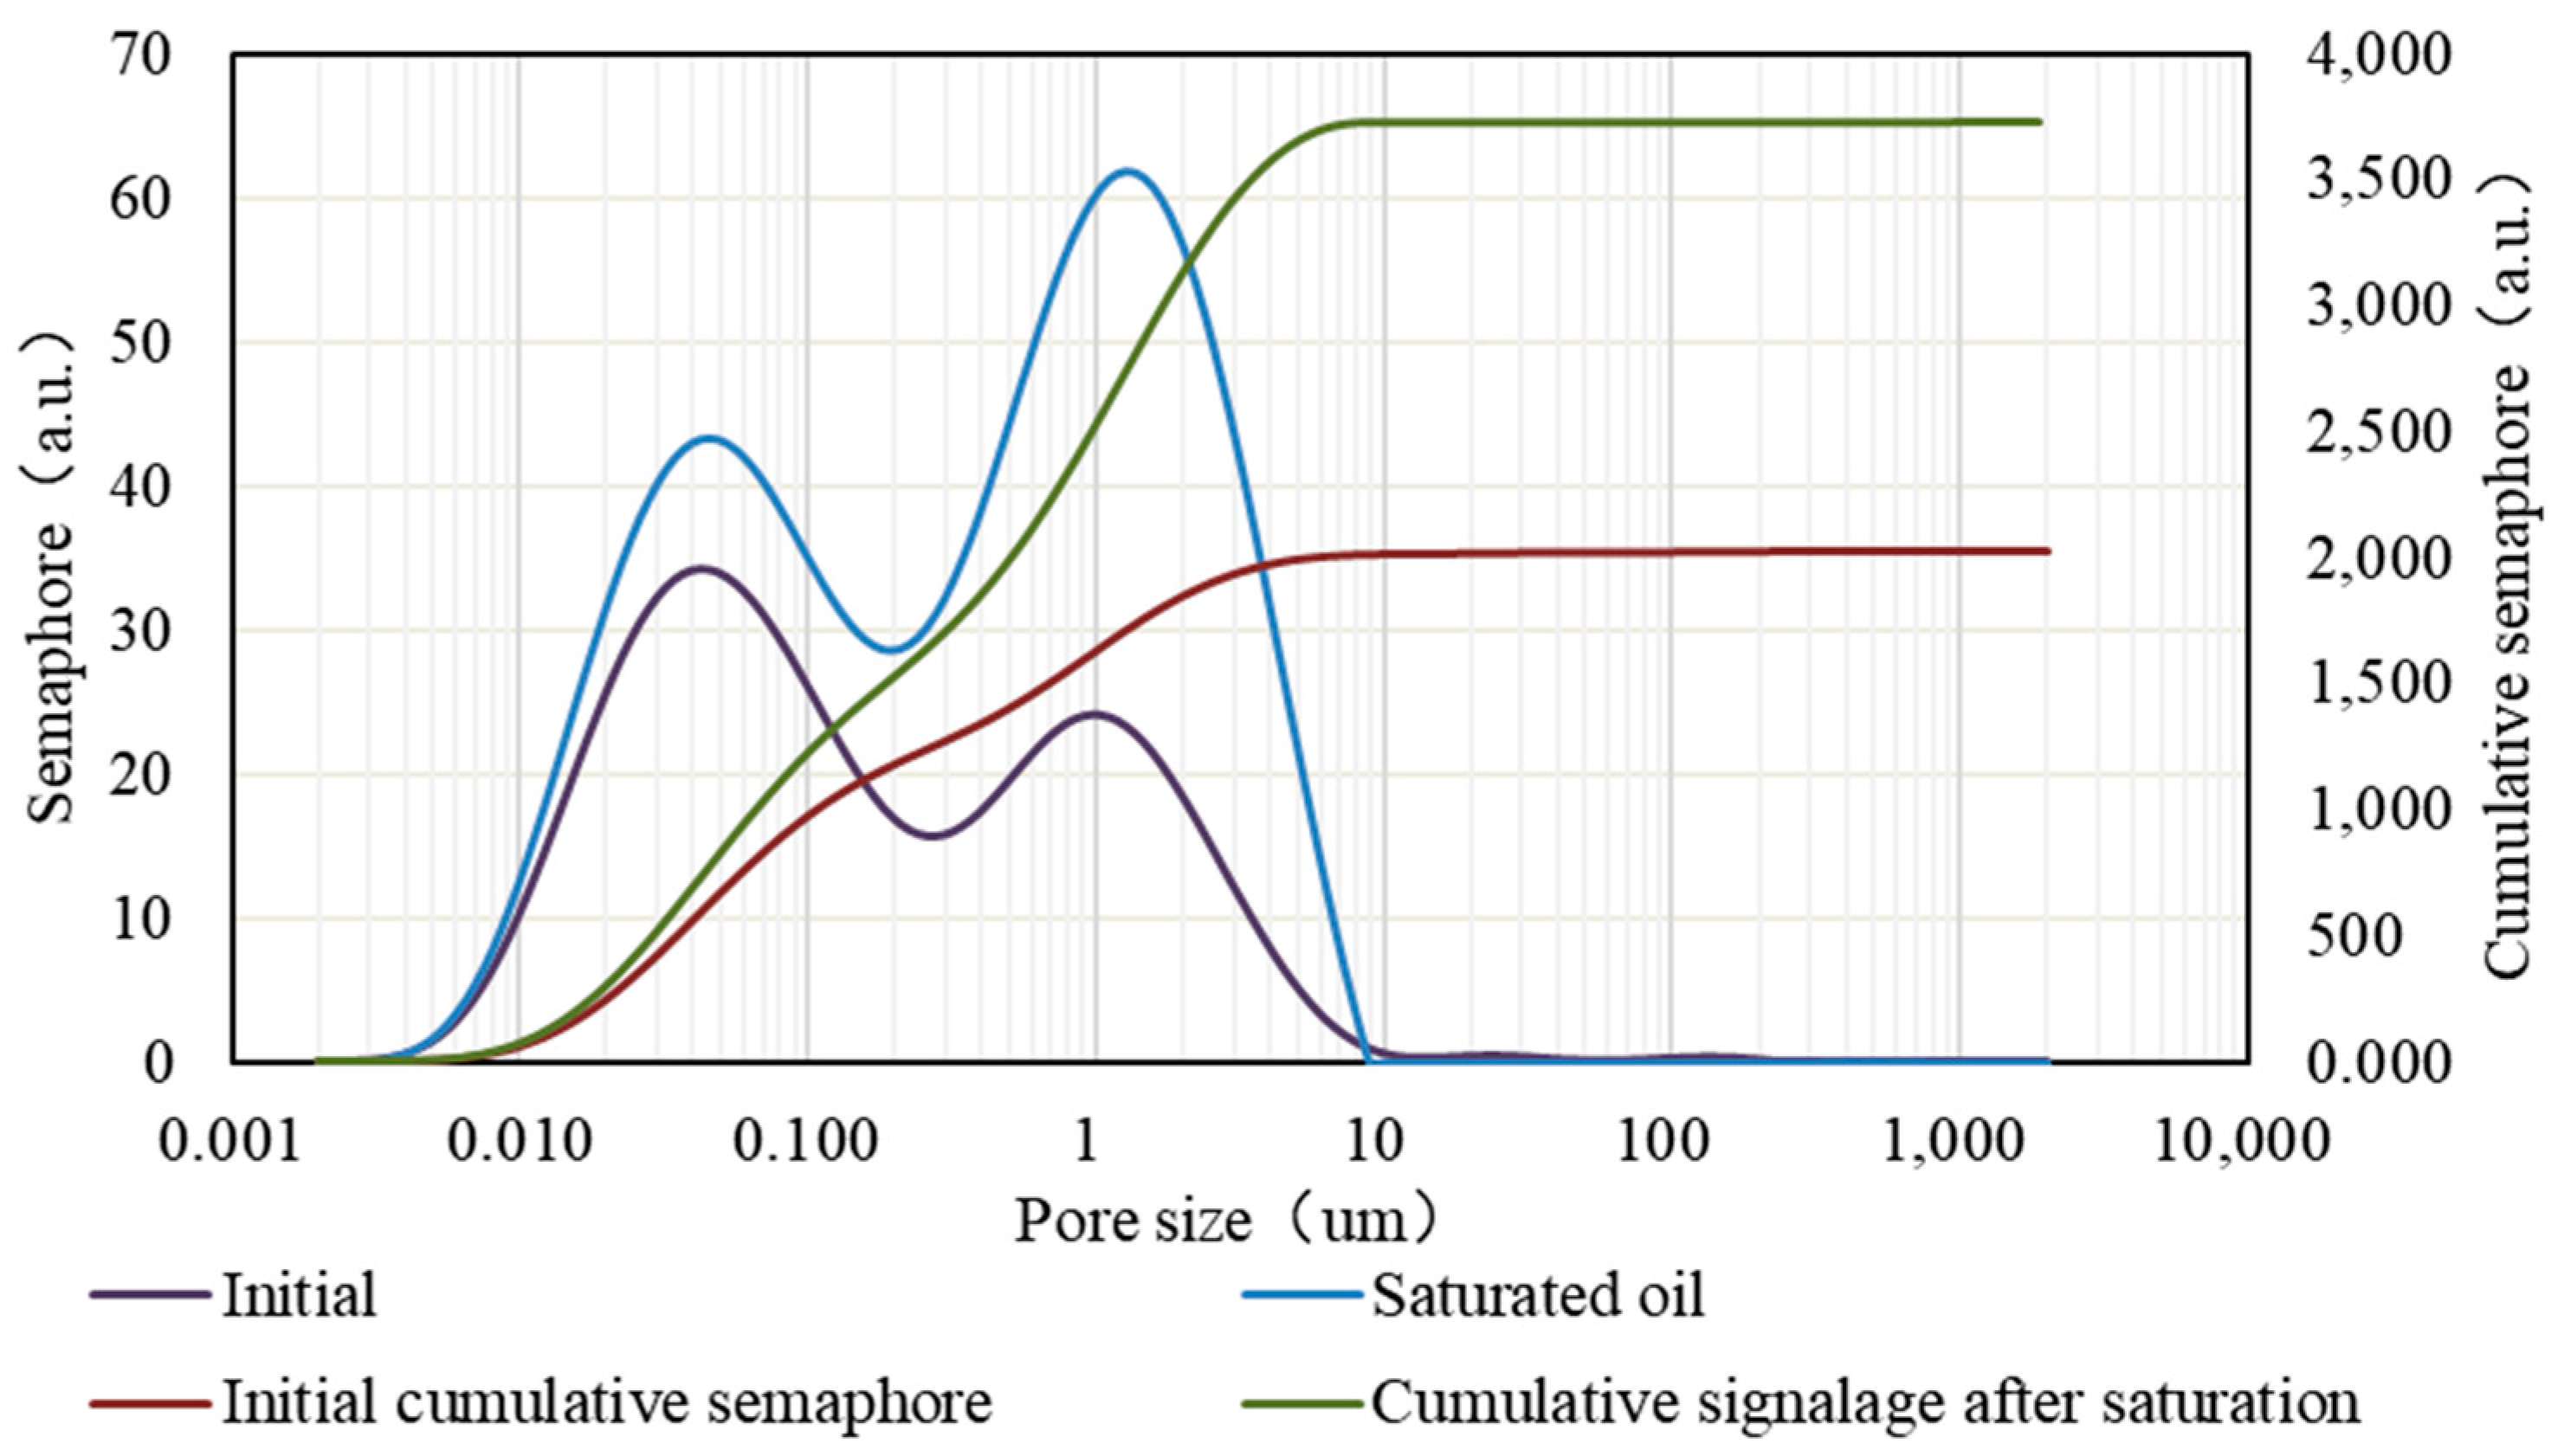
The conducted experiment revealed that core no. 5 exhibited a crude oil saturation level of 64.92% following evacuation and high-pressure saturation. The analysis of the NMR T2 spectrum before and after saturation, as illustrated in
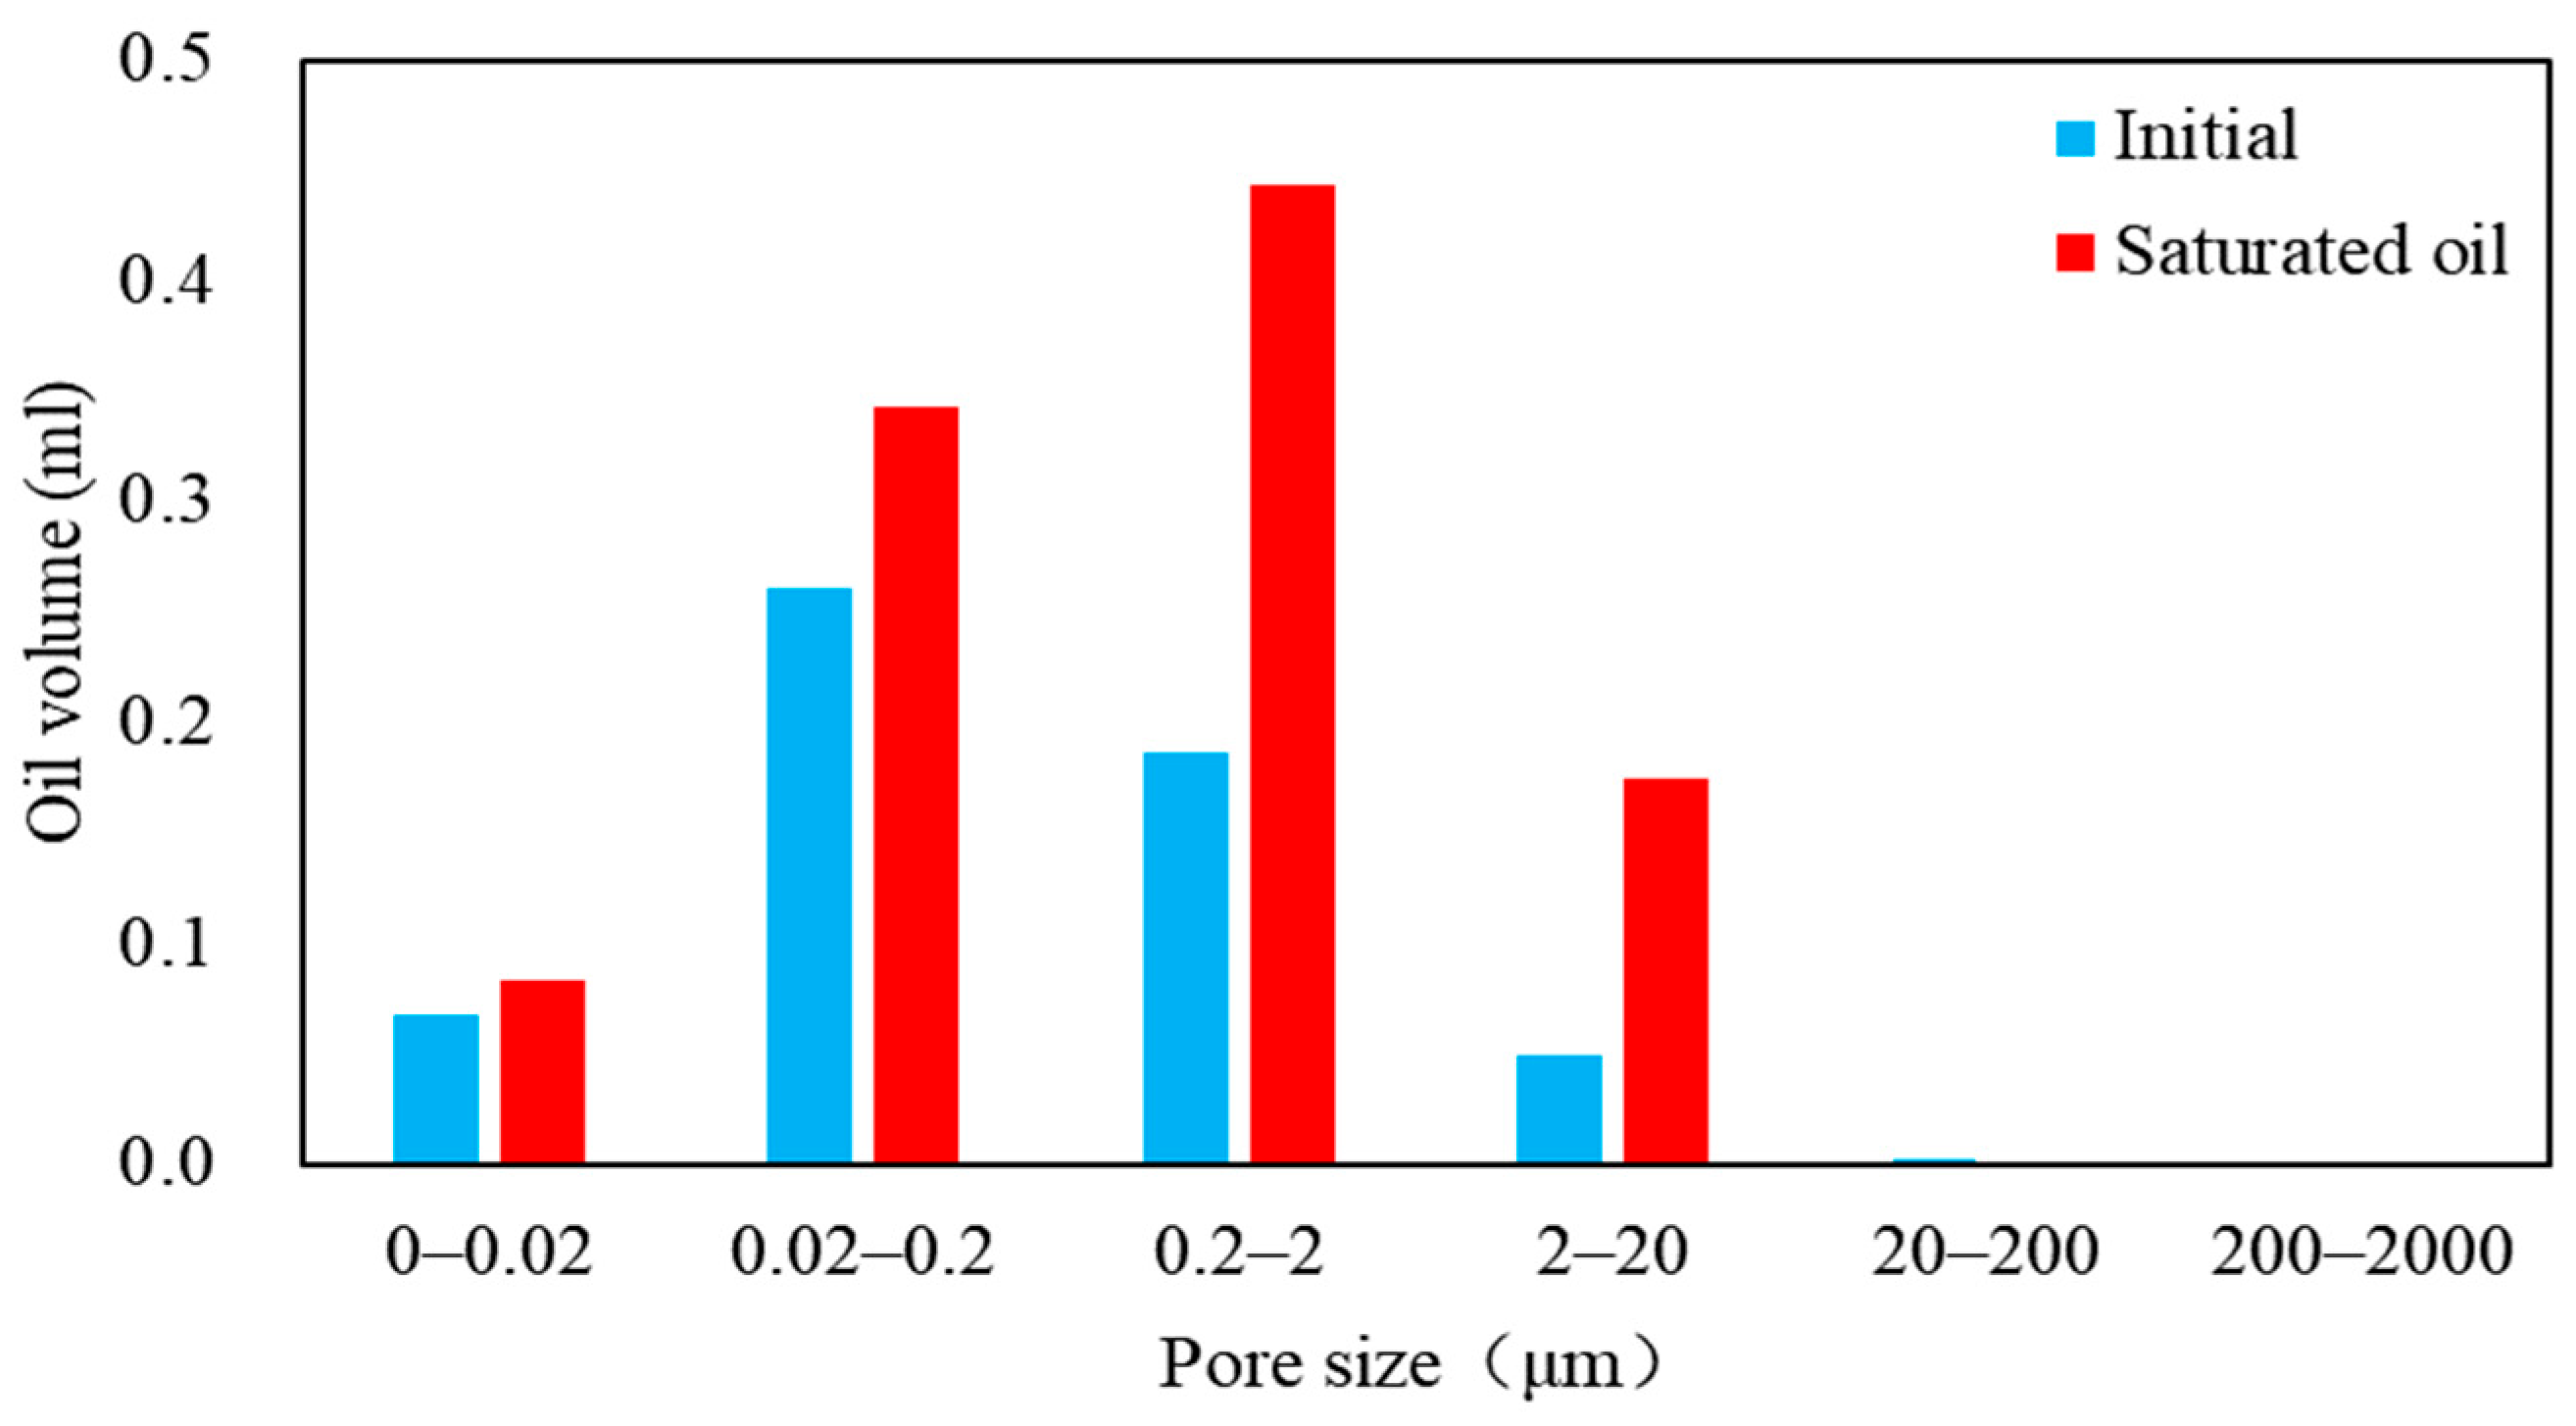
Figure 6, revealed a notable change. In addition to the original first and second peaks, a smaller third peak emerged post-saturation in this core. The third peak indicated the presence of a minor quantity of large pores, all of which were expelled from the core during the oil washing process. This observation suggests that crude oil in pores larger than 10 μm demonstrates high mobility. Furthermore, a comparison of the cumulative signal amounts before and after saturation revealed that virtually no crude oil saturation occurred in pores smaller than 8–10 nm in diameter. A comprehensive examination of the NMR signal volume for each pore size, exemplified in
Figure 7, revealed that the majority of the pores in this core exhibited a diameter between 20 and 200 nanometers, with a minor fraction of pores in other sizes.
(2) The basic conditions of core 9-2 are shown in
Table 3.
Following the flow experiment, core no. 9-2 was found to be saturated with 60.27% crude oil. A comparison of the NMR T2 spectral curves before and after the experiment revealed that the core was saturated with only a smaller third peak, indicating that the core has a smaller percentage of macropores. The change in crude oil volume in different scale pores, as illustrated in
Figure 9, also indicates that the oil primarily entered the pores that were smaller than 200 nm.
(3) The basic conditions of core 20-1 are shown in
Table 4.
The saturation degree of the crude oil reached 68.33% following the saturated flow experiment due to the more developed stratifications observed in this core. This value was larger than that observed for core no. 5 and no. 9-2, which exhibited less-developed stratifications.
Figure 10 displays the NMR T2 spectral curves before and after the saturation experiment.
It is evident that the two-peak area of this core accounted for a greater proportion, indicating that the large hole was the main storage space. In terms of core permeability, this core exhibited significantly higher permeability compared to the other two cores. Based on the cumulative signal amount before and after saturation, it appears that there was minimal crude oil saturation in pores smaller than 20 nm. By analyzing the NMR signals of each pore size (see
Figure 11), it is evident that the majority of the pores in this core were concentrated within the 20–2000 nm range, with pores measuring 0–20 nm accounting for a relatively small proportion.
3.2. Impact of Fracturing on the Flow Capacity of Shale Oil Matrices
The presence of fractures increases the area of the core in contact with the saturated fluid, which in turn leads to an increase in saturation in the results of saturation flow experiments. For the flow experiment in this paper, core no. 16, which was not seamed, was chosen to analyze the difference in shale oil flowability compared to the seamed core mentioned above. The NMR T2 spectral curves before and after the saturated flow experiment are shown in
Figure 12. The fundamental characteristics of core 16 are presented in
Table 5.
In the experiment involving core 16, which was not subjected to the seam treatment, the crude oil saturation level achieved after 96 h of vacuuming and high-pressure saturation was only 29.22%. This outcome demonstrates that for shale cores with an exceptionally low permeability, the absence of seam creation leads to suboptimal crude oil flow capacity, resulting in a lower final saturation level.
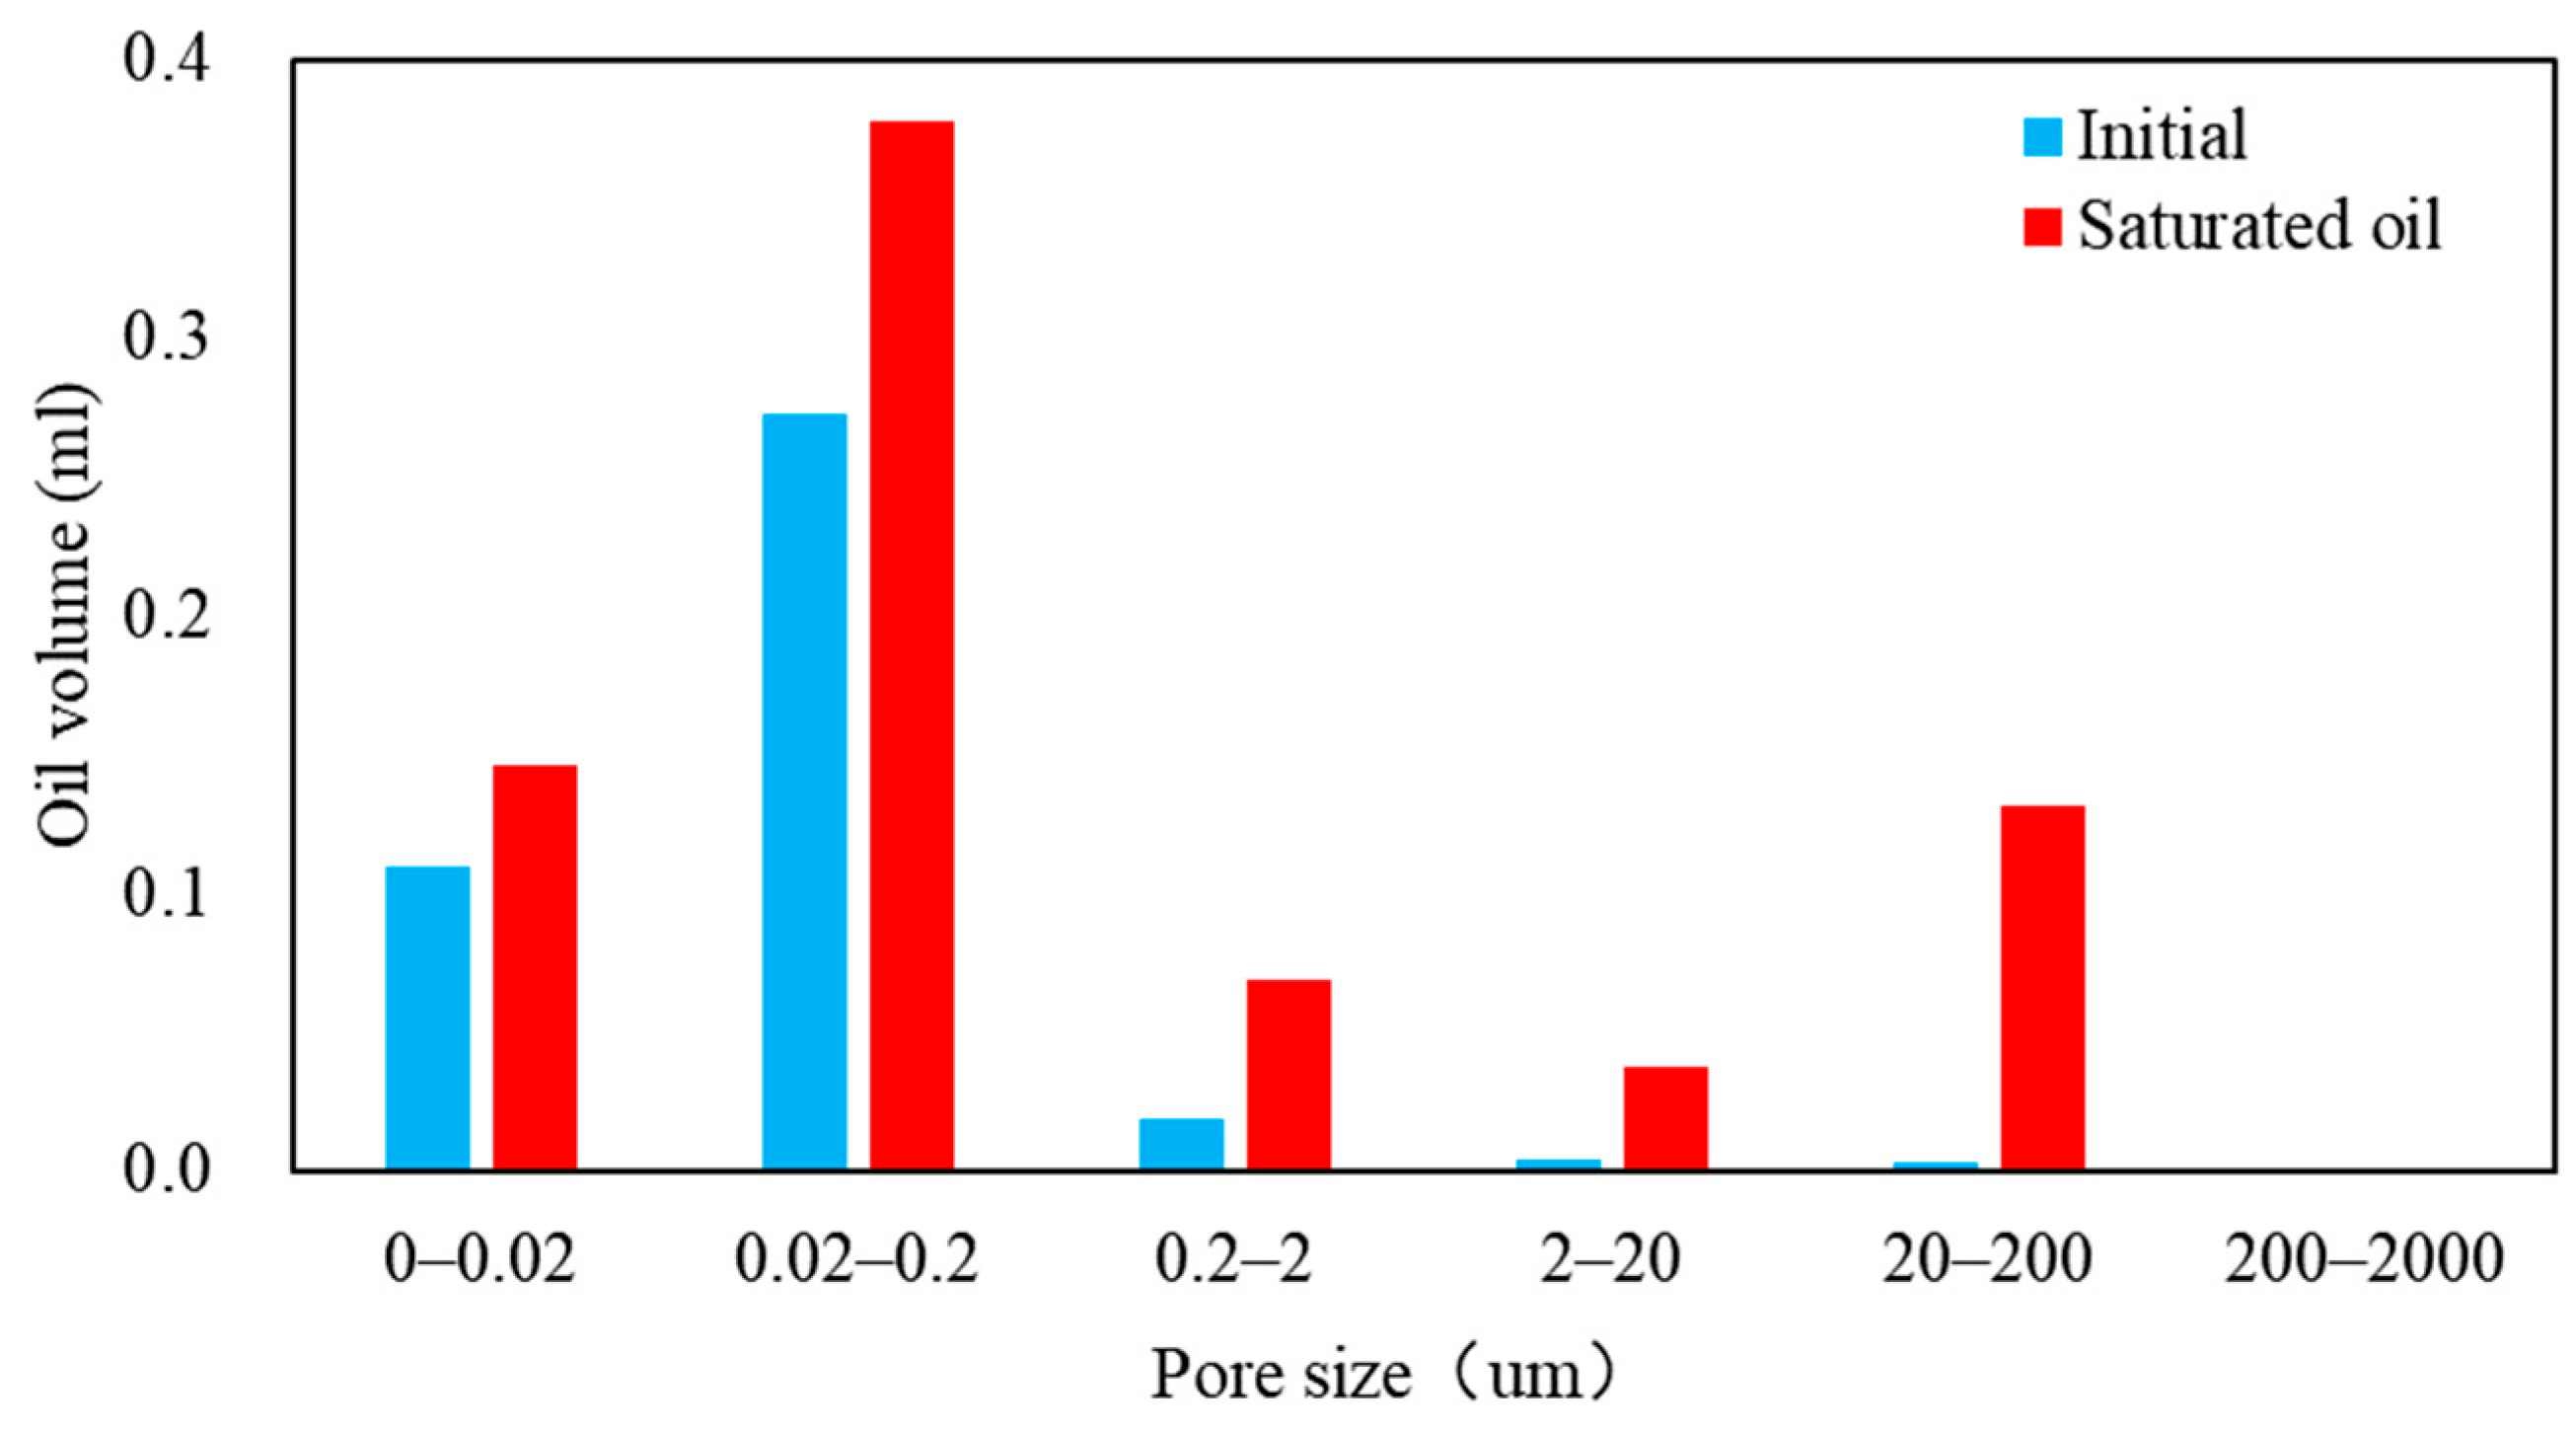
Figure 12 provides further insights, indicating the presence of a significant number of large pores in this core when a third peak appears post-saturation. The cumulative signal analysis before and after saturation showed that there was almost no crude oil saturation in pores smaller than 10 nm. A detailed examination of the NMR signal volumes for each pore size, as shown in
Figure 13, indicated that the pores of this core predominantly fell within the 20–200 nm range. Pores of other sizes represented a smaller fraction compared to those within the 20–200 nm range. During the saturation flow experiment, the crude oil primarily infiltrated the pores within the 20–200 µm range, indicating that this pore size category forms the main flow channel in the unseamed core. This finding is in stark contrast to the behavior observed in the cores that underwent the seam treatment.
3.3. Impact of Different Injection Pressures on the Flow Capacity of Shale Oil Matrices
The relationship between the injection pressure and the efficacy of driving crude oil into the core is a critical aspect of this study, emphasizing the need to examine the impact of varying injection pressures on the flow capacity of matrix-type shale oil. For this purpose, three distinct cores were chosen for a comparative analysis: no. 19 (with the seam-forming treatment), no. 16 (unseamed), and no. 12-2 (unseamed). A significant departure deviation from the previously described experimental procedure was the meticulous documentation of the crude oil injection process into the core vessel in this portion of the study, given that injection pressure is a dynamic variable. To ensure uniformity and control the impact of saturation duration, the saturation time was consistently maintained at 24 h for each injection pressure level.
(1) The results of the matrix flow experiment for core 12-2 are shown in
Figure 14 and
Figure 15.
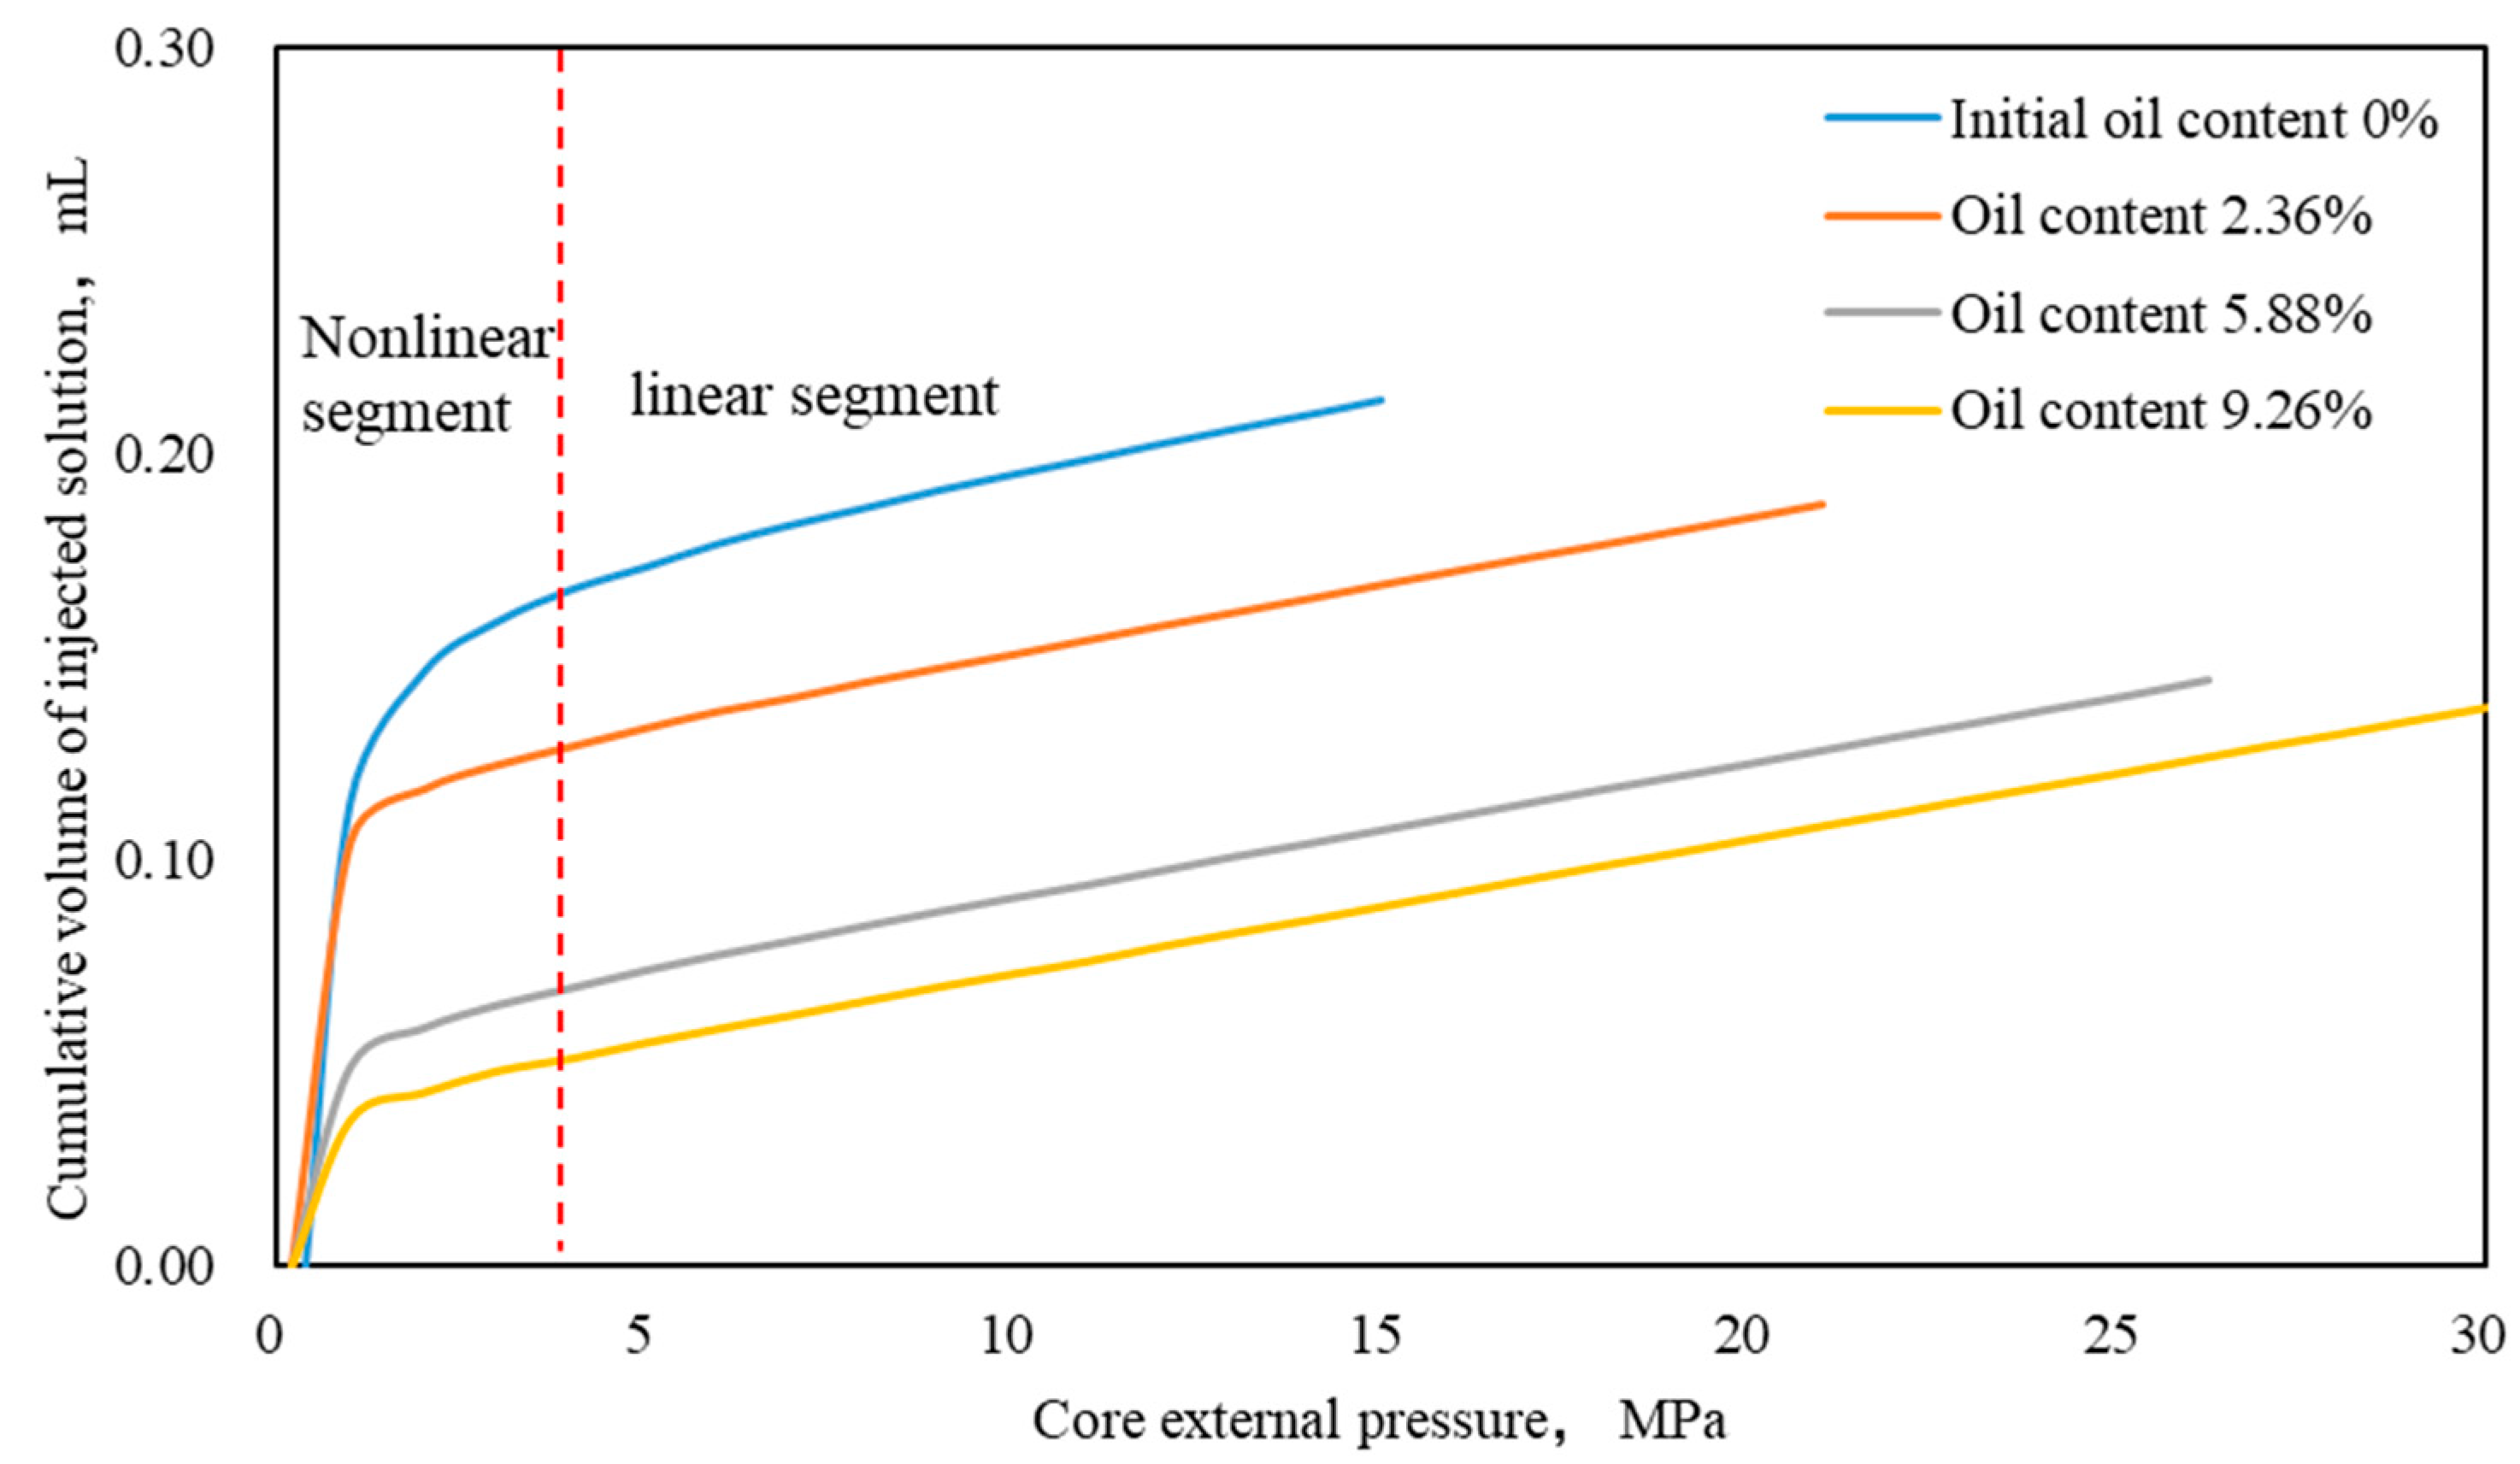
Figure 14 depicts the pressure change curves observed during the matrix flow experiment for core 12-2. These curves can be segmented into two distinct phases. The initial phase exhibits a gradual rise in the external pressure of the core, characterized by a nonlinear trend. In contrast, the second phase is marked by a linear increase in the external pressure. It is noteworthy that at zero core saturation, the ‘nonlinear’ flow characteristic curve is more pronounced. As the core saturation progressively increases, the extent of the nonlinear curve section diminishes, and the linear flow characteristics become more prominent. This behavior can be attributed to the nature of shale core pores and microcracks, which, after the oil washing treatment, contain only bound oil. Due to minimal flow resistance, the external fluid preferentially enters the larger pore spaces, which constitute the main flow channels within the core. As core oil saturation increases, the saturation pressure required for re-saturation also rises. As illustrated in
Figure 15, the nonlinear flow characteristics diminish with increasing saturation pressures. This phenomenon can be attributed to the presence of fluids in the pores and microfractures during subsequent matrix flow experiments, which results in additional resistance to the influx of external fluids into the core’s internal pore structure. Consequently, this results in a more rapid increase in pressure. Therefore, it can be inferred that the higher the oil saturation in the shale core, the more pronounced the linear characteristics of the pressure rise in the subsequent experiments.
(2) Results of matrix flow experiments in core 16.
The results of the matrix flow experiments in core 16 are shown in
Figure 16 and
Figure 17.
Figure 16 and
Figure 17 illustrate the pressure change dynamics observed during the matrix flow experiment in core no. 16. The analysis of the four pressure change curves revealed shorter, nonlinear segments, transitioning into linear segments when the pressure reached approximately 2 MPa. Although the curve patterns for core no. 16 exhibited similarities to those observed for core no. 12-2, notable differences were present. In the nonlinear curve section of core no. 16’s pressurization process, the pressure rise rate was comparatively faster, while in the linear section, it was slower. In order to more clearly illustrate the difference in flow capacity between the two cores, the injection curve at first saturation was plotted in the manner depicted in
Figure 18.
Figure 18 illustrates that during the pressurization process of the matrix flow experiment, the quantity of fluid required to elevate the pressure of core 16 to 2 MPa was a mere 0.089 mL, whereas core 12-2 necessitated 0.146 mL. Following the attainment of a pressure of 2 MPa (green dashed line), the injection curve of core 16 became linear, while that of core 12-2 became linear following the attainment of a pressure of 4 MPa (brown dashed line). This phenomenon may be attributed to the development of microfractures in core 16, which exhibited a greater porosity and permeability than core 12-2. This implies that the physical properties of core 16 were slightly superior to those of core 12-2. The external fluid must overcome greater capillary resistance when entering the smaller-scale pore space. Therefore, a fast pressure rise in this stage represents a large median average radius of the pores and a small capillary resistance to overcome. In the linear section, the pressure rise rate of core 12-2 was evidently faster than that of core 16. This is because, once the larger-sized pore space of core 12-2 is filled with oil, it must overcome a greater capillary resistance when flowing through the smaller-sized pore space. However, it is evident that the experimental pressure failed to reach the pressure required to overcome such significant pressure, and the simulated oil failed to enter the smaller-sized pore space. This is also the reason why the final oil saturation of core 12-2 was less than that of core 16.
(3) Results of matrix flow experiments in core 19.
The basic conditions of core 19 are shown in
Table 6.
Core no. 19 underwent three vacuum high-pressure saturations at varying pressures, resulting in a final crude oil saturation of 70.15%. An analysis of the NMR T2 spectra before and after saturation, as shown in
Figure 19, revealed a distinct three-peak pattern post-saturation, which differed from the patterns observed for the previously discussed cores. The second peak of this core was notably more pronounced than the first and third peaks, which suggests the predominance of a large pore volume.
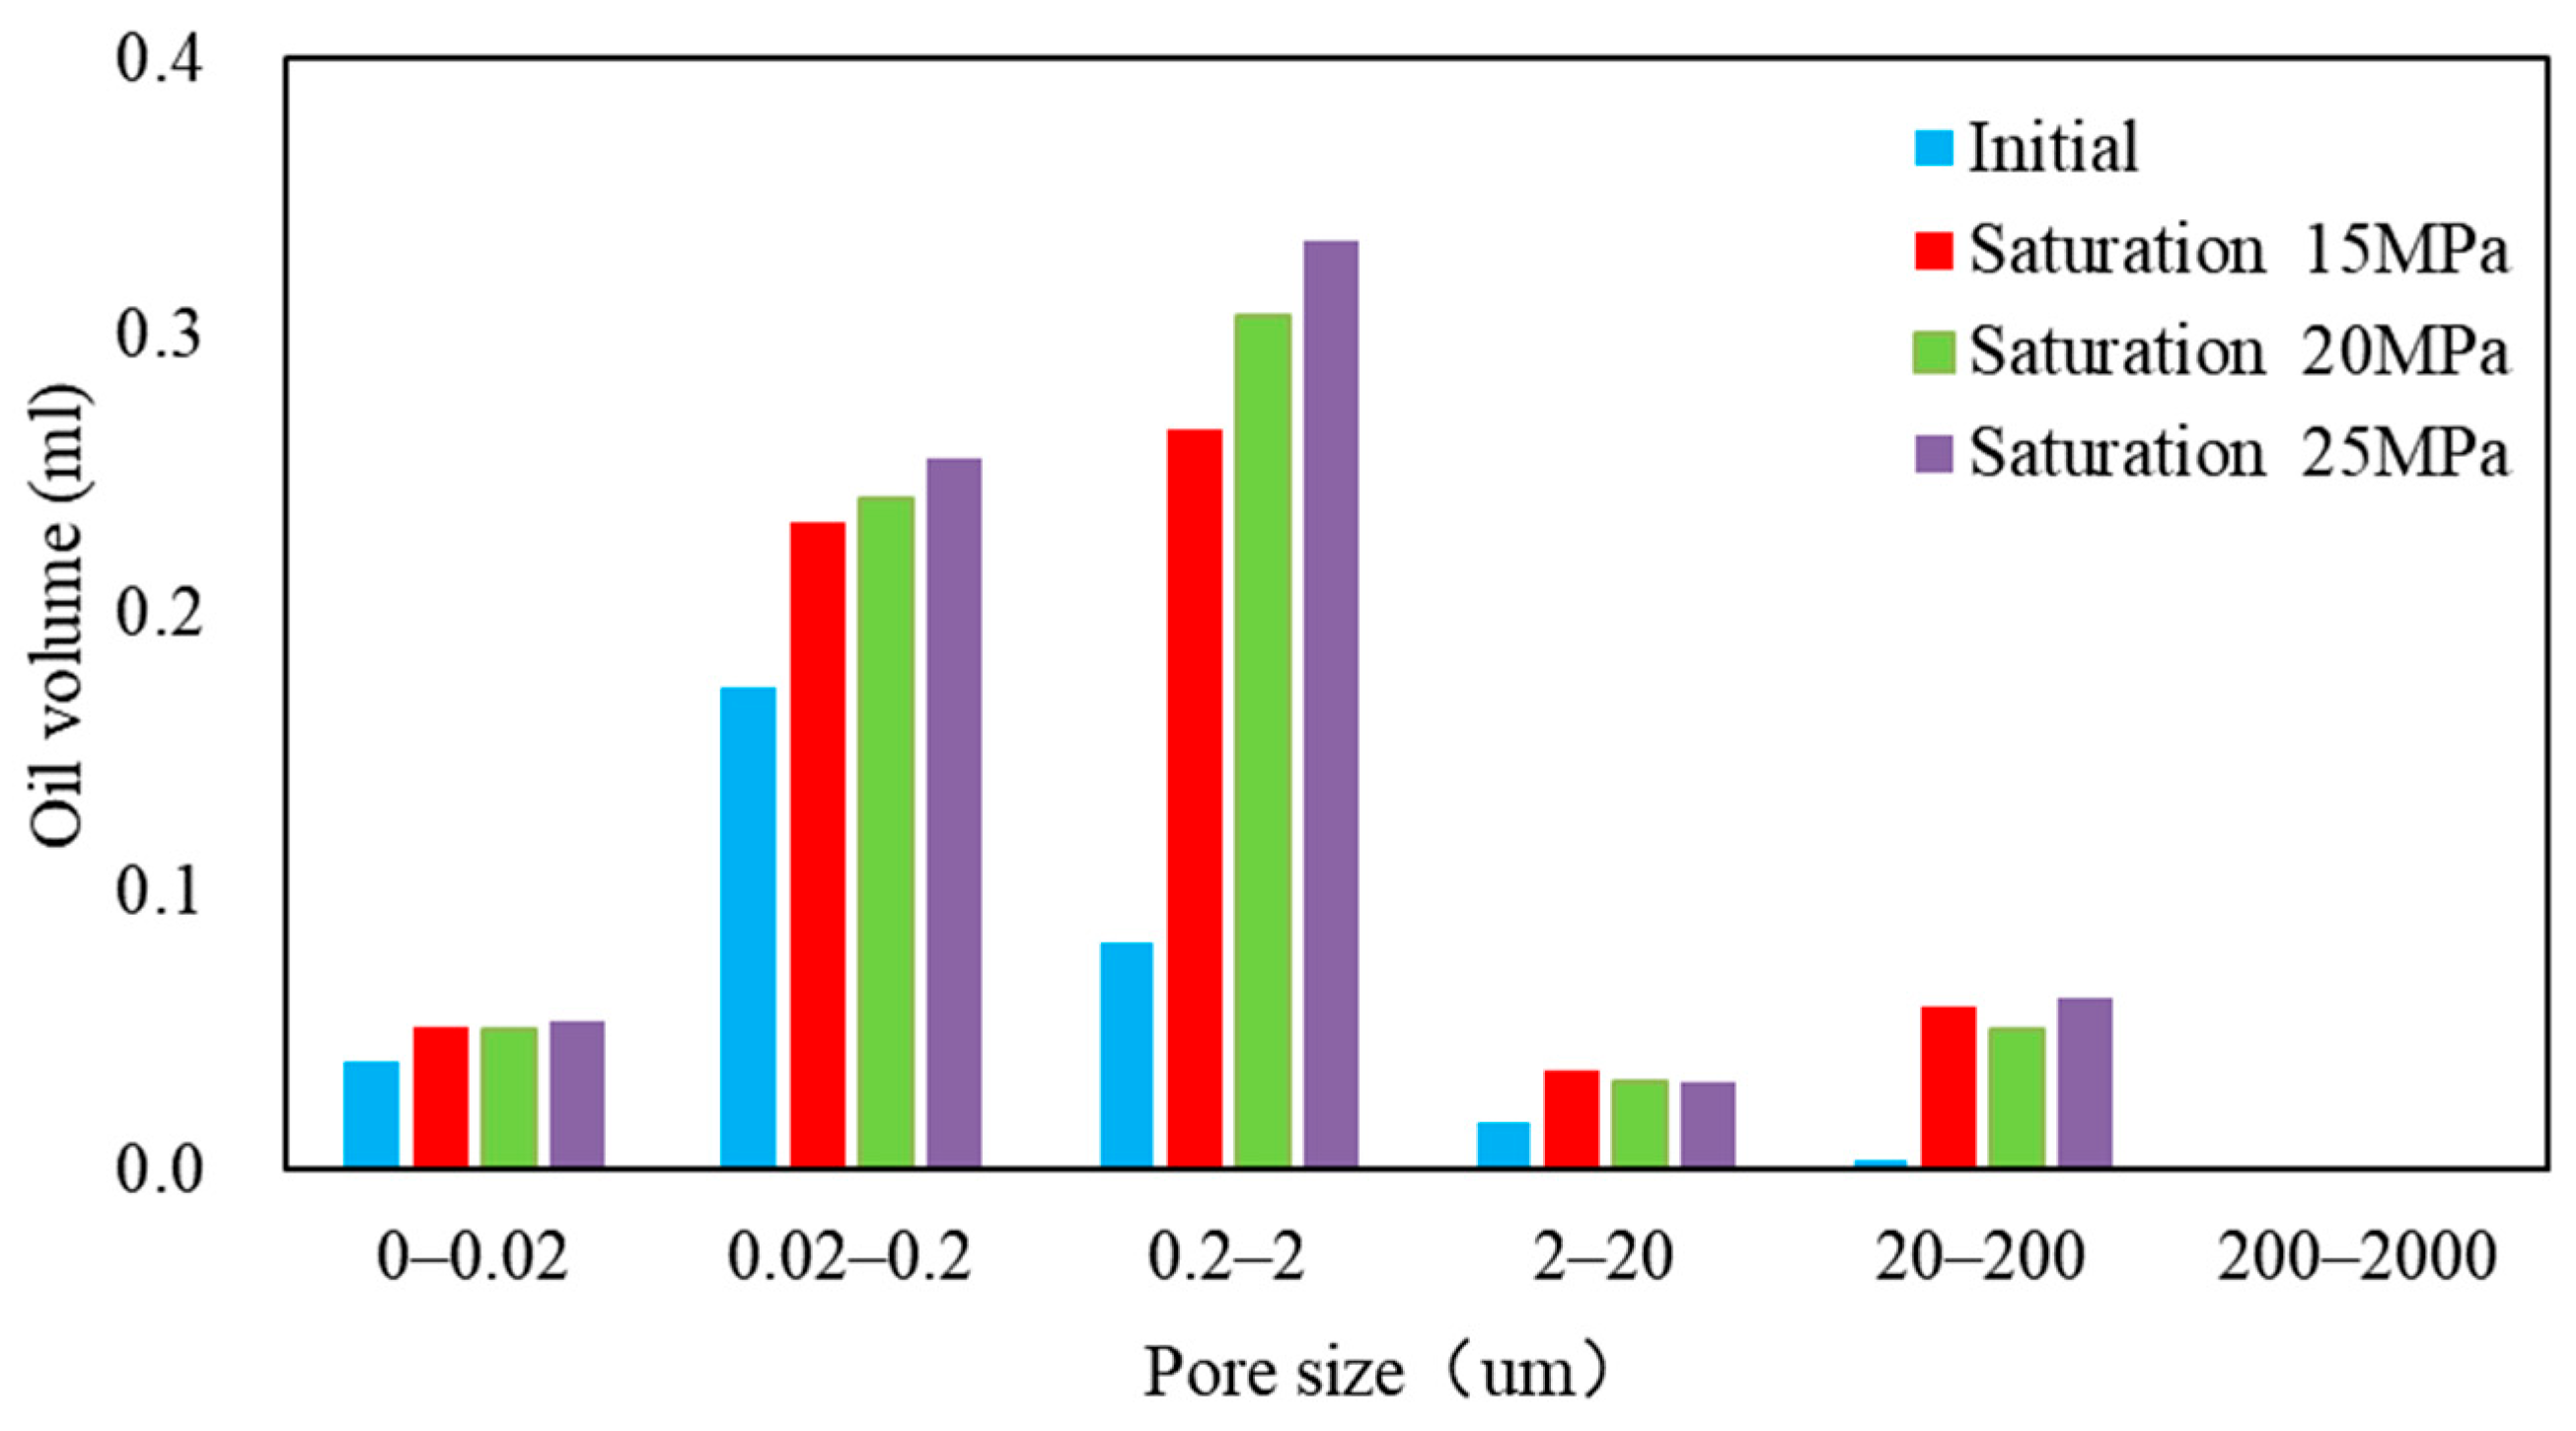
Further examination of the cumulative signals before and after saturation demonstrated that there was negligible crude oil saturation in the pores with apertures smaller than 8–10 nm. A review of the NMR signal data for each pore size, illustrated in
Figure 20, revealed that the core’s porosity was primarily concentrated in the 20–2000 nm range, with pores in the 0–0.02 nm range occupying a minor fraction of the total pore space. During the initial saturation at 15 MPa, the 200–2000 nm aperture pores exhibited the highest crude oil intake, suggesting that oil preferentially permeated into larger pores during the saturation process. As the saturation pressure and time increased, the saturation of the crude oil into the smaller pore sizes became more pronounced, indicating a progressive filling of smaller pore spaces alongside the larger ones.
3.4. Impact of Proppant on the Flow Capacity of Shale Oil Matrices
In order to more accurately reflect the field situation, we applied a layer of 70–140 mesh quartz sand to the surface of the crack created in core 8-2. This process introduced a certain degree of openness into the crack, after which the core was fixed using heat-shrink tubing. To ensure consistent control over the effects of saturation time on the core’s flow capacity, the experimental procedure was structured in two phases. The core was initially subjected to a 48 h saturation period without the addition of sand. Following the application of the sand layer, a second saturation flow experiment was conducted for an additional 48 h. The fundamental properties of core no. 8-2 are detailed in
Table 7, and the outcomes of these experiments are depicted in
Figure 21 and
Figure 22.
The saturation process, which involved vacuum and high-pressure treatment, was applied to core no. 8-2 after undergoing the seam treatment. This resulted in a crude oil saturation degree of 74.35%. An analysis of the NMR T2 spectra before and after saturation, as shown in
Figure 21, revealed a three-peak pattern in the core, with the peaks diminishing successively. To replicate the actual conditions of fracturing construction on site, the core underwent a saturation process after sand treatment. An analysis of the cumulative signals before and after saturation indicated that there was minimal crude oil saturation in pores smaller than 8–10 nm in aperture. The NMR signal analysis for each pore size, as illustrated in
Figure 22, indicated that the core’s porosity was primarily concentrated in the 20–2000 nm range, with other pore sizes comprising a smaller fraction.
Following the sand spreading treatment, a notable increase in crude oil saturation was observed in the 20–200 µm pore sizes. This finding indicates that the introduction of proppants during fracturing can facilitate the formation of more efficient channels for crude oil flow. Nevertheless, the reduction in crude oil content in the 0.2–20 micron pore space subsequent to the sand treatment indicates that the addition of proppant may also obstruct some pore spaces, which could impede the flow of crude oil.
3.5. Analysis and Discussion
Table 8 presents the test data from the saturated flow experiments conducted on the seven core groups.
Figure 23 illustrates the correlation between core permeability and crude oil saturation after the flow experiment. The average saturation of core 12-2 and core 16 was only 19.91%, which was significantly lower than the other cracked cores. This was due to the lack of artificial cracks.
It can be observed that as the permeability increases, the saturation of crude oil in the core also rises, indicating a stronger flowability. This relationship is linear. Moreover, the experimental results indicate that the matrix flow capacity of fractured shale oil is contingent upon a multitude of variables, including the degree of stratification development, the presence or absence of fractures and proppant, and the injection pressure.
For example, cores 8-2 and 19, which exhibited developed stratifications, reached a saturation degree of over 70%. In contrast, cores 5 and 9-2, which displayed undeveloped laminae, achieved a saturation degree of only 60–65%. This discrepancy indicates a deviation in the saturation situation. The development degree of stratifications has a direct impact on the seepage path and velocity of shale oil. In highly developed stratifications, shale oil can move rapidly to the wellbore with these natural channels, increasing the seepage velocity of the fluid. In the case of poor stratification development, shale oil needs to flow through micropores, its path is more tortuous, and the flow rate is relatively slow. In addition, the existence of stratifications also affects the seepage direction of shale oil and the effectiveness of reservoir development. In areas where stratifications are well developed, horizontal wells may be more likely to benefit from these fractures when fracturing, thereby producing shale oil more effectively. On the contrary, in areas with poor stratification development, more engineering methods are needed to improve the seepage conditions of the shale oil.
The presence of cracks increases the contact area between the core surface and crude oil, thereby intensifying the seepage–absorption–replacement effect. In the absence of cracks, the saturation of crude oil in the two cores after the microscopic flow experiment was only 9.66% and 30.15%, respectively. The results of the saturated flow experiment on core no. 8-2 indicated a saturation degree of 74.35%, which was significantly higher than that of the other cores. This is attributed to the sand paving of the cracks in this core, demonstrating the effectiveness of sand paving in enhancing the flow capacity of shale oil. In practical applications, fractures can increase the contact area between surfactants, percolating fluids, and other liquids with the reservoir, thereby improving the recovery rate. The addition of proppant after hydraulic fracturing can effectively support the fracture opening and make the flow channel of crude oil more spacious, thus increasing the fluid flow capacity.
4. Conclusions
This paper presents the results of seven groups of saturated flow experiments conducted on cores to investigate the impact of stratification development, fractures, injection pressure, and proppant presence on the flowability of the matrix of shale oil. By analyzing the results of nuclear magnetic resonance experiments before and after the microscopic flow experiments of several groups of cores, one can draw the following conclusions.
(1) The degree of development of stratifications is directly related to the effective permeability of shale oil. When stratifications are well-developed, they can form effective flow channels for shale oil, thereby improving the permeability of the reservoir as a whole. In contrast, if the formation joints are poorly developed, the shale oil must flow through more complex pore structures. This restricts the formation of fluid channels, resulting in a decrease in the effective permeability of the reservoir. The average crude oil saturation of the two samples with highly developed stratifications was 72.25%, while the average crude oil saturation of the two samples with poorly developed stratifications (with articulation joints) was only 62.595%.
(2) Imbibition is the primary factor that enables shale oil to flow within the matrix. The presence of cracks increases the contact area between the core surface and crude oil, thereby enhancing the effect of imbibition replacement. The saturation of crude oil in the two cores after the microscopic flow experiment was only 9.66% and 29.22%, respectively, in the absence of cracks in the core. The presence of fractures in actual mines can increase the contact area between fluids, such as surfactants and imbibition fluids, and the reservoir, thereby improving the recovery rate. The proppant added after hydraulic fracturing can effectively support the fracture opening, widen the flow channel of crude oil, and increase the fluid flow capacity.
(3) The flowability of shale oil within the matrix is constrained, with an average crude oil saturation of only 53.84% observed after saturation for more than 96 h at a pressure of 30 MPa. Increasing the injection pressure enables crude oil to overcome capillary forces and flow more readily into smaller pore sizes. The flow process is divided into two stages: a nonlinear initial section and a linear subsequent section. In multiple sets of pressure and rounds of microscopic flow experiments, crude oil was observed to enter the larger pores of 2–200 μm in size, followed by the nanoscale pores. It is important to note that even when the amount of crude oil in the larger pores ceased to increase, it still entered the pores that were smaller than 2 μm through imbibition. The cumulative signal amount of the NMR T2 spectra indicates that crude oil can only enter the core when the pore space scale is at least 8–10 nm. This implies that the minimum movable pore size of shale oil in the matrix is 8–10 nm.


