Article

Fiber Solidification Treatment of River and Lake Wastewater and Sediments: Deformation Characteristics and Microscopic Mechanism Research

1
College of Environmental Science and Engineering, Donghua University, Shanghai 201620, China
2
Anhui Ronggong Boda Environmental Protection Technology and Materials Research Institute Co., Ltd., Ma’anshan 243002, China
3
Tianjin Research Institute for Water Transport Engineering, M.O.T., Tianjin 300456, China
4
CCCC Tianjin Port Engineering Institute Co., Ltd., Tianjin 300222, China
*
Author to whom correspondence should be addressed.
Processes 2024, 12(5), 876; https://doi.org/10.3390/pr12050876
Submission received: 21 March 2024 / Revised: 17 April 2024 / Accepted: 24 April 2024 / Published: 26 April 2024

Abstract

:
River and lake dredging projects inevitably produce significant quantities of wastewater and sediment. This accumulation results in dredged soil with high moisture content, characterized by low strength, rendering it unsustainable for use. To facilitate environmentally friendly utilization of wastewater and sediment, solidifying agents and basalt fibers are introduced to solidify the wastewater within the dredged sediment. This process transforms the wastewater, sediment, solidifying agents, and basalt fibers into a novel, strengthened material. This transformation allows for their application as stabilized soil for engineering endeavors. Indoor experiments and scanning electron microscope analyses were performed to examine the deformation characteristics of fiber-stabilized soil and analyze its micro-mechanisms. Research findings suggest that as the curing age increases, the curing agent’s reaction becomes more comprehensive. Fibers have the potential to ameliorate soil damage. The proposed binary-medium model’s applicability and accuracy were validated through the analysis of triaxial test results employing the reinforcement principle. These findings establish a theoretical foundation for the resourceful utilization of wastewater and sediment.

1. Introduction

Global water bodies possess abundant hydraulic conditions. The principal approach to the development, maintenance, and enhancement of waterways and port areas involves dredging and silt removal. Concurrently, dredging and silt removal offer advantages in mitigating internal pollution in river, lake, and reservoir sediments. They also contribute to environmental initiatives, augment the flood discharge and storage capabilities of rivers and lakes, and represent a vital measure in averting flood disasters. Dredging projects significantly contribute to diverse facets of national development. The swift expansion of our nation’s economy is intricately linked to the backing of infrastructure development. Recently, there has been a noteworthy surge in diverse dredging initiatives. Nevertheless, the substantial accumulation of discarded silt resulting from dredging projects has exacerbated the environmental impact. Consequently, ensuring the appropriate disposal of dredged sediments is imperative for the seamless execution of dredging projects. Dredged sediments characterized by high water content exhibit a deficiency in strength, rendering them unsuitable for direct utilization in engineering applications. At the same time, the volume of wastewater is large and difficult to effectively utilize [1,2]. Chemical solidification reactions can be induced by the addition of cement, lime, and other solidifying agents, transforming the sediment’s moisture into bound water. Simultaneously, the resultant solidified product acts as a structural framework, augmenting the soil strength to meet engineering standards and transforming it into a viable geotechnical material. Conversely, fiber reinforcement technology represents a prevalent method for enhancing soil properties. Incorporating fibers enhances multiple soil properties, including the shear strength, and proficiently mitigates the challenge of brittle failure observed in conventional solidified soil. In recent years, scholars worldwide have made significant progress in the study of solidified soil, fiber reinforcement technology, and micro-mechanisms. Common solidifying agents for solidified soil include cement, quicklime, and fly ash. Numerous scholars have conducted experiments employing various methods, with a primary emphasis on saline soil [3,4,5,6,7,8], loess [9,10,11,12,13,14], and other typical soil types [15,16,17]. The existing studies show a comparatively limited focus on the solidification of dredged sediment from rivers and lakes. Consequently, investigating the solidification of dredged sediment from rivers and lakes as raw material soil is imperative. This research is crucial for addressing the solidification challenges prevalent in a broad spectrum of soft soils characterized by high water content and organic matter. Fiber reinforcement technology is a frequently employed method for soil remediation [18]. Within the soil, fibers intertwine and aggregate, creating a mesh-like spatial structure that markedly enhances diverse mechanical indicators [19]. Present research on fiber reinforcement technology primarily focuses on factors including fiber type [20,21,22], fiber content [23,24,25,26], and fiber length [27,28,29,30], enhancing the analysis of how the addition of fibers influences soil. Presently, the raw materials for fiber reinforcement predominantly consist of sandy soil [31,32,33,34] and loess [35,36,37,38]. Studies on high-water-content soft clay require further refinement. Consequently, investigating fiber solidification technology utilizing river and lake sediments as raw materials can contribute to broadening the application scope of fiber reinforcement technology. Recent technological advancements have led to a growing engagement of scholars in micro-scale research. Numerous micro-scale studies have illustrated the efficacy of solidification [39,40,41] and fiber reinforcement [42,43,44] as highly effective soil remediation methods. Nevertheless, limited research has been conducted on the combination of solidification and fiber reinforcement for treating dredged sediments from rivers and lakes, along with microscopic mechanism studies. Hence, the integration of solidification with fiber reinforcement technology is imperative for treating dredged sediments from rivers and lakes. Performing microscopic mechanism studies on this integrated approach is crucial for addressing the disposal challenges associated with soft soils characterized by high water content and organic matter.
In this paper, we employ materials such as cement, lime, and fibers to convert the substantial volume of dredged sediments produced in dredging projects into fiber-stabilized soil suitable for engineering applications. One-dimensional consolidation compression tests were conducted on both fiber-reinforced and unreinforced stabilized soil to elucidate the compression characteristics specific to fiber-stabilized soil. Unconsolidated undrained triaxial shear tests were performed to examine the impact of fiber length and content on the stress–strain relationship. Utilizing these experimental data, adjustments were made to the binary-medium model. The microstructure of fiber-stabilized soil was examined using a scanning electron microscope (SEM) to analyze the microscopic structural features of the stabilized soil following fiber incorporation.

2. Sample Preparation and Experimental Procedure

The raw soil and wastewater used in this study were used to dredge the sediment of Nanhu Lake in Jiaxing. After collecting the soil and wastewater, large shell impurities in the dredged sediment were first removed. Then, the upper layer of wastewater was collected and stored in a light-sealed container. According to the “Standard Test Methods for Geotechnical Testing” (GB/T50123-2019) [45], the dredged sediment was placed in an electric oven at 105 °C for at least 8 h. The dried soil was then crushed with a hammer, ground in a grinding bowl, and sieved through a 1 mm mesh sieve to remove large particles and remaining impurities from the soil, and the basic indicators of the soil are shown in Table 1.
This article utilizes artificial mixing methodology. Firstly, the materials, including the raw soil, wastewater, cement, quicklime, and fibers, are individually weighed on a balance according to predefined proportions. The raw soil is dried, ground in a mortar and pestle, and sieved through a 1 mm sieve. Additionally, the fibers utilized in this study require processing into varying lengths. Scissors and a ruler are employed for precise control over fiber length. Adequate fibers are prepared in advance and positioned in a porcelain bowl, ready for retrieval using forceps. To replicate real-world conditions, wastewater is initially mixed with the soil. Following thorough mixing of the water and soil, fibers, cement, and quicklime are sequentially added to the mixing pot and mixed uniformly for a minimum of 2 min to form a slurry. Once the sample is uniformly mixed, the slurry is gradually poured into the mold, which is pre-coated with Vaseline on its inner surface to facilitate easy demolding after the designated curing period; additionally, the bottom of the mold is lined with non-woven fabric. To prevent uneven gaps in the slurry within the mold, it is added incrementally in small portions. Following each addition, the mold is shaken vigorously in various directions before subsequent slurry additions. Any slurry adhering to the inner mold surface should be removed. Upon filling the mold with slurry, a scraper is employed to level it, and subsequently, the mold is sealed with non-woven fabric, labeled, and marked. Finally, the prepared soil sample undergoes a 3-day curing process within a curing box, following which it is demolded, wrapped in cling film, and subjected to further curing until reaching the designated test age.
The raw material employed in the experiments described in this paper primarily underwent triaxial tests. The mold used had a cylindrical shape with dimensions of an inner diameter of 39.1 mm and a height of 80 mm. Additional key tools and instruments comprised an electronic balance, graduated cylinder, geotechnical knife, mortar and pestle, oven, and ball mill. The solidifying agents employed in this study were ordinary Portland cement (P.O42.5) and calcium oxide (CaO). The fibers utilized were basalt fibers characterized by a single filament diameter ranging from 9 to 17 μm. They generally exhibited a brown hue with a metallic sheen.
We performed consolidation tests to characterize its deformation behavior. The fiber-stabilized soil underwent curing for durations of 7, 14, 28, and 60 days before the experimental procedures. Concurrently, a control group of solidified soil without fibers was introduced to enhance our comprehension of fiber’s impact on soil compression characteristics. The loading levels in the experiments were incrementally raised in a sequence of 25 kPa, 50 kPa, 100 kPa, 200 kPa, 400 kPa, 800 kPa, 800 kPa, 1200 kPa, and 1600 kPa. Each level underwent loading, and the process continued once the pressure gauge readings stabilized. The detailed experimental plan is presented in Table 2.
This paper aims to investigate the stress–strain curves of fiber-stabilized soil under various fiber contents and lengths using undrained and unconsolidated triaxial tests. The study employs the LFTD1805 advanced stress path triaxial apparatus as the experimental device. The testing system hardware comprises a triaxial pressure chamber, advanced loading frame, confining pressure controller, back-pressure controller, sensors, and other components. The triaxial pressure chamber is constructed with rigid organic glass and is capable of conducting standard UU/CU/CD shear strength tests. The applicable sample size is Φ39.1 mm * H80 mm. The loading frame has a vertical loading speed range of 0.001 to 40 mm/min, and the confining pressure controller ranges from 0 to 2 MPa, with a control accuracy of 1 kPa.
Considering the primary application of the fiber-stabilized soil developed in this paper as roadbed fill material, a relatively low confining pressure is chosen. The study adopts the undrained and unconsolidated (UU) scheme. For fiber-stabilized soil samples with a curing age of 28 days, confining pressures of 0 kPa, 25 kPa, 50 kPa, and 75 kPa are employed. The shear rate is fixed at 0.8 mm/min, and the maximum shear displacement is limited to 5%. The investigation delves into the stress–strain relationship of fiber-stabilized soil concerning changes in confining pressure, fiber content, and fiber length. The detailed experimental plan is outlined in Table 3.
The experiment utilized the JSM-7800F field emission scanning electron microscope. This instrument is applicable for the compositional analysis, cross-sectional morphology, microscopic structure, and defect detection of diverse samples, encompassing materials, biology, and geological minerals. Scanning electron microscopy experiments were performed on fiber-reinforced soils, cured for 7, 14, 28, and 60 days, at a magnification of 5000 times to scrutinize the microscopic mechanisms. Basalt fibers, with an approximate diameter of 17 μm, were employed in this investigation. Consequently, a magnification range of 300 to 1000 times was selected to scrutinize the distribution of basalt fibers within the soil. Notably, due to the smaller sample size in the SEM experiment compared to the fiber length, the fiber length of soil samples remained unaltered at 20 mm. The specific details of the experimental plan are presented in Table 4.

3. Results and Discussion

3.1. Compression Characteristics of Fiber-Solidified Soil

3.1.1. Compression Curve

The e-logP curve is shown in Figure 1. The e-logP curve depicted in Figure 1 illustrates the behavior of fiber-stabilized soil. Irrespective of the presence of fibers, the reduction in the pore ratio remains relatively gradual under low external loads. However, beyond a specific threshold of external load, a sharp decline in the pore ratio reduction becomes evident. This phenomenon can be attributed to the robust structural integrity exhibited by fiber-stabilized soil. When the applied load is below the structural yield stress, the soil structure remains intact, enabling it to support the soil framework under external forces with minimal alterations in pore size. In contrast, surpassing the structural yield stress compromises the internal soil structure, leading to significant relative particle sliding as the load increases. Consequently, the specimen undergoes compressive deformation, resulting in a notable increase in the pore ratio. The compression curve can be segmented into two phases: a gentle segment and a steep descending segment, with the structural yield point serving as the inflection point. As the curing age increases, there is a rightward shift of the structural yield point in the soil sample, indicating a gradual rise in the structural yield stress. At a 7-day curing age, the inflection point on the graph is less distinct, but with increasing curing age, it becomes more pronounced. This is attributed to the incomplete curing agent reaction within the soil at shorter curing ages. As the curing age advances, the curing agent reaction becomes more thorough, fortifying the soil structure and enhancing its resistance to compressive deformation. Consequently, a greater curing age results in a more pronounced inflection point and an increased structural yield stress.
Upon the addition of fibers to the soil sample, there is a reduction in the initial pore ratio of the soil. At low load stages, the variation trend of the pore ratio in the soil with added fibers mirrors that of the soil without fibers. The pore ratio of the soil with fibers consistently remains smaller than that of the soil without fibers. Under the same curing age, there is no significant difference in the position of the structural yield point between samples with and without fibers. However, upon surpassing the structural yield point, the rate of pore ratio reduction in the soil sample with fibers is less pronounced than in the soil sample without fibers. At the curing ages of 28 days and 60 days, post-soil yield, the pore ratio of the soil sample with fibers exceeds that of the soil sample without fibers. This indicates that after the soil structure yields, the ability of the soil sample with fibers to resist compressive deformation surpasses that of the soil sample without fibers.

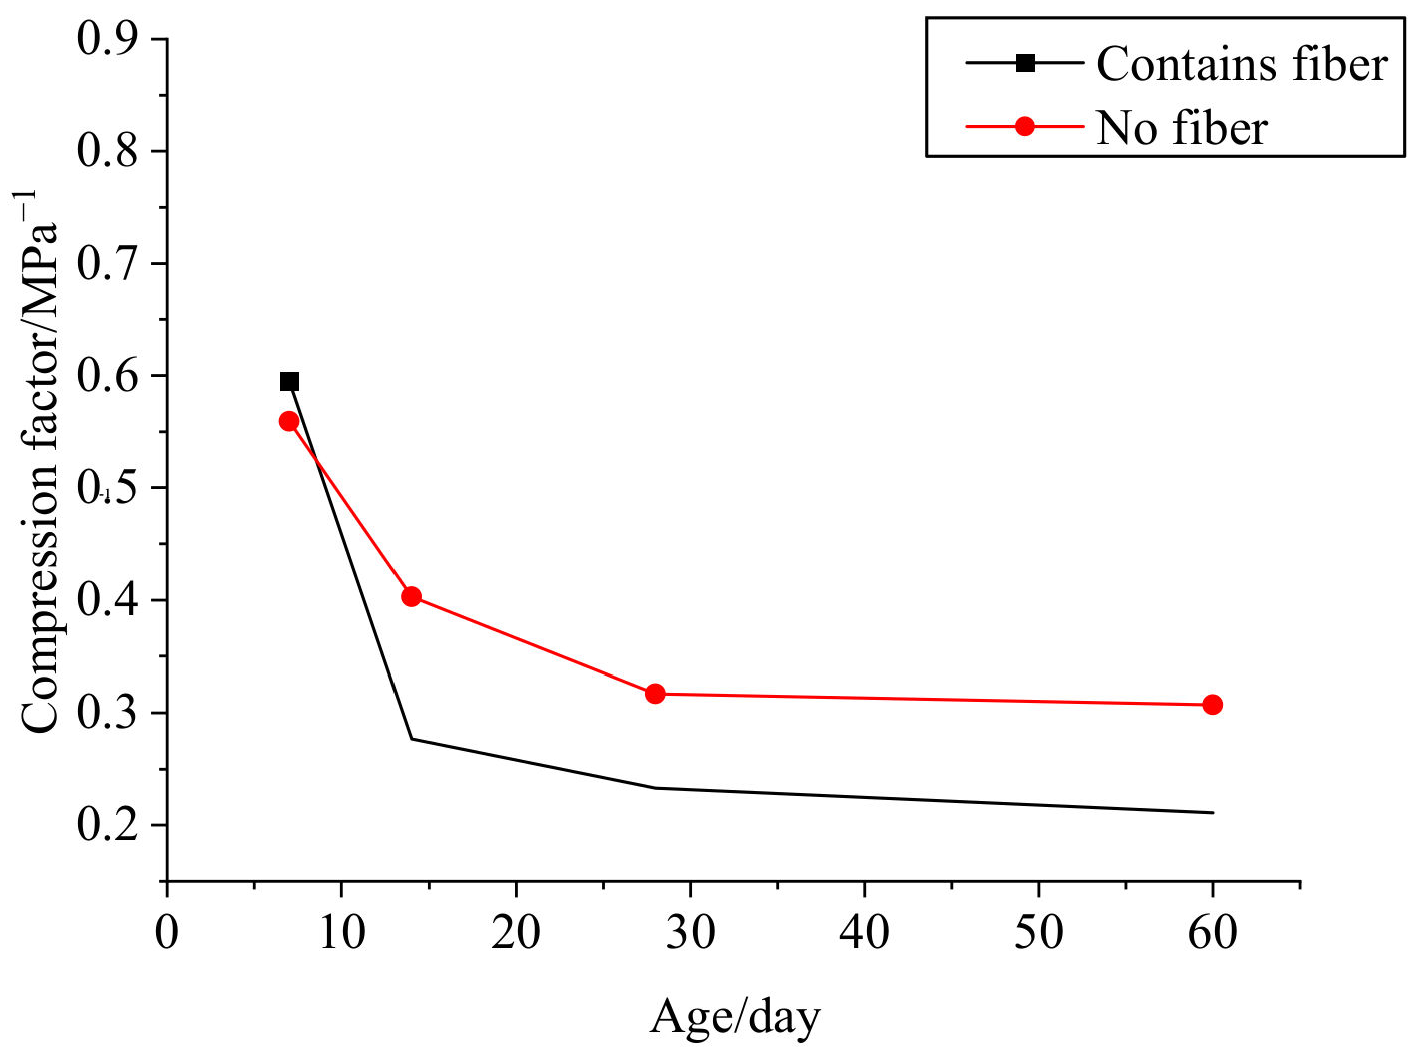
3.1.2. Determination of Compression Index

The soil’s compression indices encompass parameters such as the compression coefficient (αv), compression index (Cc), compression modulus (Es), and volume compression coefficient (mv). Within this section, the assessment of soil compressibility focuses on calculating the compression coefficient (α) and compression modulus (Es) as evaluation criteria. These criteria, specifically, the compression coefficient (αv) and compression modulus (Es), are determined using the following formulas:
α v = e i e i + 1 p i + 1 p i × 10 3
E S = 1 + e 0 α v
In the equation:
  • αv—compression coefficient of the soil, MPa-1;
  • pi+1, pi—a certain unit of pressure value, kPa;
  • ei+1, ei—porosity corresponding to a certain level of pressure;
  • Es—compression modulus, MPa.
For the sake of comparability, soil compressibility is commonly evaluated within a pressure range that increases from p1 (0.1) to p2 (0.2) megapascals (MPa). The computed results are detailed in Table 5, and the curves illustrating the variation in compression indices with curing age are depicted in Figure 2 and Figure 3.
The compression coefficient reflects soil compression characteristics under pressure, with a higher coefficient indicating greater soil compressibility. As depicted in Figure 2, the compression coefficient increases with curing age, albeit at a diminishing rate. Notably, the difference in the compression modulus between 28 days and 60 days is negligible, prompting the adoption of the soil sample’s compression coefficient at a 28-day curing age as the standard for classifying the compressibility of fiber-stabilized soil. According to established soil compressibility classifications, fiber-stabilized soil falls under the category of moderately compressible soil. At a 7-day curing age, minimal differences exist between the compression coefficients of the soil samples with and without fibers. However, with increasing curing age, the compression coefficient of the soil sample with fibers significantly decreases compared to that of the soil sample without fibers.
Illustrated in Figure 3, the variation pattern of the compression modulus with curing age is opposite to that of the compression coefficient with curing age. For instance, at a 14-day curing age, the compression modulus of the soil sample without fibers is 6.67 MPa, whereas with fibers, it is 9.68 MPa, representing a 45.13% increase. Similarly, at a 28-day curing age, the compression modulus of the soil sample without fibers is 8.2 MPa, and with fibers, it is 11.12 MPa, indicating a 35.61% increase. The addition of fibers significantly enhances the compression modulus of the soil, underscoring their role in improving the soil’s resistance to compression. Consequently, fiber-stabilized soil presents advantages over traditional stabilized soil in practical engineering applications.

3.2. Stress–Strain Relationship of Fiber-Solidified Soil

The stress–strain relationship obtained from the triaxial tests is shown in Figure 4 and Figure 5. From Figure 4 and Figure 5, it is evident that the deviatoric stress of fiber-stabilized soil exhibits a rapid linear increase with axial strain when the strain is small. However, as the axial strain increases, the rate of deviatoric stress increment decreases, marking the transition from a linear to a nonlinear relationship between deviatoric stress and axial strain. Beyond a certain axial strain, a distinct inflection point is reached, indicating the occurrence of structural damage in fiber-stabilized soil. Subsequent to this point, the deviatoric stress tends to stabilize, signifying the specimen’s attainment of residual strength. The results highlight the significant influence of different confining pressures on the stress–strain curves of fiber-stabilized soil. For a given soil sample, lower confining pressures correlate with lower peak strength, and stress-softening occurs post-peak strengthening. With increasing confining pressure, the peak strength shifts leftward and increases. Stress-softening becomes less pronounced, and at confining pressures of 50 kPa or 75 kPa, stress-hardening occurs, leading to a shift from brittle failure to bulging failure, as illustrated in Figure 6. These variations in confining pressure substantially impact the stress–strain relationship in fiber-stabilized soil. The physical properties observed in this study directly correlate with the morphology of the specimens. Upon the onset of axial strain in the soil, the binder created by the soil stabilizer deteriorates, yet there is minimal relative movement among the soil particles. This binder contributes significantly to the cohesive strength. As the axial strain intensifies, the binder further deteriorates, leading to increased relative movement among the soil particles and initiating the role of fibers. In fiber-stabilized soil containing basalt fibers, the pressurization process results in a more compact bond between soil particles and basalt fibers. This enhances friction between them, effectively transmitting and dispersing longitudinal loads, thereby strengthening the overall integrity and toughness of the soil-cement. Hence, under high confining pressure, fiber-stabilized soil demonstrates bulging failure, significant stress-hardening, and substantial residual strength.
Figure 4 illustrates stress–strain curves for fiber-stabilized soil with varying fiber contents. Notably, during the elastic deformation phase, the slope of the stress–strain curve increases with rising confining pressure. At identical confining pressures, an augmented fiber content corresponds to an increased peak strength in the fiber-stabilized soil. Moreover, at the same confining pressure, higher fiber content shifts the stress–strain curve toward stress-hardening post-specimen failure. For instance, a 0.1% fiber content soil sample exhibits stress-softening at 50 kPa and 75 kPa confining pressures. However, with further increases in fiber content, stress-hardening occurs at 50 kPa and 75 kPa, and even the 0.3% fiber content soil approaches stress-hardening at 25 kPa. This underscores the effective enhancement of post-failure strain behavior by fibers [46], with the improvement becoming more pronounced with increased fiber content.
In Figure 5, stress–strain curves for fiber-stabilized soil with varying fiber lengths are presented. Notably, during the elastic stage, changes in the confining pressure do not significantly affect the slope of the stress–strain curve. This implies that fiber length has minimal impact on the initial deformation modulus of fiber-stabilized soil. At identical confining pressures, a longer fiber length results in a slight peak-strength enhancement, although the overall magnitude is not substantial. In the plastic deformation stage, under 0 kPa confining pressure, all soil samples exhibited stress-softening, whereas at 50 kPa and 75 kPa, they exhibited stress-hardening. This difference is primarily attributed to the changes in confining pressure. At 25 kPa confining pressure, an increase in fiber length initially tended toward stress-hardening and then reverted to stress-softening. The soil sample with a 20 mm fiber length was closest to stress-hardening. This suggests the existence of an optimal fiber length for fiber-stabilized soil, maximizing its effectiveness in influencing the soil’s failure mode [47]. Figure 6 depicts the failure modes of specimens under different confining pressures.

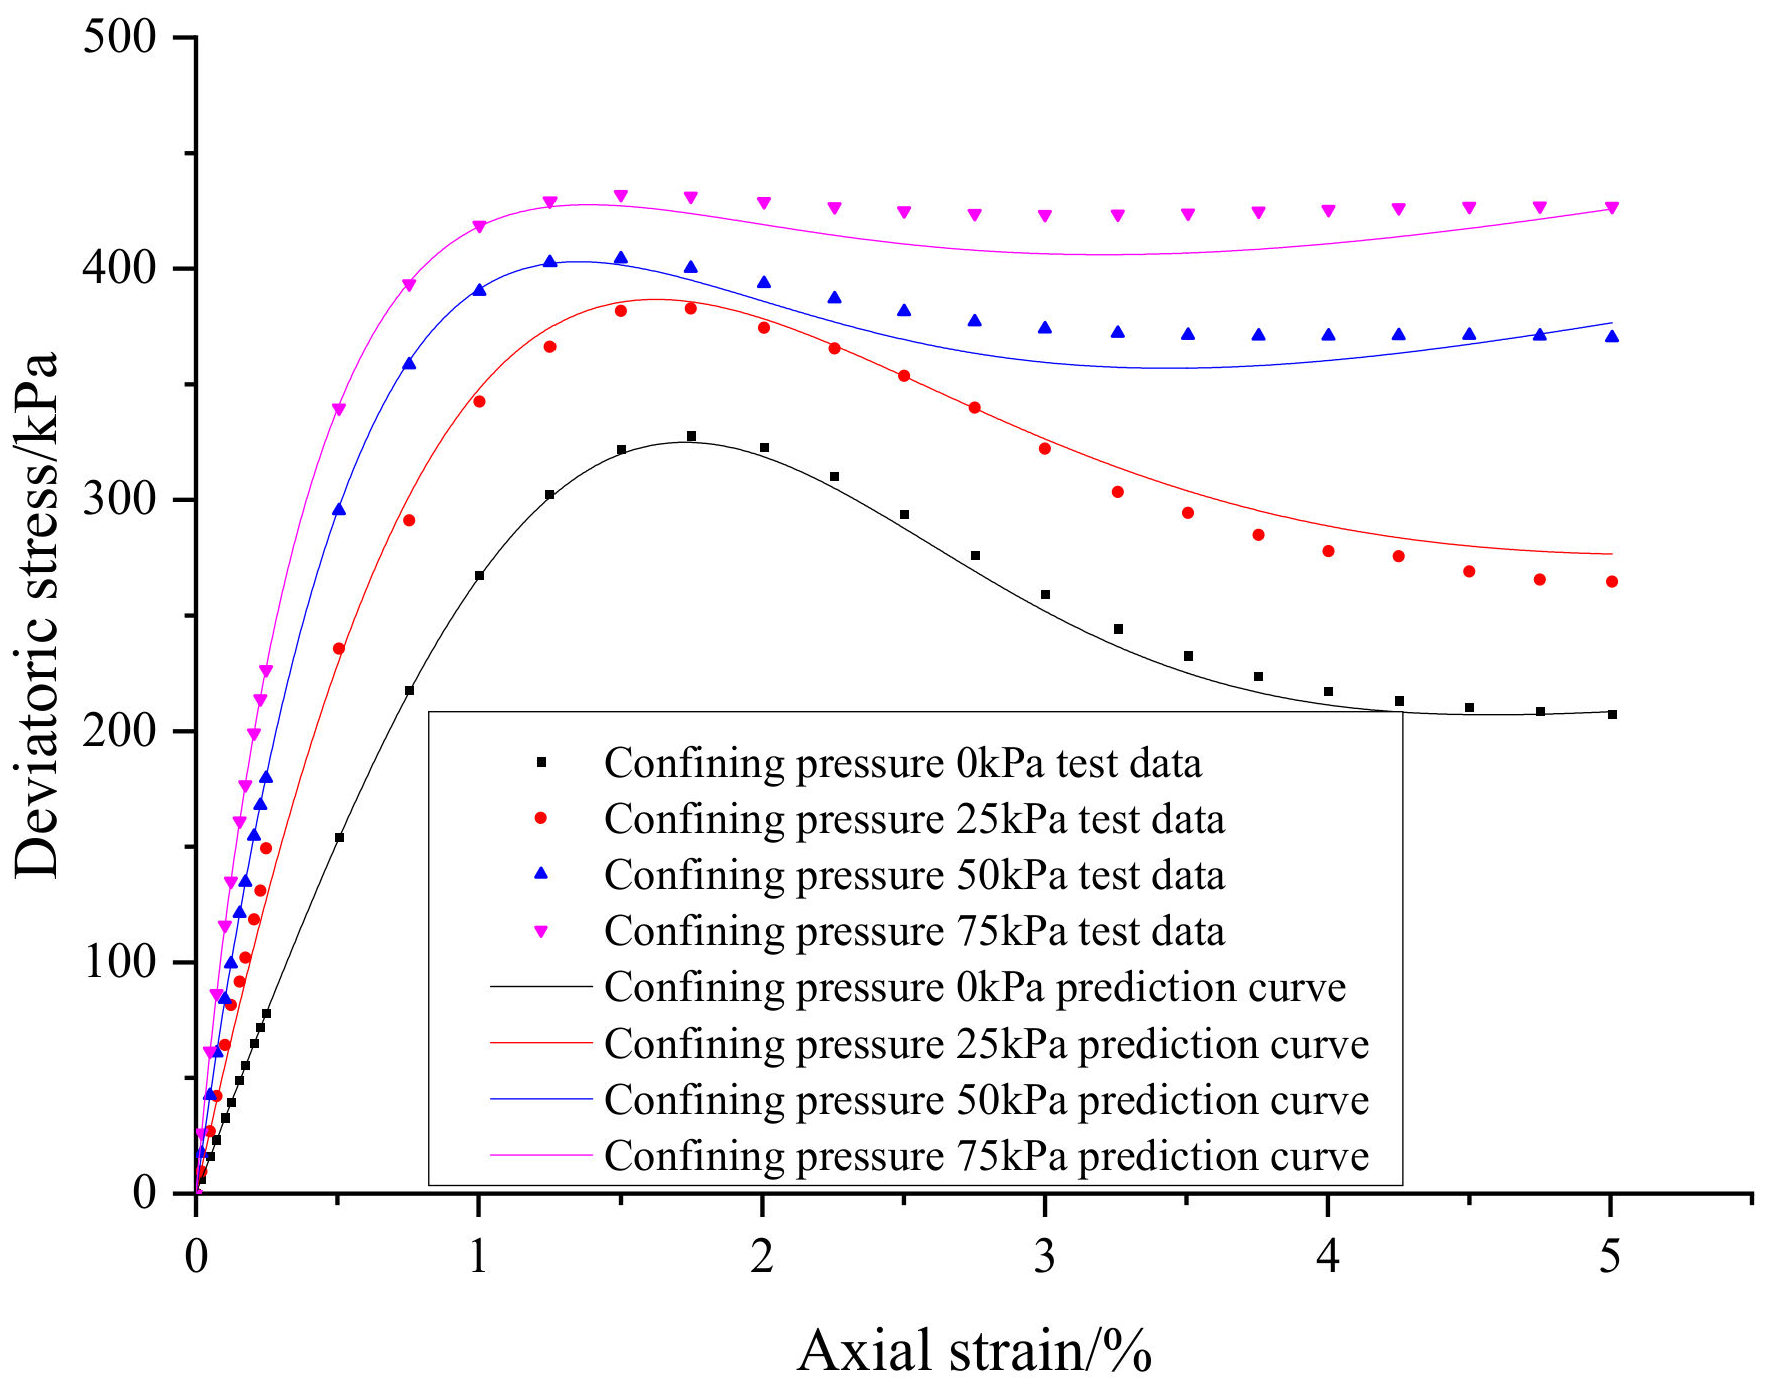
3.3. Establishment of Binary-Medium Model

3.3.1. Model Applicability Analysis and Modification

This study aims to investigate the impact of confining pressure on model parameters and elucidate the evolution mechanism of the internal soil structure. The process of parameter determination is as follows:
(1)
Utilize the initial slope of the stress–strain curve obtained from triaxial tests as the elastic modulus of the cementitious element.
(2)
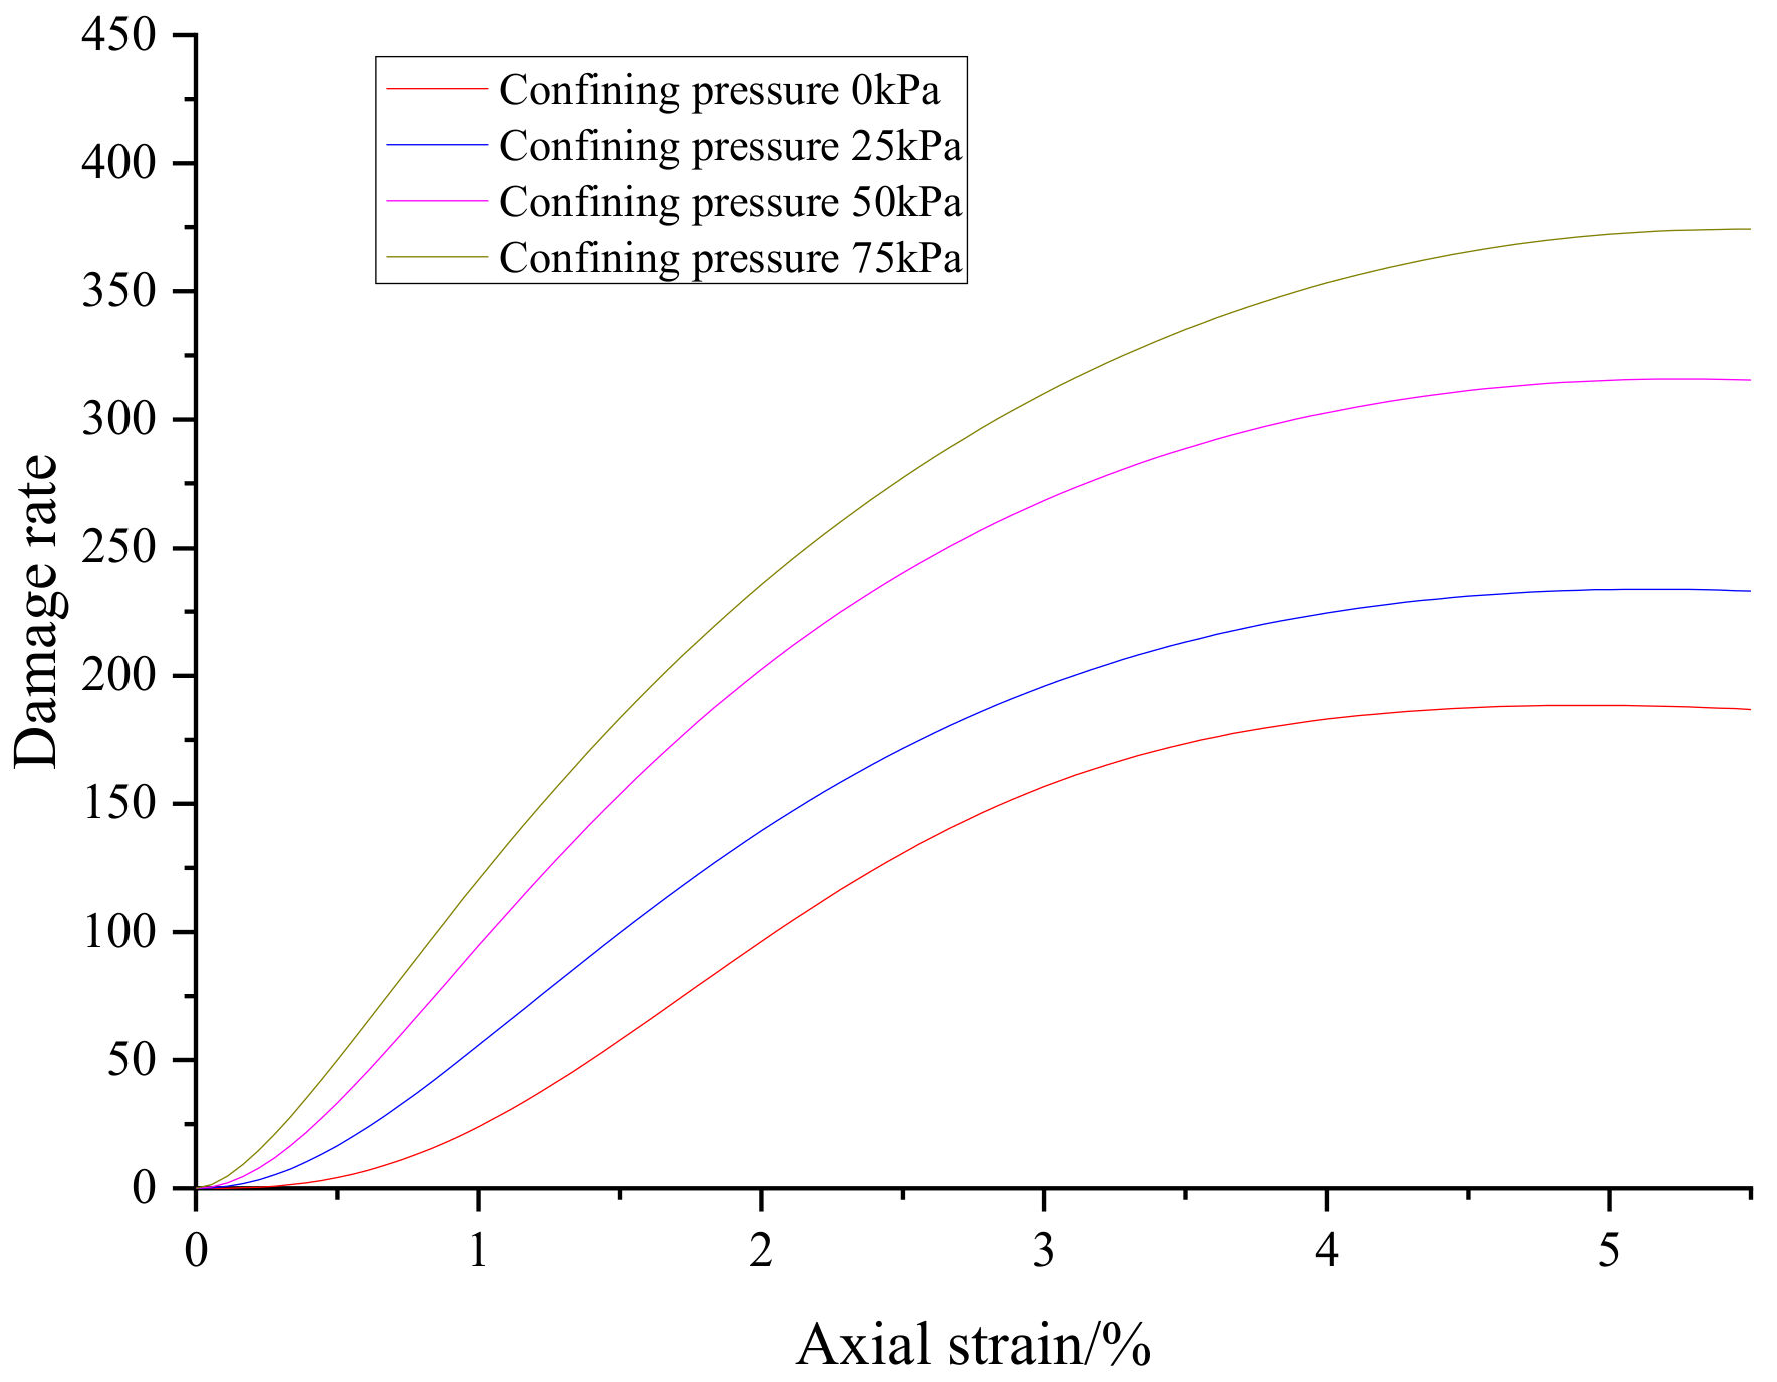
Temporarily neglect the contribution of the frictional element stress. Adjust the damage rate function to position the peak point of the stress–strain relationship of the cementitious element approximately in line with the test curve, with the peak slightly smaller than the test curve’s peak. Ensure a post-peak trend similar to that of the experimental curve.
(3)
Gradually adjust the frictional element parameters to align the stress–strain curve of the binary-medium model with the test curve.
(4)
Adhere to the basic rule that higher confining pressure corresponds to greater frictional element stress. Establish the constitutive relationship of the binary-medium model for multiple curves under varying confining pressures. Simultaneously, ensure a smooth transition of the damage rate curve with changes in confining pressure. Throughout the adjustment process, achieve an improved fitting effect by adjusting the local strain coefficient.
Following the previously outlined parameter determination approach, the parameters for the binary-medium model are established and presented in Table 6. By inputting the data from Table 6 into the model, a predicted curve is generated and subsequently compared with the triaxial test results curve of fiber-stabilized soil featuring a 0.2% fiber content and a 20 mm fiber length. The comparison is illustrated in Figure 7.
Upon examining Figure 7, it is apparent that employing the previously mentioned approach to determine the parameters allows the binary-medium model to roughly depict the stress–strain characteristics of fiber-stabilized soil under varying confining pressures. Notably, at lower confining pressures, the model manifests stress-softening, while at higher pressures, it demonstrates stress-hardening. The predicted curve aligns closely with the experimental results before reaching the peak stress. However, after the peak stress, discrepancies emerge, particularly at higher confining pressures, where the predicted curve significantly deviates from the experimental results, displaying distinct variations. Consequently, adjustments to the model are deemed necessary.
The disparities between the predicted and experimental results primarily emerge in the later stages. Following the peak stress, the frictional elements within the soil assume the majority of the stress. Hence, it becomes imperative to consider modifications to the model pertaining to the stress of the frictional elements. Conversely, the predicted results before reaching the peak stress generally align with the experimental results, underscoring the model’s reliability for the cementitious element. In summary, adjustments to the binary-medium model should center on the frictional element component, with specific emphasis on analyzing the stress variation pattern of the frictional elements with strain, as depicted in Figure 8.
As depicted in Figure 8, the frictional shear stress gradually increased with the augmentation of strain, aligning with the foundational principles of Coulomb’s friction law. Nevertheless, at larger strains and elevated confining pressures, a noticeable convergence in the frictional shear stress was absent. However, it is noteworthy that, at this juncture, the deviatoric stress of the soil sample stabilizes, attaining residual strength. Consequently, the anticipated frictional shear stress curve for the model deviates from the observed scenario. In response to this, we introduce a correction function, denoted as f(ε), to amend the frictional element model. Subsequently, the relationship between frictional shear stress and strain can be articulated as follows:
σ f = λ c ε a + b c ε × f ( ε )
Compare the experimental results with the predicted model outcomes. Through calculations, the expression for the correction function can be obtained:
f ε = 0.04903 + 1.06739 0.208002 × ε 2.9475 2
For idealized cohesive elements and frictional elements with nonlinear elastoplastic characteristics, their average stress–strain relationships can be expressed as:
σ = 1 λ E b ε b + λ E f ε f
Substituting Equation (4) into Equation (3), the modified frictional shear stress curve can be obtained, as shown in Figure 9:
The modified frictional shear stress exhibits pronounced signs of convergence at larger strains, aligning consistently with the observed behavior. Upon substituting the corrected frictional element model into Equation (5), a comparison is made between the predicted curve of the model and the experimental results, as depicted in Figure 10. From Figure 10, it is evident that the modified model curve aligns well with the experimental results, indicating that the model is applicable to fiber-reinforced soil.

3.3.2. Modified Model after Adding Fiber Parameters

The introduction of fibers constitutes a pivotal element that significantly shapes the stress–strain characteristics of fiber-reinforced soil. Consequently, in the formulation of a dual-medium model for such soil, the integration of two crucial fiber parameters—namely, fiber length and fiber content—is imperative. These parameters, fiber length and fiber content, exhibit an inherent interrelation. In order to characterize the distribution of fibers within the soil, we introduce a dimensionless parameter denoted as C, which serves to replace the correlation between fiber content and fiber length. The definition of parameter C is expressed by the following equation:
C = M L
M = m 0.2 %
L = l 20
In the equation, C represents the parameter reflecting the distribution of fibers. M is the dimensionless parameter for fiber content, defined as the ratio of fiber content to the content at 0.2%; m is the fiber content; L is the dimensionless parameter for fiber length, defined as the ratio of fiber length to the length at 20 mm; and l is the fiber length.
After incorporating the fiber parameters into the model, the modification is considered in two aspects. First, there is a correction to the cohesive element, where changes in fiber parameters result in differences in the initial elastic modulus and peak stress of fiber-reinforced soil. Therefore, an amendment function h(C) is introduced for the cohesive element. Second, there is a correction to the frictional element, and this correction method is similar to the one discussed in the previous section. Here, a frictional element correction function f(ε,C) is introduced. The modified dual-medium model is expressed as shown in Equation (9):
σ = 1 c λ E b ε × h C + λ c ε a + b c ε × f ( ε , C )
The correction function h(C) for the cohesive element primarily focuses on the correction of the initial elastic modulus. Taking the initial elastic modulus of the soil sample with 0.2% fiber content and 20 mm fiber length as the reference, the ratio of the initial elastic modulus for other soil samples to this reference is taken as the value of h(C), as illustrated in Figure 11.
From Figure 11, the expression for h(C) can be calculated as shown in Equation (10):
h(C) = 0.77297 + 0.3698 × C − 0.14671 × C2
The solution method of the correction function f(ε,C) of the friction element part is divided into two steps. First, the correction function related to ε is obtained according to the correction method. Here, Equation (4) is written as Equation (6). Solving soil samples with different C values to obtain the correction function can determine the undetermined parameters A, B, E, and F corresponding to the correction function at different C values. Then calculate the relationship between the parameters A, B, E, F, and C, and then substitute the relationship into (6) to get the correction function f(ε,C) after considering the fiber parameters.
f ε = A + B E × ε F 2
According to the above method, A, B, E, and F corresponding to different C values can be obtained, as shown in Table 7 and Figure 12.
From Figure 12 above, we can obtain the relationship between parameters A, B, E, F, and C as follows:
A = 0.03257 + 0.02776 × C 0.012 × C 2
B = 1.31187 0.31779 × C + 0.13068 × C 2
E = 0.04538 0.24776 × C + 0.10399 × C 2
F = 4.29546 1.40394 × C
Substituting Equations (12)–(15) into Equation (11) and then using Equation (9) to obtain the predicted results of the formula, a comparison with the experimental results is shown in Figure 13. The comparative results in Figure 13 indicate a high level of agreement between the predicted and experimental results. The credibility of the modified predictive model results is confirmed.

3.3.3. Changes in Model Parameters with Confining Pressure

As previously indicated, fiber-reinforced soil manifests robust structural characteristics, and its stress–strain behavior is notably influenced by confining pressure. Examining the alterations in dual-medium model parameters under varying confining pressures enhances our understanding of how confining pressure shapes the internal stress distribution in fiber-reinforced soil. Concurrently, the development of a confining pressure-related normalized dual-medium model elevates the model’s applicability.
To enhance the general applicability of the model with the inclusion of confining pressure, a dimensionless confining pressure P is introduced, defined as follows:
P = σ 3 P a
In the equation: σ3 represents the confining pressure; Pa is the atmospheric pressure.
In this article, the binary-medium model has a total of 6 parameters: initial elastic modulus Eb; local deformation coefficient c; nonlinear material coefficients α, n; and material parameters a, b. According to the above parameter determination idea, its dimensionless range can be obtained. The variation curve of pressure P is shown in Figure 14.
From the fitting results in Figure 14, it can be concluded that the fitting formula for each parameter of the binary-medium model and the dimensionless confining pressure P is as follows:
α = 0.24693 + 1.72926 P ,   R 2 = 0.99665 n = 1.21979 × exp ( P / 0.29689 ) + 0.72914 ,   R 2 = 0.9956 c = 0.01426 × ( P / 0.74728 ) + 0.97575 ,   R 2 = 0.99964 Eb = 1409.44553 × P + 280.70239 ,   R 2 = 0.98242 a = 0.00124 × exp ( P / 0.47048 ) + 0.00448 ,   R 2 = 0.95589 b = 0.00387 × exp ( P / 0.73914 ) + 0.00025284 ,   R 2 = 0.9898
Based on the above fitting results and the correction function after fiber parameters are added, the binary-medium model can be enriched into the relationship between stress and strain, confining pressure, and fiber parameters:
σ ε , P = ( 1 c P 1 exp α P ε n P ) E b ( P ) ε × ( 0.77297 + 0.3698 × 10 4 × m l 0.14671 × C 2 ) + ( 1 exp ( α P ε n P ) ) c ( P ) ε a P + b P c ( P ) ε × ( 0.03257 + 0.02776 × C 0.012 × C 2 ) + ( 1.31187 0.31779 × C + 0.13068 × C 2 ) ( 0.04538 0.24776 × C + 0.10399 × C 2 ) × ε 4.29546 1.40394 × C 2
In the formula: C = 10 4 × m l ; m is the fiber content, %; l   is the fiber length, mm.

3.3.4. Stress Sharing Analysis of Friction Elements and Cementing Elements

The foundational premise of the dual-medium model involves formulating a homogenization theory for heterogeneous soil, conceptualizing the soil as a composite of cohesive and frictional elements. In triaxial tests, as strain increases, internal damage ensues in the soil, with cohesive elements gradually transitioning into frictional elements, inducing alterations in stress distribution within the soil. Consequently, within the dual-medium model, the volume damage ratio emerges as a pivotal parameter that establishes a correlation between the frictional and cohesive elements. The examination of the damage ratio holds substantial significance for comprehending the model. To illustrate, considering a soil sample with 0.2% fiber content and 20 mm fiber length, Figure 15 depicts the variation curve of the damage ratio with strain.
Figure 15 elucidates the variation in the damage ratio of fiber-reinforced soil with strain. At a confining pressure of 0 kPa, the increase in the damage ratio is modest at relatively low strains. Subsequently, as strain amplifies, the rate of damage ratio escalation accelerates. This phenomenon arises due to the persistence of voids between soil particles at lower confining pressures. These voids, acting as a cushion during axial deformation, impede significant damage to cohesive elements. With escalating confining pressure, the soil undergoes initial compaction, resulting in an upwardly concave shape of the damage ratio curve. In the early stages of axial strain, the damage ratio experiences rapid augmentation, while at larger axial strains, the growth rate tends to plateau. The higher the confining pressure, the more pronounced the initial slope of the damage ratio curve.
The fluctuation in the damage ratio (λ) also influences the stress distribution between cohesive and frictional elements. Examining the stress distribution between these elements provides insights into the internal structural evolution of fiber-reinforced soil during strain. Figure 16 illustrates the patterns of stress variation with strain for cohesive and frictional elements under different confining pressures.
In Figure 16, the stress distribution pattern exhibited by cohesive elements within the soil is generally uniform. With an increase in confining pressure, the initial growth rate of cohesive elements also intensifies. As the overall deviatoric stress of the soil attains its maximum value, the stress sustained by cohesive elements nearly reaches its zenith. Furthermore, subsequent to surpassing the peak deviatoric stress, the stress sustained by cohesive elements experiences a sharp decline. This observation signifies that following the attainment of peak stress, the cohesive structure within the soil has reached its limit, initiating extensive damage. At this juncture, numerous cohesive elements undergo a transformation into frictional elements, and the stress sustained by frictional elements continues to ascend.
Figure 16a,b depict stress-softening curves, while Figure 16c,d illustrate stress-hardening curves. Under both curve types, there is no significant divergence in the stress distribution pattern of cohesive elements. Cohesive elements bear the majority of the stress during the elastic stage. Upon reaching peak stress, the internal structure of the soil undergoes damage, cohesive elements transform into frictional elements, and the stress sustained by frictional elements increases. At this juncture, alterations in confining pressure exert a noteworthy influence on the stress sustained by frictional elements. The higher the confining pressure, the more substantial the augmentation in stress sustained by frictional elements, along with the maximum stress they endure. When the confining pressure is set at 50 kPa and 75 kPa, following the structural damage of the soil, the stress within the soil is predominantly attributed to frictional effects. Due to the elevated confining pressure, the stress sustained by the frictional elements surpasses the peak stress sustained by the cohesive elements, rendering the stress–strain curve of fiber-reinforced soil indicative of a stress-hardening behavior.

3.4. SEM Photo of Pores

Figure 17 presents the microscopic morphology of fiber-reinforced soil at 5000-times magnification under various curing ages. As depicted in the figure, the microscopic characteristics of fiber-reinforced soil undergo changes in conjunction with curing age and closely resemble those of conventional solidified soil. The presence of abundant fibrous materials, particle clusters, and reduced porosity in the interparticle spaces of the solidified agent signifies thorough internal hydration reactions and a significant enhancement in strength. Notably, the SEM image in Figure 17 reveals a reduction in pore size and an increase in density with the progression of curing age. This phenomenon is attributed to the solidification material in fiber-reinforced soil undergoing hydration reactions, resulting in the generation of a substantial amount of cohesive material.
With the advancement of curing age, the ongoing reaction leads to an augmentation in fibrous cohesive materials, filling the original pores and subdividing large pores into smaller, irregular ones. The hydration reactions within the internal solidification materials of fiber-reinforced soil become more extensive as the curing age increases. Augmenting particle clusters, combined with fibrous cohesive materials and cementitious bodies, interweave to establish a spatial structure. Acting as the soil’s skeletal material, they occupy the pores, markedly reinforcing its strength [48]. Consequently, alterations in the pore characteristics correspond to variations in the soil strength. A comparison between a 7-day curing age and a 28-day curing age reveals a noticeable reduction in pore area at 28 days, indicating a more comprehensive reaction between solidification materials. Conversely, at a 60-day curing age, the reaction progresses slowly. This microscopic analysis provides insights into the fluctuations in the strength of fiber-reinforced soil.

3.5. Establishment of Binary-Medium Model

The main curing agents used in fiber-solidified soil are cement and lime. The force between the reinforcement and soil includes bonding force and friction force. This section proposes a schematic diagram of the friction principle of fiber reinforcement based on the microscopic morphology of the fiber surface.

3.5.1. Curing Agent Reactants

Figure 18 illustrates that the surfaces of the fibers are coated with a substantial quantity of reaction products resulting from the combination of cement and lime. In Figure 18a, the principal products stem from the carbonation of lime. Lime undergoes processes such as ion exchange and ash binding, reacting with the soil. This interaction covers soil particles, giving rise to lime–soil aggregates. The hardening process exerts compression on the fibers by quicklime. Additionally, the rough and uneven surface of the solidified lime significantly enhances interlocking between the soil and the reinforcement. Consequently, when relative displacement occurs within the soil, the fibers offer frictional resistance to deformation, contributing to the soil’s cohesiveness and resilience.
As shown in Figure 18b, the primary products consist of cementitious materials generated during cement hydration. Cement crystals intertwine, forming a porous yet dense network structure. This structure exhibits high strength and contributes to the formation of a new framework within the soil. It establishes robust initial bonding forces between the soil particles and fibers in fiber-reinforced soil. The even distribution of fibers results in a stronger bonding force, particularly as the fiber content increases. This observation aligns with the earlier mentioned phenomenon that the cohesion (c) of fiber-reinforced soil increases with a higher fiber content.

3.5.2. SEM Photos of Fiber Distribution

The function of fibers in soil is intricate and subject to various influencing factors. Depending on the manner in which fibers are present in the soil, the interaction modes between fibers and soil particles can be classified into contact action, bending action, and interweaving action, among others. An examination of the microscopic distribution of fibers enhances our comprehension of the mechanisms dictating the influence of fibers in the soil. Given the fibers’ diameter of approximately 17 μm, the selected magnification for fiber observation ranged from 300 to 1000 times, as illustrated in Figure 19.
SEM images of fibers in the soil are presented in Figure 19. In Figure 19a, fibers aggregate into bundles, and the likelihood of this occurrence increases with higher fiber content. However, the aggregation of fibers diminishes the frictional effect between them due to the relatively smooth surface within the bundles. This phenomenon elucidates the decrease in soil strength when fiber content becomes excessively high. Figure 19b,c illustrate a more desirable fiber distribution, depicting an interwoven network that connects with surrounding soil particles. This arrangement restrains the relative movement of soil particles, thereby enhancing the overall soil integrity. In summary, the effectiveness of fibers in the soil is significantly influenced by their distribution. Generally, a high dispersion and dominant interweaving pattern result in superior fiber performance. Figure 19d,e display SEM images of a single fiber magnified 1000 times. Figure 19d reveals the interaction between the fiber, soil particles, and the reaction products of the solidifying agent. The fiber surface is densely covered with cementitious material, forming a crucial connection with soil particles. Under load, the fiber generates interfacial shear stress with the soil, reducing the tendency for relative movement between soil particles. In Figure 19e, one end of the fiber is positioned in the “anchoring” zone of soil particles, while the exposed end is considered as pulled out from the soil. The photo illustrates that the exposed fiber surface is adorned with numerous small cementitious materials, indicating a substantial interlocking action between the fiber and soil interface during the pulling process. This results in the retention of a considerable amount of cementitious material on the fiber surface after extraction.

3.5.3. Analysis of Reinforced Friction Principle

Based on the above SEM (scanning electron microscopy) photo characteristics of the fibers and the experimental results mentioned earlier, a schematic diagram illustrating the reinforcement friction principle of fibers in the triaxial shear test of fiber-stabilized soil is proposed, as shown in Figure 20.
Figure 20 is a diagram of the reinforcement/soil interface between basalt fiber and soil particles, cement hydration products, and lime reactants inside the soil under ideal conditions. From the analysis of the SEM photos above, it can be seen that lime and soil undergo ion exchange, ash caking, etc., covering the soil particles to form lime soil aggregates; the cement hydration product is a flocculent cement, which connects soil particles, fibers, etc. and provides cohesion. Assume that the length of the basalt fiber micro-unit in Figure 20 is dl; the contact area between the side of the fiber micro-unit and the cement and soil particles is A; the average friction coefficient between the fiber and the surrounding soil particles and cement is f; and the confining pressure is σ3. It can be approximately regarded as the normal stress perpendicular to the fiber micro-element body, so then the total friction force dF generated by the micro-segment fiber is:
F = σ 3 × l × A × f
During the triaxial shear test, when the axial strain was small, the cementing effect of the cement bore the main stress. At this time, the cement did not undergo a large amount of damage, as shown in Figure 20a. When the axial strain continued to increase and the deviatoric stress reached the peak stress, the cement was destroyed in large quantities and filled in the pores between soil particles and fibers. At this time, more cement is directly in contact with the fiber micro-units, which can be regarded as the contact area. A increases, and due to the existence of confining pressure σ3, part of the cement will penetrate into the fibers after breaking, that is, the average friction coefficient f will increase, as shown in Figure 20b.
In the triaxial shear test, the presence of cementitious material led to an approximate elastic deformation process before reaching the peak stress, accompanied by a rapid stress escalation. Subsequent to surpassing the peak stress, substantial destruction of the cementitious material, coupled with the presence of fibers, induced heightened friction. Furthermore, as the confining pressure (σ3) increased, the intensification of this frictional effect became evident. Under confining pressures of 50 kPa and 75 kPa, an increase in axial strain resulted in a further rise in stress, displaying a stress-hardening curve. The proposed reinforcing friction principle, based on the microscopic morphology of fiber surfaces, corresponds with the earlier analyzed transformational relationship between frictional and cementitious elements using the binary-medium model. This reiterates the suitability and precision of the binary-medium model for fiber-stabilized soil.

4. Conclusions

This paper presents a solution to the substantial annual generation of dredged sediment, with the goal of converting waste into valuable resources. The integration of solidifying agents, including cement and lime, enables the conversion of river and lake dredged sediment into geotechnical materials directly suitable for use. Moreover, the addition of fibers aims to enhance the deformation characteristics of the sediment. The impact of fibers on deformation characteristics was examined through consolidation and triaxial tests. Mechanism research was carried out via scanning electron microscopy experiments, yielding the following conclusions:
(1)
At smaller maintenance ages, no significant difference in the compression coefficient of fiber-stabilized soil is observed. With increasing maintenance age, the stabilizer’s reaction becomes more complete, leading to a more pronounced inflection point in the compression curve of fiber-stabilized soil and an increase in structural yield stress. Incorporating fibers into the soil sample can decrease its initial porosity. Fiber-containing soil samples exhibit greater resistance to compression deformation compared to fiber-free samples.
(2)
The stress–strain relationship of fiber-stabilized soil is significantly influenced by confining pressure. Under low confining pressures, fiber-stabilized soil undergoes stress-softening, whereas under high confining pressures, it experiences stress-hardening. Fibers can effectively ameliorate post-damage strain conditions in the soil, with enhancement improving as fiber content increases. An optimum fiber length exists for fiber-stabilized soil.
(3)
We constructed a binary-medium model for fiber-stabilized soil and determined the relationship between stress and strain, confining pressure, and fiber parameters. Utilizing this model, we conducted stress-sharing analyses of frictional and cementitious elements, elucidating the evolutionary laws governing the soil’s internal structure.
(4)
A schematic diagram illustrating the reinforced friction principle is proposed based on the analysis of fiber SEM photos and triaxial test results. The applicability and accuracy of the binary-medium model were further validated through an analysis of the triaxial test results employing the reinforcement principle.

Author Contributions

Conceptualization, A.Y.; methodology, A.Y.; software, J.X.; validation, Y.G.; formal analysis, A.Y.; investigation, Y.G.; resources, J.H.; data curation, J.X.; writing—original draft preparation, J.X.; writing—review and editing, J.X.; visualization, F.L.; supervision, X.L.; project administration, J.X.; funding acquisition, A.Y. All authors have read and agreed to the published version of the manuscript.

Funding

This project was supported by the National Natural Science Foundation of China (No. 51978440,42177119, 42377141) and the Fundamental Research Funds for the Central Universities (No. 2232021A-07).

Data Availability Statement

The manuscript is a data self-contained article, whose results were obtained from the laboratory analysis, and the entire data are presented within the article.

Acknowledgments

We express our gratitude for the support provided by the School of Environmental Science and Engineering at Donghua University.

Conflicts of Interest

Author Fengjun Li was employed by the company Anhui Ronggong Boda Environmental Protection Technology and Materials Research Institute Co., Ltd. Author Jinfang Hou was employed by the company CCCC Tianjin Port Engineering Institute Co., Ltd. The remaining authors declare that the research was conducted in the absence of any commercial or financial relationships that could be construed as a potential conflict of interest.

References

  1. Khatri, M.; Ahmed, F.E.; Al-Juboori, R.A.; Khanzada, N.K.; Hilal, N. Reusable environmentally friendly electrospun cellulose acetate/cellulose nanocrystals nanofibers for methylene blue removal. J. Environ. Chem. Eng. 2024, 12, 111788. [Google Scholar] [CrossRef]
  2. Khatri, M.; Francis, L.; Hilal, N. Modified Electrospun Membranes Using Different Nanomaterials for Membrane Distillation. Membranes 2023, 13, 338. [Google Scholar] [CrossRef] [PubMed]
  3. Ding, Q.; Hu, Z.; Huang, S.; Chen, K.; Liu, Y.; Ding, L. An Investigation of Non-Linear Strength Characteristics of Solidified Saline Soils in Cold Regions. Materials 2022, 15, 7594. [Google Scholar] [CrossRef] [PubMed]
  4. Peng, E.; Hu, X.; Chou, Y.; Sheng, Y.; Liu, S.; Zhou, F.; Wu, J.; Cao, W. Study of microbially-induced carbonate precipitation for improving coarse-grained salty soil. J. Clean. Prod. 2022, 365, 132788. [Google Scholar] [CrossRef]
  5. Shen, Y.; Li, P.; Jing, P.; Liu, Y.; Feng, R.; Liu, X. Experiment and Mechanism Analysis on the Solidification of Saline Dredger Fill with Composite Slag Solidifying Agent: A Case Study in Caofeidian, China. Appl. Sci. 2022, 12, 1849. [Google Scholar] [CrossRef]
  6. Wang, F.; Jiang, J.; Zhang, A.; Wang, L.; Sui, S. Sulfate transport assessment of cementitious materials-solidified saline soil. J. Sustain. Cem. Based Mater. 2023, 12, 1577–1591. [Google Scholar] [CrossRef]
  7. Li, J.; Lin, H.; Liu, J.; Renqingcairang, J.; Fang, J. Macro-micro characteristics of geopolymer-stabilized saline soil in seasonal frozen soil region. Case Stud. Constr. Mater. 2023, 19, e02496. [Google Scholar] [CrossRef]
  8. Shu, H.; Yu, Q.; Niu, C.; Liu, J.; Xia, W.; Sun, X.; Wang, Z.; Wang, Q. Effect of dry-wet cycles on the mechanical properties of saline soil solidified with sulfur-free lignin and hydrophobic polymer. J. Build. Eng. 2023, 76, 107116. [Google Scholar] [CrossRef]
  9. Zhu, Y.; Liu, D.; Fang, G.; Wang, H.; Cheng, D. Utilization of excavated loess and gravel soil in controlled low strength material: Laboratory and field tests. Constr. Build. Mater. 2022, 360, 129604. [Google Scholar] [CrossRef]
  10. Zhao, W.; Guo, C.; Wang, C.; Wang, Y.; Wang, L. Study on Mechanical Properties of Permeable Polymer Treated Loess. Materials 2022, 15, 6647. [Google Scholar] [CrossRef] [PubMed]
  11. Yang, Y.; Liu, H.; Li, H.; Su, S.; Liu, W. Planting in ecologically solidified soil and its use. Open Geosci. 2022, 14, 750–762. [Google Scholar] [CrossRef]
  12. Liang, L.; Zhang, J.; Fang, P.; Suo, C. Study on Properties of Copper-Contaminated Soil Solidified by Solid Waste System Combined with Cement. Sustainability 2022, 14, 5604. [Google Scholar] [CrossRef]
  13. Ma, Y.; Chen, W. Study on the Mechanism of Stabilizing Loess with Lime: Analysis of Mineral and Microstructure Evolution. Adv. Civ. Eng. 2021, 2021, 6641496. [Google Scholar] [CrossRef]
  14. Li, H.; Tang, X.; Zhang, X.; Li, M. Mechanical Properties and Microscopic Study of Steel Slag-Fly Ash-Solidified Loess under Alkaline Conditions. Appl. Sci. 2023, 13, 8737. [Google Scholar] [CrossRef]
  15. Liu, S.; Zhan, J.; Wang, X. Influence of composition of curing agent and sand ratio of engineering excavated soil on mechanical properties of fluidized solidified soil. Mater. Sci. Pol. 2023, 41, 57–67. [Google Scholar] [CrossRef]
  16. Sun, T.; Fan, X.; Xu, H.; Zhang, N.; Luo, H.; Lv, Y.; Wang, L. Impact of Solidified Municipal Sludge as Temporary Covering Soil on the Stability of Landfill Slope. Appl. Sci. 2023, 13, 2786. [Google Scholar] [CrossRef]
  17. Wang, J.; Fan, Y.; Xiong, X.; Zhao, F. Stabilization of Shield Muck Treated with Calcium Carbide Slag-Fly Ash. Buildings 2023, 13, 1707. [Google Scholar] [CrossRef]
  18. Gao, L.; Hu, G.; Li, P.; Yang, J. Statistical Analysis for Prediction of Unconfined Compressive Strength of Synthetic Fibre-Reinforced Clayey Soil. Int. J. Geosynth. Ground Eng. 2020, 6, 17. [Google Scholar] [CrossRef]
  19. Liu, J.-L.; Hou, T.-S.; Luo, Y.-S.; Cui, Y.-X. Experimental Study on Unconsolidated Undrained Shear Strength Characteristics of Synthetic Cotton Fiber Reinforced Soil. Geotech. Geol. Eng. Int. J. 2020, 38, 1773–1783. [Google Scholar] [CrossRef]
  20. Xu, L.; Niu, L. Influence of fibre type on unconfined compressive strength of fibre-reinforced cemented soil under freeze-thaw cycling. Int. J. Mater. Prod. Technol. 2022, 65, 248–257. [Google Scholar] [CrossRef]
  21. Zhang, J.; Xu, W.; Gao, P.; Yao, Z.; Su, L.; Qiu, N.; Huang, W. Compressive strength characteristics of hybrid fiber-reinforced cemented soil. Int. J. Pavement Eng. 2022, 24, 2104843. [Google Scholar] [CrossRef]
  22. Teng, Y.-Z.; Chen, X.-L.; Chen, L.; Hu, L.; Gu, J.-H.; Yin, Z.-X.; Lu, Z.-Z. Suffusion restraint in gap-graded soil reinforced with fibers. Front. Earth Sci. 2022, 10, 989874. [Google Scholar] [CrossRef]
  23. Zhang, J.; Xu, W.; Gao, P.; Su, L.; Kun, B.; Yueyuan, L.; Bohan, Y. Integrity and crack resistance of hybrid polypropylene fiber reinforced cemented soil. J. Eng. Fibers Fabr. 2022, 17, 15589250211068428. [Google Scholar] [CrossRef]
  24. Gui, Y.; Wong, W.Y.; Gallage, C. Effectiveness and Sensitivity of Fiber Inclusion on Desiccation Cracking Behavior of Reinforced Clayey Soil. Int. J. Geomech. 2022, 22, 06021040. [Google Scholar] [CrossRef]
  25. Kannan, G.; Sujatha, E.R. Effect of Nano Additive on Mechanical Properties of Natural Fiber Reinforced Soil. J. Nat. Fibers 2022, 20, 2143980. [Google Scholar] [CrossRef]
  26. Mei, L.; Dong, X.; Yang, S.; Deng, J. Experimental Study on Mechanical Properties of Cement-Solidified Remolded Soil Reinforces by Polyvinyl Alcohol Fiber. Adv. Mater. Sci. Eng. 2022, 2022, 5169404. [Google Scholar] [CrossRef]
  27. Zhao, F.; Zheng, Y. Shear Strength Behavior of Fiber-Reinforced Soil: Experimental Investigation and Prediction Model. Int. J. Geomech. 2022, 22, 04022146. [Google Scholar] [CrossRef]
  28. Machado, S.L.; Vilar, O.M.; Carvalho, M.D.F.; Karimpour-Fard, M.; Torres Pinto, C.M.; da Silva Conceicao, M.P. Development of an Empirical Model to Capture Fiber Reinforcement Effect on Shear Strength of Soils. Arab. J. Sci. Eng. 2022, 47, 12889–12900. [Google Scholar] [CrossRef]
  29. Wu, Z.; Xu, J.; Li, Y.; Wang, S. Disturbed State Concept-Based Model for the Uniaxial Strain-Softening Behavior of Fiber-Reinforced Soil. Int. J. Geomech. 2022, 22, 04022092. [Google Scholar] [CrossRef]
  30. Chen, W.; Zhao, J.; Fan, L.; Li, J.; Yuan, B.; Li, H.; Jiang, G.; Li, H.; Chen, T. The Effect of Length and Content of Fiber on Glass Fiber and Basalt Fiber-Reinforced Granite Residual Soil. Adv. Civ. Eng. 2022, 2022, 7803002. [Google Scholar] [CrossRef]
  31. Lu, Y.; Abuel-Naga, H.; Shaia, H.A.; Shang, Z. Preliminary Study on the Behaviour of Fibre-Reinforced Polymer Piles in Sandy Soils. Buildings 2022, 12, 1144. [Google Scholar] [CrossRef]
  32. Kucukcongar, D.S.; Celik, S.; Ghalehjough, B.K. Experimental and Numerical Investigation for Estimating Optimal Depth-Bearing Capacity of Randomly Fiber-Reinforced Sandy Soils. J. Sci. Ind. Res. 2022, 81, 1037–1049. [Google Scholar] [CrossRef]
  33. Tang, Y.; Wei, S.; Liu, X.; Liu, W.; Liu, T. Mechanical Analysis of Palm-Fiber-Reinforced Sand through Triaxial Tests. Sustainability 2023, 15, 5461. [Google Scholar] [CrossRef]
  34. Yang, S.; Lv, Y.; He, Y.; Pang, M.; Ma, X. Mesoscale Numerical Analysis of Fiber-Reinforced Sand with Different Fiber Orientations Subjected to Seepage-Induced Erosion Based on DEM. Materials 2023, 16, 335. [Google Scholar] [CrossRef] [PubMed]
  35. Kou, H.; Ma, Q.; Han, S. Experimental Study on the Mechanical Behaviors of Loess Reinforced with Randomly Distributed Basalt Fiber. Appl. Sci. 2022, 12, 9744. [Google Scholar] [CrossRef]
  36. Gao, Z.; Zhong, X.; Ma, H.; Liu, F.; Ma, J.; Wang, Q. Effect of Freeze-Thaw Cycles on Shear Strength Properties of Loess Reinforced with Lignin Fiber. Geofluids 2022, 2022, 8685553. [Google Scholar] [CrossRef]
  37. Wang, H.; Ni, W.; Yuan, K. Improvement of strength and impermeability of fiber-reinforced loess by bentonite and polypropylene fibers: A response surface analysis. Environ. Earth Sci. 2023, 82, 252. [Google Scholar] [CrossRef]
  38. Gao, Z.; Zhong, X.; Wang, Q.; Su, Y.; Wang, J. The Influence of Freeze-Thaw Cycles on Unconfined Compressive Strength of Lignin Fiber-Reinforced Loess. J. Renew. Mater. 2022, 10, 1063–1080. [Google Scholar] [CrossRef]
  39. Shu, B.; Gong, H.; Chen, S.; Ren, Y.; Li, Y.; Yang, T.; Zeng, G.; Zhou, M.; Barbieri, D.M.; Li, Y. Case Study of Solid Waste Based Soft Soil Solidifying Materials Applied in Deep Mixing Pile. Buildings 2022, 12, 1193. [Google Scholar] [CrossRef]
  40. Huang, S.; Lyu, Y.; Wu, G.; Sha, H.; Peng, Y. Seismic resistance performance of a utility tunnel in saline soil foundation based on new cementitious composite materials. Lat. Am. J. Solids Struct. 2019, 17, e239. [Google Scholar] [CrossRef]
  41. Wang, Q.; Guo, X.; Li, M.; Yang, J.; Cui, J.; Zhou, W. Study on Mechanical and Microscopic Properties of Nickel-Copper-Contaminated Soil Solidified by Cement, Fly Ash and Desulfurization Gypsum Under Carbonization Condition. Transp. Res. Rec. 2022, 2676, 379–392. [Google Scholar] [CrossRef]
  42. Zhang, J.; Yin, Y.; Shi, L.; Bian, H.; Shi, W. Experimental investigation on mechanical behavior of sands treated by enzyme-induced calcium carbonate precipitation with assistance of sisal-fiber nucleation. Front. Earth Sci. 2022, 10, 992474. [Google Scholar] [CrossRef]
  43. Zhou, W.; Wang, Q.; Fang, J.; Wang, K.; Zhao, X. Study of the Mechanical and Microscopic Properties of Modified Silty Clay under Freeze-Thaw Cycles. Geofluids 2022, 2022, 9613176. [Google Scholar] [CrossRef]
  44. Hao, S.; Yu, Y.; Song, J.; Liu, J.; Song, Z.; Che, W.; Huang, T.; Chen, Z.; Sun, S. Study on direct shear strength properties of sand mixed with polyurethane prepolymer and sisal fiber. Environ. Earth Sci. 2023, 82, 436. [Google Scholar] [CrossRef]
  45. GB/T50123-2019; Standard Test Methods for Geotechnical Testing. National Standards of the People’s Republic of China: Dongguan, China, 2019.
  46. Song, Y.; Geng, Y.K.; Dong, S.S.; Ding, S.; Xu, K.Y.; Yan, R.T.; Liu, F.T. Study on Mechanical Properties and Microstructure of Basalt Fiber-Modified Red Clay. Sustainability 2023, 15, 4411. [Google Scholar] [CrossRef]
  47. Wang, S.N.; Chen, F.Y.; Xue, Q.P.; Zhang, P. Splitting Tensile Strength of Cement Soil Reinforced with Basalt Fibers. Materials 2020, 13, 3110. [Google Scholar] [CrossRef] [PubMed]
  48. Gao, L.; Hu, G.H.; Xu, N.; Fu, J.Y.; Xiang, C.; Yang, C. Experimental Study on Unconfined Compressive Strength of Basalt Fiber Reinforced Clay Soil. Adv. Mater. Sci. Eng. 2015, 2015, 561293. [Google Scholar] [CrossRef]
Figure 1. Plotted e-logp curve of fiber-solidified soil. (a) Maintenance time: 7 days; (b) maintenance time: 14 days; (c) maintenance time: 28 days; (d) maintenance time: 60 days.
Processes 12 00876 g001
Figure 2. Compression coefficient changes with age.
Processes 12 00876 g002
Figure 3. Compression modulus change curve with age.
Processes 12 00876 g003
Figure 4. Stress–strain curves with different fiber contents. (a) Fiber content is 0.1%; (b) fiber content is 0.15%; (c) fiber content is 0.2%; (d) fiber content is 0.25%; (e) fiber content is 0.3%.
Processes 12 00876 g004
Figure 5. Stress–strain curves of different fiber lengths. (a) Fiber length is 10 mm; (b) fiber length is 15 mm; (c) fiber length is 20 mm; (d) fiber length is 25 mm; (e) fiber length is 30 mm.
Processes 12 00876 g005
Figure 6. Failure modes of specimens under different confining pressures. (a) Low confining pressure; (b) high confining pressure.
Processes 12 00876 g006
Figure 7. Comparison of test results and model prediction curve results.
Processes 12 00876 g007
Figure 8. Friction element stress versus strain curve.
Processes 12 00876 g008
Figure 9. Corrected friction element stress versus strain curve.
Processes 12 00876 g009
Figure 10. Comparison of test results and revised model prediction curve results.
Processes 12 00876 g010
Figure 11. Cement element correction function.
Processes 12 00876 g011
Figure 12. Parameter change curve with C. (a) Parameter A; (b) parameter B; (c) parameter C; (d) parameter D.
Processes 12 00876 g012
Figure 13. Comparison of test results and model prediction curve.
Processes 12 00876 g013
Figure 14. Fitting curve of binary-medium model as P changes. (a) Changes in nonlinear material coefficients α and n with P; (b) changes in initial elastic modulus Eb and local deformation coefficient c with P; and (c) changes in material parameters a and b with P.
Processes 12 00876 g014aProcesses 12 00876 g014b
Figure 15. The development law of damage rate λ with strain.
Processes 12 00876 g015
Figure 16. Stress borne by cementing elements and friction elements inside the soil under different confining pressures. (a) Confining pressure 0 kPa; (b) confining pressure 25 kPa; (c) confining pressure 50 kPa; (d) confining pressure 75 kPa.
Processes 12 00876 g016aProcesses 12 00876 g016b
Figure 17. Microscopic morphology at different ages. (a) Maintenance period 7 days; (b) maintenance period 14 days; (c) maintenance period 28 days; (d) maintenance period 60 days.
Processes 12 00876 g017
Figure 18. Microscopic morphology of curing agent product. (a) Lime hydration products; (b) lime hydration products.
Processes 12 00876 g018
Figure 19. SEM photo of fiber. (a) Fiber bundle (300 times); (b) fiber interweaving (300 times); (c) fiber interweaving (500 times); (d) single fiber (1000 times); (e) fiber anchoring (1000 times).
Processes 12 00876 g019aProcesses 12 00876 g019b
Figure 20. Schematic diagram of reinforced friction principle in triaxial shear test. (a) Before peak stress; (b) after peak stress.
Processes 12 00876 g020
Table 1. Basic physical and mechanical indicators of raw soil.
Soil NameMoisture Content
ω/%
Density
ρ/kg · m−3
Proportion
Gs
Void RatioLiquid Limit
ωL/%
Plastic Limit
ωp/%
Organic Matter Content/%
Dredged bottom mud46.918482.61.748.628.96.2–7.7
Table 2. Consolidation test plan.
Age/DayLoad/kPa
Incorporated fiber7, 14, 28, 6025→50→100→200→400→800→1200→1600
No fiber
Table 3. Conventional static triaxial (UU) test plan.
Age/DayConfining Pressure/kPaFiber Content/%Fiber Length/mm
280, 25, 50, 750.1, 0.15, 0.2, 0.25, 0.320
0.210, 15, 20, 25, 30
Table 4. Scanning electron microscope test plan.
Age/DayFiber Content/%Fiber Length/mmGain
Pore analysis7, 14, 28, 600.2%205000
Fiber distribution280.2%20300~1000
Table 5. Compression coefficient and compression modulus results.
Compression Index7 Days14 Days28 Days60 Days
Contains FiberNo FiberContains FiberNo FiberContains FiberNo FiberContains FiberNo Fiber
αv0.5950.5590.2770.4030.233 0.3170.2110.307
Es4.474.789.686.6711.12 8.211.998.37
Table 6. Model parameter statistics.
Confining Pressure/kPanαcEbab
01.951540.271250.99316.70.005710.00411
251.239930.642290.986607.60.005260.00315
500.981731.11250.983928.40.004840.00216
750.812621.55570.9811384.30.004760.00169
Table 7. Parameter statistics.
CABEF
0.50.043 1.191 0.1393.666
0.670.046 1.160 0.1633.433
0.750.047 1.143 0.1753.214
0.80.048 1.136 0.1823.061
10.049 1.122 0.1932.948
1.250.049 1.118 0.1922.673
1.330.048 1.121 0.1892.354
1.50.046 1.138 0.1781.896
20.041 1.196 0.1281.656
Disclaimer/Publisher’s Note: The statements, opinions and data contained in all publications are solely those of the individual author(s) and contributor(s) and not of MDPI and/or the editor(s). MDPI and/or the editor(s) disclaim responsibility for any injury to people or property resulting from any ideas, methods, instructions or products referred to in the content.

