Article

Capacity Optimization Configuration for a Park-Level Hybrid Energy Storage System Based on an Improved Cuckoo Algorithm

1
James Watt School of Engineering, University of Glasgow, Glasgow G12 8QQ, UK
2
Collaborative Innovation Center for Emissions Trading System Co-Constructed by the Province and Ministry, Hubei University of Economics, Wuhan 430205, China
3
State Key Laboratory of Coal Combustion and Low Carbon Utilization, Huazhong University of Science and Technology, Wuhan 430074, China
*
Authors to whom correspondence should be addressed.
Processes 2024, 12(4), 718; https://doi.org/10.3390/pr12040718
Submission received: 29 February 2024 / Revised: 26 March 2024 / Accepted: 28 March 2024 / Published: 1 April 2024
(This article belongs to the Topic Distributed Generation and Storage in Power Systems)

Abstract

:
To promote the development of green industries in the industrial park, a microgrid system consisting of wind power, photovoltaic, and hybrid energy storage (WT-PV-HES) was constructed. It effectively promotes the local consumption of wind and solar energy while reducing the burden on the grid infrastructure. In this study, the analytic hierarchy process (AHP) was used to decompose the multi-objective function into a single-objective function. The economic and environmental benefits of the system were taken as the objective function. Furthermore, the cuckoo search algorithm (CS) was used to solve the specific capacity of each distributed power source. Different scenarios were applied to study the specific capacity of microgrid systems. The results show that the equivalent annual cost of the WT-PV-HES microgrid system is reduced by 7.3 percent and 62.23 percent, respectively. The carbon disposal cost is reduced by 1.71 and 2.38 times, respectively. The carbon treatment cost is more sensitive to load changes. The solution iteration of the cuckoo algorithm is 18 times. Meanwhile, the system requires four updates of capacity allocation results for 20 years of operation. This result validates the effectiveness of the proposed model and methodology. It also provides a reference for the research and construction of capacity allocation of microgrid systems at the park level.

1. Introduction

The limitations of centralized power grids are gradually becoming apparent as society develops and human demand for electricity grows [1]. They are mainly reflected in the high cost, serious environmental pollution, and power supply reliability challenges. Distributed power generation systems can take full advantage of renewable energy sources and be flexible in their configuration. At the same time, they are safer and more environmentally friendly. But, these systems also present some problems, such as high volatility and the weak power supply reliability of renewable energy. Microgrids are currently an effective way of coupling renewable energy generation systems to the grid. Their stable operation relies on energy storage technology, which can suppress fluctuations in wind and solar power. In particular, there are two types of storage systems that complement each other: battery energy storage (BES) and the hydrogen energy storage system (HESS). BES has the advantages of flexible installation, fast response, and fast charging. The HESS, on the other hand, has the advantages of long storage time, high energy density, and no pollution [2,3].
In the development of energy storage technology, single-energy storage has been found to have limitations in meeting requirements, such as a long lifespan and a wide working range [4,5]. Compared to single-energy storage, hybrid energy storage has significant advantages. Currently, lots of research has been carried out on hydrogen-containing hybrid energy storage (HES) systems. Most of it is based on hydrogen energy storage supplemented by battery energy storage. Through numerical examples, it is verified that this method can effectively suppress the fluctuation in wind power [6]. The problem of environmental pollution caused by conventional hydrogen production methods was also emphasized by Wang et al. [7]. Hydrogen production from wind power systems not only helps to realize green hydrogen production but also effectively solves the problem of wind abandonment. Li et al. [8] proposed a strategy for operating a multi-microgrid system by considering power interaction constraints between microgrids. After comparing multiple scenarios, it was found that incorporating power interaction constraints in the capacity optimization model helps to reduce the cost of microgrids and improve stability. An electric and hydrogen energy storage system is proposed by Huang et al. [9], which is used to regulate the fluctuation of photovoltaic systems and to fulfill the demand for electric and hydrogen loads on the user side. Du et al. [10] developed a two-tier optimization model. The microgrid capacity is configured and dispatched by combining a desalination system and hydrogen production from an electrolyzer. Considering the economic objective and reliability objective, Yu et al. [11] developed a capacity optimization allocation model for off-grid wind–hydrogen storage microgrids. A multi-objective Taurus whisker exploration algorithm is used to solve the problem. Luo et al. [12] used real-time meteorological data to allocate capacity for a standalone wind–solar–storage–diesel microgrid in a remote area. The optimal capacity configuration scheme is obtained using the whale algorithm, with the objective of optimizing electricity costs and load shortage rates. When configuring a grid-connected microgrid, the power interaction between the microgrid and the State grid must be considered. Purchase and sale costs and exchange power constraints are introduced in the optimization model. Many researchers have focused on grid-connected island microgrids. Objective functions have been constructed based on the installation cost, operation and maintenance cost, pollution control cost, residual grid revenue, and purchase cost per unit [13,14,15]. Based on the net benefits of system operation and the synergy between water and wind resources, a model for optimal allocation of microgrid capacity was developed by Cui et al. [16]. The evaluation of microgrid configuration results with the integration of demand-side response demonstrated that it could enhance the economic efficiency of the system.
The optimal allocation of the capacity of the energy storage system is of great importance for the economy and safety of the power system. Zhang et al. [17] established a probabilistic model for wind, PV, and load. The energy storage operation control strategy is established. Under the condition of considering the economics of distribution and storage, an optimization model for energy storage siting and capacity setting with the objective of minimizing system risk is established. The optimal allocation of energy storage is calculated. Shao et al. [18] ensured microgrid economics with the minimum cost per unit of energy (COE) as the optimization objective. Capacity optimization allocation of wind and storage microgrid components is performed. Yang et al. [19] focus on the economic assessment of the participation of optical storage charging stations in real-time demand side response. The optimal capacity allocation method of optical storage charging stations considering real-time demand side response is proposed. Zhang et al. [20] established an HES capacity allocation scheme with the objective function of minimizing the annual integrated cost. The optimal capacity allocation scheme was derived using an improved particle swarm algorithm for solving. Yang et al. [21] applied various numerical analysis theories by considering factors such as energy storage cost and output characteristics. Based on the dedicated calculation tool for energy storage configuration, the method and tool were verified through practical scenarios. The above research results utilized different energy storage forms and optimization methods after considering the economics of the energy storage system. The optimal capacity configuration scheme for energy storage was finally derived.
However, the current research mainly focuses on the planning and construction of large-scale grid-connected hydrogen microgrid systems. There is a lack of research on the mode of operation and planning schemes for park-level hydrogen microgrid systems. Ma et al. [22] take wind turbines and hydrogen production–storage–burning devices as research objects. Based on NSGA-II, the capacity of wind turbine and hydrogen production–storage–burning devices are configured, respectively. Hu et al. [23] comprehensively considered three indicators: economic cost, power supply reliability, and the wind abandonment rate of microgrids. The capacity optimization configuration model of the hydrogen energy storage system is constructed. The proposed model has proved to be reasonable. This study addresses the energy transformation challenge faced by an industrial park in a particular region of China. To solve this problem, this study proposes a regional wind power, photovoltaic power, and hybrid energy storage (WT-PV-HES) microgrid model [24]. The multi-objective problem of annual cost and carbon treatment cost is transformed into a single-objective problem using hierarchical analysis. To determine the capacity of the microgrid under different scenarios, this study applies the improved cuckoo algorithm. The obtained research results can serve as a valuable reference for addressing the energy transformation challenges faced by similar industrial parks. Overall, this study proposes an effective and efficient solution to the energy transformation problem faced by the industrial park. This study has made some progress in addressing capacity allocation issues and reducing carbon emissions. The results of this study can serve as a useful reference for similar projects in China and beyond.

2. Microgrid System Planning Model

2.1. System Overview

In a specific region, a WT-PV-HES microgrid structure was implemented (Figure 1). The microgrid system comprises two main components: the power generation part, consisting of the WT and PV station, and the energy storage system part, including the battery, electrolysis tank (ET), fuel cell (FC), and hydrogen storage tank (HST). Microgrids are also coupled to the established State grid through a DC bus for energy exchange [25,26,27].

2.2. Mathematical Modeling of System Equipment

2.2.1. Wind Power Module

The capacity of WT generation is strongly influenced by wind speed. The higher the wind speed, the higher the efficiency of power generation. The working model of the WT is based on this basic principle. The details are as follows [28,29]:
P t ( v ) = 0 , 0 v < v c i P r , v 2 v c i 2 v r 2 v c i 2 , v c i v v r P r , v r < v v c o 0 , v c o < v
In the formula, v is the wind speed at the hub height of the fan in m/s. vci, vco, and vr are the wind turbine cut-in, cut-out, and rated wind speeds in m/s, respectively. Pr is the rated power of the wind turbine in kW.

2.2.2. PV module

The PV power output situation is mainly affected by light intensity and temperature. Among other things, the calculation of PV power requires factors such as longitude, latitude, angle of incidence, installation method, and losses where the project site is located. The mathematical model of the PV is [30,31] as follows:
P P V = f P V P N G 1000 [ 1 + a p ( T 25 ) ] T = T e + 30 × G 1000
where PPV and PN are the photovoltaic output power and rated power, respectively. The unit is kW. fPV is the power scaling factor, with a value of 0.9. ap is the power temperature coefficient. G is the total solar radiation on the horizontal surface in W/m2. T is the surface temperature of the PV module in °C. Te is the ambient temperature in °C.

2.2.3. Battery Module

The battery module is used to buffer the variations in renewable power. There are two main processes of charging and discharging in the operation results. Therefore, its mathematical model is [32,33] as follows:
S o c ( t ) = ( 1 δ ) S o c ( t 1 ) + P c Δ t η c E c S o c ( t ) = ( 1 δ ) S o c ( t 1 ) P d Δ t η d E c
where Soc(t) is the state of charge of the battery at the end of time t, in %. δ is the self-discharge rate of the battery. Pc and Pd represent the charging and discharging power of the battery, respectively. The unit is kW. Ec is the rated capacity of the battery, in Ah. ηc and ηd represent the charging and discharging efficiency of the battery, respectively. The unit is %. △t is the time interval, in s.
The capacity of the battery at time t is [34] as follows:
E b a t ( t ) = ( 1 δ ) E b a t ( t 1 ) + [ P c ( t ) η c P d ( t ) η d ]
where Ebat(t) is the capacity of the battery at time t, in kW.

2.2.4. HESS Module

The hydrogen storage module consists of three parts: an electrolyzer, a hydrogen storage tank, and a fuel cell. Among them, the electrolysis tank can produce hydrogen by electrolysis using excess wind and solar energy. The fuel cell, on the other hand, converts hydrogen energy to electricity. The HST is used to store hydrogen. This system can be described by a specific mathematical model, specifically [35]
P e l tan k = P e l η e l P f c D C = P tan k f c η f c E tan k ( t ) = E tan k ( t 1 ) + P e l tan k ( t ) Δ t P tan k f c Δ t η s t o r
where Pel,tank is the hydrogen production power of the ET, in kW. Pel is the electrical power input to the ET, in kW. Pfc-DC is the output power of the FC, in kW. Ptank-fc is the hydrogen power input from the HST to the FC, in kW. ηFC is the conversion efficiency of FCs, in %. ηstor is the storage efficiency of the HST, in %. Etank(t) is the energy of the HST at time t, in kW.

3. Integrated System Operation Planning Model

Based on the above equipment model, an integrated model for operation planning of the WT-PV-HES microgrid system is established. That is, the system construction investment cost and the production modeling cost of the target year are considered simultaneously. The objective of the planning and design is to minimize the total cost of the system over a 20-year period (the design microgrid system has a life expectancy of 20 years).

3.1. Objective Function

3.1.1. Equivalent Annual Cost

The equivalent annual cost is
f 1 = C i n I C R F + C o m + C r e p + C g r i d
This includes
C i n = C i , i n , i = w t , p v , b a t , e l , tan k , f c C i , i n = N i c i , i n P i , r I C R F = r ( 1 + r ) n [ ( 1 + r ) n 1 ]
In the formula, Ni represents the number of constituent units. Ci,in is the investment cost coefficients of each component unit, in CNY/kW. Pi,r is the rated power (the unit is kW) or the rated capacity (the battery and the HST are in kW·h) of each component unit.
C o m = C i , o m , i = w t , p v , b a t , e l , tan k , f c C i , o m = N i c i , o m P i , r ,
where Com is the annual operation and maintenance cost of the system, in CNY. ci,om is the annual O&M cost coefficients for each constituent unit, in CNY/kW. Ni is the specific number of units, in pieces. Pi,r is the unit power of each unit, in kW.
C r e = C i , r e c S F F ( r , Y j ) , i = b a t , e l , f c c S F F ( r , Y j ) = r ( 1 + r ) Y i - 1
where Cre is the system replacement cost, in CNY. Ci,re are the replacement cost factors for the ET, the FC (the unit is CNY/kW), and the battery (the unit is CNY/kW·h), and cSFF(r,Yi) is the debt service fund coefficient, respectively. Yi is the operational lifetime of each distributed power source, in a. r is the interest rate.
C g r i d = C b u y C s e l l C b u y = 0 T k b u y P b u y ( t ) d t C s e l l = 0 T k s e l l P s e l l ( t ) d t
where kbuy and ksell are the unit prices for purchasing and selling electricity, respectively. The unit is CNY/kW·h. Cbuy and Csell represent the cost of purchasing and selling electricity, respectively. The unit is CNY. Pbuy and Psell refer to purchased and sold electricity, respectively. The unit is kW·h.

3.1.2. Carbon Disposal Cost

Since every part of the microgrid system consists of clean energy, no pollutants are produced. However, due to the system’s over-dependence on the environment, an imbalance between supply and demand within the system inevitably occurs. To meet the load demand, the State grid is required to support it. Such a system causes some degree of carbon emissions. Therefore, this objective function f2 is as follows:
f 2 = a C O 2 C C O 2 C C O 2 = b C O 2 0 T C b u y d t
where CCO2 is the amount of carbon processed, in kg. aCO2 is the CO2 treatment cost coefficient, in CNY/kg. bCO2 is the grid carbon emission conversion factor, taking the value of 0.598 kg/(kWh).

3.2. Objective Function Processing

In order to simplify the calculation, the analytic hierarchy process (AHP) is introduced. The AHP method aims to qualitatively and quantitatively analyze the decision-making with multiple influencing factors through mathematical analysis methods [36]. Through the decomposition of the research objectives, a hierarchical system containing multiple independent influencing factors is formed. By comparing the influencing factors, the relative importance of each influencing factor is derived. Further calculations were made to derive the influence weight of each influence factor on the research objectives [36,37].
min F = min { w 1 f 1 + w 2 f 2 } w 1 + w 2 = 1 w 1 0 , w 2 0
where wi is the value of the weight of each objective function. The size of the weight directly reflects the importance of the objective function.

3.3. Constraints

The constraints of the integrated operation planning model are mainly divided into three parts: planning constraints, operation constraints, and coupled planning and operation constraints. The planning constraints are used to represent the planning capacity constraints of various types of equipment in the system. The operation constraints are oriented to the system production simulation, establishing the system power balance equation and the subsystem production balance equation. The coupling constraints of planning and operation are reflected as the constraints of equipment planning capacity and equipment operation power.

3.3.1. Power Balance Constraint

When the system is running, the total power is kept in balance [38,39]:
P w t + P p v + P b a t + P f c + P g r i d = P e l + P l o a d
where Pwt is the WT output power. Ppv is the PV output power. Pbat is the battery charging and discharging power. Discharging is positive, while charging is negative. Pfc is the fuel cell discharge power. Pgrid is the power traded with the State grid. Purchasing electricity from the power grid is positive and selling electricity to the State grid is negative. Pel is the charging power of the EC. Pload is the power required by the load.

3.3.2. Wind Power and Photovoltaic Power Constraints

0 P w t ( t ) P w t , max 0 P p v ( t ) P p v , max
where Pwt,max and Ppv,max are the maximum output power of the WT and the PV, respectively. The unit is kW.

3.3.3. Battery Energy Storage Constraints [40]

S O C min S O C ( t ) S O C max 0 P c ( t ) P c h max 0 P d ( t ) P d c h max
where SOCmin and SOCmax are the minimum and maximum values of the SOC, in %. Pch-max and Pdch-max are the maximum charging and discharging power of the battery, respectively. The unit is kW.

3.3.4. Hydrogen Energy Storage System Constraints

0 P e l ( t ) P e l max 0 P f c ( t ) P f c max E tan k , min E tan k ( t ) E tan k , max
where Pel-max is the maximum charging power of the electrolysis tank, in kW. Pfc-max is the maximum discharge power of the fuel cell, in kW. Etank,max and Etan,min are the upper and lower limits of the capacity of the hydrogen storage tank, respectively. The unit is kW.

3.3.5. Power Purchase and Sale Constraints

If the microgrid sells too much power to the State grid, this can lead to voltage fluctuations and affect power quality. If the microgrid buys too much power from the State grid, it indicates that the self-balancing rate within the microgrid is low. The autonomy of the microgrid is weak.
P b u y P g r i d max | P s e l l | P g r i d max
where Pgrid-max is the upper limit of the capacity of the microgrid to trade with the State grid.

3.3.6. Upper and Lower Limits of the Number of Each Device

N i min < N i < N i max , i = w t , p v , b a t , e l , tan k , f c
where Nwt-min, Npv-min, Nbat-min, Nel-min, Ntank-min, and Nfc-min are the minimum numbers of installations of the subsystems. Nwt-max, Npv-max, Nbat-max, Nel-max, Ntank-max, and Nfc-max are the maximum numbers of installations of the subsystems.

3.4. Evaluation Indicators

1. System power abandonment rate
The specific calculation formula of the system discard rate DCR is as follows [41]:
D C R = t = 1 8760 { P z ( t ) [ P z , l o a d ( t ) + P g ( t ) + P p 1 ( t ) ] + P b p 1 ( t ) } t = 1 8760 P z ( t ) × 100 %
where Pz,load(t) is the power supplied to the load by the WT and PV, in kW.
2. Load power loss rate
The load power loss rate DLPSP is commonly used to assess the power supply reliability of the power generation system. The specific calculation formula is as follows [42]:
D L P S P = t = 1 8760 [ P l o a d ( t ) P z , l o a d ( t ) + P H E S ( t ) ] t = 1 8760 P l o a d ( t )
where PHES(t) is the power to meet the load demand by the hybrid energy storage system at moment t, in kW.

3.5. Operation Strategy
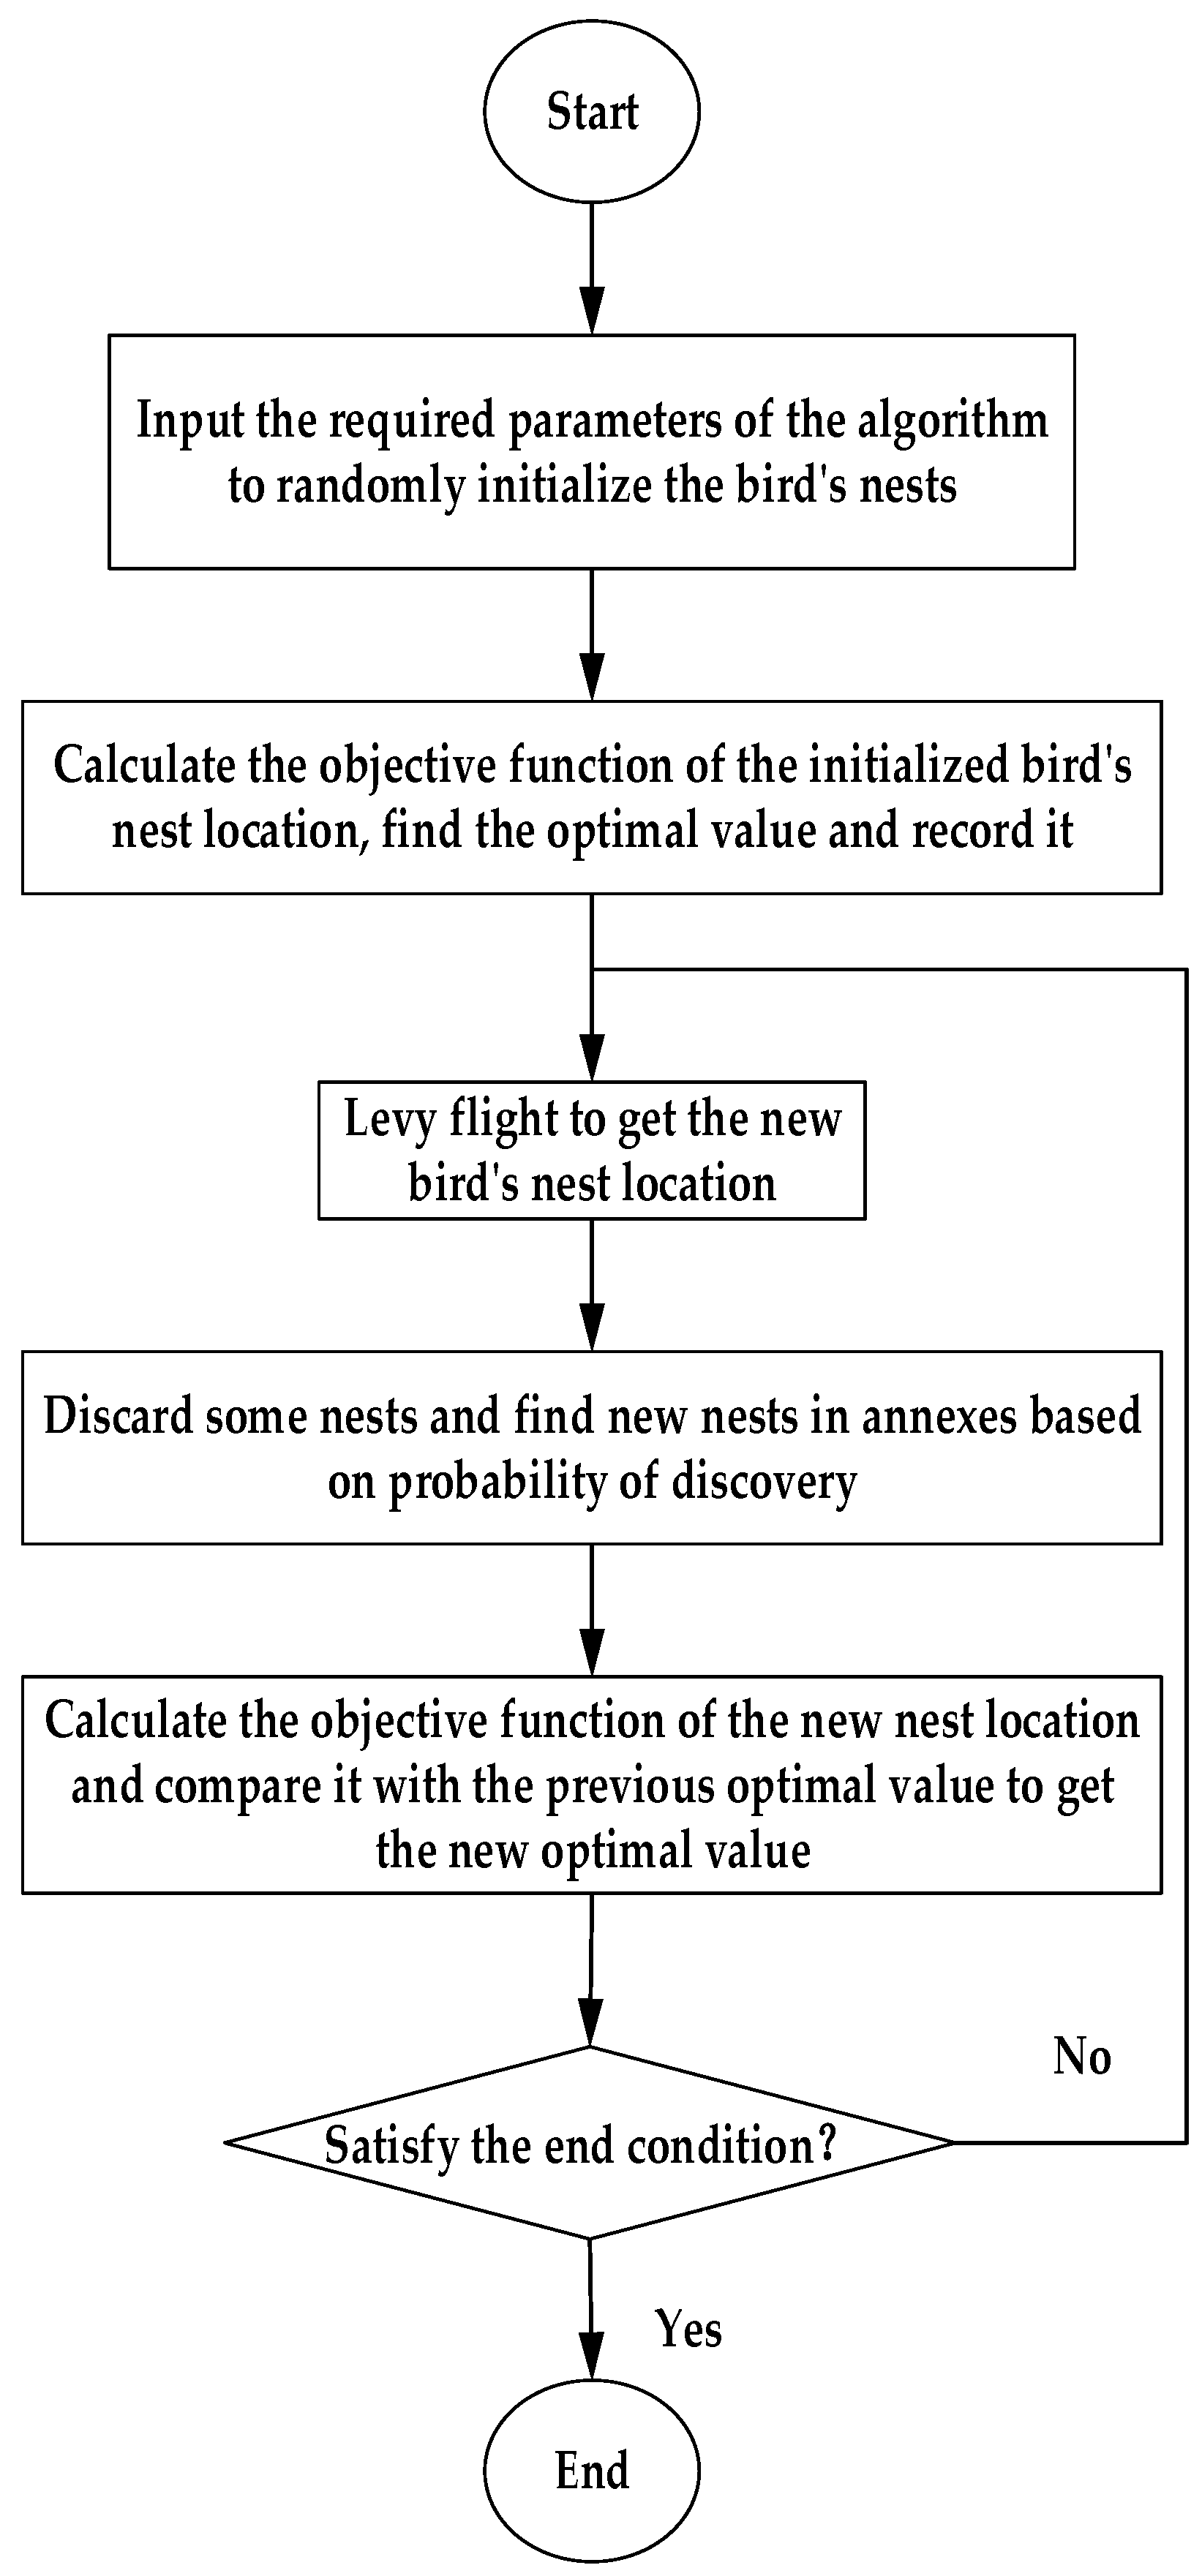
The operational strategy of the microgrid system being studied is depicted in Figure 2. In this figure, Pz(t) represents the output power of the WT and PV. Pload(t) represents the local load demand at time t. Pg(t) denotes the on-grid power supplied by the WT and PV at time t. Pe1(t) is the excess power of WT and PV power relative to the load. Pe2(t) is the surplus power of WT and PV power after satisfying the load and battery. Pp1(t) and Pbp1(t) are the hydrogen storage power and battery charging power supplied by wind power photovoltaics, respectively. Pp2(t) and Pbp2(t) are the hydrogen storage power and battery charging power supplied by the State grid, respectively. a is the ratio of power supply from the HESS to the battery.
In Figure 2, it can be seen that when Pz(t) is less than Pload(t), the HES system co-generates electricity to meet the load demand. At this time, the HESS system operates in the power generation condition, and the battery begins to discharge. When Pz(t) is greater than Pload(t), excess WT and PV power are stored in hydrogen storage systems and batteries. If Pe1(t) is greater than the required HESS power Pp(t) during this time period, the HESS starts to operate. If Pe1(t) is less than the power required by the HESS Pp(t), part of the power is supplied by the State grid for electrolysis. If Pe2(t) is greater than the charging power of the battery Pbp(t), the battery starts charging and the remaining power Pg(t) is fed into the State grid. If Pe2(t) is less than the charging power of the battery Pbp(t), the part of the power is provided by the State grid to charge the battery.

3.6. Model Solving

Based on the integrated operation planning model of the WT-PV-HES microgrid system established above, an improved cuckoo algorithm solution method is proposed to achieve the solution of the complete planning model.
For the microgrid capacity optimization model, the number of WT, PV, battery, and HESS are set as decision variables for the cuckoo algorithm.
The cuckoo search (CS) algorithm is a group of intelligent search techniques inspired by the parasitism of cuckoos in nature. It is a population-based intelligent search technique that considers the parasitism of cuckoo nests and Lévy flights. It has a strong global search capability by changing the location of the nest through random wandering [43,44]. In this paper, a CS algorithm is utilized in the MATLAB platform to solve the model. The CS algorithm offers several advantages over genetic algorithms (GAs) and particle swarm optimization (PSO) algorithms, including fast convergence speed, high computational accuracy, and ease of operation [45,46].
The CS algorithm takes into account dynamically changing step sizes [47,48].
The cuckoo search algorithm is based on the following three key assumptions:
(1)
Each cuckoo lays only one egg at a time and randomly selects a nest location for incubation;
(2)
In a flock of cuckoos searching for a new nest, the cuckoo occupying the best location has the opportunity to lay the next generation of eggs in that nest;
(3)
The number of available nests remains constant. It is assumed that the probability of a host bird discovering a cuckoo’s egg is denoted as Pa, where Pa ∈ [0, 1]. If the cuckoo’s parasitism is detected, the host bird will construct a new nest nearby.
The global search is executed via a Lévy flight, and the Lévy flight position is updated as follows:
x j k + 1 = x j k + α L ( s , λ ) L ( s , λ ) = λ Γ ( λ ) sin ( π λ ) π 1 s 1 + λ Γ ( λ ) = 0 t λ 1 e t d t s = u | v | 1 β ,
In the formula, x j k + 1 is the position of the j-th (j = 1, 2, 3, …, n) nest in the k-th generation. ⊗ is the point-to-point multiplication. α is the step size control quantity.
The local search is executed by local random wandering. The position update formula is as follows:
x j k + 1 = x j k + α s H ( P a ε ) ( x m k x n k ) ,
where x m k and x n k are the positions of two random nests in the contemporary nest. H(μ) is the Heaviside function. Pa is the maximum discovery probability. s is the movement step size. ε is a uniformly distributed random number.
The step size of the algorithm determines the space in which the algorithm searches for solutions. In general, the step size of a CS is usually α = 1. The fixed step size setting limits the search for solutions to a certain extent. At the beginning of the algorithm run, when the step size takes a larger value, the search space is expanded to achieve a better global search. When the algorithm runs to a smaller space, shortening the step size can be more favorable to a local search and improve search accuracy. Therefore, the search efficiency of the algorithm can be enhanced using a dynamically changing step size.
a = a , k N / 3 ( 1 k / N ) b , N / 3 k 2 N / 3 c , 2 N / 3 k N ,
In the formula, a, b, and c are step control quantities and a > b > c. k is the current iteration number. N is the total number of iterations.
The steps of applying the algorithm are as follows:
Step 1: Initialization;
Step 2: Update the location of the current bird’s nest;
Step 3: Use a random number r as the probability that the nest owner will find an exotic bird’s egg. Compare this with the probability Pa that the bird is eliminated;
Step 4: Determine whether the current number of iterations meets the condition. If so, end the search process. Otherwise, repeat step 2 for iterative search.
The model-solving flowchart is detailed in Figure 3.
During the model-solving process, some of the parameters are set as follows:
The number of populations of CS is taken as 40. The maximum number of iterations is taken as 100. The upper and lower limits of the nonlinear convergence factor are taken as 2 and 0.01. The iteration threshold is taken as 40 (Appendix A).
The MATLAB model implementation process is as follows:
(1)
Objective function f(x), x = (x1, ..., xd)T.
(2)
Generate an initial population of n hosts xi.
(3)
While (t < MaxGgeneration) or (stop criterion) do
i.
Randomly go to a cuckoo
ii.
Generate a solution by flying through Levy
iii.
Evaluate the value of the quality live objective function of the solution fi
iv.
Randomly select one of the n nests (assumed to be j)
v.
If fi < fj then
(i)
Replace j with solution i
vi.
end if
vii.
A portion of the bad nest is abandoned
viii.
New nest/deconstruction
ix.
Preservation of optimal solutions (or high quality nests)
x.
Arrange solutions to find the current best
xi.
Update t + 1→t
(4)
end while
(5)
Post-processing and visualisation

4. Analysis and Discussion

An industrial park in a region of Xinjiang, China, is selected for this study. Data on the local annual average wind speed and irradiation intensity are collected (see Figure 4 for details). In addition, the data are discretized using HOMER Pro 3.16.2 software. Meteorological data with a time interval of 1 month are processed into continuous data with a time interval of 1 h. The operating cycle of the microgrid is set at 20 years.
The cost of each distributed power source is shown in Table 1.
The parameters of the energy storage devices are shown in Table 2. The microgrid used different amounts of electricity according to the different time periods [49,50,51,52].
The specifications of the wind turbines, the PV cell, and the batteries are 1000 kW/unit, 400 W/pc, and 1000 A·h/2 V/block, respectively. The capacity of both the HESS and the battery at the initial moment is set to be 50% of their maximum capacity.

4.1. Optimization Results

Based on the current situation of an industrial park, the capacity of the WT-PV-HES microgrid system is studied. After solving, it can be seen that the system is able to make good use of wind and light energy resources. Table 3 shows the optimal capacity configuration scheme of the WT-PV-HES microgrid system obtained by solving the model. Figure 5 shows the cost distribution of the system components under the optimal capacity configuration. In Table 3, it can be seen that when each component of the system is in this time period, the DCR and DLPSP of the system are both zero. This shows that the system achieves efficient wind and solar energy consumption with high reliability.
To provide a more intuitive representation of the system’s operating performance under optimal capacity configuration, a sample day is selected for detailed analysis. The results of the hourly output power of each subsystem of the microgrid system on the sample day are shown in Figure 6. The system output power distribution is shown in Figure 7.
As can be seen in Figure 6 and Figure 7, this typical day WT operates throughout the day. The PV only generates electricity during the daytime hours of 5:00–17:00. During the nighttime from 22:00 to 5:00, the new energy generation power is greater than the load demand due to the higher power of the WT and lower load demand. At this time, the maximum power generated by the new energy is 36.5 MW. The maximum load demand power is 24.5 MW. The excess power is stored in the HES system. Hydrogen storage and battery capacity both show an increasing trend in this time period. Battery capacity rose by 12.8 percent. Hydrogen storage capacity rose by 13 percent. During the hours of 5:00–7:00 and 17:00–22:00, the WT and PV are less than the load power. At this time, the minimum value of new energy generation power is 10 MW. The minimum value of load demand power is 21 MW. In this period, the combined power supply of the HES system is needed to meet the load demand. Therefore, the capacity of the HES system is decreasing. During the daytime from 7:00 to 17:00, the WT decreases but the PV increases significantly. During this period, the new energy generation power can fully meet the load demand. The excess power is stored in hydrogen storage tanks and batteries. Therefore, hydrogen storage and battery capacity are on the rise.
The distribution of capacity between the HESS and the BES system in the HES system on the sample day is detailed in Figure 8.
In Figure 8, it can be seen that there is excess power of new energy relative to the load in the 0:00–5:00 and 8:00–11:00 time periods. The maximum amount of excess power available to the hydrogen storage system is 11 MW. It can simultaneously satisfy hydrogen storage systems for hydrogen storage and battery charging. There is some excess power in the new energy relative to the load during the three time periods of 7:00–8:00, 12:00–17:00, and 22:00–24:00. At this point, the maximum value of excess power available to the hydrogen storage system is 11 MW, and the minimum value is 0 MW. However, it only meets part of the power required by the HESS. The other part of the HESS power is supplied by the State grid. The battery is not charged. So, the curve representing the battery capacity is a straight line. During 11:00–12:00 h, the excess power of the new energy relative to the load can only meet the power required by the hydrogen storage system. A part of the charging power of the batteries is supplied by the State grid. The maximum value of the system’s demanded power from the State grid throughout a typical day is 350 MW.
In addition, Figure 9 gives the trend of power exchange between the microgrid system and the State grid on the sample day. As can be seen in Figure 9, the system sells the most power to the State grid at night during the 1:00–2:00 time period, which is 13.05 MW·h. The reason is that the new energy generation power, especially the power generation system, has the largest excess power relative to the load during that time. The system purchases the most power from the State grid during the 16:00–17:00 time period during the day, which is 10.73 MW·h. The reason for this is that the WT and PV can basically only meet the load demand during that time. To ensure the normal operation of the microgrid system, most of the power consumption of the hydrogen storage system is supplied by the State grid.

4.2. Considering Capacity Allocation Schemes with Different Weights

The economic and environmental costs have an impact on the system capacity allocation of microgrids. Therefore, different weights are set to study them. The weights of the indicators are set as follows: lowest economic cost (Option 1), lowest carbon emissions (Option 2), and a balanced consideration of two indicators (Option 3). The microgrid capacity is configured based on three different scenarios. Specific results are detailed in Table 4.
In Table 4, Option 3 is the optimal option. Option 1 is the least cost option. Option 2 is the least carbon emission option. Compared to Option 3, the cost of Option 1 decreases by 3.13 percent. However, its carbon emissions increase by 12.23 percent. Compared to Option 3, while the carbon emissions of Option 2 decrease by 3.44 percent, the cost increases by 6.15 percent. Obviously, Option 3 can take into account the two different indicators well. In summary, in terms of microgrid capacity allocation, different weight settings produce different allocation results. Option 3 is the best solution for the system when considering both economic cost and environmental impact.

4.3. Capacity Configuration Scheme for Different System Combinations

The capacity configuration schemes for different system combinations are presented in Table 5.
In Table 5, when there is only a WT or PV output in the system, the installed capacity of the WT or PV needs to be increased to meet the load demand. This adjustment is necessary due to the characteristics of each energy source. In general, WT output is higher at night, while the PV has an output only during the day. In the case of the WT only, the installed WT capacity is increased to 1.57 times its original capacity. In the case of the PV only, the installed PV capacity needs to be increased to 2.79 times its original size.
In the WT system, solar energy cannot be utilized during the daytime. At the same time, the WT generation is low. Fuel cell generation and battery action are required during the day when the load demand is high. Most of the system power is provided by the hybrid energy storage system. This leads to an increase in the capacity of the hybrid energy storage system. The system reduces the PV input, but the increased storage capacity leads to higher costs. It rose by 7.3 percent. At the same time, its carbon emissions became 1.71 times higher.
In the PV system, there is no light at night, so the PV is not available. At this time, all the power used to meet the load demand is supplied by the HES system. So, the capacity of HES in this system is much larger than in the previous two systems. The cost has gone up by 62.23%. The carbon emissions are 2.38 times higher.
In summary, the WT and PV systems have their advantages and disadvantages. For example, greater energy storage capacity is required. Costs and carbon emissions increase. Hybrid wind and photovoltaic energy storage microgrid systems have higher reliability. They maintain lower costs and smaller carbon emissions. They have better economics and environmental friendliness.

4.4. System Sensitivity Analysis

The analysis considered load demand variations of 50%, 100%, and 150% to evaluate the impact on system capacity configuration. The system capacity configuration schemes for different load demands are summarized in Table 6. As the load demand increases, the installed capacity of each component of the system also increases. However, the trend is not proportional to the change in load. The installed PV capacity is reduced when the system load demand is halved. It decreases to 0.7 times its original value. Compared to the 50 percent increase in load, the value decreases to 0.4 times.
The cost and carbon emissions of the system grow essentially linearly with load demand. However, the magnitude of the increase varies. This suggests that as load demand increases, the system requires additional installed capacity. This leads to an increase in cost and carbon emissions. The cost and carbon emissions of microgrid systems have different sensitivities to load changes. System carbon emission is more sensitive to changes in load demand. Costs are less sensitive to load than system carbon emissions.

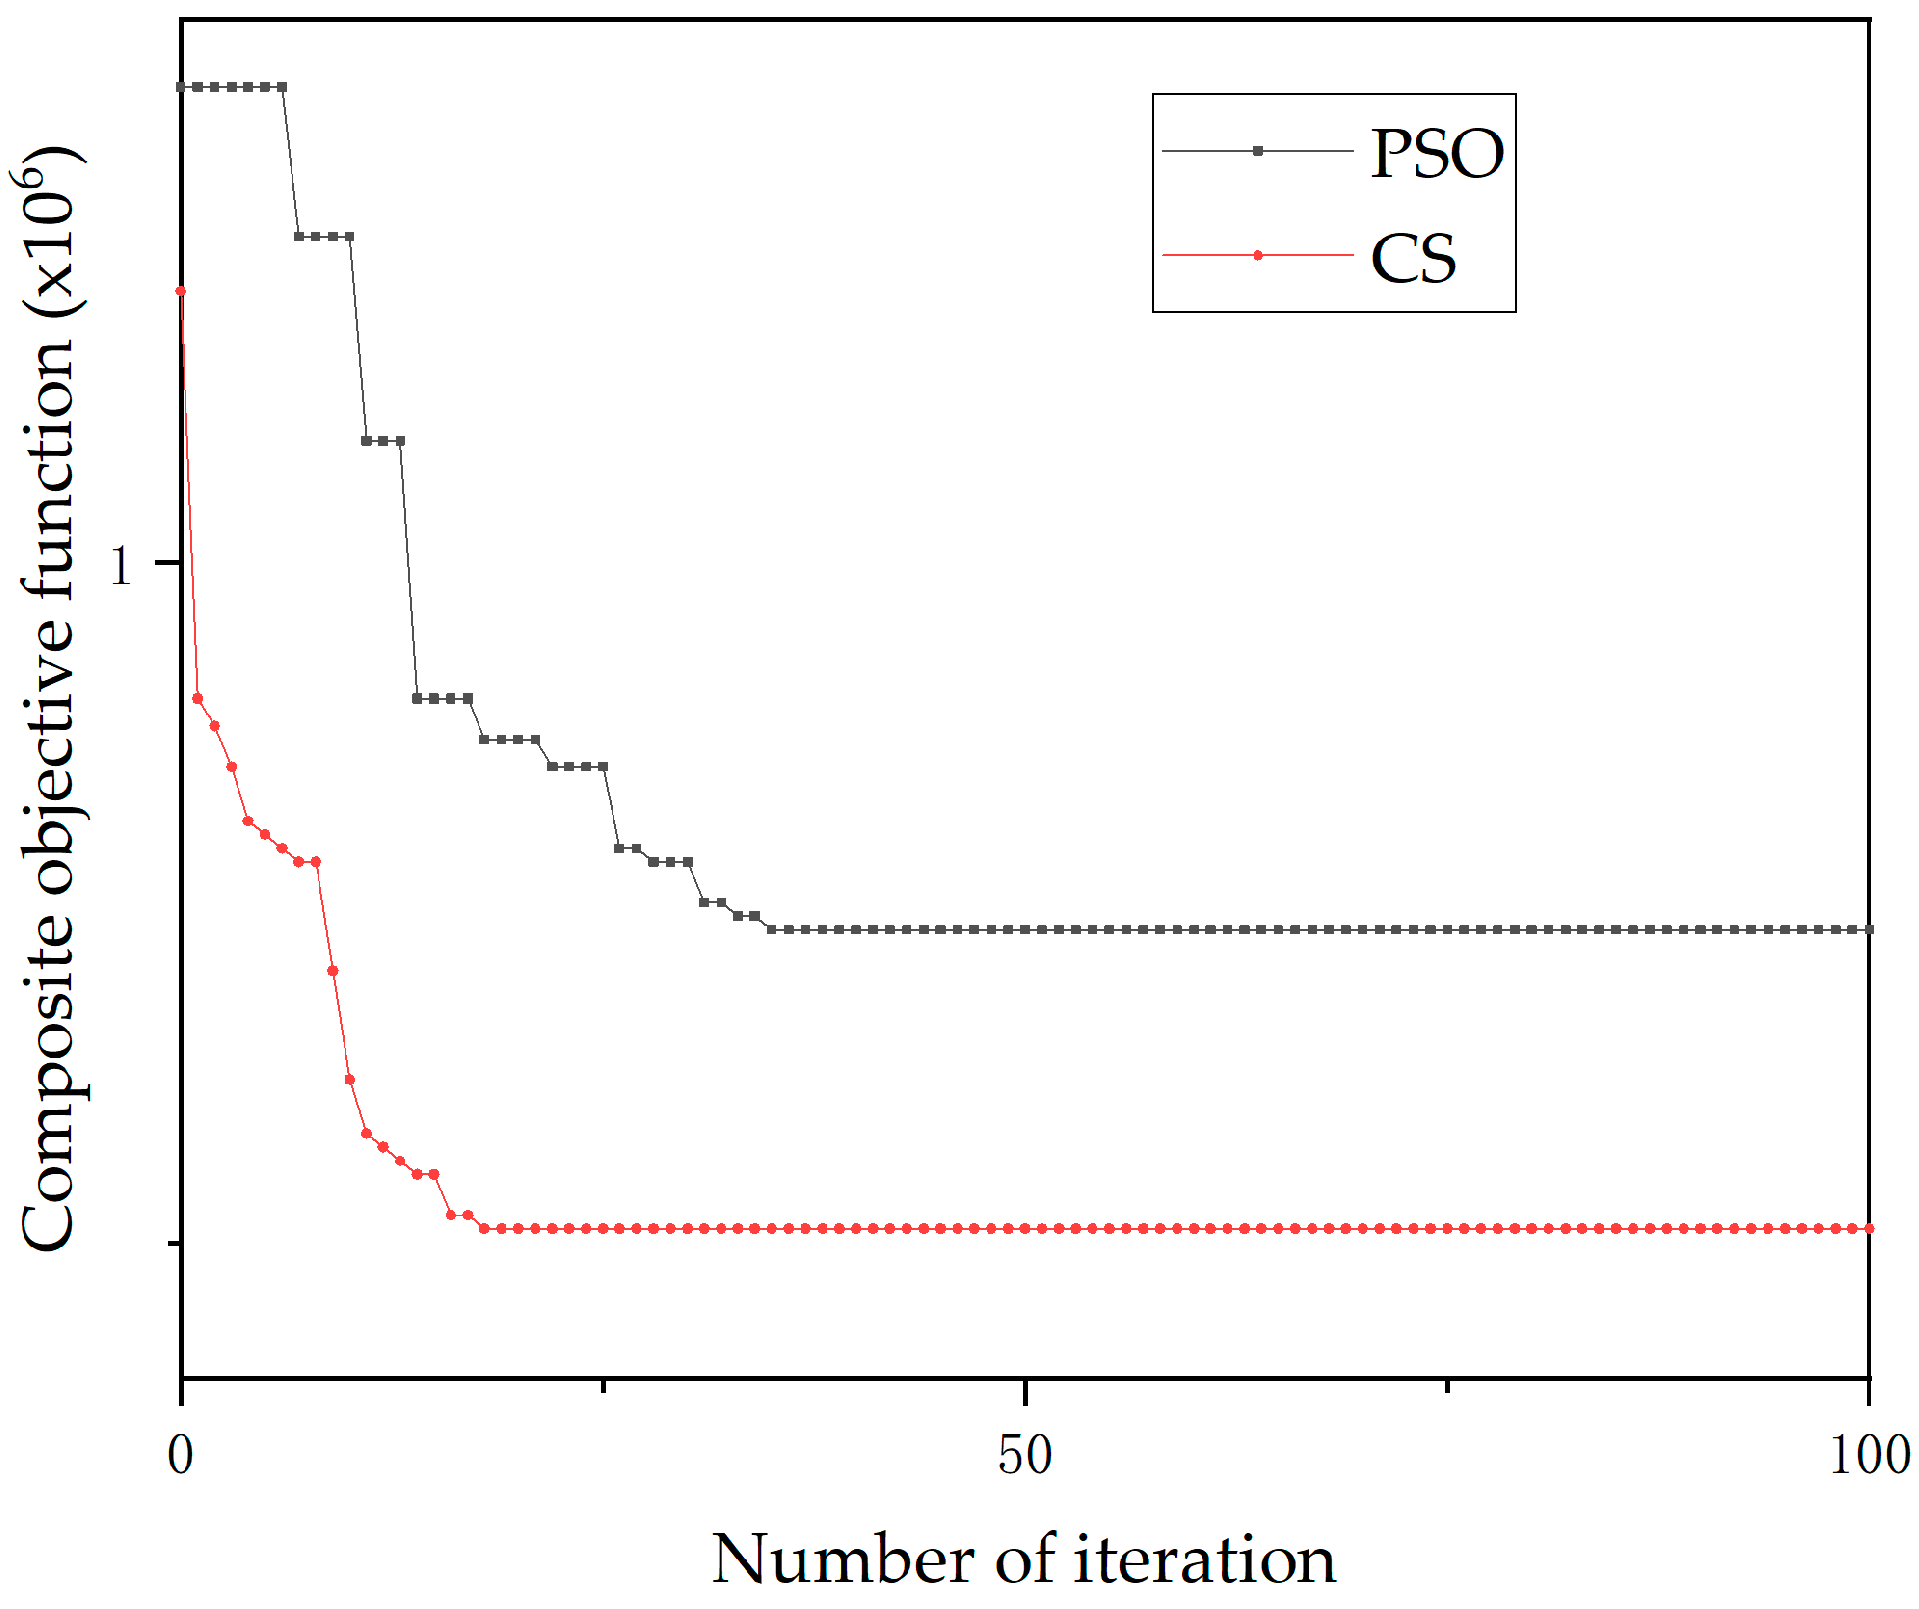
4.5. Effectiveness of the CS Algorithm

As shown in Figure 10, the iterative curves of CS and PSO are compared. The effectiveness of CS in optimizing the capacity allocation of the HESS is verified. Compared to PSO, the cuckoo algorithm yields optimal solutions in shorter iteration cycles. Specifically, after 18 iterations, CS produces a result that is close to the optimal solution. PSO, on the other hand, requires 35 iterations to get close to the optimal solution.
In terms of optimization results, CS outperforms PSO in obtaining the optimal value of the objective function. This signifies that the CS yields more ideal optimization outcomes. Based on the above analyses, it can be confirmed that CS solves the capacity allocation problem. Meanwhile, it has high efficiency and feasibility in the capacity allocation problem of the WT-PV-HES microgrid system.

4.6. Impact of Photovoltaic/Wind Power Attenuation and Load Growth on Capacity Allocation Results

In practice, the power output of the WT and PV declines over time. This results in a decrease in their total power generation. At the same time, the power demanded by the internal load of the system increases with time. If the installed capacity of the entire system is maintained as a result of the initial configuration, problems arise in the operation of the system. As time increases, the rate of load shortage within the system rises. This leads to the reliability of the whole system being affected. This eventually leads to an imbalance in system autonomy. This, in turn, prevents the whole system from operating stably. Therefore, it is necessary to adjust the capacity configuration of the system according to the wind/photovoltaic attenuation and load growth.
This study examines the impact of wind/photovoltaic decay scenarios and load growth scenarios on system capacity allocation. Wind/photovoltaic generation was assumed to decay at a rate of 1% per year. Load is expected to grow by 1 percent per year [52]. Based on the analyses in Section 4.4, it is necessary to recalibrate the capacity of each part of the system periodically as the load changes. It is necessary to reconfigure the installed capacity of each part of the system to maintain safety and stability. At the same time, the decrease in the generating capacity of the equipment means an increase in the load. Considering the operating life of each piece of equipment, especially batteries, electrolyzes, and fuel cells, the capacity configuration is set to be updated every 5 years. Table 7 shows the results of the capacity configuration after each update.
In Table 7, it can be seen that four capacity allocation optimizations are required to operate the microgrid system for 20 years. After each update, the system power loss rate is calculated to be 0, 0.001, 0.001, and 0, respectively. The load loss rate is 0 in all cases. This iterative renewal process ensures stable operation of the microgrid system for up to 20 years. With these updates, the system maintains stable operation of each micro-source. Energy losses are minimized. Significant benefits are achieved in terms of economic return, environmental protection, and energy efficiency.
In summary, periodic capacity reconfiguration of the microgrid system helps to ensure its long-term stability, maximizing the economic, environmental, and energy-saving advantages of the whole system.

5. Conclusions

The wind–PV–hybrid energy storage (WT-PV-HES) microgrid model with equivalent annual cost and carbon disposal cost as the objective is established. The AHP is used to transform the multi-objective function into a single-objective function. The solution is carried out by improving the cuckoo search algorithm. The following conclusions are obtained. Based on the actual situation of a regional park-level microgrid, the most capacity configuration of the system is obtained by solving the improved cuckoo algorithm. At this time, the DCR and DLPSP of the system are 0. The system can maximize the use of wind resources and solar energy, and it has the maximum power supply reliability. By setting different objective weights, it can be seen that the WT-PV-HES microgrid system is more advantageous. Its economic cost is 2.4 × 10⁹ CNY, and its carbon emission cost is 3.6 × 10⁷ kg·a−1. This shows that the microgrid system that takes into account the two objectives has a good economy. At the same time, it has more advantages in terms of carbon emission. The equivalent annual cost of the WT-PV-HES microgrid system is reduced by 7.3 percent and 62.23 percent, respectively. The carbon disposal cost is reduced by 1.71 and 2.38 times, respectively. This shows that the WT-PV-HES microgrid system can maintain lower costs and smaller carbon emissions while ensuring reliability. Compared with the equivalent annual cost, the carbon disposal cost is more sensitive to load change. Compared to the PSO algorithm, the number of iterations for CS is only 18. This shows that it has a more convenient solution speed and faster iteration rate. As the WT/PV output decreases and loads increase, four updates to the microgrid system configuration are required to meet load demands.

Author Contributions

Z.H.: methodology, writing—original draft, and investigation. L.B.: validation and software. L.X.: conceptualization and supervision. B.W.: writing—review and editing and project administration. All authors have read and agreed to the published version of the manuscript.

Funding

This work was supported by the Collaborative Innovation Center for Emissions Trading System Co-constructed by the Province and Ministry (23CICETS-YB003).

Data Availability Statement

Data are contained within the article.

Conflicts of Interest

The authors declare that this study was conducted without any business or financial relationship that could be considered potential conflicts of interest.

Abbreviations

BESBattery energy storage
HESSHydrogen energy storage system
HESHybrid energy system
WTWind power
PVPhotovoltaic power
ETElectrolysis tank
FCFuel cell
HSTHydrogen storage tank
GAsGenetic algorithms
PSOParticle swarm optimization
CSCuckoo search

Appendix A

Number of IterationsPSOCSNumber of IterationsPSOCS
01.351.2510.730.51
11.350.9520.730.51
21.350.88530.730.51
31.350.85540.730.51
41.350.81550.730.51
51.350.8560.730.51
61.350.79570.730.51
71.240.78580.730.51
81.240.78590.730.51
91.240.7600.730.51
101.240.62610.730.51
111.090.58620.730.51
121.090.57630.730.51
131.090.56640.730.51
140.90.55650.730.51
150.90.55660.730.51
160.90.52670.730.51
170.90.52680.730.51
180.870.51690.730.51
190.870.51700.730.51
200.870.51710.730.51
210.870.51720.730.51
220.850.51730.730.51
230.850.51740.730.51
240.850.51750.730.51
250.850.51760.730.51
260.790.51770.730.51
270.790.51780.730.51
280.780.51790.730.51
290.780.51800.730.51
300.780.51810.730.51
310.750.51820.730.51
320.750.51830.730.51
330.740.51840.730.51
340.740.51850.730.51
350.730.51860.730.51
360.730.51870.730.51
370.730.51880.730.51
380.730.51890.730.51
390.730.51900.730.51
400.730.51910.730.51
410.730.51920.730.51
420.730.51930.730.51
430.730.51940.730.51
440.730.51950.730.51
450.730.51960.730.51
460.730.51970.730.51
470.730.51980.730.51
480.730.51990.730.51
490.730.511000.730.51
500.730.51

References

  1. Liu, D.B.; Yuan, Y.; Li, S.C.; Cao, H.J.; Jin, Z.D.; Pao, Z.Y. A review of capacity allocation of renewable energy system using hydrogen storage. Electr. Meas. Instrum. 2021, 59, 1–13. [Google Scholar]
  2. Jing, T.; Chen, G.; Wang, Z.H.; Xu, P.; Li, G.; Jia, M.; Wang, Y.; Shi, J.; Li, M. Research overview on the integrated system of wind- solar hybrid power generation coupled with hydrogen-based energy storage. Electr. Power 2022, 55, 75–83. [Google Scholar]
  3. Zhang, H.; Yuan, T.J.; Tan, J.; Kai, S.J.; Zhou, Z. Hydrogen energy system planning framework for unified energy system. Proc. CSEE 2022, 42, 83–94. [Google Scholar]
  4. Sun, W.; Gong, Y.; Luo, J. Energy storage configuration of distribution networks considering uncertainties of generalized demand-side resources and renewable energies. Sustainability 2023, 15, 1097. [Google Scholar] [CrossRef]
  5. Zshedi, R.; Ardehali, M.M. Power management for storage mechanisms including battery, supercapacitor, and hydrogen of autonomous hybrid green power system utilizing multiple optimally-designed fuzzy logic controllers. Energy 2020, 204, 17935. [Google Scholar]
  6. Atawi, I.E.; Al-Shetwi, A.Q.; Magableh, A.M.; Albalawi, O.H. Recent advances in hybrid energy storage system integrated renewable power generation: Configuration, control, applications, and future directions. Batteries 2022, 9, 29. [Google Scholar] [CrossRef]
  7. Wang, B.; Gupta, R.; Bei, L.; Wan, Q.; Sun, L. A review on gasification of municipal solid waste(MSW): Syngas production, tar formation, mineraltransformation and industrial challenges. Int. J. Hydrogen Energy 2023, 48, 26676–26706. [Google Scholar] [CrossRef]
  8. Li, R.; Li, Q.; Pu, Y.; Li, S.; Sun, C.; Chen, W. Capacity optimization configuration of multi microgrid systems with electric hydrogen hybrid energy storage considering power interaction constraints. Power Syst. Prot. Control 2022, 50, 53–64. [Google Scholar]
  9. Huang, J.; Hou, J.; Ji, K.; Wang, Y.; Zheng, H.; Jin, J.; Luo, Y.; Meng, Q. Research on Energy Management Optimization of Integrated Energy Systems Based on Electrothermal Hydrogen Hybrid Energy Storage. New Technol. Electr. Eng. Electr. Energy 2022, 41, 9–19. [Google Scholar]
  10. Du, X.; Wang, J.; Sun, Y.; He, Y.; Wu, P.; Zhou, W. Optimization plan for microgrid hybrid energy storage considering seawater desalination for hydrogen production. Compr. Smart Energy 2022, 44, 49–55. [Google Scholar]
  11. Yu, K.; Li, F.; Li, S. Simulation of multi-objective capacity optimization configuration for isolated microgrids based on improved BASDE algorithm. Grid Clean Energy 2021, 37, 109–117. [Google Scholar]
  12. Diab AA, Z.; Sultan, H.M.; Mohamed, I.S.; NK, O.; Do, T.D. Application of different optimization algorithms for optimal sizing of PV/wind/diesel/battery storage stand-alone hybrid microgrid. IEEE Access 2019, 7, 119223–119245. [Google Scholar] [CrossRef]
  13. Wang, B.; Song, Z.; Sun, L. A review: Comparison of multi-air-pollutant removal by advanced oxidation processes—Industrial implementation for catalytic oxidation processes. Chem. Eng. J. 2021, 409, 128136. [Google Scholar] [CrossRef]
  14. Yang, W.; Pudasainee, D.; Gupta, R.; Li, W.; Wang, B.; Sun, L. An overview of inorganic particulate matter emission from coal/biomass/MSW combustion: Sampling and measurement, formation, distribution, inorganic composition and influencing factors. Fuel Process. Technol. 2021, 213, 106657. [Google Scholar] [CrossRef]
  15. Wang, B.; Li, W.; Ma, C.; Yang, W.; Pudasainee, D.; Gupta, R.; Sun, L. Synergistic effect on the co-gasification of petroleum coke and carbon-based feedstocks: A state-of-the-art review. J. Energy Inst. 2022, 102, 1–13. [Google Scholar] [CrossRef]
  16. Cui, M.; Yang, L.; Yang, S.; Zhang, T. Capacity optimization configuration of water wind complementary microgrids based on demand side response. New Technol. Electr. Eng. Energy 2022, 41, 21–34. [Google Scholar]
  17. Zhang, K.; Zhang, G.; Xu, B.; Cui, X.; Zhang, X.; Mu, C. Optimal allocation method of energy storage capacity considering voltage risk of high proportion new energy distribution network. Electr. Porcelain Arrester 2023, 6, 85–93. [Google Scholar]
  18. Shao, Z.; Fang, W. Capacity configuration optimization of wind-solar storage micronetworks considering hourly load matching. J. Zhengzhou Aviat. Ind. Manag. Inst. 2023, 9, 5–12. [Google Scholar]
  19. Yang, H.; Shi, Y.; Huang, W.; Li, H.; Chai, L.; Yang, Z.; Zhao, F. Capacity optimization of optical storage and charging station considering real-time demandside response. Smart Power 2019, 51, 51–58. [Google Scholar]
  20. Zhang, M.; Tian, S.; Zeng, Z. Optimization configuration of hybrid energy storage capacity based on variational mode decomposition. Energy Storage Sci. Technol. 2020, 9, 170–177. [Google Scholar]
  21. Yang, W.; Chang, B. Capacity configuration method and configuration tool for hybrid energy storage systems on the powergeneration side considering multiple influencing factors. Energy Storage Sci. Technol. 2022, 11, 3246–3256. [Google Scholar]
  22. Ma, R.; Chen, J.; Zhao, J.C.; Zhang, H.W.; Sun, M. Multi-objectiveoptimization for capacity of non-grid-connected wind/hydrogen hybrid power system. Acta Energiae Solaris Sin. 2019, 40, 422–429. [Google Scholar]
  23. Hu, Z.; Jiang, W.; Zhang, L.; Yang, X.; Zou, Y.; Wang, K. Optimal allocation of hydrogen energy storage capacity based on improved cat swarm algorithm. Electr. Power China 2023, 56, 33–42. [Google Scholar]
  24. Wang, Y.; Wang, H.; Li, X.; Fang, H.; Wang, J.; Jin, Z. Research Review on Capacity Configuration Optimization of Electric Hydrogen Hybrid Energy Storage Microgrids. J. Guangxi Norm. Univ. (Nat. Sci. Ed.) 2022, 40, 18–36. [Google Scholar]
  25. Thakkar, N.; Paliwal, P. Hydrogen storage based microgrid: A comprehensive review on technology, energy management and planning techniques. Int. J. Green Energy 2023, 20, 445–463. [Google Scholar] [CrossRef]
  26. Li, Z.; Wu, L.; Xu, Y.; Wang, L.; Yang, N. Distributed tri-layer risk-averse stochastic game approach for energy trading among multi-energy microgrids. Appl. Energy 2023, 331, 120282. [Google Scholar] [CrossRef]
  27. Li, Z.; Xu, Y. Temporally-coordinated optimal operation of a multi-energy microgrid under diverse uncertainties. Appl. Energy 2019, 240, 719–729. [Google Scholar] [CrossRef]
  28. McMorland, J.; Flannigan, C.; Carroll, J.; Collu, M.; Mcmillan, D.; Leithead, W.; Coraddu, A.; Kazmerski, K. A review of operations and maintenance modelling with considerations for novel wind turbine concepts. Renew. Sustain. Energy Rev. 2022, 165, 112581. [Google Scholar] [CrossRef]
  29. Villanueva, D.; Feijoo, A. Comparison of logistic functions for modeling wind turbine power curves. Electr. Power Syst. Res. 2018, 155, 281–288. [Google Scholar] [CrossRef]
  30. Deng, R.; Zhuo, Y.; Shen, Y. Recent progress in silicon photovoltaic module recycling processes. Resour. Conserv. Recycl. 2022, 187, 106612. [Google Scholar] [CrossRef]
  31. Braun, J.E.; Mitchell, J.C. Solar geometry for fixed and tracking surfaces. Sol. Energy 1983, 31, 439–444. [Google Scholar] [CrossRef]
  32. Li, K.; Wang, H.; Xu, C.; Wu, W.; Zhang, W.; Hou, J.; Rui, X.; Chen, Y.; Fan, L.; Feng, X. Multi-objective optimization of side plates in a large format battery module to mitigate thermal runaway propagation. Int. J. Heat Mass Transf. 2022, 186, 122395. [Google Scholar] [CrossRef]
  33. Li, Z.; Xu, Y. Optimal coordinated energy dispatch of a multi-energy microgrid in grid-connected and islanded modes—ScienceDirect. Appl. Energy 2018, 210, 974–986. [Google Scholar] [CrossRef]
  34. Zhao, N.; Zhang, L.; Wang, S.; Li, D.; Huang, W. Optimal capacity allocation of grid-connected wind-hydrogen-storage microgrid. Hunan Electr. Power 2023, 43, 48–55. [Google Scholar]
  35. Arsad, A.Z.; Hannan, M.A.; Al-Shetwi, A.Q.; Mansur, M.; Muttaqi, K.M.; Dong, Z.Y.; Blaabjerg, F. Hydrogen energy storage integrated hybrid renewable energy systems: A review analysis for future research directions. Int. J. Hydrogen Energy 2022, 47, 17285–17312. [Google Scholar] [CrossRef]
  36. Saaty, T.L.; Zhang, L. The Need for Adding Judgment in Bayesian Prediction. Int. J. Inf. Technol. Decis. Mak. 2016, 15, 733–761. [Google Scholar] [CrossRef]
  37. Kim, J.; Kim, C.; Kim, G.; Kim, I.; Abbas, Q.; Lee, J. Probabilistic tunnel collapse risk evaluation model using analytical hierarchyprocess (AHP) and Delphi survey technique. Tunn. Undergr. Space Technol. 2022, 120, 104262. [Google Scholar] [CrossRef]
  38. Shi, X.Y.; Fan, J.Q.; Guo, P.; Kong, F.L. Evaluation of the large deformation grade cloud model of surrounding rock based on combination weighting method. IOP Conf. Ser. Earth Environ. Sci. 2021, 861, 042091. [Google Scholar] [CrossRef]
  39. Li, Z.; Xu, Y.; Fang, S.; Zheng, X.; Feng, X. Robust Coordination of A Hybrid AC/DC Multi-Energy Ship Microgrid with Flexible Voyage and Thermal Loads. IEEE Trans. Smart Grid 2020, 11, 2782–2793. [Google Scholar] [CrossRef]
  40. Wu, X.; Yang, W.; Xiong, X. Capacity Configuration Method of Flywheel Energy Storage Array for Assisting the Primary Frequency Regulation of Nuclear Power Unit. J. Chin. Soc. Power Eng. 2023, 43, 877–884. [Google Scholar]
  41. Ringwald, W.R.; Forbes, M.K.; Wright, A.G.C. Meta-analysis of structural evidence for the Hierarchical Taxonomy of Psychopathology (HiTOP) model. Psychol. Med. 2023, 53, 533–546. [Google Scholar] [CrossRef] [PubMed]
  42. Cui, D.; Ge, W.; Zhao, W.; Jiang, F.; Zhang, Y. Economic low-carbon clean dispatching of power system containing P2G considering the comprehensive influence of multi-price factor. J. Electr. Eng. Technol. 2022, 17, 155–166. [Google Scholar] [CrossRef]
  43. Liu, Z.; Zhang, L.; Kou, P. Capacity optimization configuration of grid connected wind power photovoltaic pumped storage battery system. J. Power Eng. 2023, 43, 1151–1159. [Google Scholar]
  44. Khadanga, R.K.; Kumar, A.; Panda, S. A modified Grey Wolf Optimization with Cuckoo Search Algorithm for load frequency controller design of hybrid power system. Appl. Soft Comput. 2022, 124, 109011. [Google Scholar] [CrossRef]
  45. Liu, C.; Wang, J.; Zhou, L.; Rezaeipanah, A. Solving the multi-objective problem of IoT service placement in fog computing using cuckoo search algorithm. Neural Process. Lett. 2022, 54, 1823–1854. [Google Scholar] [CrossRef]
  46. Minh, H.L.; Sang-To, T.; Wahab, M.A.; Guong-Le, T. Structural damage identification in thin-shell structures using a new technique combining finite element model updating and improved Cuckoo search algorithm. Adv. Eng. Softw. 2022, 173, 103206. [Google Scholar] [CrossRef]
  47. Shishavan, S.T.; Gharehchopogh, F.S. An improved cuckoo search optimization algorithm with genetic algorithm for community detection in complex networks. Multimed. Tools Appl. 2022, 81, 25205–25231. [Google Scholar] [CrossRef]
  48. Stephan, J.J.; Hasan, H.S.; Omran, A.H. Using Cuckoo Algorithm for Estimating Two GLSD Parameters and Comparing it with Other Algorithms. Int. J. Comput. Sci. Inf. Technol. 2017, 9, 87–96. [Google Scholar] [CrossRef]
  49. Chen, X.; Yu, K. Hybridizing cuckoo search algorithm with biogeography-based optimization for estimating photovoltaic model parameters. Sol. Energy 2019, 180, 192–206. [Google Scholar] [CrossRef]
  50. Lai, J.; Wen, X.; Zhang, Q.; Wang, J. Capacity Optimization Configuration of DC Microgrid Based on Improved Sparrow Search Algorithm. Acta Energiae Solaris Sin. 2023, 44, 157–163. [Google Scholar]
  51. Xu, Y.; Zhang, J.; Wang, P.; Mi, L. Optimal Configuration of Microgrid Considering Static Voltage Stability of Distribution Network. Electr. Power Constr. 2022, 43, 87–101. [Google Scholar]
  52. Luo, X.; Li, Z.; Zhang, H. Capacity Allocation and Optimal Scheduling of Wind-PV-Thermal Power-Hydrogen Microgrid System. Master’s Thesis, Hebei University of Science and Technology, Shijiazhuang, China, 2023. [Google Scholar]
Figure 1. WT-PV-HES microgrid structure diagram.
Processes 12 00718 g001
Figure 2. Regional wind–PV–hybrid energy storage microgrid system operation strategy.
Processes 12 00718 g002
Figure 3. Flow diagram of solving the model.
Processes 12 00718 g003
Figure 4. Monthly meteorological distribution data (wind speed and irradiance data) for selected areas.
Processes 12 00718 g004
Figure 5. Cost distribution under optimal capacity configuration for the WT-PV-HES microgrid systems.
Processes 12 00718 g005
Figure 6. Hourly simulation results of the variability of the WT-PV-HES microgrid system units on a sample day: (a) new energy system output and load demand power; (b) hybrid energy storage system output.
Processes 12 00718 g006
Figure 7. Microgrid subsystem output on a sample day: WT, PV, and HES.
Processes 12 00718 g007
Figure 8. Capacity allocation between the hydrogen energy storage system and the battery system in the hybrid energy storage system on a sample day: (a) power distribution of the hydrogen energy storage system; (b) power distribution of battery system power.
Processes 12 00718 g008
Figure 9. Trends in the exchange of electrical energy between a sample day’s WT-PV-HES microgrid system and the State grid.
Processes 12 00718 g009
Figure 10. Optimized iteration curves for the particle swarm algorithm and cuckoo algorithm.
Processes 12 00718 g010
Table 1. Unit distributed power cost parameters.
TypeInvestment Cost Factor/CNYAnnual O&M Cost/CNY·a−1Replacement Cost Factor/CNYLifetime/a
Wind turbine8,000,000192,000-20
Photovoltaic cell230455.3-20
Battery198447.620005
Electrolysis tanks7,200,000280,800900010
Hydrogen storage tanks2,240,00047,040-20
Fuel cells9,600,000374,40012,00010
Table 2. Basic parameters of the hybrid energy storage system.
ParameterValueParameterValue
Upper limit of charge state0.20Electrolyzer efficiency0.65
Lower charge state limit0.90Fuel cell efficiency0.50
Battery life cycle/a5.00Hydrogen storage tank efficiency0.98
Self-discharge rate0.01Electrolyzer life cycle/a10.00
Battery charging efficiency0.90Fuel cell life cycle/a10.00
Battery discharge efficiency0.90Maximum battery charging and discharging power/kW30
Table 3. Optimal capacity allocation scheme for the WT-PV-HES microgrid system.
Capacity Configuration SchemeValue
Number of WTs/unit37
Number of PV cells/pc114,546
Battery quantity/block70,520
Hydrogen storage tank/kW·h56,380
Electrolysis tank/kW48,028
Fuel cell/kW25,580
Table 4. Comparison of the WT-PV-HES microgrid system cost and carbon emissions under different weights.
OptionCost/109CNYCarbon Footprint/107kg·a−1
12.34.25
22.553.5
32.43.6
Table 5. Capacity allocation schemes for the WT-PV-HES microgrid system with different system combinations.
Capacity Configuration SchemeWT-PV-HESWT-HESPV-HES
Number of wind turbines/unit37580
Number of photovoltaic cells/pc114,5460320,246
Battery quantity/block70,52093,448144,354
Hydrogen storage tank/kW·h56,38075,803111,809
Electrolysis tank/kW48,02864,57495,246
Fuel cell/kW25,58034,39250,728
Table 6. Capacity allocation scheme for the WT-PV-HES microgrid system with different load demands.
Load/%50100150
Number of wind turbines/unit153749
Number of photovoltaic cells/pc78,988114,546220,032
Battery quantity/block36,09070,520106,543
Hydrogen storage tank/kW·h28,32656,38084,822
Electrolysis tank/kW24,13048,02872,257
Fuel cell/kW12,85225,58038,485
Table 7. Results of the WT-PV-HES microgrid system configuration for the wind/photovoltaic attenuation and load growth scenarios.
Ordinal NumberFirst TimeSecond TimeThird TimeFourth Time
Number of wind turbines/unit37394142
Number of photovoltaic cells/pc114,546119,575126,839135,779
Battery quantity/block70,52073,66676,68181,662
Hydrogen storage tank/kW·h56,38060,03474,12980,394
Electrolysis tank/kW48,02849,59451,68255,859
Fuel cell/kW25,58027,14630,27833,933
Disclaimer/Publisher’s Note: The statements, opinions and data contained in all publications are solely those of the individual author(s) and contributor(s) and not of MDPI and/or the editor(s). MDPI and/or the editor(s) disclaim responsibility for any injury to people or property resulting from any ideas, methods, instructions or products referred to in the content.

