Article

Process Intensification in Human Pluripotent Stem Cell Expansion with Microcarriers

Centre for Biochemical Engineering and Cell Cultivation Techniques, Institute of Chemistry and Biotechnology, Zurich University of Applied Sciences, Grüentalstrasse 14, 8820 Wädenswil, Switzerland
*
Author to whom correspondence should be addressed.
Processes 2024, 12(3), 426; https://doi.org/10.3390/pr12030426
Submission received: 22 January 2024 / Revised: 13 February 2024 / Accepted: 16 February 2024 / Published: 20 February 2024

Abstract

:
Given the demands human induced pluripotent stem cell (hiPSC)-based therapeutics place on manufacturing, process intensification strategies which rapidly ensure the desired cell quality and quantity should be considered. Within the context of antibody and vaccine manufacturing, one-step inoculation has emerged as an effective strategy for intensifying the upstream process. This study therefore evaluated whether this approach could be applied to the expansion of hiPSCs in flasks under static and in microcarrier-operated stirred bioreactors under dynamic conditions. Our findings demonstrated that high density working cell banks containing hiPSCs at concentrations of up to 100 × 106 cells mL−1 in CryoStor® CS10 did not impair cell growth and quality upon thawing. Furthermore, while cell distribution, growth, and viability were comparable to routinely passaged hiPSCs, those subjected to one-step inoculation and expansion on microcarriers under stirred conditions were characterized by improved attachment efficiency (≈50%) following the first day of cultivation. Accordingly, the process development outlined in this study establishes the foundation for the implementation of this intensified approach at L-scale.

1. Introduction

The recent clinical and commercial success of cell therapeutics underscores their substantial developmental potential within the healthcare sector [1,2,3]. Despite these achievements, challenges persist, particularly in improving patient accessibility and product affordability [4]. Here, allogeneic cell therapies based on human induced pluripotent stem cells (hiPSCs) may prove pivotal, as they allow for both an economy-of-scale approach and the production of a wide range of specialized cell types [5,6,7,8]. Current estimates place the number of cells required for such treatments at up to 1012 per patient depending on the clinical indication [4]. To achieve these cell quantities, two approaches have proven instrumental, namely the cultivation of hiPSCs in stirred bioreactors as spheroids or using microcarriers (MCs). While the cultivation of hiPSCs as spheroids has been particularly successful at mL-scale, achieving expansion factors ( E F ) of >93 in 5 d [9] and cell densities of >34 × 106 in 7 d [10], recreating these remarkable results at L-scale remains challenging [11]. On the other hand, the application of MCs at L-scale has demonstrated the potential for absolute hiPSC yields of >1010 and E F >120, however, such processes required cultivation times >12 d [12], thereby highlighting the need for further process optimization.
Intensified production processes, which primarily serve to shorten process time and reduce the cost of manufacturing [13], have increasingly become the focus of antibody and vaccine manufacturers during the last 10 years. Within this context, one-step inoculation (OSI) has emerged as an effective intensification strategy, alongside the application of cells from high cell density [12,14,15] or large volume cell banks [14,16]. Also referred to as a frozen accelerated seed train [14], OSI describes the direct inoculation of the N-1 bioreactor using cryopreserved cells, thereby offering numerous advantages as demonstrated by various working groups [12,17,18,19,20]. These advantages include a reduction of expansion steps and the associated risk of contamination, an improvement in inoculum quality, and enhanced process reproducibility. When applied to the expansion of hiPSCs as spheroids, Huang et al. [11] confirmed that OSI could be used to shorten the duration seed train without impacting cell quality under stirred conditions. Meiser et al. [16] later observed that the OSI of hiPSCs led to a ≈15% reduction in cell aggregation and more uniform spheroid size after 24 h when using the orbitally shaken CERO 3D bioreactor, allowing for E F of between 6–8 to be achieved within 3 d.
Despite its success in stirred and orbitally shaken bioreactors, OSI has yet to be described in detail for the expansion of hiPSCs on commercially available MCs. This is noteworthy, considering that, from a scalability perspective, stirred bioreactors operated using commercially available MCs are currently the preferred choice for the expansion of adherently growing stem cells [21,22]. As shown in Figure 1, this study therefore aimed not only to investigate the impact of hiPSC density upon freezing on subsequent attachment, growth and quality, but also the applicability of OSI for the expansion of hiPSCs in stirred MC-operated single-use (SU) bioreactors.

2. Materials and Methods

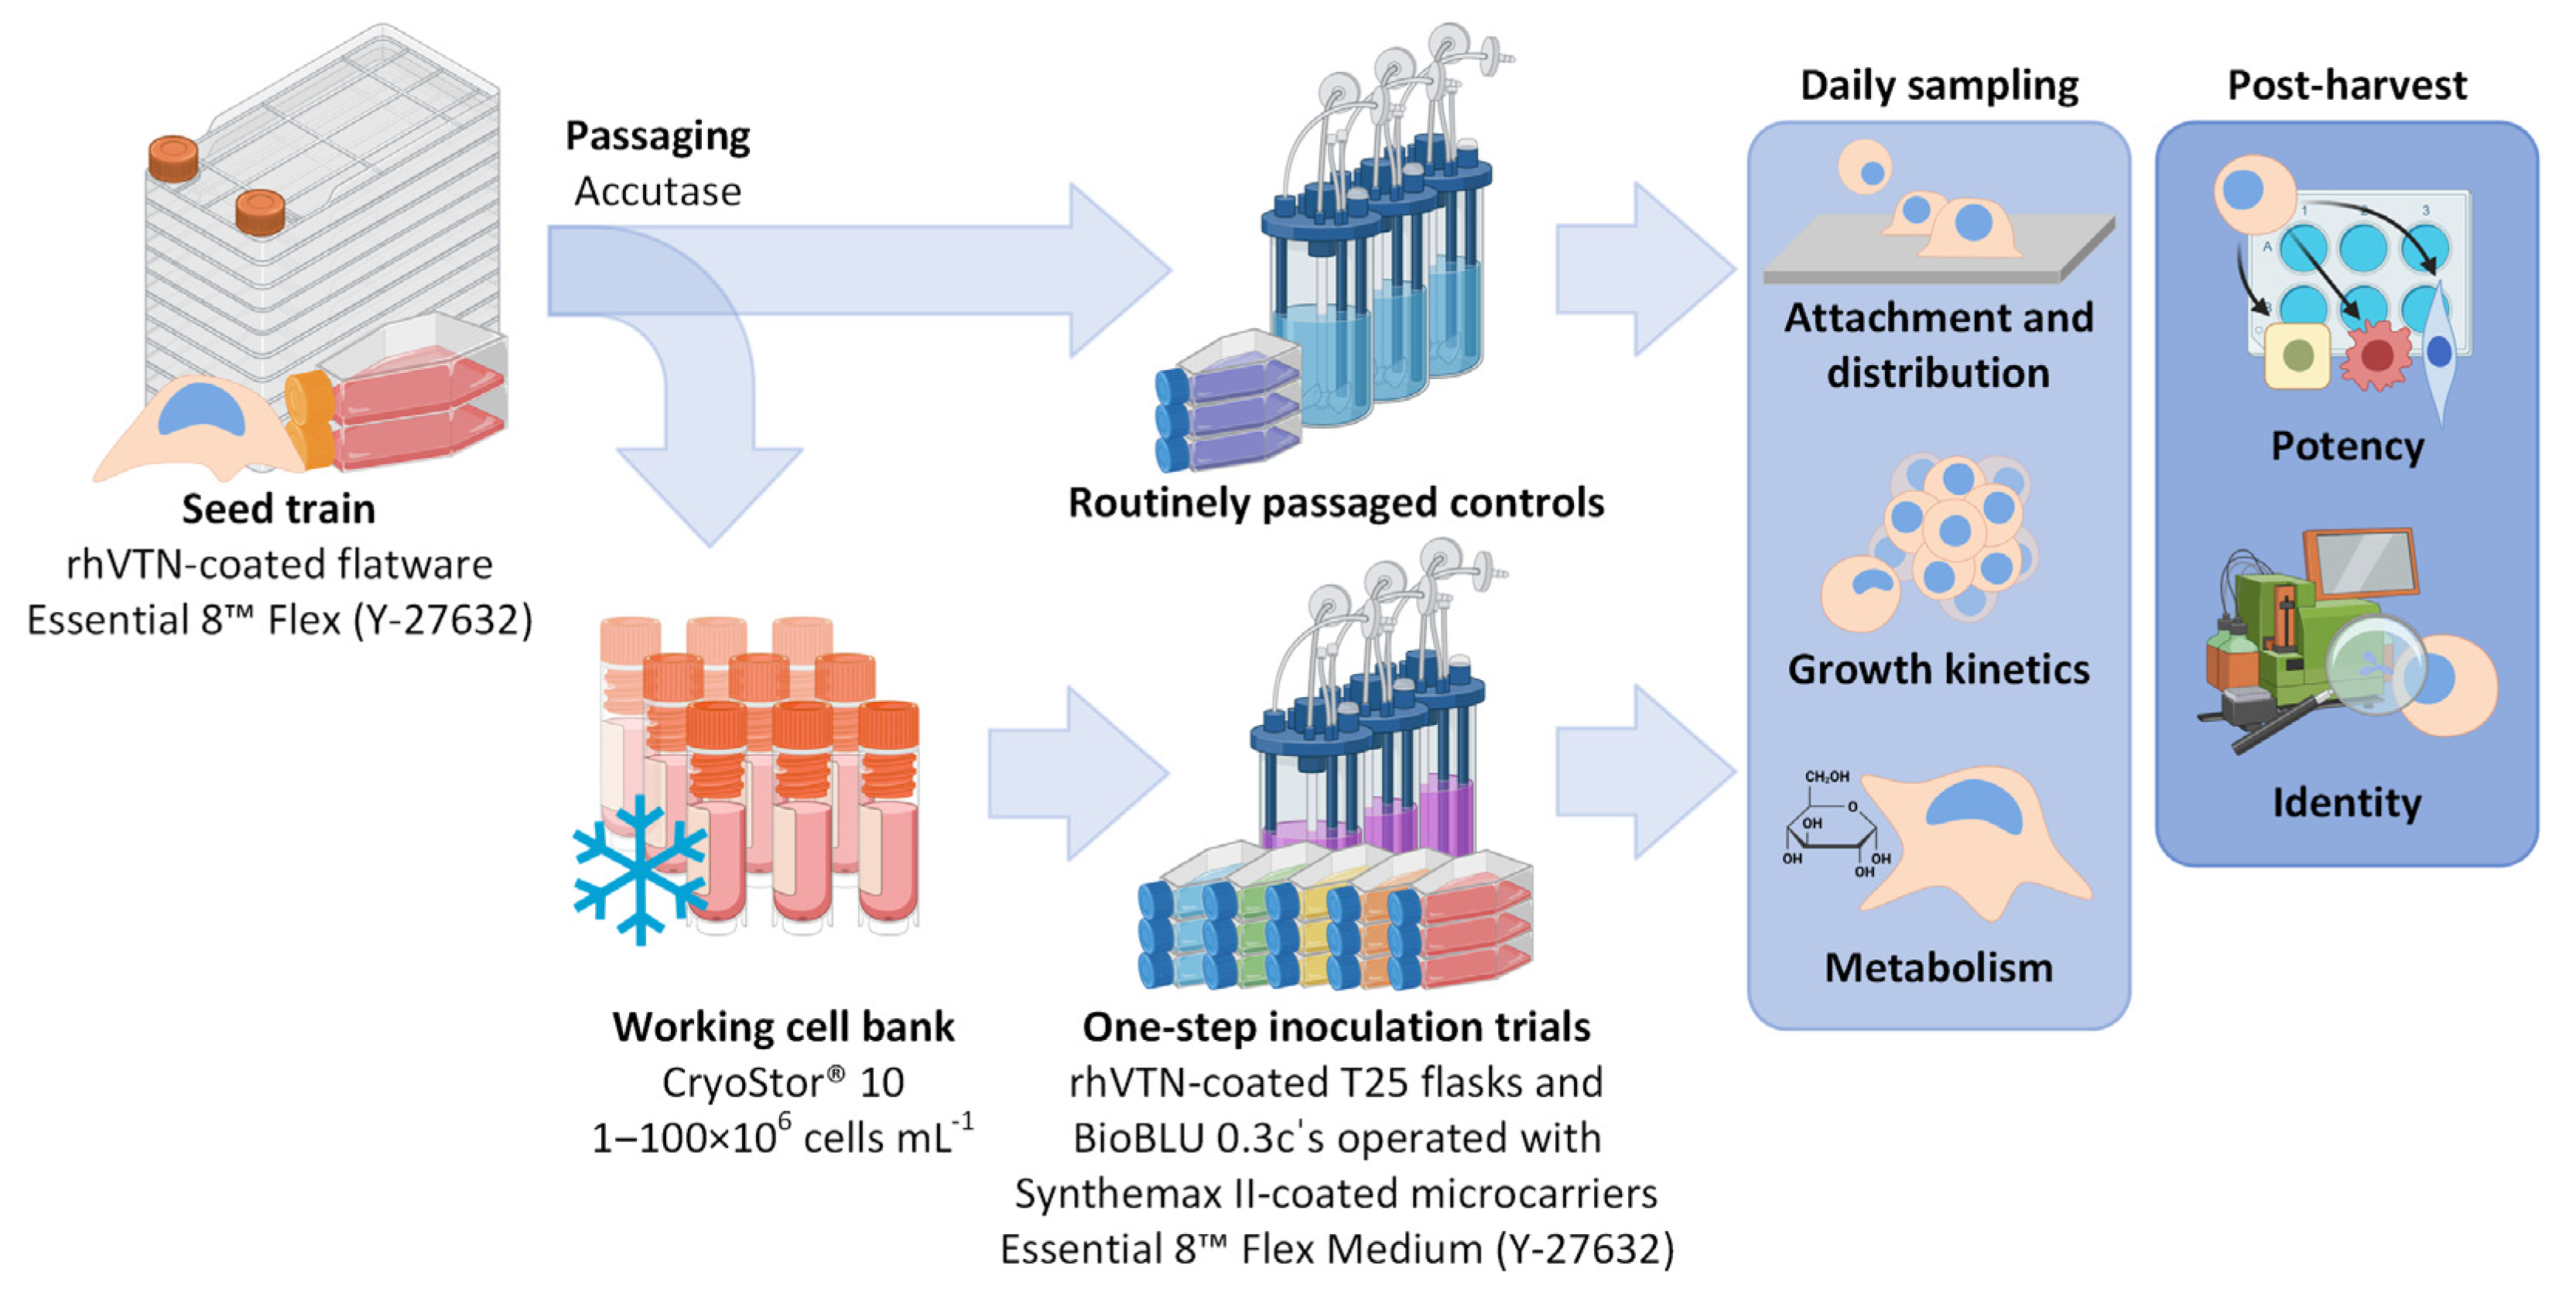
2.1. Cell Line, Cultivation and Cell Banking

Experiments were conducted using the Gibco™ Episomal hiPSC (Thermo Fisher Scientific, Waltham, MA, USA), which were generated from CD34+ cord-blood progenitors with seven episomally expressed factors (Oct4, Sox2, Klf4, Myc, Nanog, Lin28 and SV40 T). Prior to the inoculation of the experiments, the hiPSCs were plated at 10,000–20,000 cells cm−2 and expanded at 37 °C with 5% CO2 under feeder-free conditions on polystyrene-based tissue culture (TC)-treated cultureware (Corning, NY, USA) coated with 0.5 µg cm−2 of recombinant human vitronectin (rhVTN). Essential 8™ Flex (Thermo Fisher Scientific, Waltham, MA, USA), henceforth denoted as E8F, served as the cell culture medium and was supplemented for the first 24 h with Y-27632 (RI), a pan-rho associated coiled-coiled kinase inhibitor (Miltenyi Biotec, Bergisch Gladbach, Germany) and known dissociation-induced apoptosis inhibitor [23]. Media exchanges (MEs) were performed 24 h post-inoculation, then every 48–72 h as recommended by the manufacturer. Cell passaging was performed every 4 d by exposing the cells to Accutase® (Corning, NY, USA) for 6–8 min at 37 °C without a prior washing step. Once detached, the cells were rinsed with culture medium, centrifuged, and resuspended in fresh culture medium for replating. The cells were passaged at least twice before quality control, growth characterization or cryopreservation. To establish the working cell bank, cells were centrifuged and resuspended in CryoStor® CS10 (STEMCELL Technologies, Vancouver, BC, Canada) at cell densities of 1–100 × 106 cells mL−1, and frozen away at a rate of −1 °C min−1 in a −80 °C freezer using a CoolCell® LX Cell Freezing Container (Corning, NY, USA). Once frozen, the cells were transferred to liquid N2 for long-term storage.
The hiPSCs from the working cell bank were thawed in a water bath at 37 °C and plated at 10,000 cells cm−2 in E8F containing RI on rhVTN-coated TC-treated T25 flasks (Corning, NY, USA) for growth characterization under static conditions. The duration of the repeated batch cultivations encompassed 5 d at 37 °C and 5% CO2, with a 100% ME performed on day 1 and 3 using E8F. For the experiments under dynamic conditions, the DASbox® Bioreactor System and corresponding BioBLU® 0.3c SU bioreactors (Eppendorf, Hamburg, Germany), equipped with a three-bladed marine impeller, were used. The SU units were fitted with standard glass pH electrodes, dissolved oxygen (DO) probes, and temperature sensors to allow for the online monitoring and regulation of these critical process parameters. The bioreactors were modified for perfusion mode operation by introducing a sterile triple-port equipped with level probes, set to a height corresponding to a maximum target working volume of 150 mL, and a MC retention probe. The MC retention probe consisted of a dip tube modified with SEFAR NITEX 03-80/40 (Sefar, Thal, Switzerland) to restrict outflow particle diameters to <80 µm. Further preparatory work included the transfer of 1.5 g of sterile Synthemax® II coated low concentration polystyrene MCs (Corning, NY, USA) in 140 mL of RI supplemented E8F to each unit. The medium was then equilibrated for >4 h to the desired process setpoints prior to inoculation.
Inoculation of 10 × 106 cells per bioreactor vessel (≈66,666 cells mL−1 or 18,500 cells cm−2) was performed in one of two ways, either following routine passaging as previously described or directly from freshly thawed working cell bank cryovials. Following inoculation, the working volume was corrected to 150 mL with E8F+RI. Subsequent cell attachment was supported through a 12 h intermittent stirring phase at 70 rpm (5 min on, 175 min off), followed by continuous stirring for the remainder of the cultivation. This stirring speed set to correspond to a specific power input of ≈1 W m−3, which was slightly lower than N s 1 u as defined elsewhere [24]. Dissolved oxygen and pH were corrected to setpoints of 40% and 7.2, respectively, through overlay aeration of air, N2 and CO2 at a combined rate of 0.15 vvm. Following 24 h in RI supplemented E8F, perfusion with E8F was initiated at a rate of 90–100 mL d−1 (0.60–0.66 vvd) until cultivation completion. This ensured that RI, a known hiPSC mesoendodermal differentiation primer and ectodermal differentiation inhibitor [25], was washed out in a timely manner. Similar to the trials under static conditions, rhVTN-coated TC-treated T25 flasks inoculated with routinely passaged hiPSCs at 20,000 cells cm−2 served as a static control.

2.2. Cell Counting and Medium Component Analysis

The sampling procedure varied slightly depending on whether the cells were cultivated under static or dynamic conditions. During static cultivation, images were taken daily using the EVOS™ FL 2 Auto (Thermo Fisher Scientific, Waltham, MA, USA) to determine confluency, followed by a complete harvest of the T25 flasks with TrypLE™ Select (Thermo Fisher Scientific, Waltham, MA, USA) at 37 °C for 6–8 min without prior wash step. For the dynamic cultivations, stirring speed was increased to 100 rpm 5 min prior to daily sampling to ensure homogenous MC distribution. The MC suspension was centrifuged at 200 rcf for 2 min following sampling and the resulting pellets either treated with TrypLE™ Select and analyzed by cell counter or fixed with 10% neutral buffered formalin (Sigma-Aldrich, St. Louis, MO, USA) and stored at 4 °C.
In all experiments, cell count and viability were assessed using the NucleoCounter® NC-200™ and Via1-Cassettes™ (ChemoMetec, Lillerød, Denmark) following treatment with proteolytic reagent. This allowed for the calculation of growth-dependent parameters as recently reported by others [26,27]. In Equation (1), E F represents the expansion factor (%) or the ratio between the viable cell density on day i ( V C D i ) of cultivation (cells mL−1) and the viable cell density directly following inoculation.
E F = V C D i V C D 0
Equation (2) describes the attachment efficiency ( A E ) or the ratio of inoculated cells which have attached to the scaffold or microcarrier following the attachment phase (%).
A E = V C D 1 V C D 0
Further evaluation of the change in V C D i over time ( t i ) during the exponential growth phase permitted the calculation of μ or the specific growth rate (h−1) through linear regression using Equation (3).
l n V C D i = μ × t i t 0 + l n ( V C D 0 )
Equation (4) may then be used to calculate t d or doubling time (h) using the specific growth rate.
t d = ln 2 μ
Daily samples of the cell culture medium were collected from all trials and analyzed using the Cedex Bio (Roche, Basel, Switzerland) along with the corresponding kits for glucose (Glc), glutamine (Gln), lactate (Lac), ammonium (NH4), and lactate dehydrogenase (LDH). This allowed for the calculation of specific consumption and production rates of these components, as well as their respective yields, using Equations (5) and (6).
q s = c s , i c s , i + 1 t i t i + 1 + V ˙ i V i × c s , 0 c i + 1 + c i 2 × 2 ( V C D i + 1 + V C D i )
Y A / B = q A q B
Daily changes in the specific uptake or production rates of substance s or q s (pmol cell−1 d−1) during cultivation were calculated by considering changes to the concentration of substance s or c s , i (mol L−1), viable cell density, time, volumetric flow rate of the feed on day i or V ˙ i (L d−1), the working volume of the vessel on day i or V i (L), and the concentration of substance s in the inlet or c s , 0 (mol L−1). During repeated batch mode operation, V ˙ i was assumed to be 0 L d−1, simplifying the equation. Y A / B or the substance B dependent yield of substance A (mol mol−1) was calculated as the ratio between the specific production rate of A (mol cell−1 d−1) and the specific consumption rate of B (mol cell−1 d−1). The cell specific perfusion rates (CSPRs), as described by Ozturk [28] and Bausch et al. [29], were then calculated using the V C D i , V ˙ i , and V i or the q s during perfusion mode operation and c s , 0 , to give the applied and minimum CSPR or C S P R a p p (pL cell−1 d−1) and C S P R m i n (pL cell−1 d−1), respectively. According to Bausch et al. [29], C S P R a p p and C S P R m i n may be placed in relation to one another by additionally taking into account the critical CSPR or C S P R c r i t (pL cell−1 d−1) and the non-dimensional safety margin R .
C S P R a p p = V ˙ i V i × V C D i
C S P R m i n = q s c s , 0
C S P R a p p C S P R c r i t = ( 1 + R ) × C S P R m i n

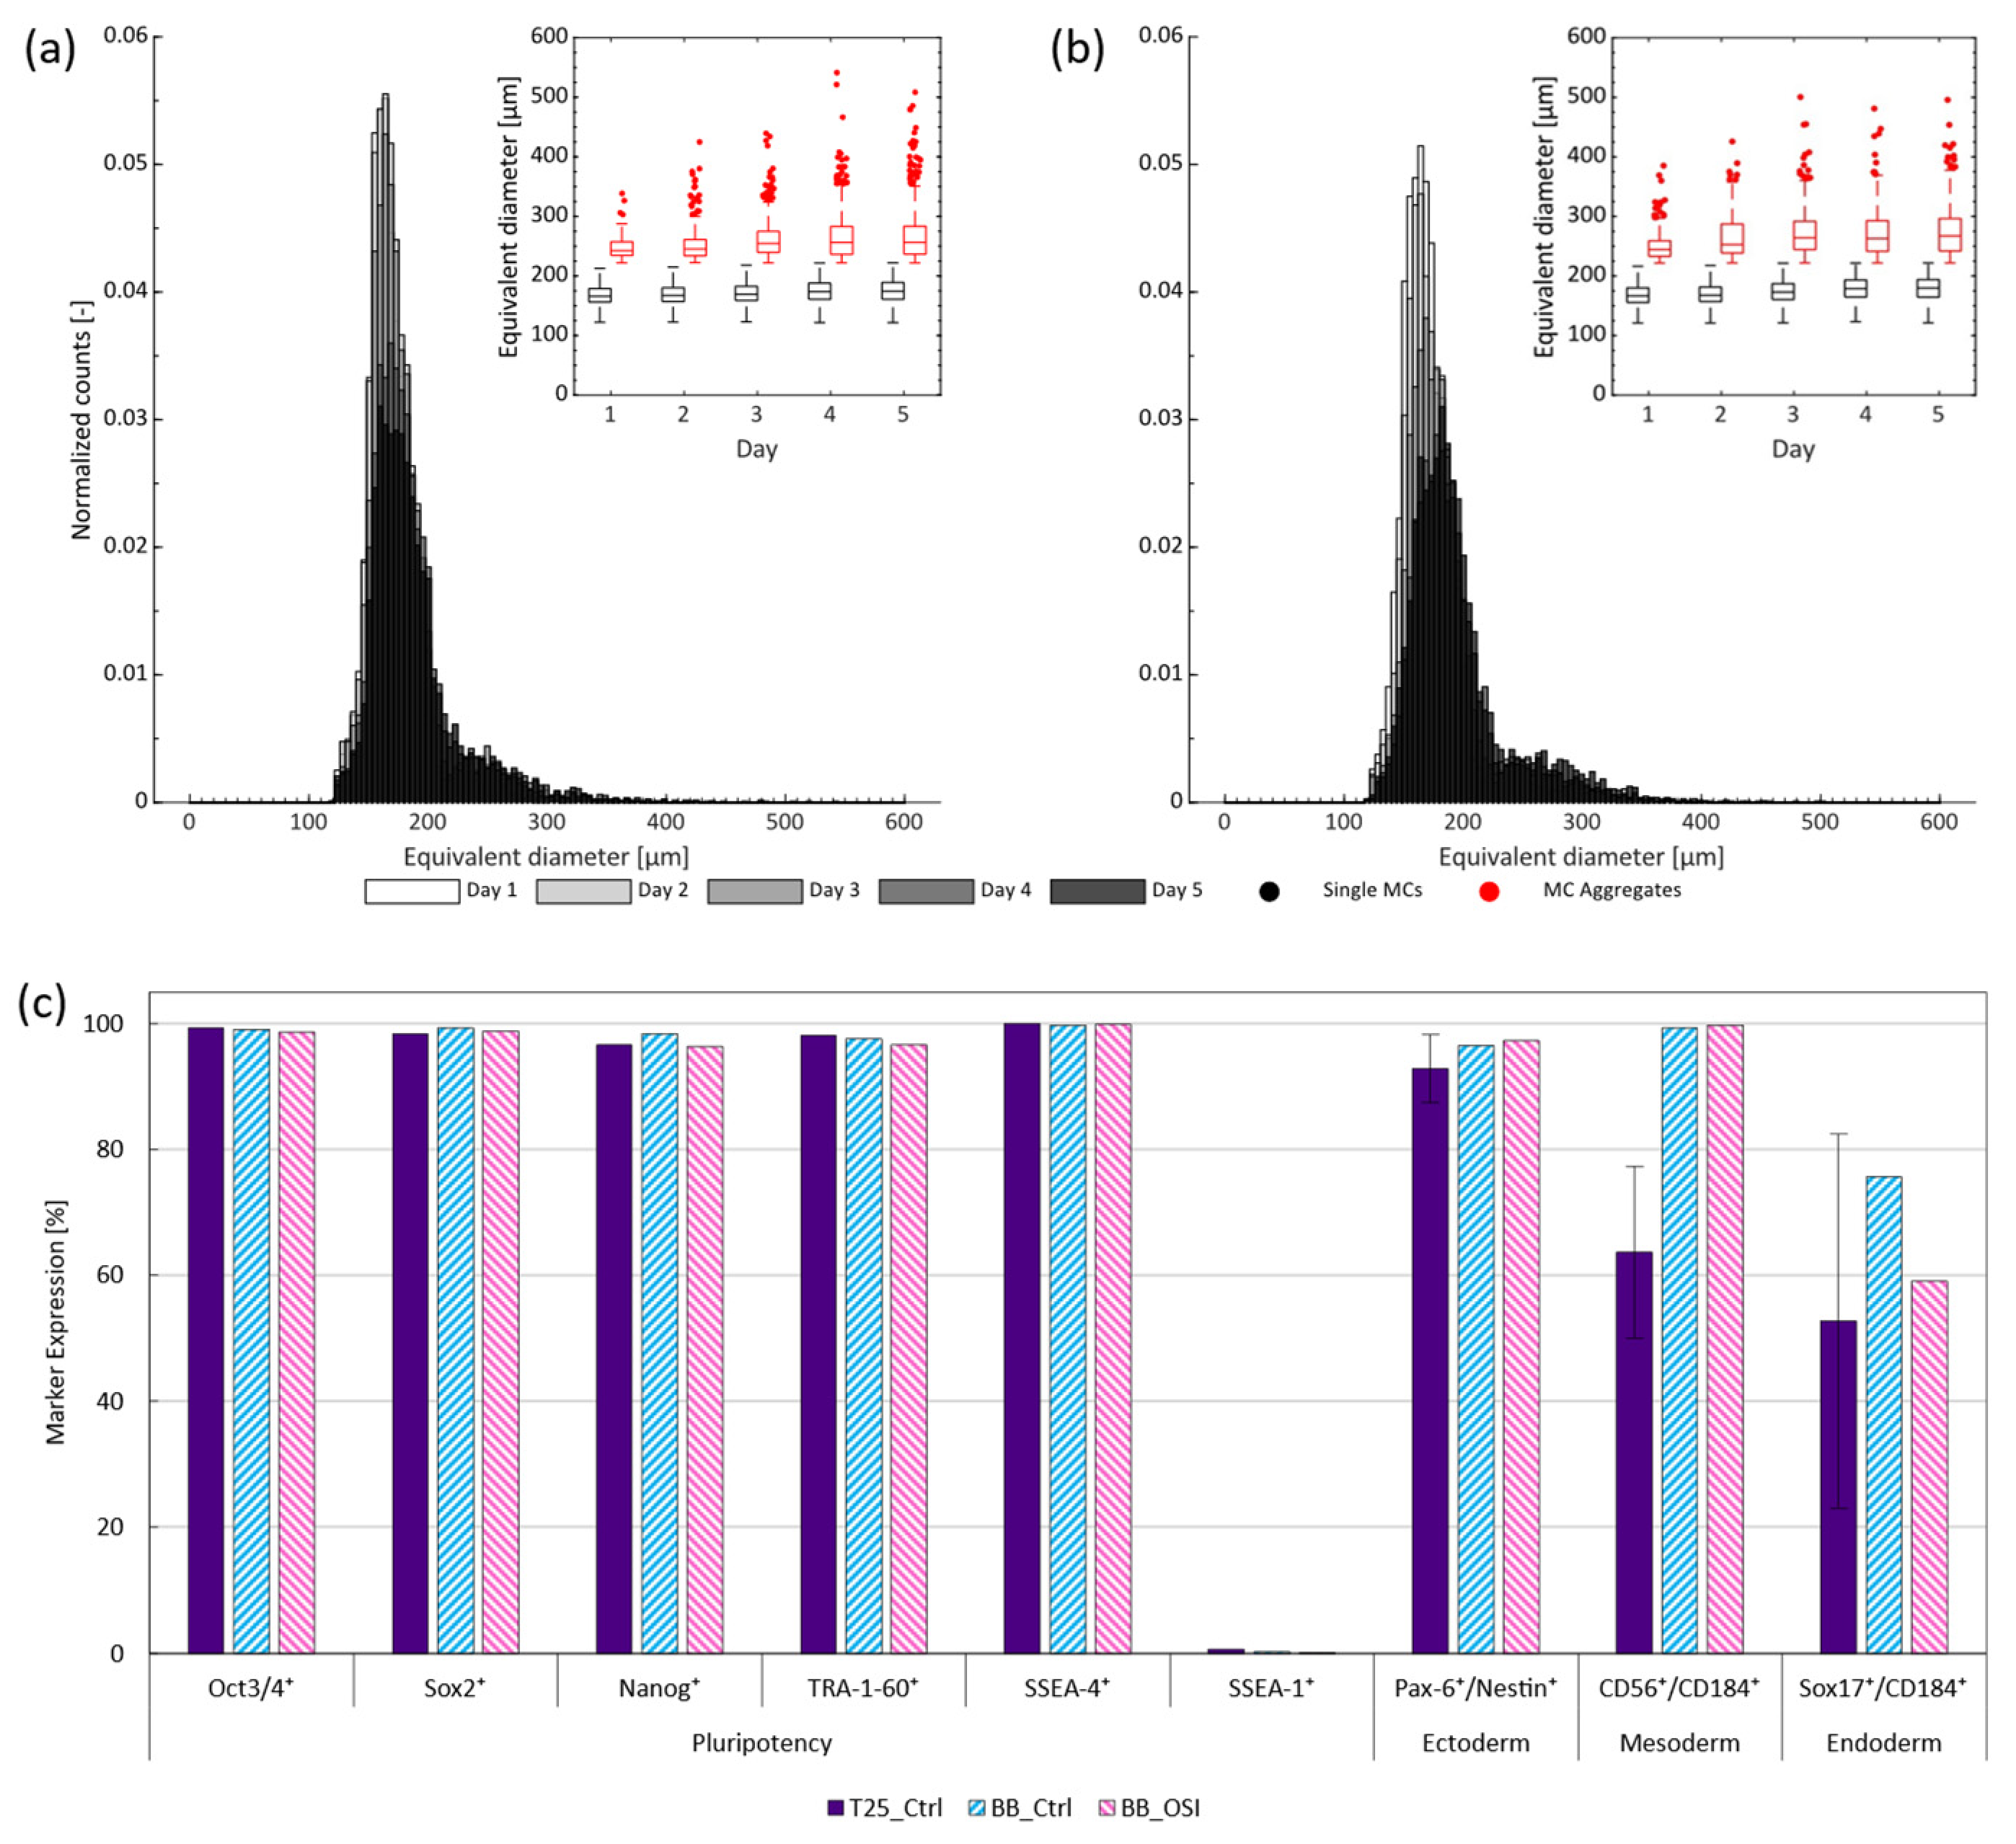
2.3. Microcarrier Aggregate Analysis

Analyses of the MC aggregates were conducted by centrifuging the fixed samples at 200 rcf for 2 min, after which the formalin was replaced with phosphate buffered saline (PBS) solution containing 0.3% Triton X-100 (Sigma-Aldrich, St. Louis, MO, USA) and 5 µg mL−1 4′,6-diamidino-2-phenylindole (Roche, Basel, Switzerland). The samples were incubated for 30 min at 25 °C in the dark, after which they were washed twice with PBS. Prior to imaging with the EVOS® FL 2 Auto, the stained MCs were embedded in a 3 g L−1 agarose gel. Attention was given to restrict MC weight to <5 mg per sample to ensure adequate distribution within 6-well plate. Post-image processing was performed using MATLAB R2022a (MathWorks, Natick, MA, USA). Non-spherical MC aggregate diameters were calculated by assuming perfect circularity, while cell distribution on day i or C D i (%) was calculated as the ratio between the number of inhabited or M C i n h a b i t e d and total MCs or M C t o t a l . Finally, the rate of change in cell distribution or C D ˙ was calculated by observing changes to cell distribution over time.
C D i = M C i n h a b i t e d , i M C t o t a l , i
C D ˙ = C D i + 1 C D i t i + 1 t i

2.4. Analysis of Cell Quality and Potency

The quality of the hiPSCs prior to inoculation and following harvest was determined by quantifying the expression of the pluripotency markers Oct3/4, Sox2, Nanog, TRA-1-60, and SSEA-4, and the differentiation marker SSEA-1 in >1 × 10⁵ cells using the MACSQuant® 10 (Miltenyi Biotec, Bergisch Gladbach, Germany) flow cytometer (FCM) and suitable fluorophore-conjugated antibodies (Miltenyi Biotec, Bergisch Gladbach, DE and BioLegend, San Diego, CA, USA). In parallel, single cells were plated on rhVTN-coated TC-treated 6-well plates and brought to differentiate towards either an endo-, meso-, or ectodermal lineage over 5–7 d using the STEMdiff™ Trilineage Differentiation Kit (STEMCELL Technologies, Vancouver, BC, Canada) as recommended by the manufacturer. Successful differentiation was confirmed following single cell harvest, staining and FCM analysis of >1 × 10⁵ cells by quantifying markers typical for either endo- (Sox17+/CD184+), meso- (CD56+/CD184+), and ectodermal (Nestin+/Pax6+) tissue. For all intracellular markers, cells were treated with the Transcription Factor Staining Buffer Set (Miltenyi Biotec, Bergisch Gladbach, Germany) prior to staining.

2.5. Statistical Analysis

All experiments were performed in triplicate and values reported as means together with their standard deviations where applicable. Statistical analyses were performed with Prism 10 (Graphpad, La Jolla, CA, USA) and significance determined using one-way analysis of variance followed by Tukey’s honest significance post-test. Differences were considered statistically significant if p < 0.05 (*) and grouped as such.

3. Results and Discussion

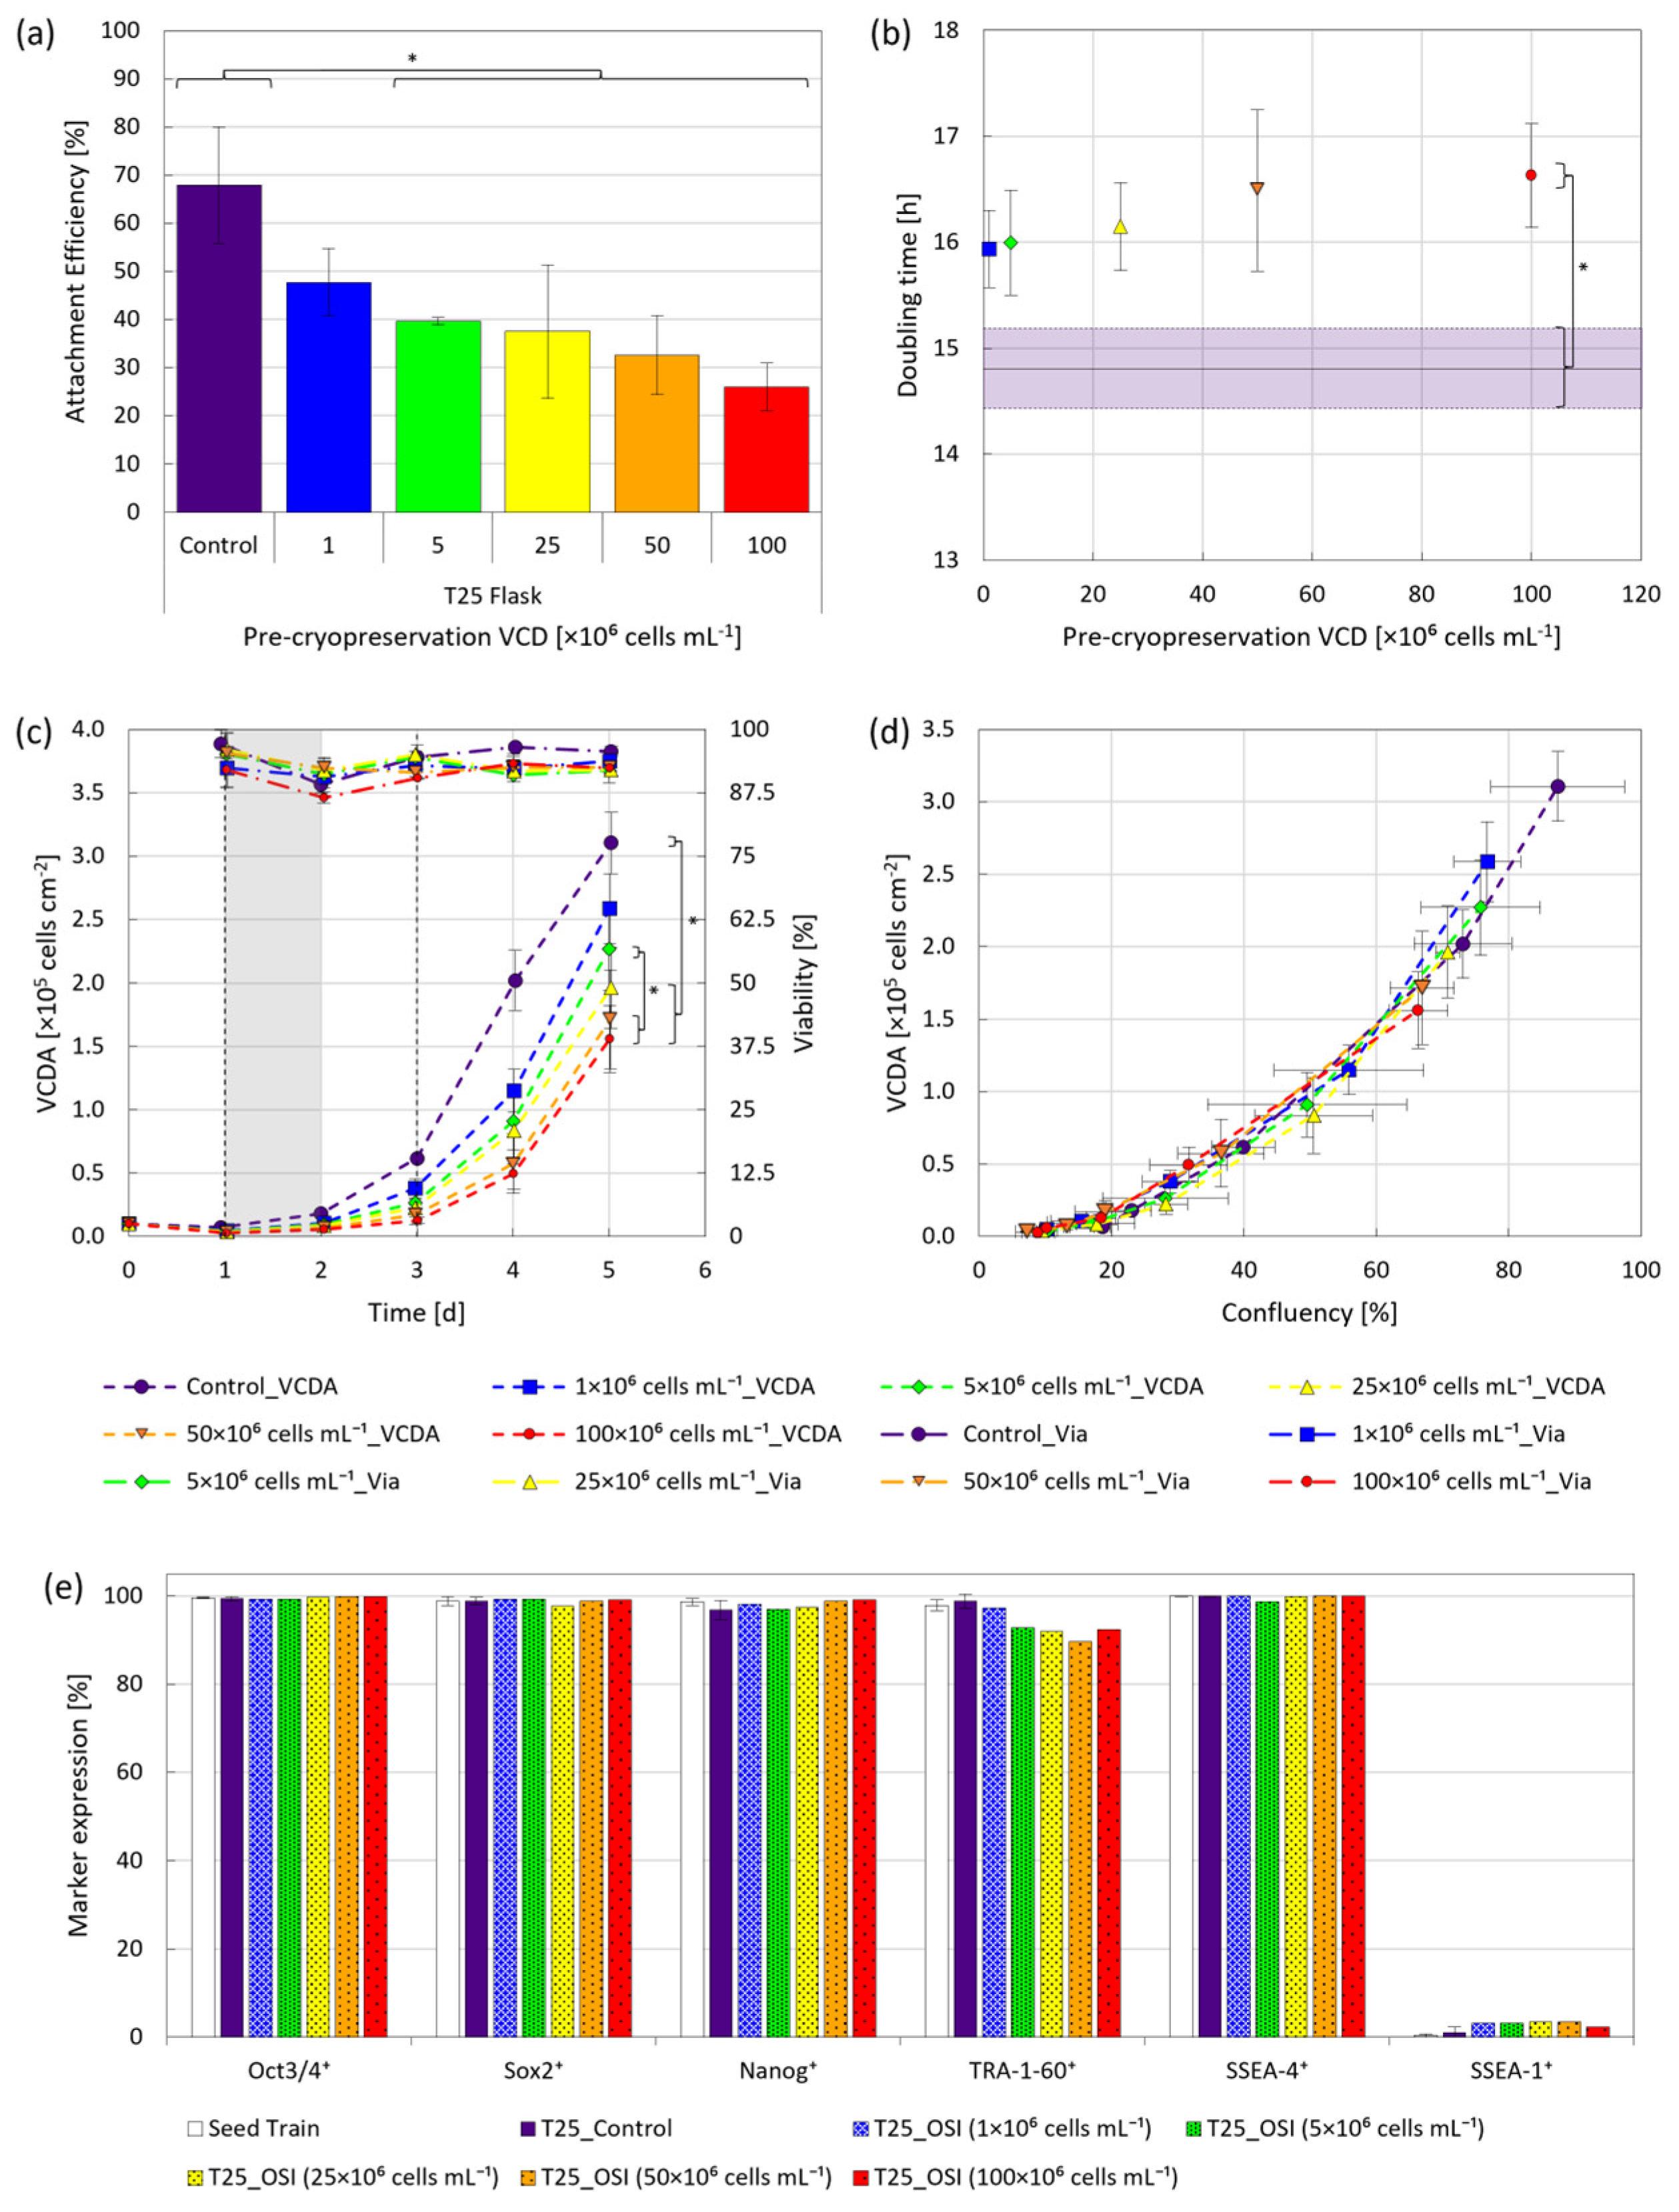
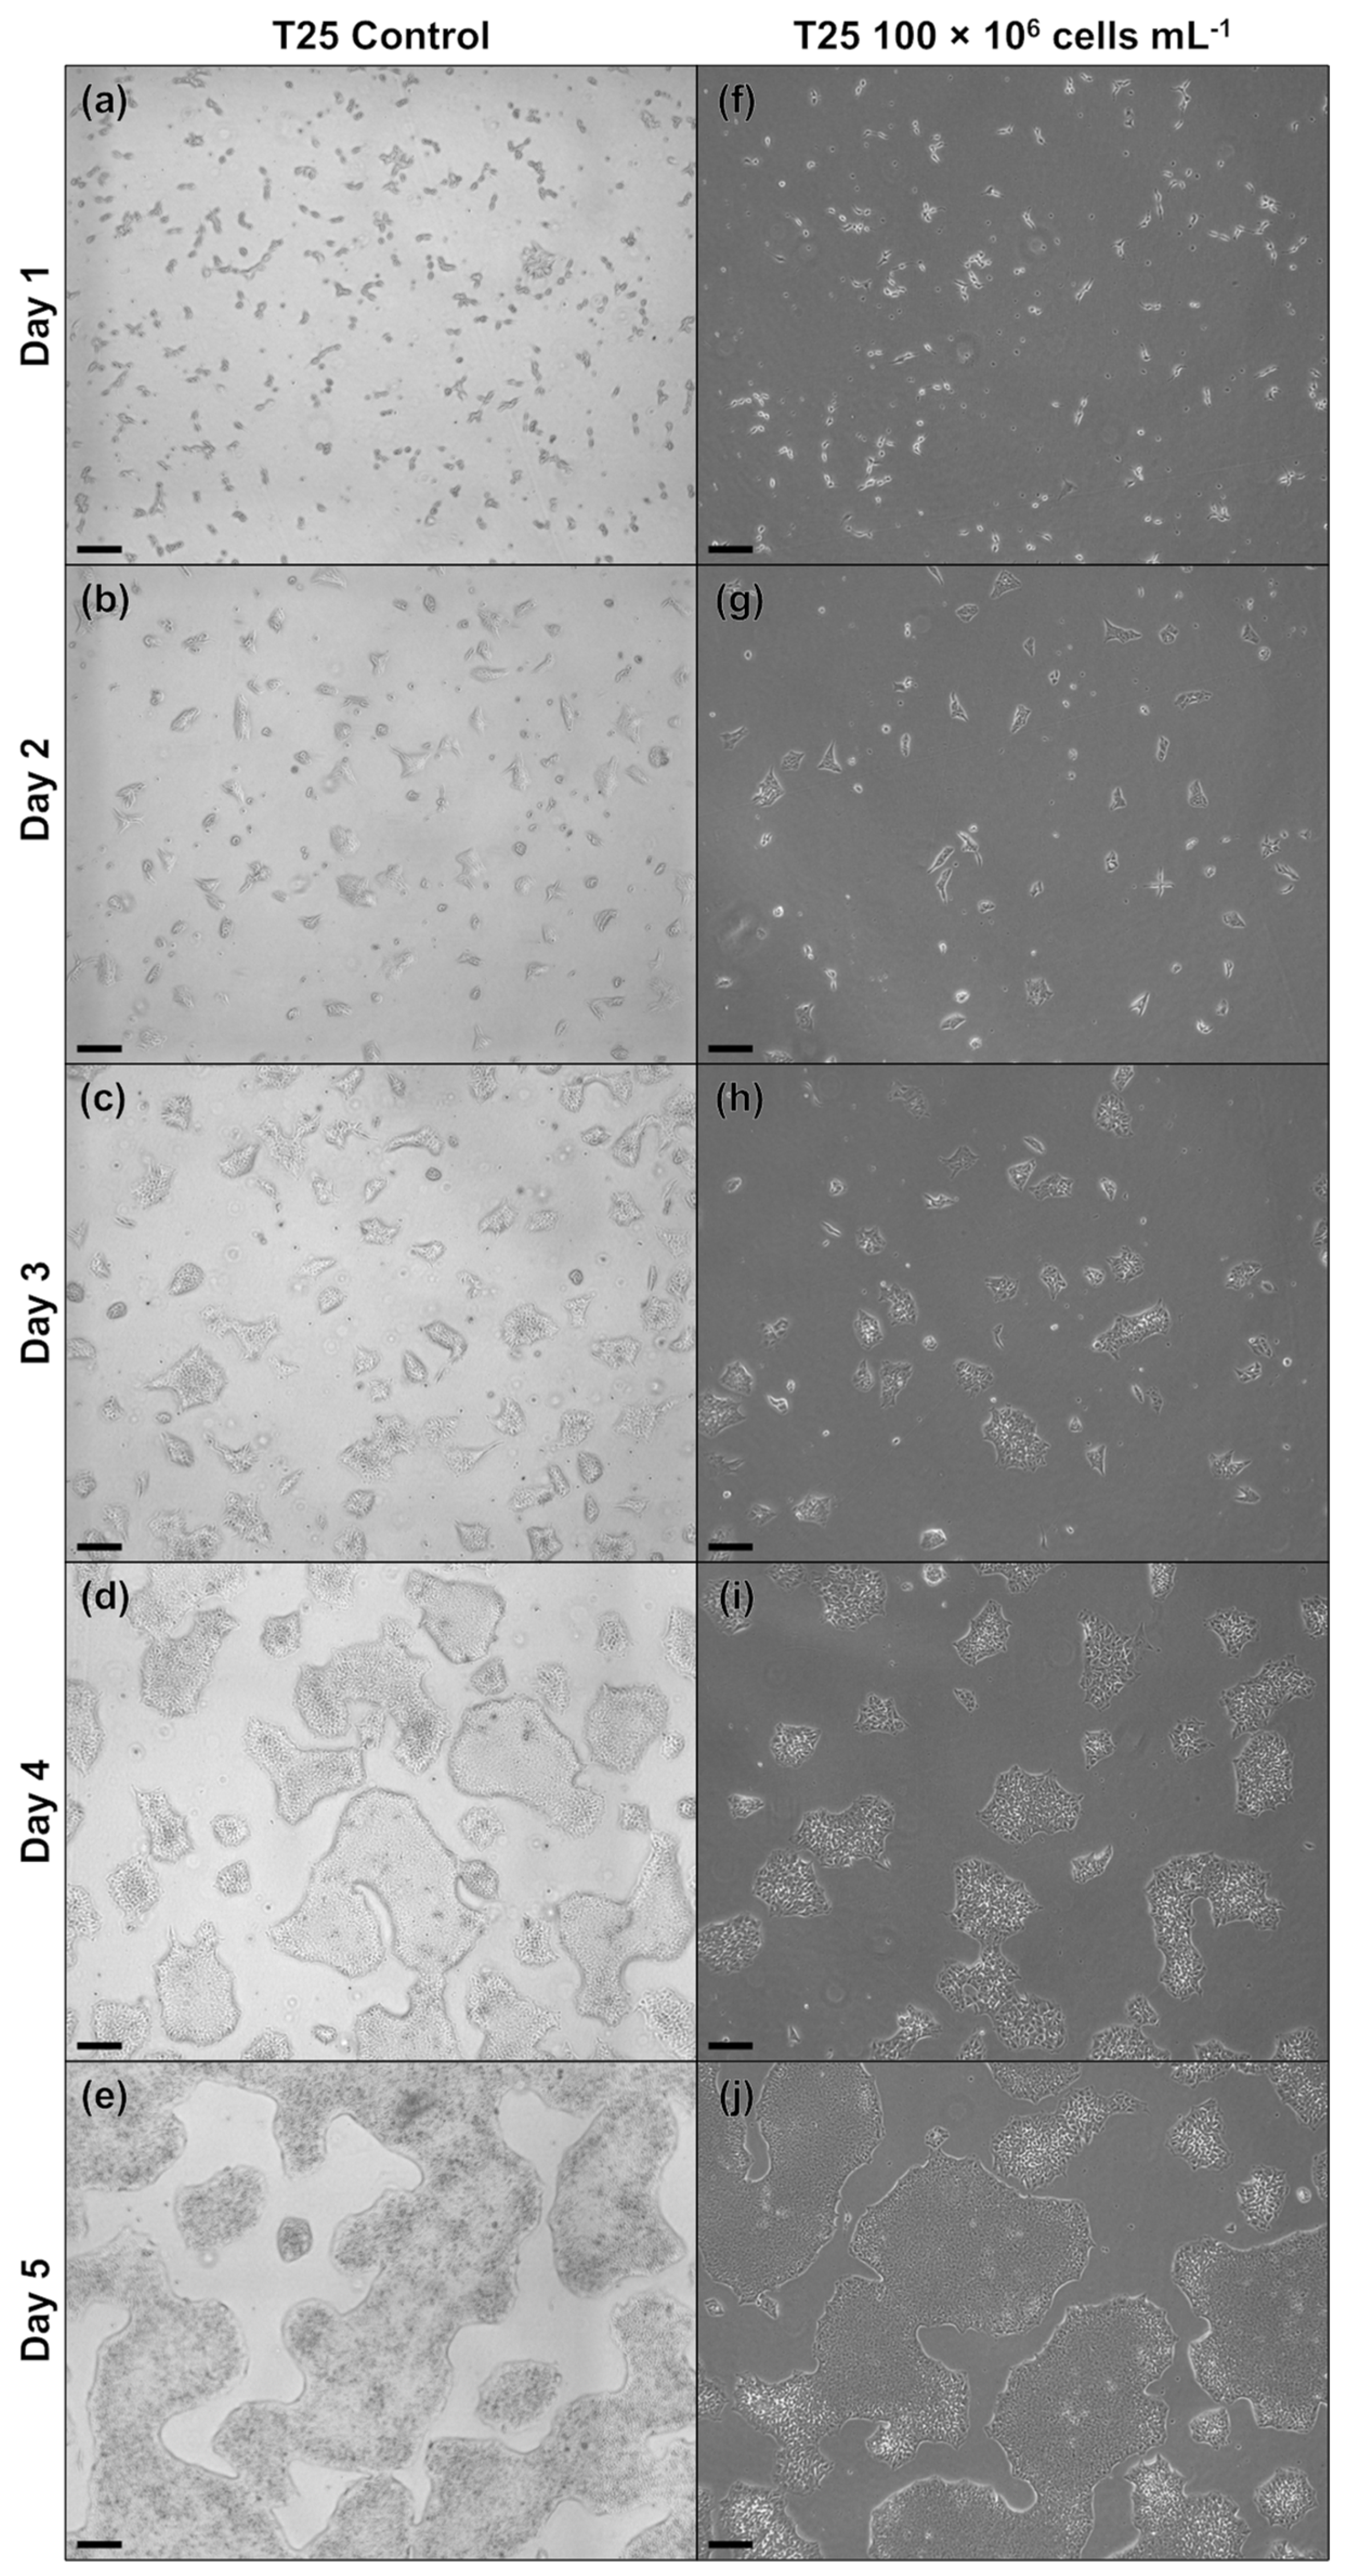
3.1. One-Step Inoculation under Static Conditions

The hiPSCs, frozen at up to five-fold higher viable cell densities (VCDs) than described by other authors [11,16], were characterized under static cultivation conditions for attachment, growth, viability, morphology and quality following replating. The results of the study clearly indicated a freezing density dependent impact on initial attachment efficiency, especially for VCDs ≥ 5 × 10⁶ cells mL−1 (Figure 2a). Yet despite the lower attachment efficiency (<50%), no discrepancies in doubling times for VCDs ≤ 25 × 106 cells mL−1 were apparent, plateauing around 16.5 h for VCDs ≥ 50 × 106 cells mL−1 (Figure 2b). Further examination of viability indicated that cells frozen away at VCDs ≤ 50 × 106 cells mL−1 typically recovered within 2 d following replating, coinciding with cell adaptation to the removal of RI (Figure 2c).
Consequently, the significant differences in viable cell density per area (VCDA) observed over the 5 d cultivation period were primarily the result of lower initial cell attachment, with the higher doubling times playing a secondary role if VCD during freezing exceeded 50 × 106 cells mL−1. A further comparison of VCDA and confluency (Figure 2d) showed no significant differences in the spatial requirements of the cells, regardless of treatment, however, fewer adherent cells were observed 1 d post-inoculation on the flask surfaces following OSI, as shown in the Appendix A (Figure A1). This led to both fewer and more isolated colonies following the removal of RI, confirming the observations made regarding attachment efficiency. Considering that the impact of cryopreservation on the biological function of pluripotent stem cells at VCDs of up to 25 × 106 cells mL−1 is well documented [11,16,30], the observed initial disparities in attachment and growth were deemed unsurprising.
While critical to achieving a cost-effective manufacturing process, in the context of cell therapeutics product yield assumes a subordinate role to product quality. It is therefore notable that, despite initial phenotypic differences between the OSI and control replicates, all tested conditions resulted in a >90% expression of relevant hiPSC markers 5 d post-inoculation (Figure 2e). This clearly surpasses the reported necessary minimum of 70% [31]. Furthermore, as SSEA-1 expression remained <4% in all cases, the occurrence of spontaneous differentiation was deemed to be negligible. Together, these findings support the argument that hiPSC expansion was possible following cryopreservation at densities of ≤100 × 106 cells mL−1 without noticeably affecting cell quality. To confirm whether these findings also applied to the cultivation of hiPSCs under stirred MC-operated conditions, a freezing density of 5 × 10⁶ cells mL−1 was selected for further study in the BioBLU® 0.3c SU bioreactor.

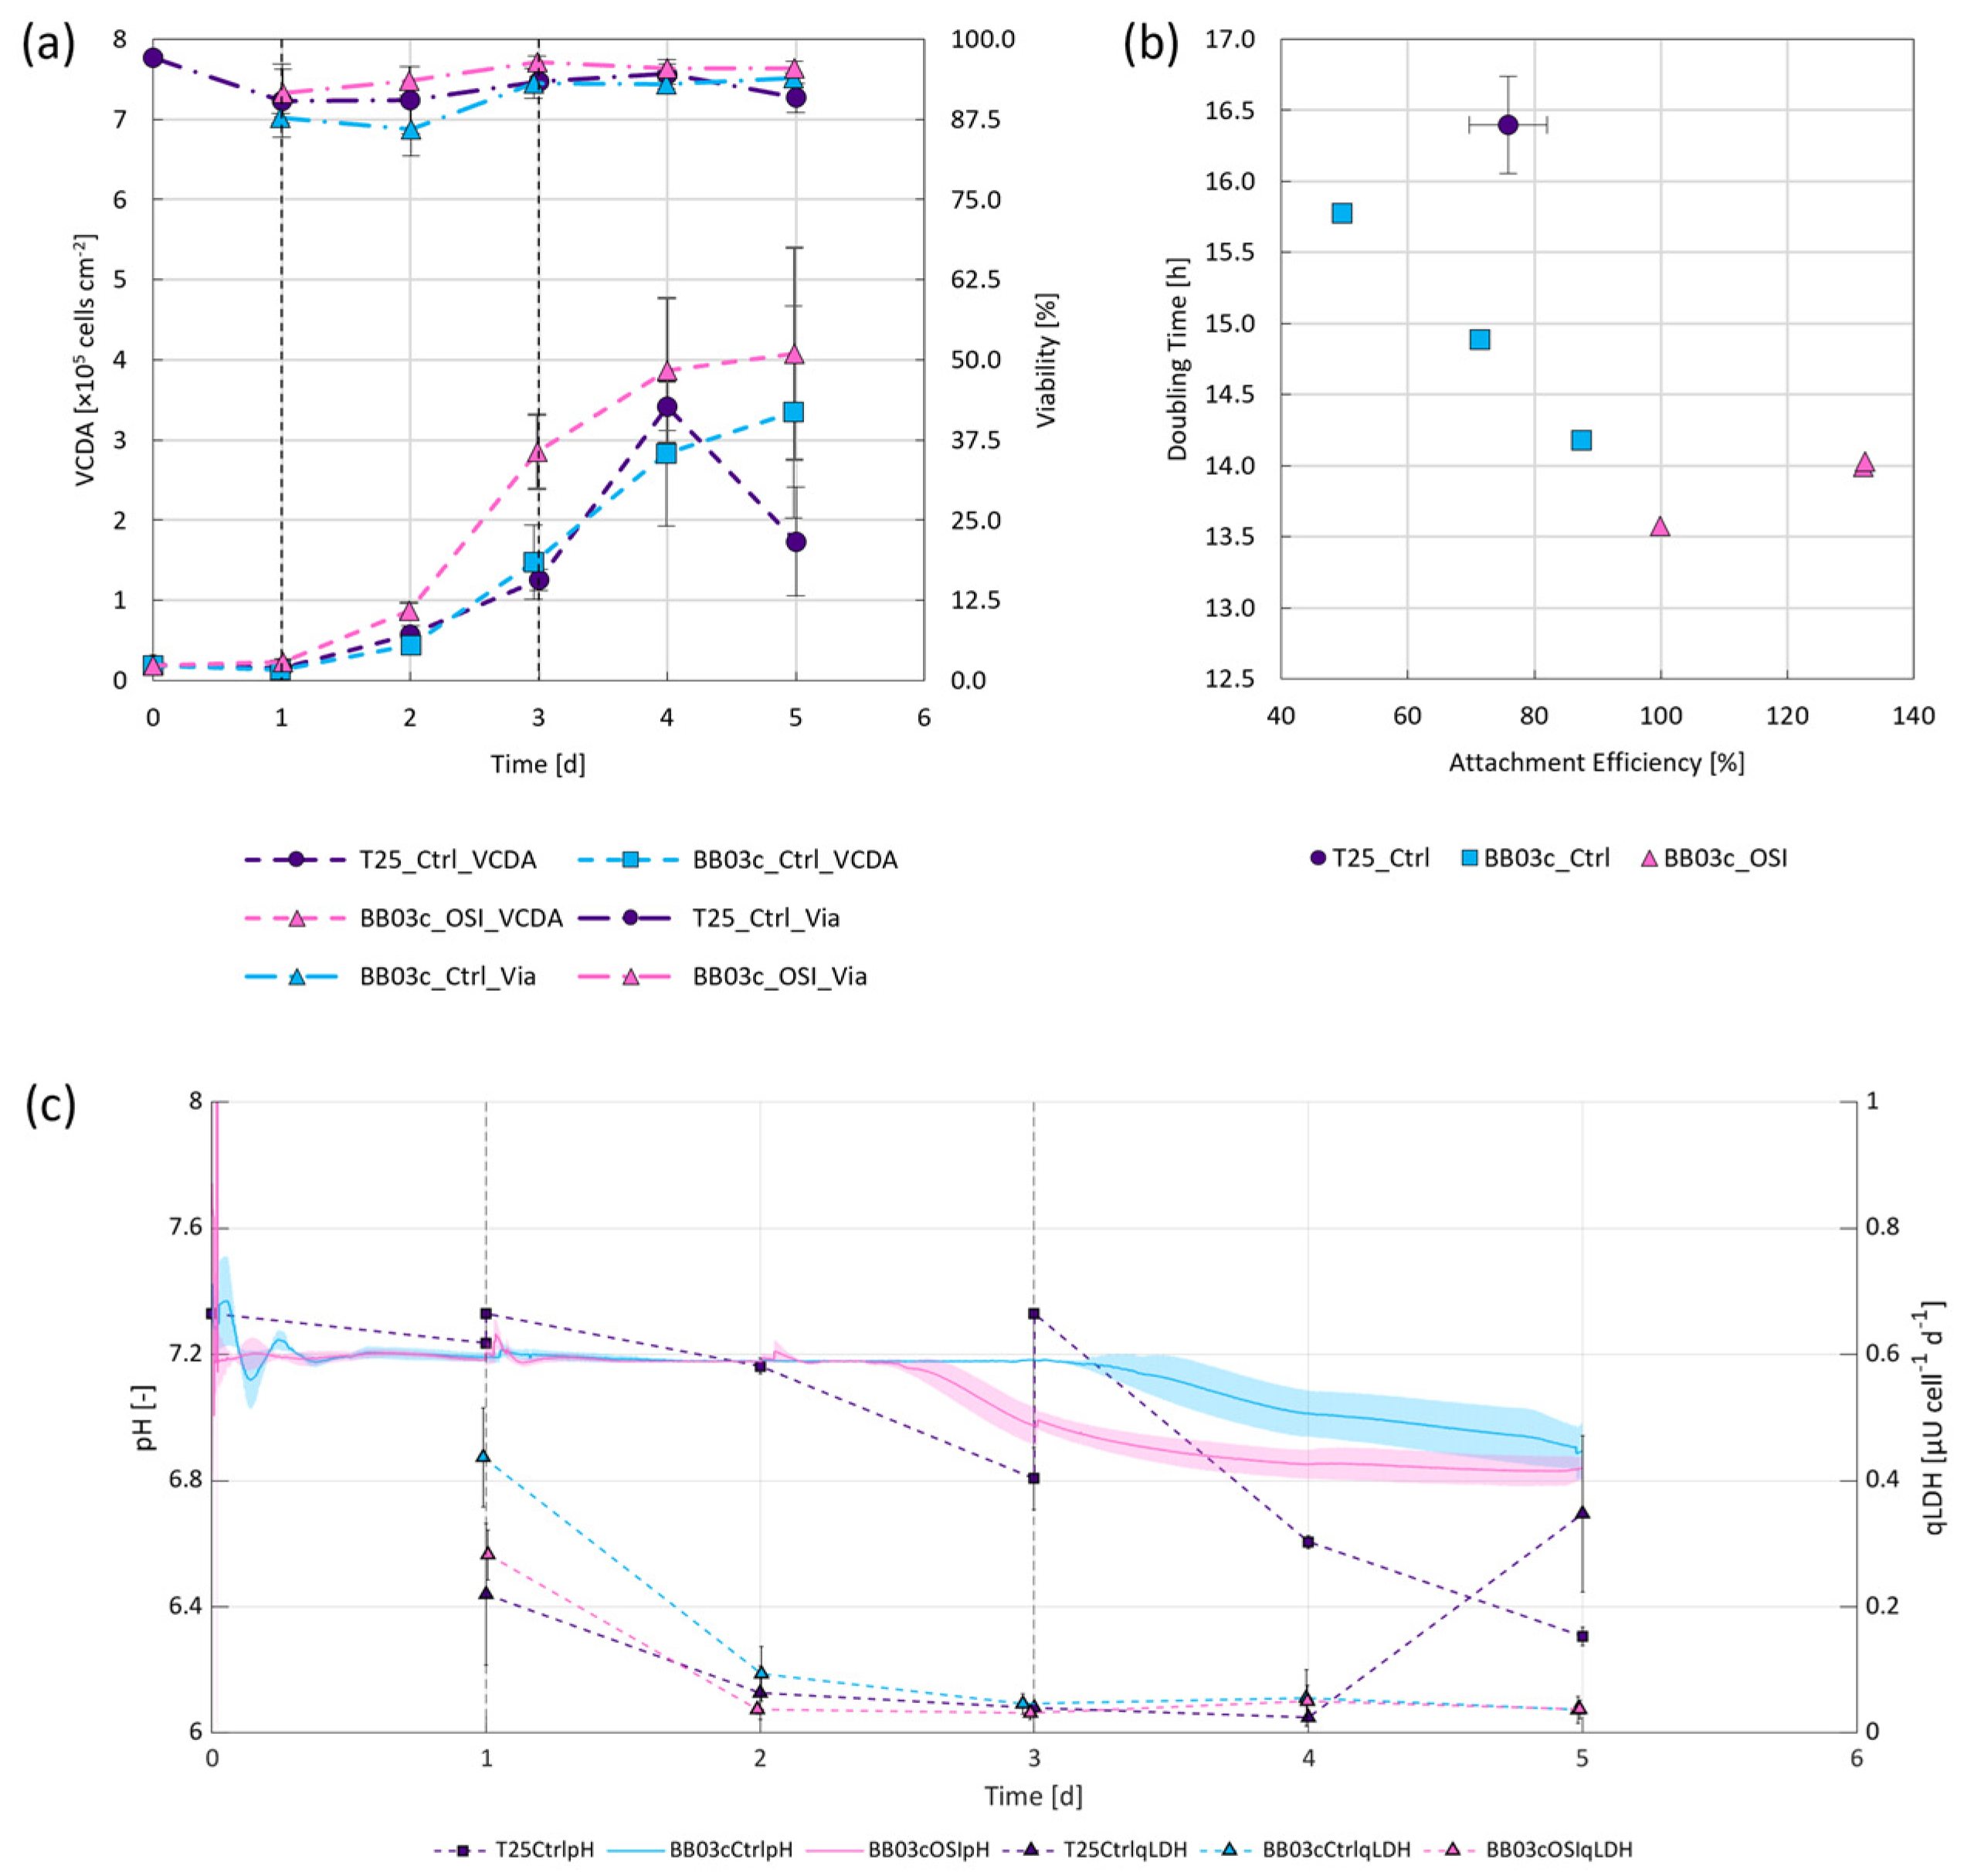
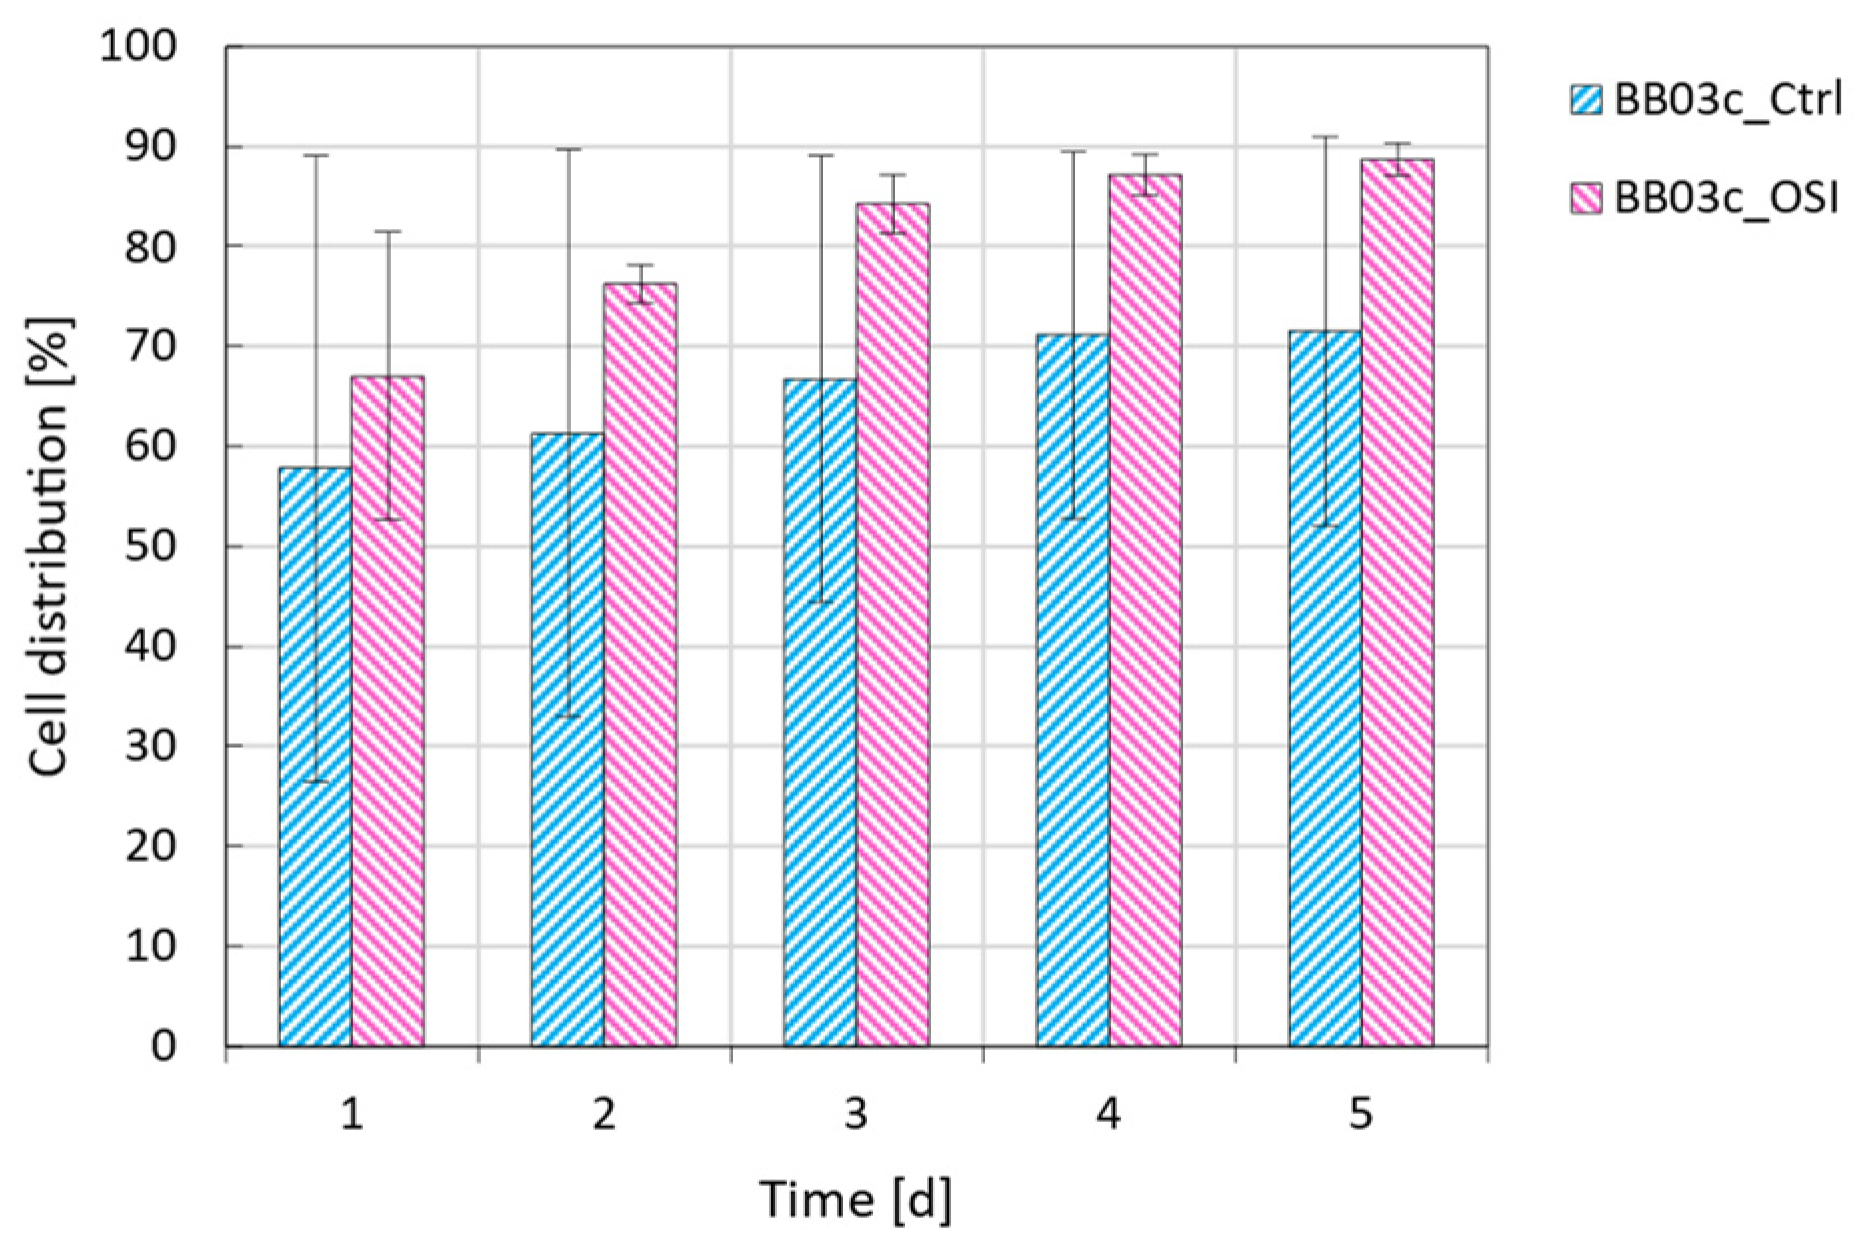
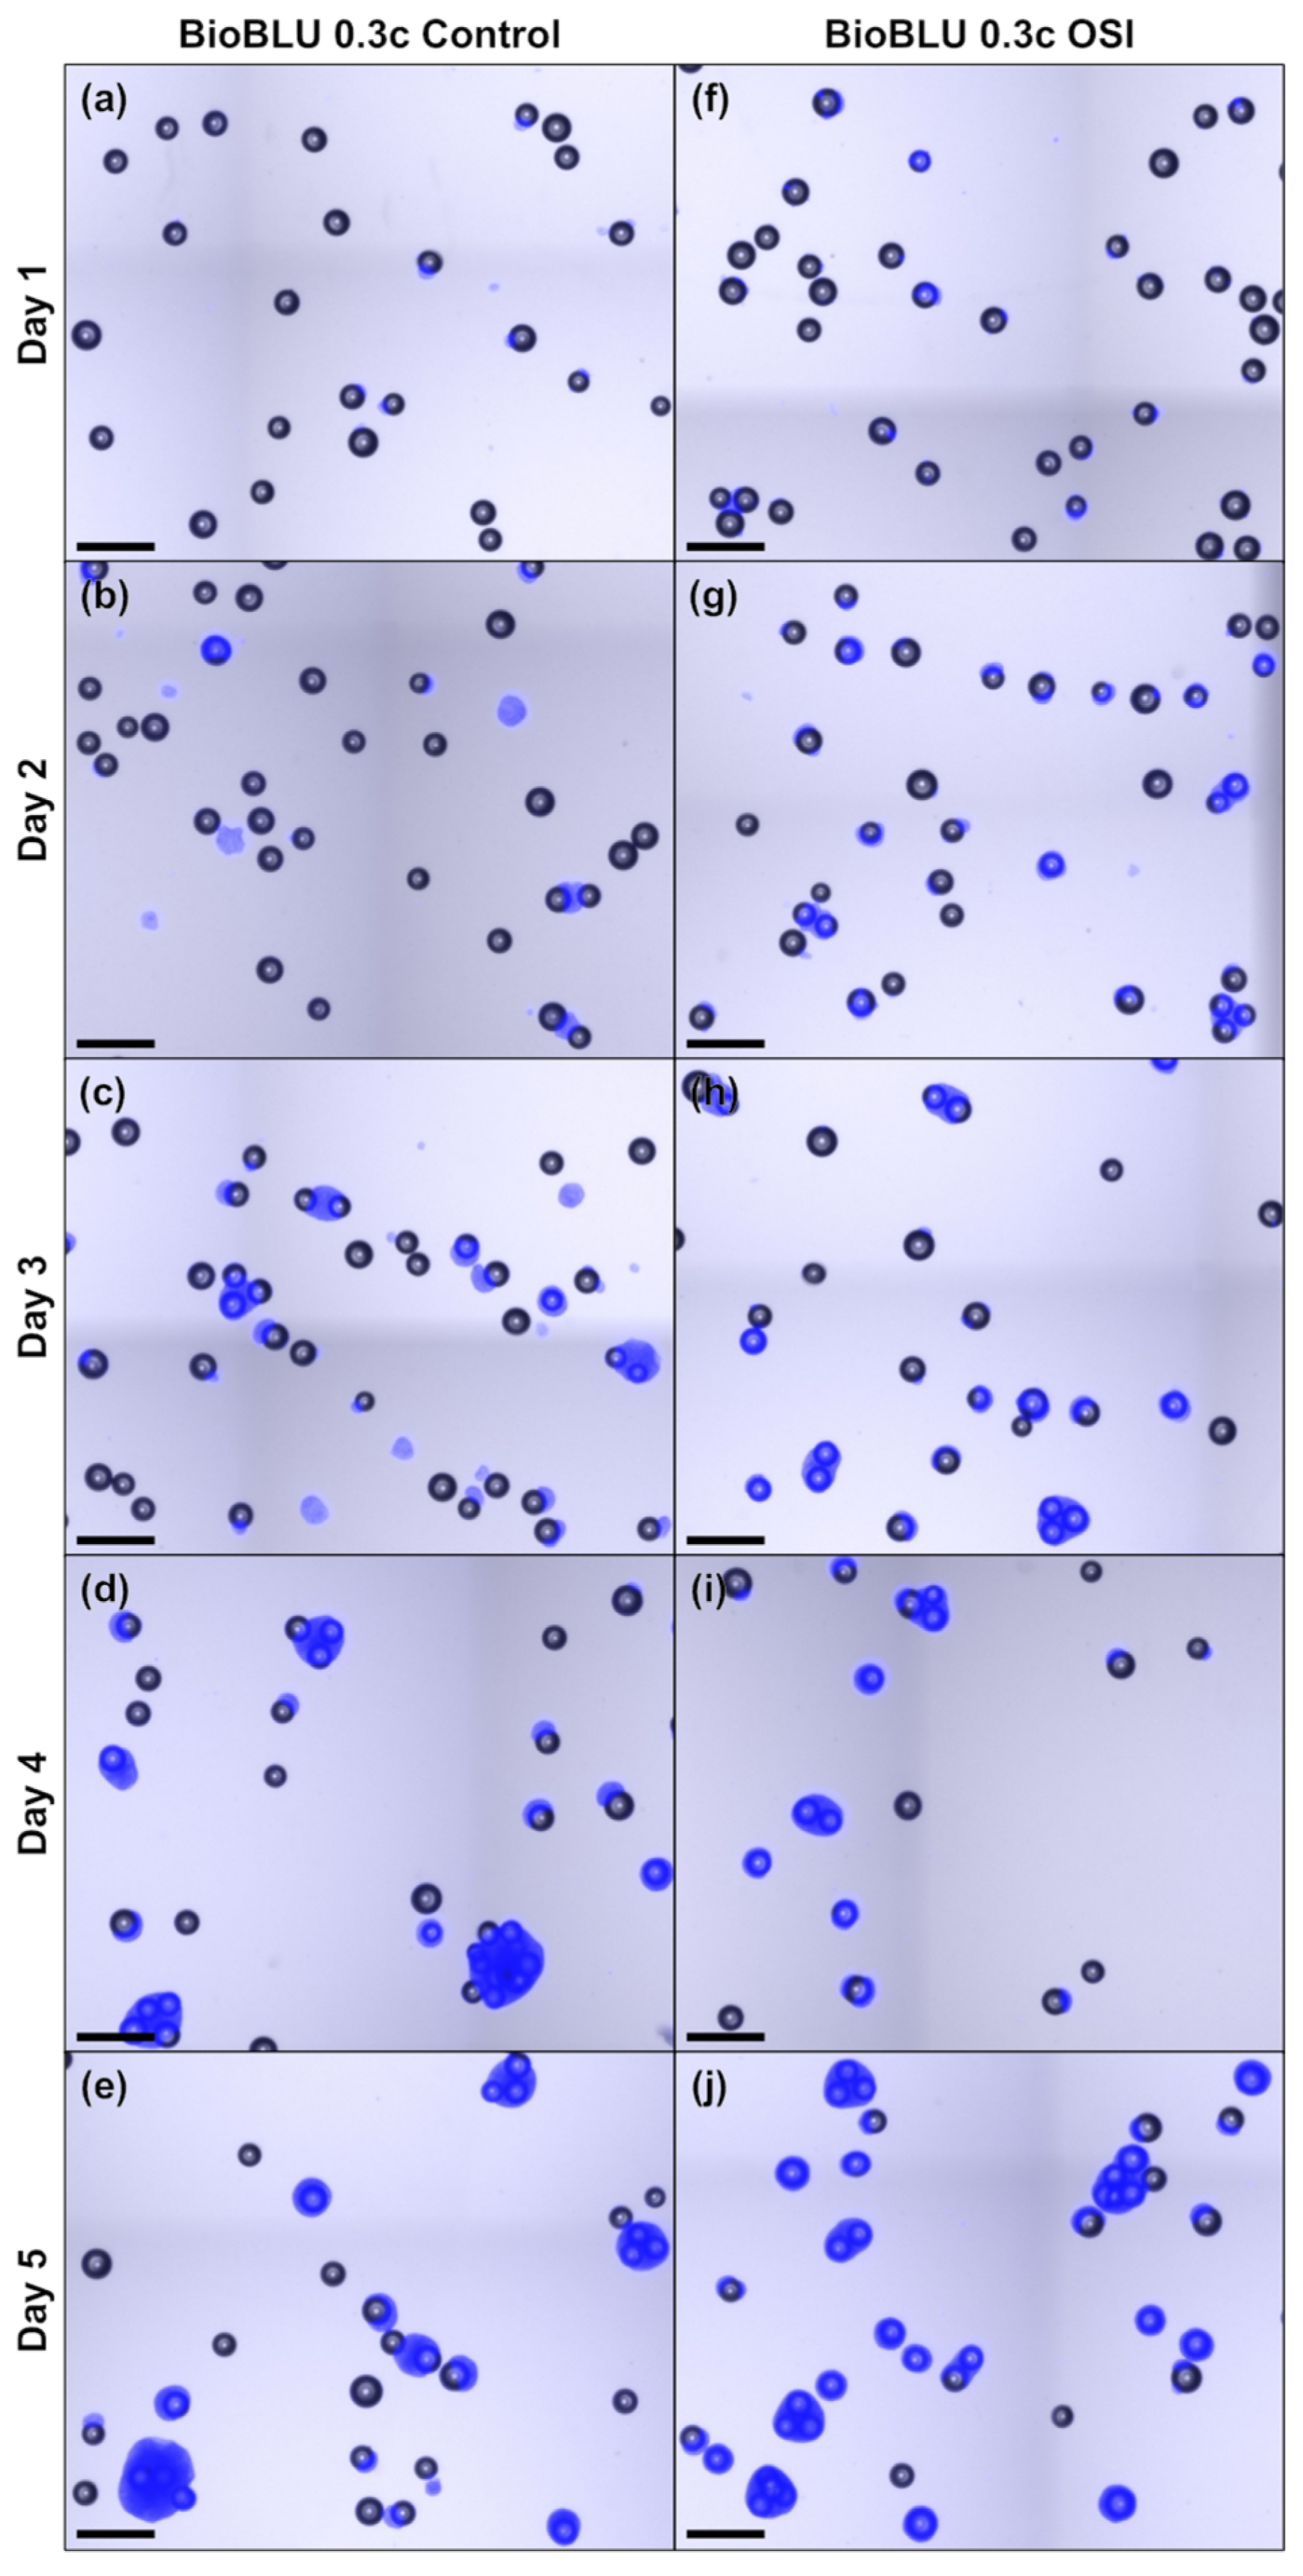
3.2. One-Step Inoculation of Microcarrier-Operated Stirred Bioreactors

It is widely accepted that static cultivation systems face challenges with regards to their scalability [9,32]. Hence, the compatibility of OSI in combination with a more scalable approach to hiPSC expansion under stirred conditions was evaluated, namely by using spherical Synthemax II coated MCs with a diameter of 125–212 µm and a rigid polystyrene backbone. A comparison of the growth-dependent parameters between the results obtained from the OSI and control BioBLU® cultivations revealed that OSI under stirred conditions improved attachment efficiency (≈50%) and led to slightly better cell distribution on the MCs (≈10%) within the first 24 h following inoculation (Table 1). Considering the reported correlation between attachment efficiency and expansion factor when cultivating pluripotent stem cells on MCs [33], it is unsurprising that this development consistently led to comparable or higher cell densities (≈100%), viabilities (≈8%) and doubling times (≈7%) over the first 2–3 d (Figure 3a,b). OSI also appeared to improve cell survivability within the BioBLU® systems during and following the attachment phase, as substantiated by the lower cell specific LDH activities (≈35%) as shown in Figure 3c.
When evaluating doubling time in dependence of attachment efficiency, it was observed that cell growth improved by up to 15% when cultivating the hiPSCs under stirred instead of static conditions, independent of initial attachment (Figure 3b). More remarkably, it was observed that OSI in combination with MCs improved both attachment efficiency and doubling time under stirred conditions when compared to routine passaging. These findings may be attributed to two important differences between trial conditions. Firstly, superior process control. Given that only the BioBLU® trials were actively regulated to a DO of 40% and pH of 7.2, while mechanically stirred with a specific power input ideally suited for the expansion of hiPSCs (≈1 W m−3) [34], it is conceivable to expect better growth in these systems. Secondly, the choice of scaffold coating. A study by Badenes et al. [35], showed no significant differences between hiPSC growth kinetics between Synthemax II or rhVTN-coated scaffolds under static conditions. The impact of the coating was therefore considered negligible in this instance. Taken together, the findings not only indicate that OSI increased cell attachment and distribution (Table 1), but also led to comparable or superior doubling times (≈14 h) and therefore a ≈94% improvement to VCDA after 3 d (Figure 3a,b). As illustrated in more detail in the Appendix A (Figure A2), during this time the change in cell distribution, or the number of inhabited MCs, increased at a rate of ≈4.5% d−1 and ≈8.6% d−1 for the control and OSI BioBLU® replicates, respectively, further substantiating our observations.
Towards the end of the exponential growth phase, pH dropped below 7.0 (Figure 3c), leading to decreased cell growth within the instrumented stirred bioreactors and pH-mediated cell death within the non-instrumented static controls. This implies that the cultivation results observed within the first 3 d may further be improved through base addition or perfusion rates >1 vvd, as described elsewhere [10,12]. However, while medium remains a cost driver for such processes [36], care must be taken to identify appropriate CSPRs prior to scale-up. As reported by Bausch et al. [29], C S P R a p p should ideally be equivalent to C S P R c r i t and slightly greater than C S P R m i n when accounting for R . Given this relationship, it is worth mentioning that the metabolic requirements of cells have been shown to change over time depending on biological cell function and the prevailing cultivation conditions [19]. The more quiescent the cells, the lower the metabolic needs [37] and, therefore, the lower C S P R m i n . Alongside the variations in cell specific metabolic requirements, C S P R m i n also depends on the nutrient composition of the cultivation medium which may vary from process to process. Current peer reviewed literature reports C S P R a p p of between 111–715 pL cells−1 d−1 to be sufficient for maintaining hiPSC growth and quality [10,12]. Our findings indicated that while C S P R a p p of between 510–13,100 pL cell−1 d−1 were used, a Gln dependent C S P R m i n of 1050 ± 180 pL cell−1 d−1 was necessary to maintain exponential cell growth following OSI, when using E8F and while ensuring adequate pH control. Such CSPRs permitted expansion factors of 21 ± 5 and cell densities of 1.39 ± 0.33 × 10⁶ cells mL−1 within 4 d, improving on the findings reported for comparable cultivations by Pandey et al. [12].
Recent studies with hiPSCs have suggested that non-uniform cell-cell aggregation or spheroid formation may lead to poor cell quality and impede efficient cultivation, especially when spheroid diameters exceed 400 µm [9,36,38]. To improve process homogeneity, Meiser et al. [16] proposed using OSI, as this was shown to restrict cell aggregation within the first day of cultivation and led to more uniform spheroid size distributions. To observe whether similar effects could be observed when working with MCs, microscopic monitoring of the stirred cultivations was performed over a 5 d period (Figure A3). Analysis of the images highlighted that while the hiPSCs subjected to routine passaging produced both spheroids and cell-MC aggregates, hiPSCs subjected to OSI primarily produced cell-MC aggregates. This is remarkable, as restricting spheroid formation and size facilitates subsequent cell harvest, as suggested by Petry and Salzig [38].
Further post-processing of the images emphasized that, regardless of treatment, most MCs did not aggregate to larger structures (Figure 4a,b). However, those that did formed small clusters of 2–3 MCs within the first few days which later gave rise to larger clusters with equivalent diameters of >400 µm towards the end of cultivation. Closer inspection of these clusters revealed the preferential formation of more open structures (Figure A3), as proposed by Ornelas-González et al. [39] for rigid spherical MCs types. This effectively minimized diffusive distances and, thus, reduced the likelihood of a necrotic core and impact to cell quality, as has been demonstrated for spheroids with similar diameters [40]. To substantiate this claim, cell quality was again evaluated to determine the prevalence of typical pluripotency markers following cell harvest on day 5 (Figure 4c). Again, all pluripotency markers exceeded the reported necessary minimum [31] with >95% expression, while SSEA-1 expression could be kept to <1% in all cases. In parallel, tri-lineage differentiation potential, often referred to as potency in the context of hiPSCs, was confirmed by differentiating the harvested cells towards all three germ layers. In all cases, germ line specific marker expression of the one-step inoculated stirred trials were either comparable or superior to the routinely passaged static T-flask and dynamic stirred controls when quantified by FCM. Together, these findings suggest that OSI is compliant with the quality guidelines associated with hiPSC cultivation [31] and, furthermore, is suited for use with stirred SU bioreactors operated with MCs.

4. Conclusions

In closing, it could be demonstrated that the slow-rate freezing of hiPSCs in concentrations of up to 100 × 106 cells mL−1 using CryoStor® CS10 was possible without significant impact to growth or pluripotency following replating. Care should however be taken to account for freezing density dependent changes to attachment efficiency, which may invariably delay the expansion process. When applied to the stirred BioBLU® cultivation system operated with MCs and in perfusion mode, it was demonstrated that the OSI of hiPSCs improved overall attachment efficiency and cell distribution on MCs within the first day by ≈50% and ≈10%, respectively. OSI also improved cell-MC aggregation, restricting the undesirable formation of spheroids. Moreover, OSI was shown to increase cell survivability, as substantiated by a ≈35% lower cell specific LDH activity in the supernatant post-attachment. This allowed for a ≈90% faster change in cell distribution on the MCs and comparable doubling times (≈7%) during the exponential growth phase, with no discernible impact to hiPSC viability, pluripotency, or trilineage differentiation potential. Given that hiPSCs must be differentiated towards a specific tissue prior to their application, this study highlights the advantages of OSI in shortening the seed train duration when producing hiPSC-based therapeutics in clinically relevant numbers. Consequently, the process development work outlined in this manuscript establishes a crucial foundation for the future transfer of this intensified approach to L-scale.

Author Contributions

Conceptualization: M.A.T. and R.E.; Methodology: M.A.T. and S.L.S.; Software: M.A.T. and S.L.S.; Validation: M.A.T. and S.L.S.; Formal analysis: M.A.T.; Investigation: M.A.T.; Resources: M.A.T.; Data curation: M.A.T.; Writing—original draft preparation: M.A.T.; Writing—review and editing: S.L.S., R.E. and D.E.; Funding acquisition: D.E. and R.E.; Visualization: M.A.T.; Supervision: R.E.; Project administration: D.E. and R.E. All authors have read and agreed to the published version of the manuscript.

Funding

This research has received no external funding.

Data Availability Statement

The datasets generated and/or analyzed during the current study, as well as the code used, are available from the corresponding authors upon reasonable request.

Conflicts of Interest

The authors declare no competing interests.

Appendix A

The impact of OSI on cell morphology is readily discussed in the results and discussion section. To substantiate these claims, microscopic images depicting the described observations are shown in Figure A1.
Figure A1. Microscopic images of hiPSCs cultivated in T25 flasks either directly after routine passaging (ae) or following cryopreservation at a cell density of 100 × 106 cells mL−1 and replating (fj). The scale bar in the lower left corner corresponds to 200 µm.
Processes 12 00426 g0a1
The claims in the results and discussion section that OSI improves cell distribution and its rate of change during cultivation, as well as that MCs with rigid backbones allow for the formation of more open structures are further illustrated and substantiated with Figure A2 and Figure A3.
Figure A2. The change in cell distribution on the MCs as observed for the MC-operated cultivations under stirred conditions following routine passaging (blue) or OSI (pink).
Processes 12 00426 g0a2
Figure A3. Microscopic images of treated MC aggregates sampled daily during the MC-operated cultivation of hiPSCs under stirred conditions following either routine passaging (ae) or OSI (fj). The scale bar in the lower left corner corresponds to 500 µm.
Processes 12 00426 g0a3

References

  1. Inoue, M.; Yamaguchi, R.; He, C.C.J.; Ikeda, A.; Okano, H.; Kohyama, J. Current Status and Prospects of Regenerative Medicine for Spinal Cord Injury Using Human Induced Pluripotent Stem Cells: A Review. Stem Cell Investig. 2023, 10, 6. [Google Scholar] [CrossRef]
  2. Tomasik, J.; Jasiński, M.; Basak, G.W. Next Generations of CAR-T Cells—New Therapeutic Opportunities in Hematology? Front. Immunol. 2022, 13, 1034707. [Google Scholar] [CrossRef]
  3. Li, Y.; Hao, J.; Hu, Z.; Yang, Y.-G.; Zhou, Q.; Sun, L.; Wu, J. Current Status of Clinical Trials Assessing Mesenchymal Stem Cell Therapy for Graft versus Host Disease: A Systematic Review. Stem Cell Res. Ther. 2022, 13, 93. [Google Scholar] [CrossRef]
  4. Scibona, E.; Morbidelli, M. Expansion Processes for Cell-Based Therapies. Biotechnol. Adv. 2019, 37, 107455. [Google Scholar] [CrossRef]
  5. Hogrebe, N.J.; Maxwell, K.G.; Augsornworawat, P.; Millman, J.R. Generation of Insulin-Producing Pancreatic β Cells from Multiple Human Stem Cell Lines. Nat. Protoc. 2021, 16, 4109–4143. [Google Scholar] [CrossRef]
  6. Gunhanlar, N.; Shpak, G.; Van Der Kroeg, M.; Gouty-Colomer, L.A.; Munshi, S.T.; Lendemeijer, B.; Ghazvini, M.; Dupont, C.; Hoogendijk, W.J.G.; Gribnau, J.; et al. A Simplified Protocol for Differentiation of Electrophysiologically Mature Neuronal Networks from Human Induced Pluripotent Stem Cells. Mol. Psychiatry 2018, 23, 1336–1344. [Google Scholar] [CrossRef]
  7. Weed, L.S.; Mills, J.A. Strategies for Retinal Cell Generation from Human Pluripotent Stem Cells. Stem Cell Investig. 2017, 4, 65. [Google Scholar] [CrossRef]
  8. Laco, F.; Lam, A.T.-L.; Woo, T.-L.; Tong, G.; Ho, V.; Soong, P.-L.; Grishina, E.; Lin, K.-H.; Reuveny, S.; Oh, S.K.-W. Selection of Human Induced Pluripotent Stem Cells Lines Optimization of Cardiomyocytes Differentiation in an Integrated Suspension Microcarrier Bioreactor. Stem Cell Res. Ther. 2020, 11, 118. [Google Scholar] [CrossRef]
  9. Cuesta-Gomez, N.; Verhoeff, K.; Dadheech, N.; Dang, T.; Jasra, I.T.; de Leon, M.B.; Pawlick, R.; Marfil-Garza, B.; Anwar, P.; Razavy, H.; et al. Suspension Culture Improves iPSC Expansion and Pluripotency Phenotype. Stem Cell Res. Ther. 2023, 14, 154. [Google Scholar] [CrossRef] [PubMed]
  10. Manstein, F.; Ullmann, K.; Kropp, C.; Halloin, C.; Triebert, W.; Franke, A.; Farr, C.-M.; Sahabian, A.; Haase, A.; Breitkreuz, Y.; et al. High Density Bioprocessing of Human Pluripotent Stem Cells by Metabolic Control and in Silico Modeling. Stem Cells Transl. Med. 2021, 10, 1063–1080. [Google Scholar] [CrossRef] [PubMed]
  11. Huang, S.; Razvi, A.; Anderson-Jenkins, Z.; Sirskyj, D.; Gong, M.; Lavoie, A.-M.; Pigeau, G. Process Development and Scale-up of Pluripotent Stem Cell Manufacturing. Cell Gene Ther. Insights 2020, 6, 1277–1298. [Google Scholar] [CrossRef]
  12. Pandey, P.R.; Tomney, A.; Woon, M.T.; Uth, N.; Shafighi, F.; Ngabo, I.; Vallabhaneni, H.; Levinson, Y.; Abraham, E.; Friedrich Ben-Nun, I. End-to-End Platform for Human Pluripotent Stem Cell Manufacturing. Int. J. Mol. Sci. 2020, 21, 89. [Google Scholar] [CrossRef]
  13. Müller, D.; Klein, L.; Lemke, J.; Schulze, M.; Kruse, T.; Saballus, M.; Matuszczyk, J.; Kampmann, M.; Zijlstra, G. Process Intensification in the Biopharma Industry: Improving Efficiency of Protein Manufacturing Processes from Development to Production Scale Using Synergistic Approaches. Chem. Eng. Process. Process Intensif. 2022, 171, 108727. [Google Scholar] [CrossRef]
  14. Seth, G.; Hamilton, R.W.; Stapp, T.R.; Zheng, L.; Meier, A.; Petty, K.; Leung, S.; Chary, S. Development of a New Bioprocess Scheme Using Frozen Seed Train Intermediates to Initiate CHO Cell Culture Manufacturing Campaigns. Biotechnol. Bioeng. 2013, 110, 1376–1385. [Google Scholar] [CrossRef]
  15. Clincke, M.-F.; Mölleryd, C.; Samani, P.K.; Lindskog, E.; Fäldt, E.; Walsh, K.; Chotteau, V. Very High Density of Chinese Hamster Ovary Cells in Perfusion by Alternating Tangential Flow or Tangential Flow Filtration in WAVE BioreactorTM—Part II: Applications for Antibody Production and Cryopreservation. Biotechnol. Prog. 2013, 29, 768–777. [Google Scholar] [CrossRef]
  16. Meiser, I.; Alstrup, M.; Khalesi, E.; Stephan, B.; Speicher, A.M.; Majer, J.; Kwok, C.K.; Neubauer, J.C.; Hansson, M.; Zimmermann, H. Application-Oriented Bulk Cryopreservation of Human iPSCs in Cryo Bags Followed by Direct Inoculation in Scalable Suspension Bioreactors for Expansion and Neural Differentiation. Cells 2023, 12, 1914. [Google Scholar] [CrossRef]
  17. Heidemann, R.; Mered, M.; Wang, D.Q.; Gardner, B.; Zhang, C.; Michaels, J.; Henzler, H.-J.; Abbas, N.; Konstantinov, K. A New Seed-Train Expansion Method for Recombinant Mammalian Cell Lines. Cytotechnology 2002, 38, 99–108. [Google Scholar] [CrossRef]
  18. Tao, Y.; Shih, J.; Sinacore, M.; Ryll, T.; Yusuf-Makagiansar, H. Development and Implementation of a Perfusion-Based High Cell Density Cell Banking Process. Biotechnol. Prog. 2011, 27, 824–829. [Google Scholar] [CrossRef]
  19. Müller, J.; Ott, V.; Eibl, D.; Eibl, R. Seed Train Intensification Using an Ultra-High Cell Density Cell Banking Process. Processes 2022, 10, 911. [Google Scholar] [CrossRef]
  20. Ninomiya, N.; Shirahata, S.; Murakami, H.; Sugahara, T. Large-Scale, High-Density Freezing of Hybridomas and Its Application to High-Density Culture. Biotechnol. Bioeng. 1991, 38, 1110–1113. [Google Scholar] [CrossRef]
  21. Lawson, T.; Kehoe, D.E.; Schnitzler, A.C.; Rapiejko, P.J.; Der, K.A.; Philbrick, K.; Punreddy, S.; Rigby, S.; Smith, R.; Feng, Q.; et al. Process Development for Expansion of Human Mesenchymal Stromal Cells in a 50L Single-Use Stirred Tank Bioreactor. Biochem. Eng. J. 2017, 120, 49–62. [Google Scholar] [CrossRef]
  22. Schirmaier, C.; Jossen, V.; Kaiser, S.C.; Jüngerkes, F.; Brill, S.; Safavi-Nab, A.; Siehoff, A.; van den Bos, C.; Eibl, D.; Eibl, R. Scale-up of Adipose Tissue-Derived Mesenchymal Stem Cell Production in Stirred Single-Use Bioreactors under Low-Serum Conditions. Eng. Life Sci. 2014, 14, 292–303. [Google Scholar] [CrossRef]
  23. Watanabe, K.; Ueno, M.; Kamiya, D.; Nishiyama, A.; Matsumura, M.; Wataya, T.; Takahashi, J.B.; Nishikawa, S.; Nishikawa, S.; Muguruma, K.; et al. A ROCK Inhibitor Permits Survival of Dissociated Human Embryonic Stem Cells. Nat. Biotechnol. 2007, 25, 681–686. [Google Scholar] [CrossRef]
  24. Jossen, V.; Eibl, R.; Kraume, M.; Eibl, D. Growth Behavior of Human Adipose Tissue-Derived Stromal/Stem Cells at Small Scale: Numerical and Experimental Investigations. Bioengineering 2018, 5, 106. [Google Scholar] [CrossRef]
  25. Maldonado, M.; Luu, R.J.; Ramos, M.E.P.; Nam, J. ROCK Inhibitor Primes Human Induced Pluripotent Stem Cells to Selectively Differentiate towards Mesendodermal Lineage via Epithelial-Mesenchymal Transition-like Modulation. Stem Cell Res. 2016, 17, 222–227. [Google Scholar] [CrossRef]
  26. Couto, P.S.; Stibbs, D.J.; Rotondi, M.C.; Takeuchi, Y.; Rafiq, Q.A. Scalable Manufacturing of Gene-Modified Human Mesenchymal Stromal Cells with Microcarriers in Spinner Flasks. Appl. Microbiol. Biotechnol. 2023, 107, 5669–5685. [Google Scholar] [CrossRef] [PubMed]
  27. Manstein, F.; Ullmann, K.; Triebert, W.; Zweigerdt, R. Process Control and in Silico Modeling Strategies for Enabling High Density Culture of Human Pluripotent Stem Cells in Stirred Tank Bioreactors. STAR Protoc. 2021, 2, 100988. [Google Scholar] [CrossRef] [PubMed]
  28. Ozturk, S.S. Engineering Challenges in High Density Cell Culture Systems. Cytotechnology 1996, 22, 3–16. [Google Scholar] [CrossRef]
  29. Bausch, M.; Schultheiss, C.; Sieck, J.B. Recommendations for Comparison of Productivity Between Fed-Batch and Perfusion Processes. Biotechnol. J. 2019, 14, 1700721. [Google Scholar] [CrossRef] [PubMed]
  30. Crook, J.M.; Kravets, L. Cell Preservation Method for Pluripotent Stem Cells. US9714412B2, 25 July 2017. [Google Scholar]
  31. Sullivan, S.; Stacey, G.N.; Akazawa, C.; Aoyama, N.; Baptista, R.; Bedford, P.; Bennaceur Griscelli, A.; Chandra, A.; Elwood, N.; Girard, M.; et al. Quality Control Guidelines for Clinical-Grade Human Induced Pluripotent Stem Cell Lines. Regen. Med. 2018, 13, 859–866. [Google Scholar] [CrossRef] [PubMed]
  32. Lee, B.; Jung, S.; Hashimura, Y.; Lee, M.; Borys, B.S.; Dang, T.; Kallos, M.S.; Rodrigues, C.A.V.; Silva, T.P.; Cabral, J.M.S. Cell Culture Process Scale-Up Challenges for Commercial-Scale Manufacturing of Allogeneic Pluripotent Stem Cell Products. Bioengineering 2022, 9, 92. [Google Scholar] [CrossRef]
  33. Badenes, S.M.; Fernandes, T.G.; Rodrigues, C.A.V.; Diogo, M.M.; Cabral, J.M.S. Microcarrier-Based Platforms for in Vitro Expansion and Differentiation of Human Pluripotent Stem Cells in Bioreactor Culture Systems. J. Biotechnol. 2016, 234, 71–82. [Google Scholar] [CrossRef]
  34. Dang, T.; Borys, B.S.; Kanwar, S.; Colter, J.; Worden, H.; Blatchford, A.; Croughan, M.S.; Hossan, T.; Rancourt, D.E.; Lee, B.; et al. Computational Fluid Dynamic Characterization of Vertical-Wheel Bioreactors Used for Effective Scale-up of Human Induced Pluripotent Stem Cell Aggregate Culture. Can. J. Chem. Eng. 2021, 99, 2536–2553. [Google Scholar] [CrossRef]
  35. Badenes, S.M.; Fernandes, T.G.; Cordeiro, C.S.M.; Boucher, S.; Kuninger, D.; Vemuri, M.C.; Diogo, M.M.; Cabral, J.M.S. Defined Essential 8TM Medium and Vitronectin Efficiently Support Scalable Xeno-Free Expansion of Human Induced Pluripotent Stem Cells in Stirred Microcarrier Culture Systems. PLoS ONE 2016, 11, e0151264. [Google Scholar] [CrossRef]
  36. Nogueira, D.E.S.; Rodrigues, C.A.V.; Carvalho, M.S.; Miranda, C.C.; Hashimura, Y.; Jung, S.; Lee, B.; Cabral, J.M.S. Strategies for the Expansion of Human Induced Pluripotent Stem Cells as Aggregates in Single-Use Vertical-WheelTM Bioreactors. J. Biol. Eng. 2019, 13, 74. [Google Scholar] [CrossRef]
  37. Marescal, O.; Cheeseman, I.M. Cellular Mechanisms and Regulation of Quiescence. Dev. Cell 2020, 55, 259–271. [Google Scholar] [CrossRef]
  38. Petry, F.; Salzig, D. Impact of Bioreactor Geometry on Mesenchymal Stem Cell Production in Stirred-Tank Bioreactors. Chem. Ing. Tech. 2021, 93, 1537–1554. [Google Scholar] [CrossRef]
  39. Ornelas-González, A.; González-González, M.; Rito-Palomares, M. Microcarrier-Based Stem Cell Bioprocessing: GMP-Grade Culture Challenges and Future Trends for Regenerative Medicine. Crit. Rev. Biotechnol. 2021, 41, 1081–1095. [Google Scholar] [CrossRef] [PubMed]
  40. Petry, F.; Salzig, D. Large-Scale Production of Size-Adjusted β-Cell Spheroids in a Fully Controlled Stirred-Tank Reactor. Processes 2022, 10, 861. [Google Scholar] [CrossRef]
Figure 1. Workflow overview of the OSI trials performed in coated T25 flasks and MC-operated BioBLU 0.3c’s. Following the static seed train in conventional flatware, the hiPSCs were passaged as single cells and either frozen away for prolonged storage or immediately transferred to either T25 flasks or the MC-operated BioBLU 0.3c’s to act as trial controls. Following long-term storage in liquid N2, the working cell bank was thawed and again characterized in both culture vessels. All cultivations were evaluated through daily sampling, as well as following final harvest. Created using Biorender.com.
Processes 12 00426 g001
Figure 2. Cell growth under static conditions following cryopreservation at various VCDs. Cells were either routinely passaged (●), or frozen away at VCDs of 1 × 10⁶ (■), 5 × 10⁶ (♦), 25 × 106 (▲), 50 × 106 (▼) and 100 × 106 (•) cells mL−1, thawed and then replated for evaluation. (a) Attachment efficiency 24 h following replating. (b) Doubling time as a function of VCD during cryopreservation, with the horizontal line representing the routinely passaged control. (c) VCDA and viability over a 5 d cultivation period following replating, with vertical black dashed lines indicating intermittent medium exchanges and the grey field indicating the adaptation phase to the removal of RI. (d) VCDA as a function of confluency. (e) Expression of pluripotent markers Oct3/4, Sox2, Nanog, TRA-1-60 and SSEA-4, as well as the differentiation marker SSEA-1 5 d post-inoculation. * p < 0.05.
Processes 12 00426 g002
Figure 3. Cell growth under static and dynamic conditions following either standard passaging or cryopreservation at 5 × 10⁶ cells mL−1 and OSI. (a) Changes in VCDA and viability over time, with vertical dashed lines indicating either the start of perfusion for the dynamic cultivations (day 1) or intermittent medium exchanges for the static repeated batch controls (day 1 and 3). (b) Attachment efficiency plotted against doubling time. (c) Changes in pH and cell specific LDH activity in the culture medium supernatant.
Processes 12 00426 g003
Figure 4. Distribution and change in equivalent MC aggregate diameter over the 5 d cultivation period for the (a) BioBLU controls and (b) BioBLU OSI replicates. Expression of (c) pluripotency (Oct3/4, Sox2, Nanog, TRA-1-60 and SSEA-4) and differentiation (SSEA-1) markers following the harvest of the hiPSCs from either the routinely passaged static T-flask controls (purple), stirred controls (blue), or stirred OSI experiments (pink), as well as their respective germ line specific marker expression following subsequent tri-lineage differentiation.
Processes 12 00426 g004
Table 1. Overview of the main growth-dependent parameters achieved for the stirred OSI experiments compared to the static and stirred controls. Letters indicate grouping based on significant differences (p < 0.05) between the individual conditions tested.
ParameterT25 ControlBioBLU ControlBioBLU OSI
A E *(%)75.9 ± 6.2 a69.5 ± 19.0 a121.4 ± 18.6 b
C D *(%)- ****57.8 ± 31.3 a67.0 ± 14.4 a
t d **(h)16.4 ± 0.3 a15.0 ± 0.8 b13.9 ± 0.3 b
Max. VCDA ***(105 cells cm−2)3.4 ± 0.3 a3.4 ± 1.6 a4.1 ± 1.3 a
Viability ***(%)94.6 ± 1.5 a92.9 ± 0.6 a95.4 ± 1.4 a
E F (-)17.1 ± 1.5 a18.1 ± 8.6 a22.0 ± 7.1 a
q G l c (pmol cell−1 d−1)14.1 ± 4.6 a14.7 ± 7.4 a10.1 ± 5.7 a
q L a c (pmol cell−1 d−1)26.4 ± 7.0 a24.0 ± 4.5 a17.1 ± 2.2 a
q G l n (pmol cell−1 d−1)2.3 ± 0.6 a2.0 ± 1.2 a1.4 ± 0.9 a
q N H 4 (pmol cell−1 d−1)1.8 ± 0.6 a1.3 ± 0.8 a1.0 ± 0.6 a
Y L a c / G l c (mol mol−1)1.9 ± 0.5 a1.6 ± 0.0 a1.7 ± 0.1 a
Y N H 4 / G l n (mol mol−1)0.8 ± 0.2 a0.7 ± 0.1 a0.8 ± 0.1 a
* Following the attachment phase ** During the exponential growth phase *** At the start of the stationary phase **** The static T25 cultivation was not conducted using MCs, therefore the cell distribution equation does not apply. A E : Attachment efficiency. C D : Cell distribution. t d : Doubling time. E F : Expansion factor. q G l c : pecific glucose consumption rate. q L a c : Specific lactate production rate. q G l n : Specific glutamine consumption rate. q N H 4 : Specific ammonium production rate. Y L a c / G l c : Lactate yield per glucose equivalent. Y N H 4 / G l n : Ammonium yield per glutamine equivalent. Abbreviations: One-step inoculation (OSI), viable cell density per scaffold surface area (VCDA), lactate (Lac), glucose (Glc), ammonium (NH4), glutamine (Gln).
Disclaimer/Publisher’s Note: The statements, opinions and data contained in all publications are solely those of the individual author(s) and contributor(s) and not of MDPI and/or the editor(s). MDPI and/or the editor(s) disclaim responsibility for any injury to people or property resulting from any ideas, methods, instructions or products referred to in the content.

