
Microscopic Imaging on Diesel Spray and Atomization Process
Abstract
:1. Introduction
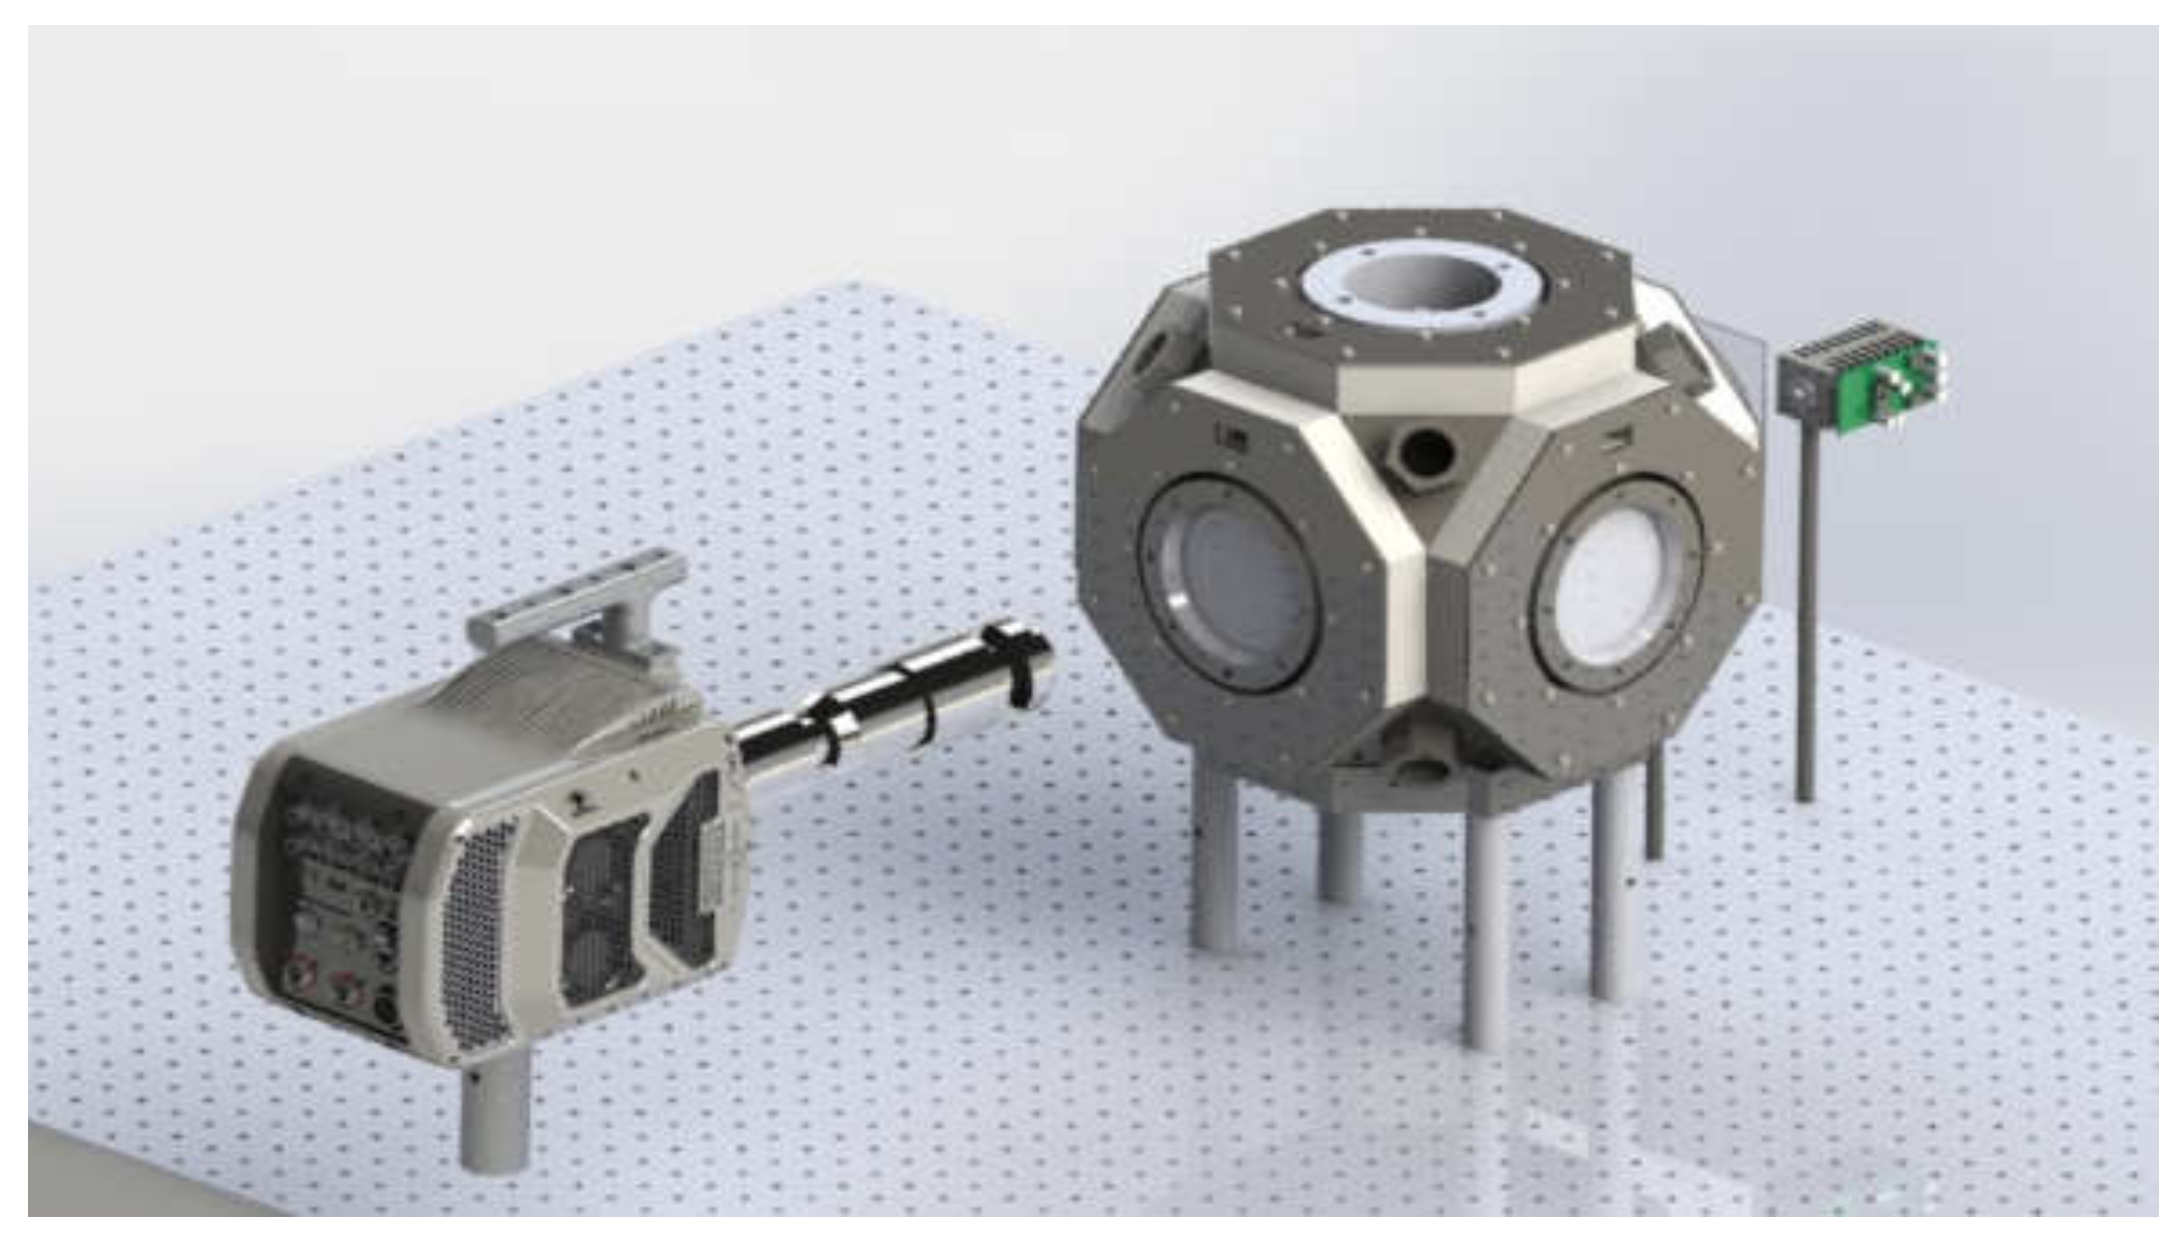
2. Experimental Setup and Procedure
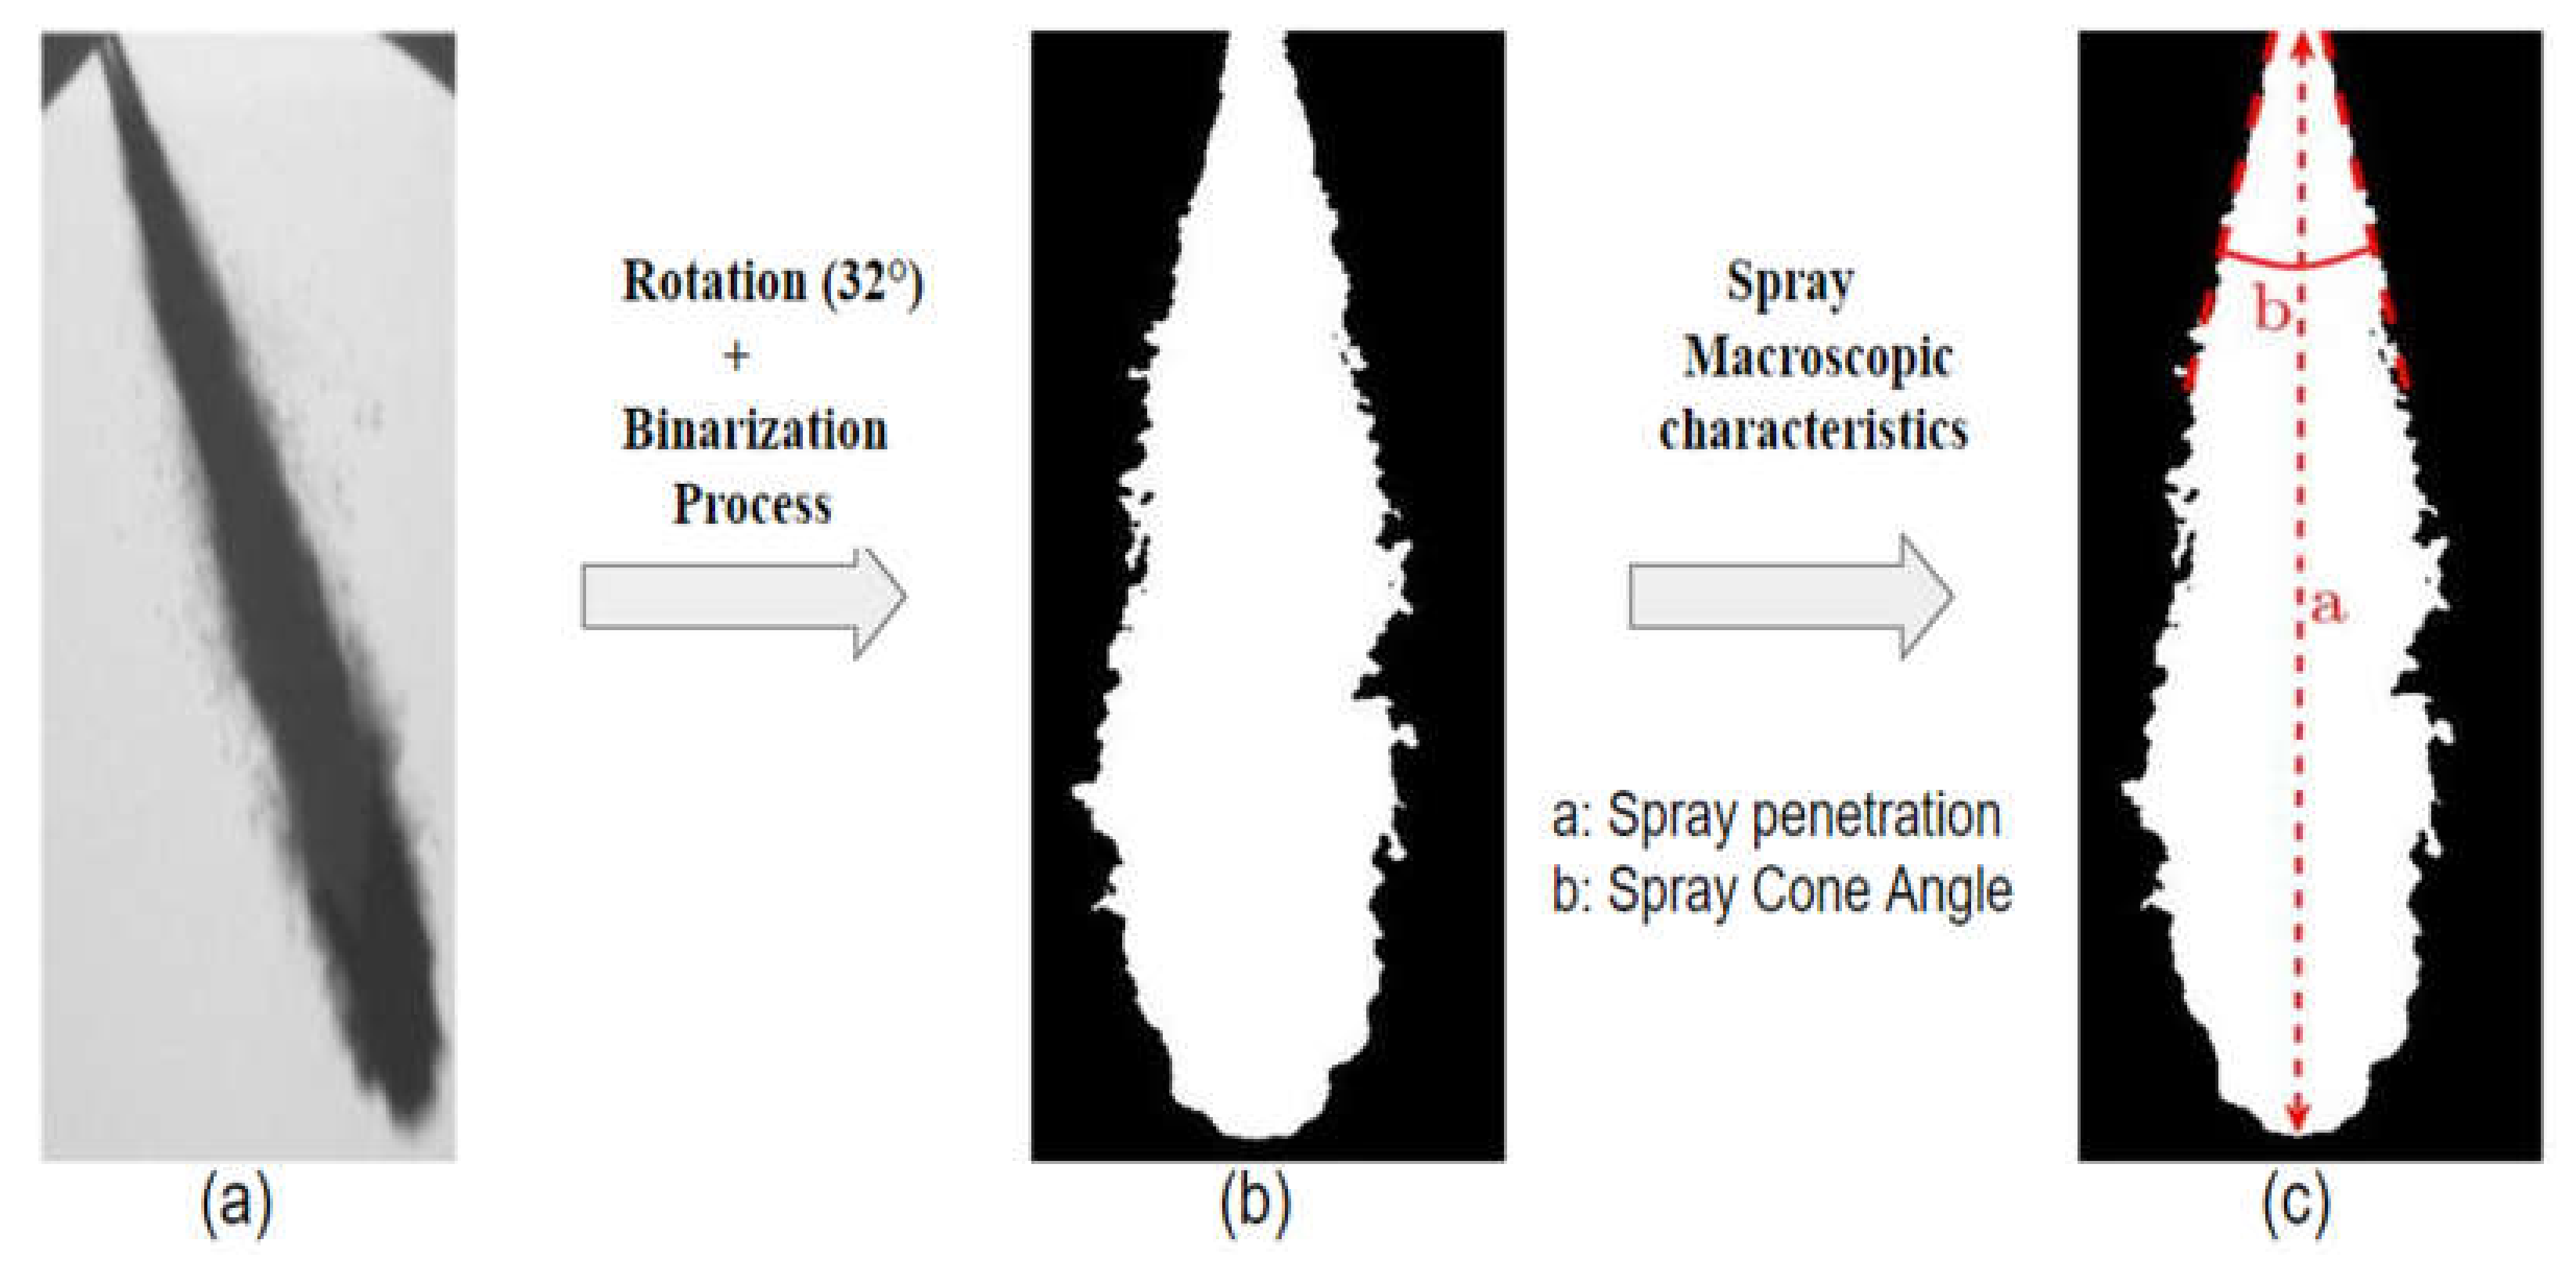
3. Image Processing Method
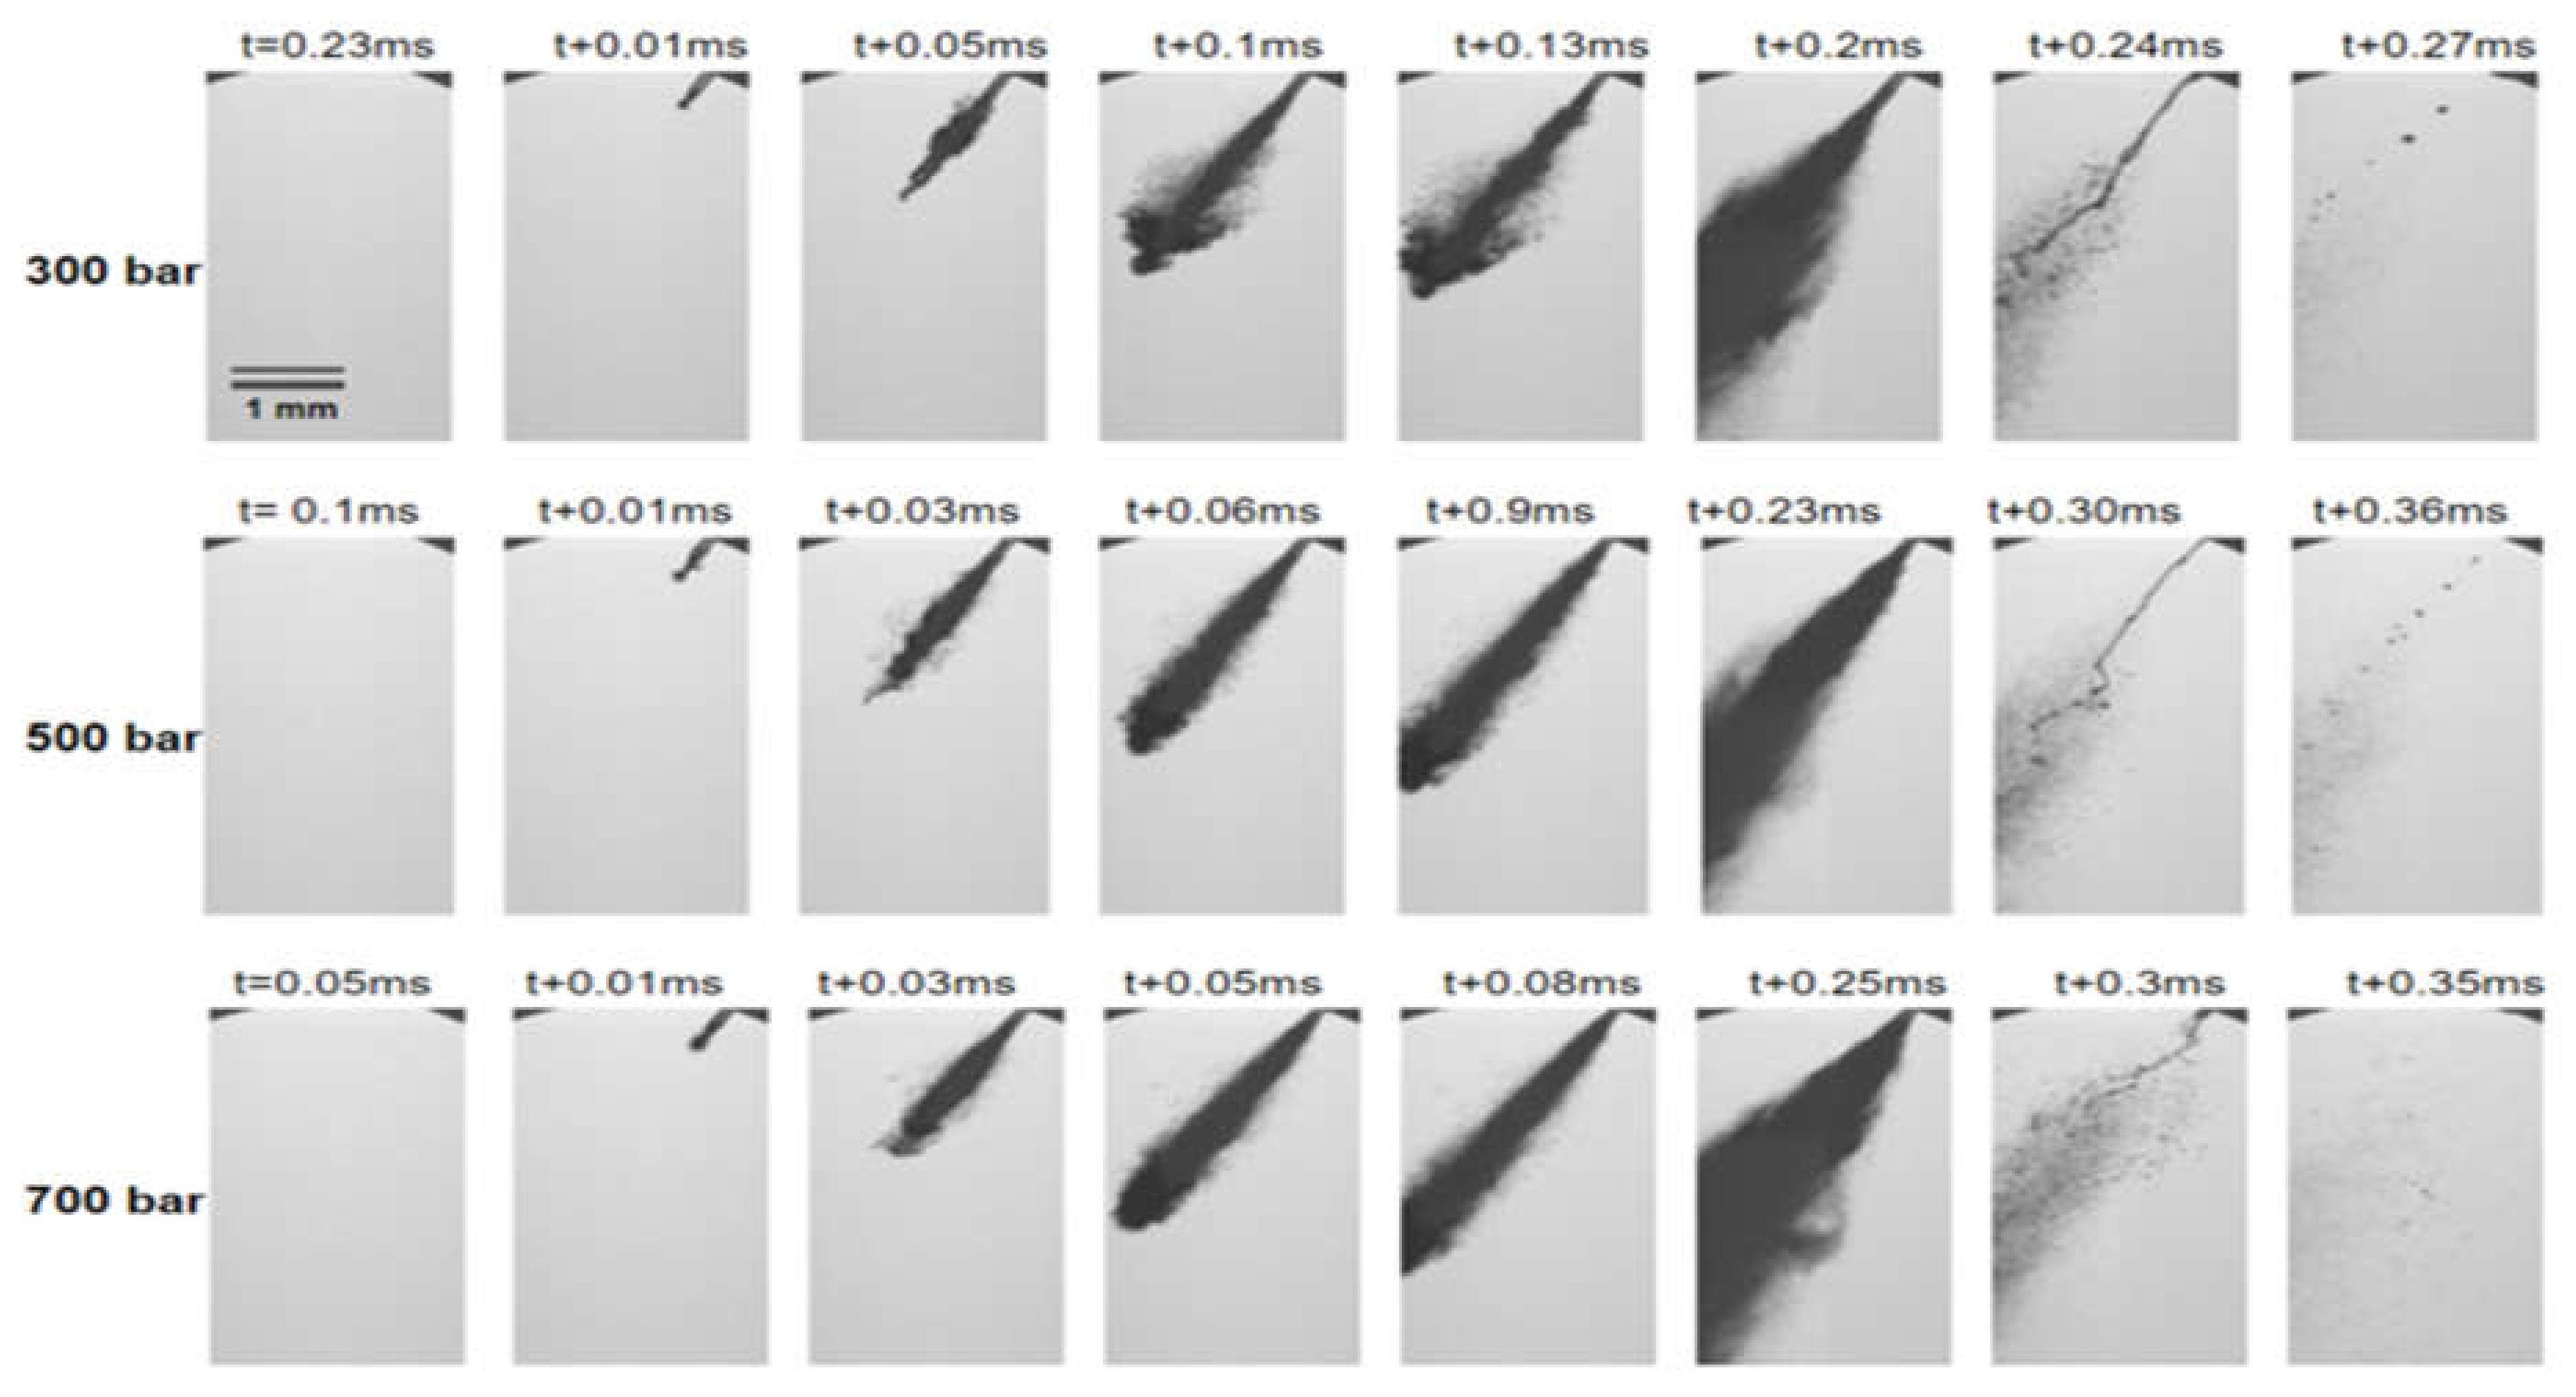
4. Spray Images Analysis
5. Temporal Evolution Analysis of a Diesel Spray
6. Results and Discussion
6.1. Effects of Injection Pressure on Spray Characteristics
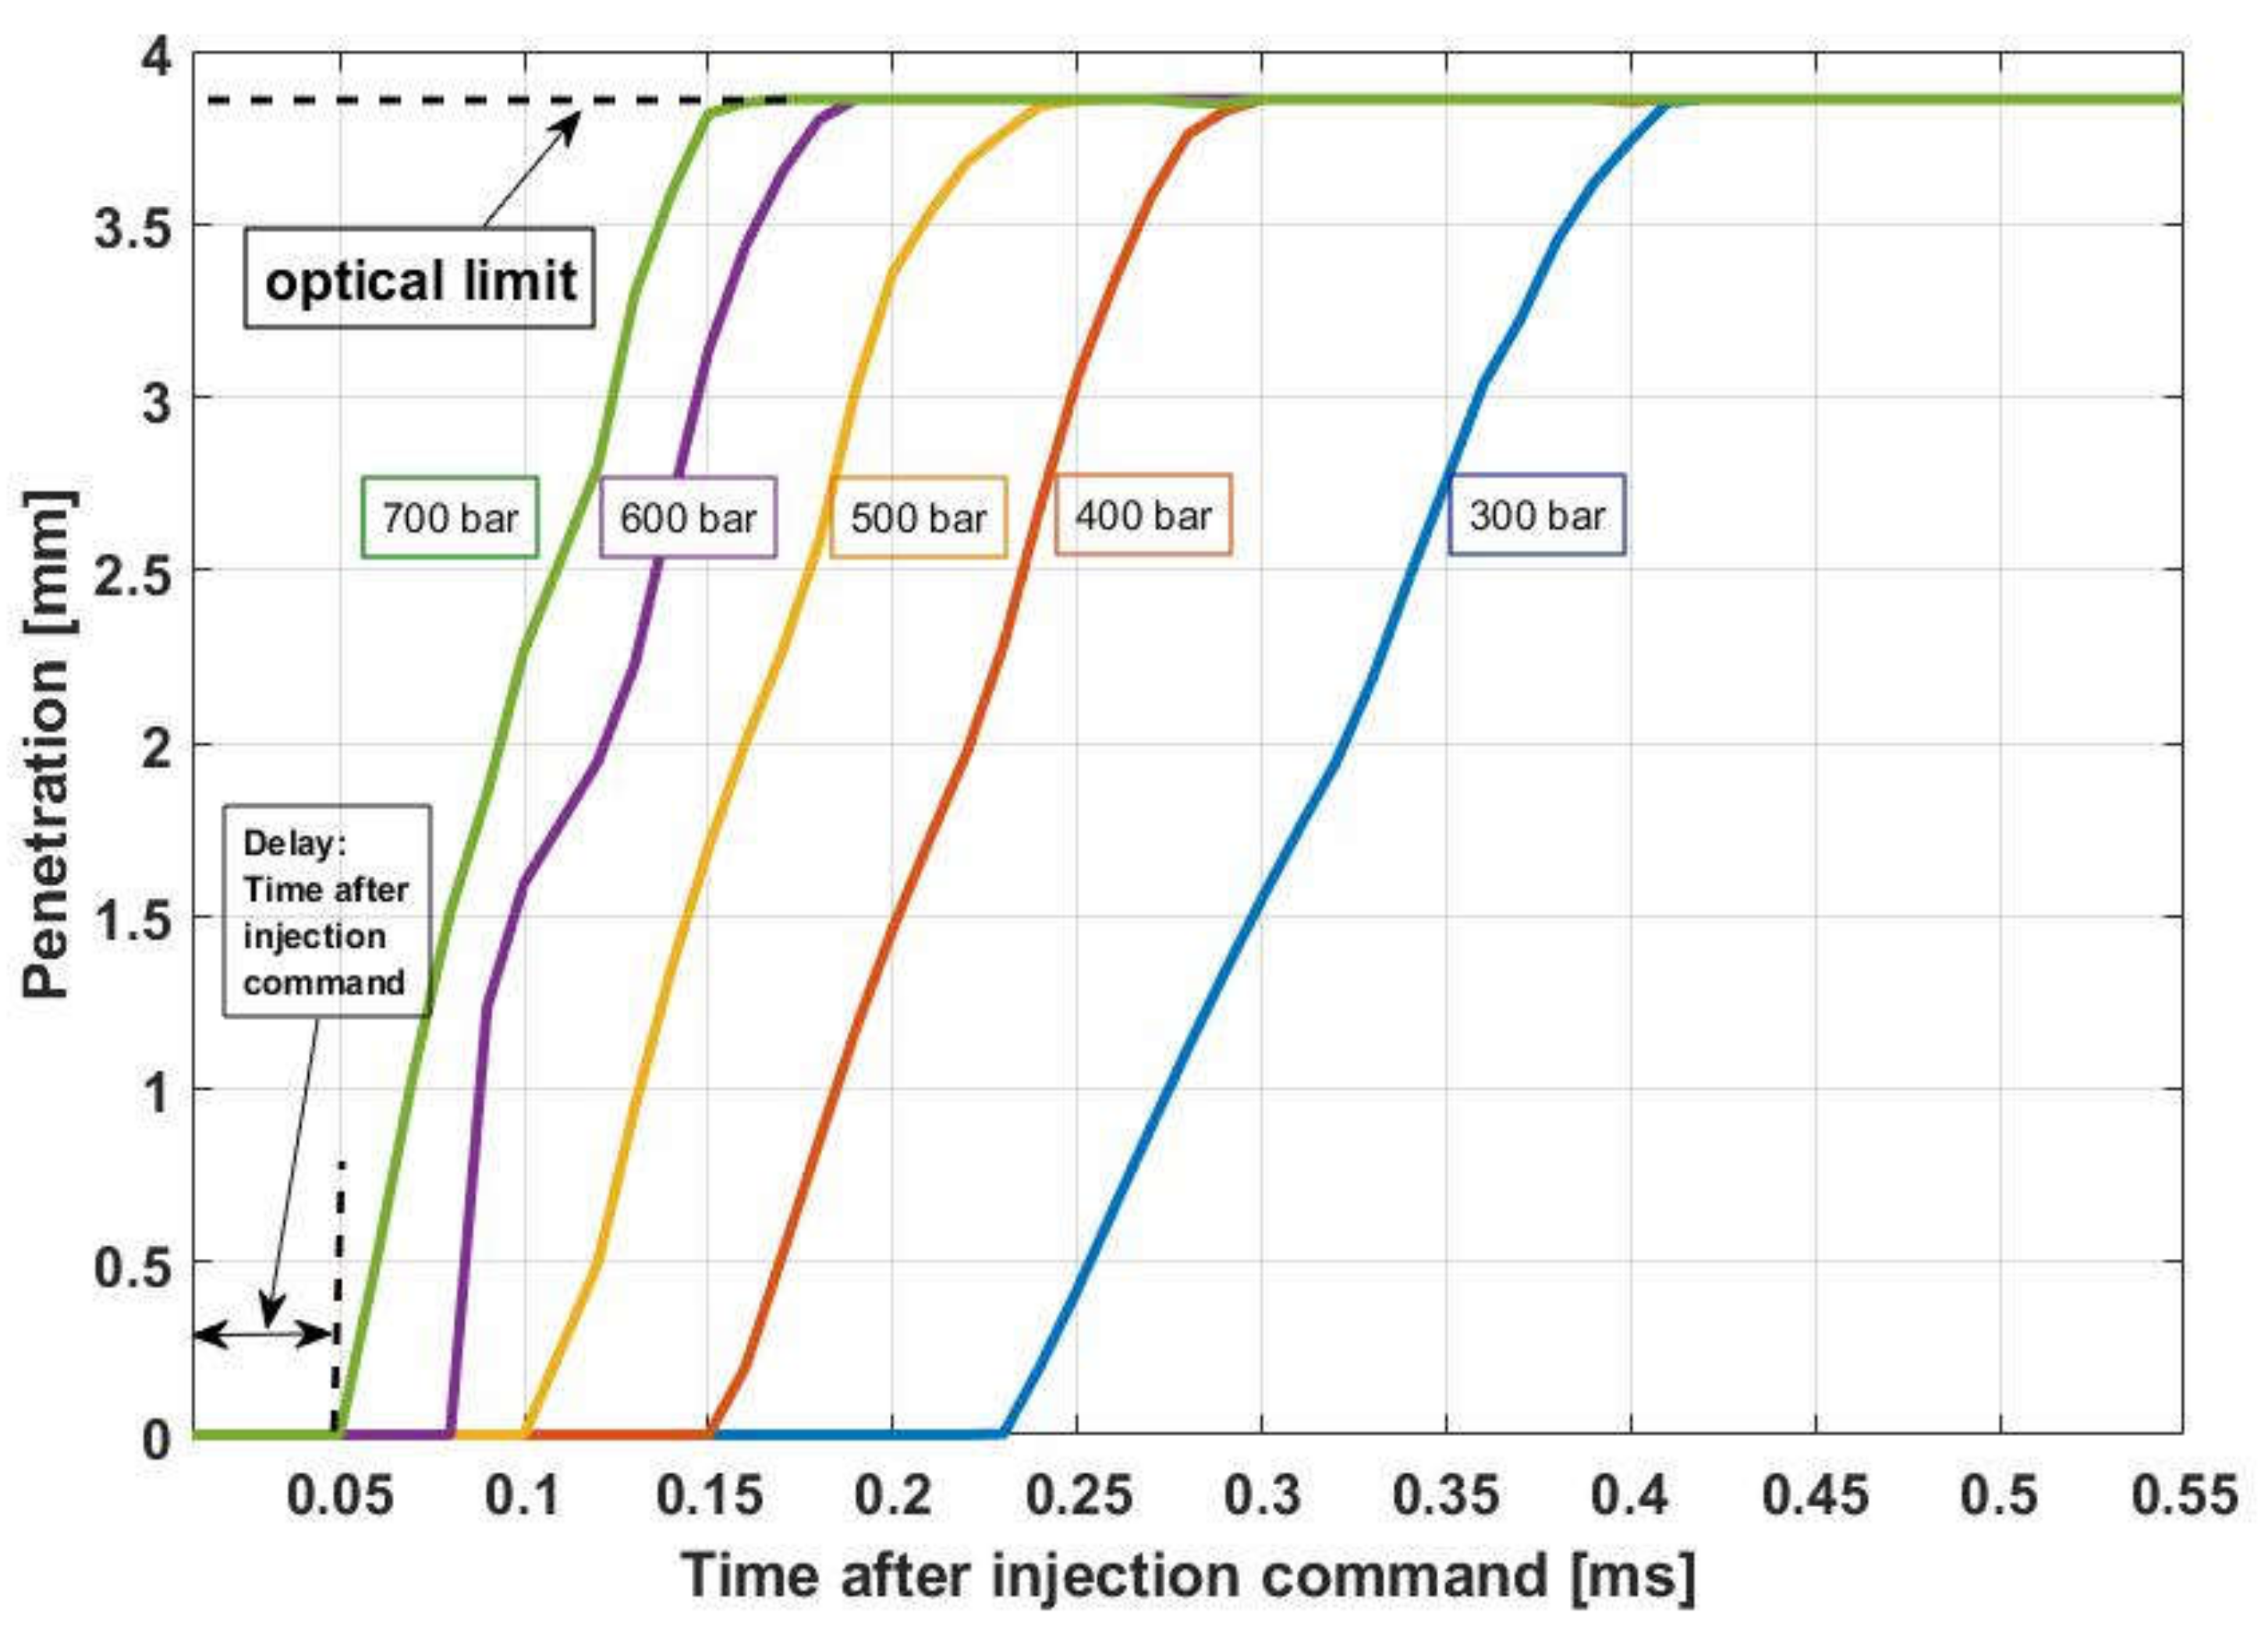
6.1.1. Penetration
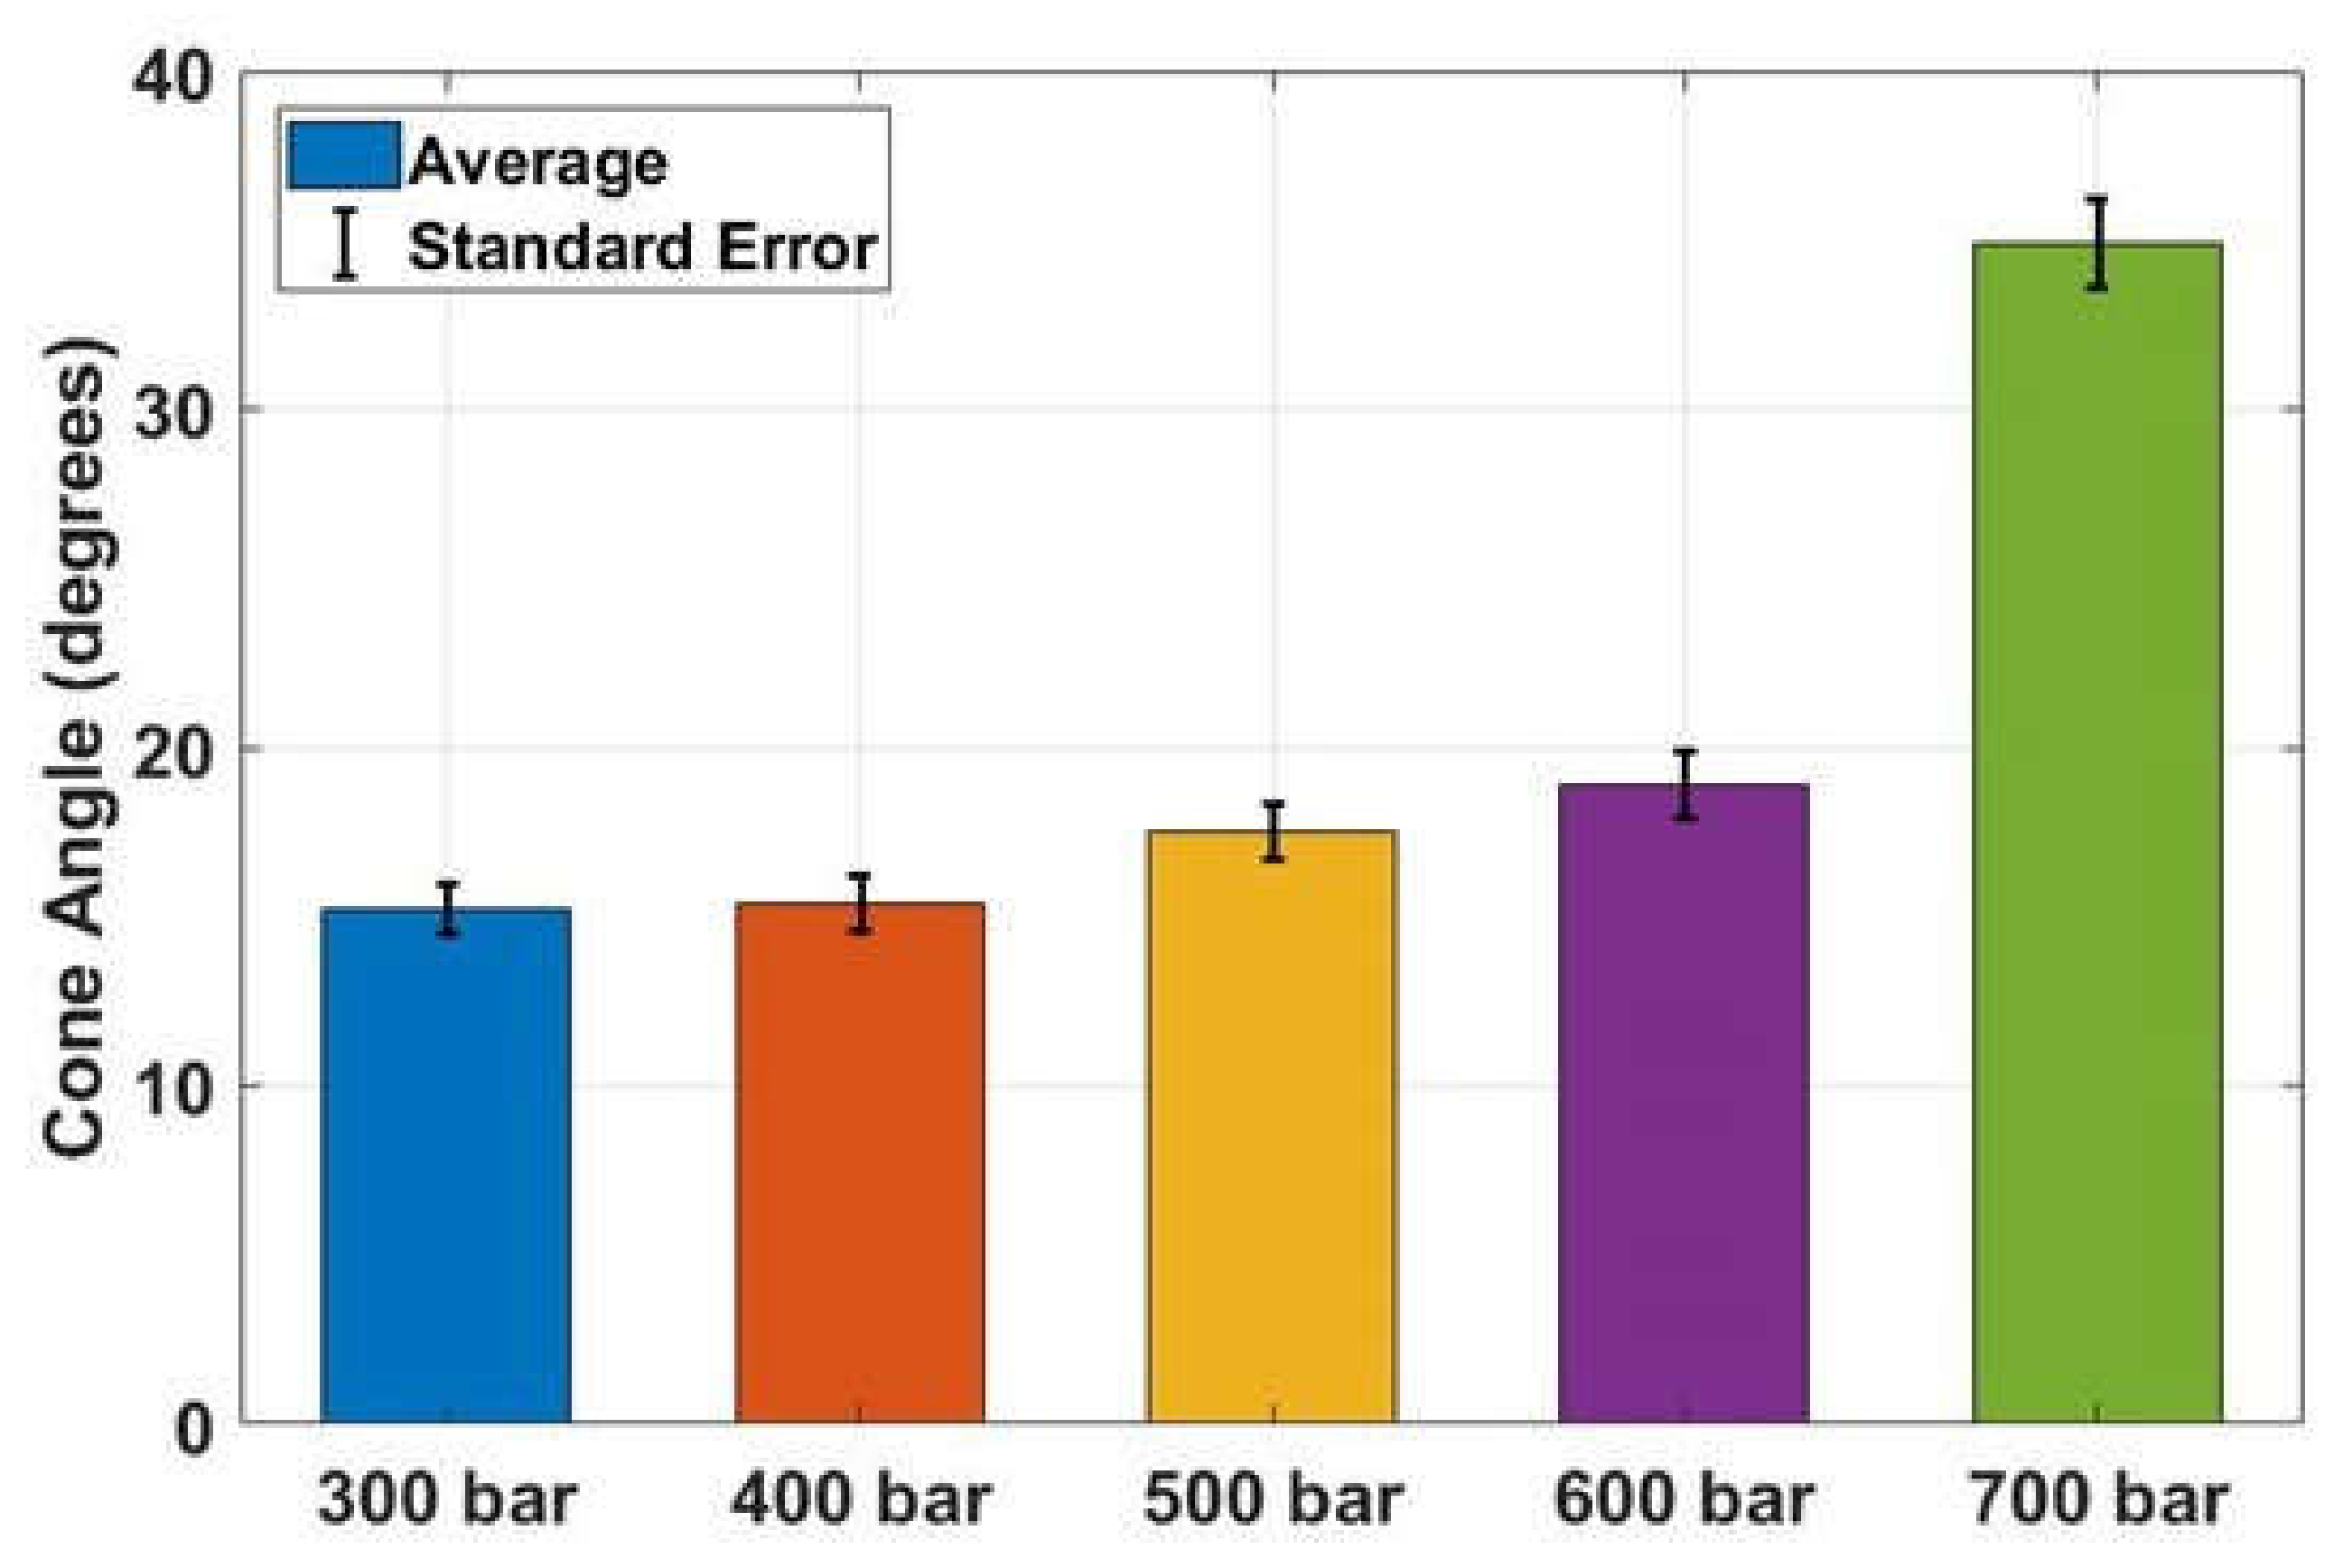
6.1.2. Cone Angle
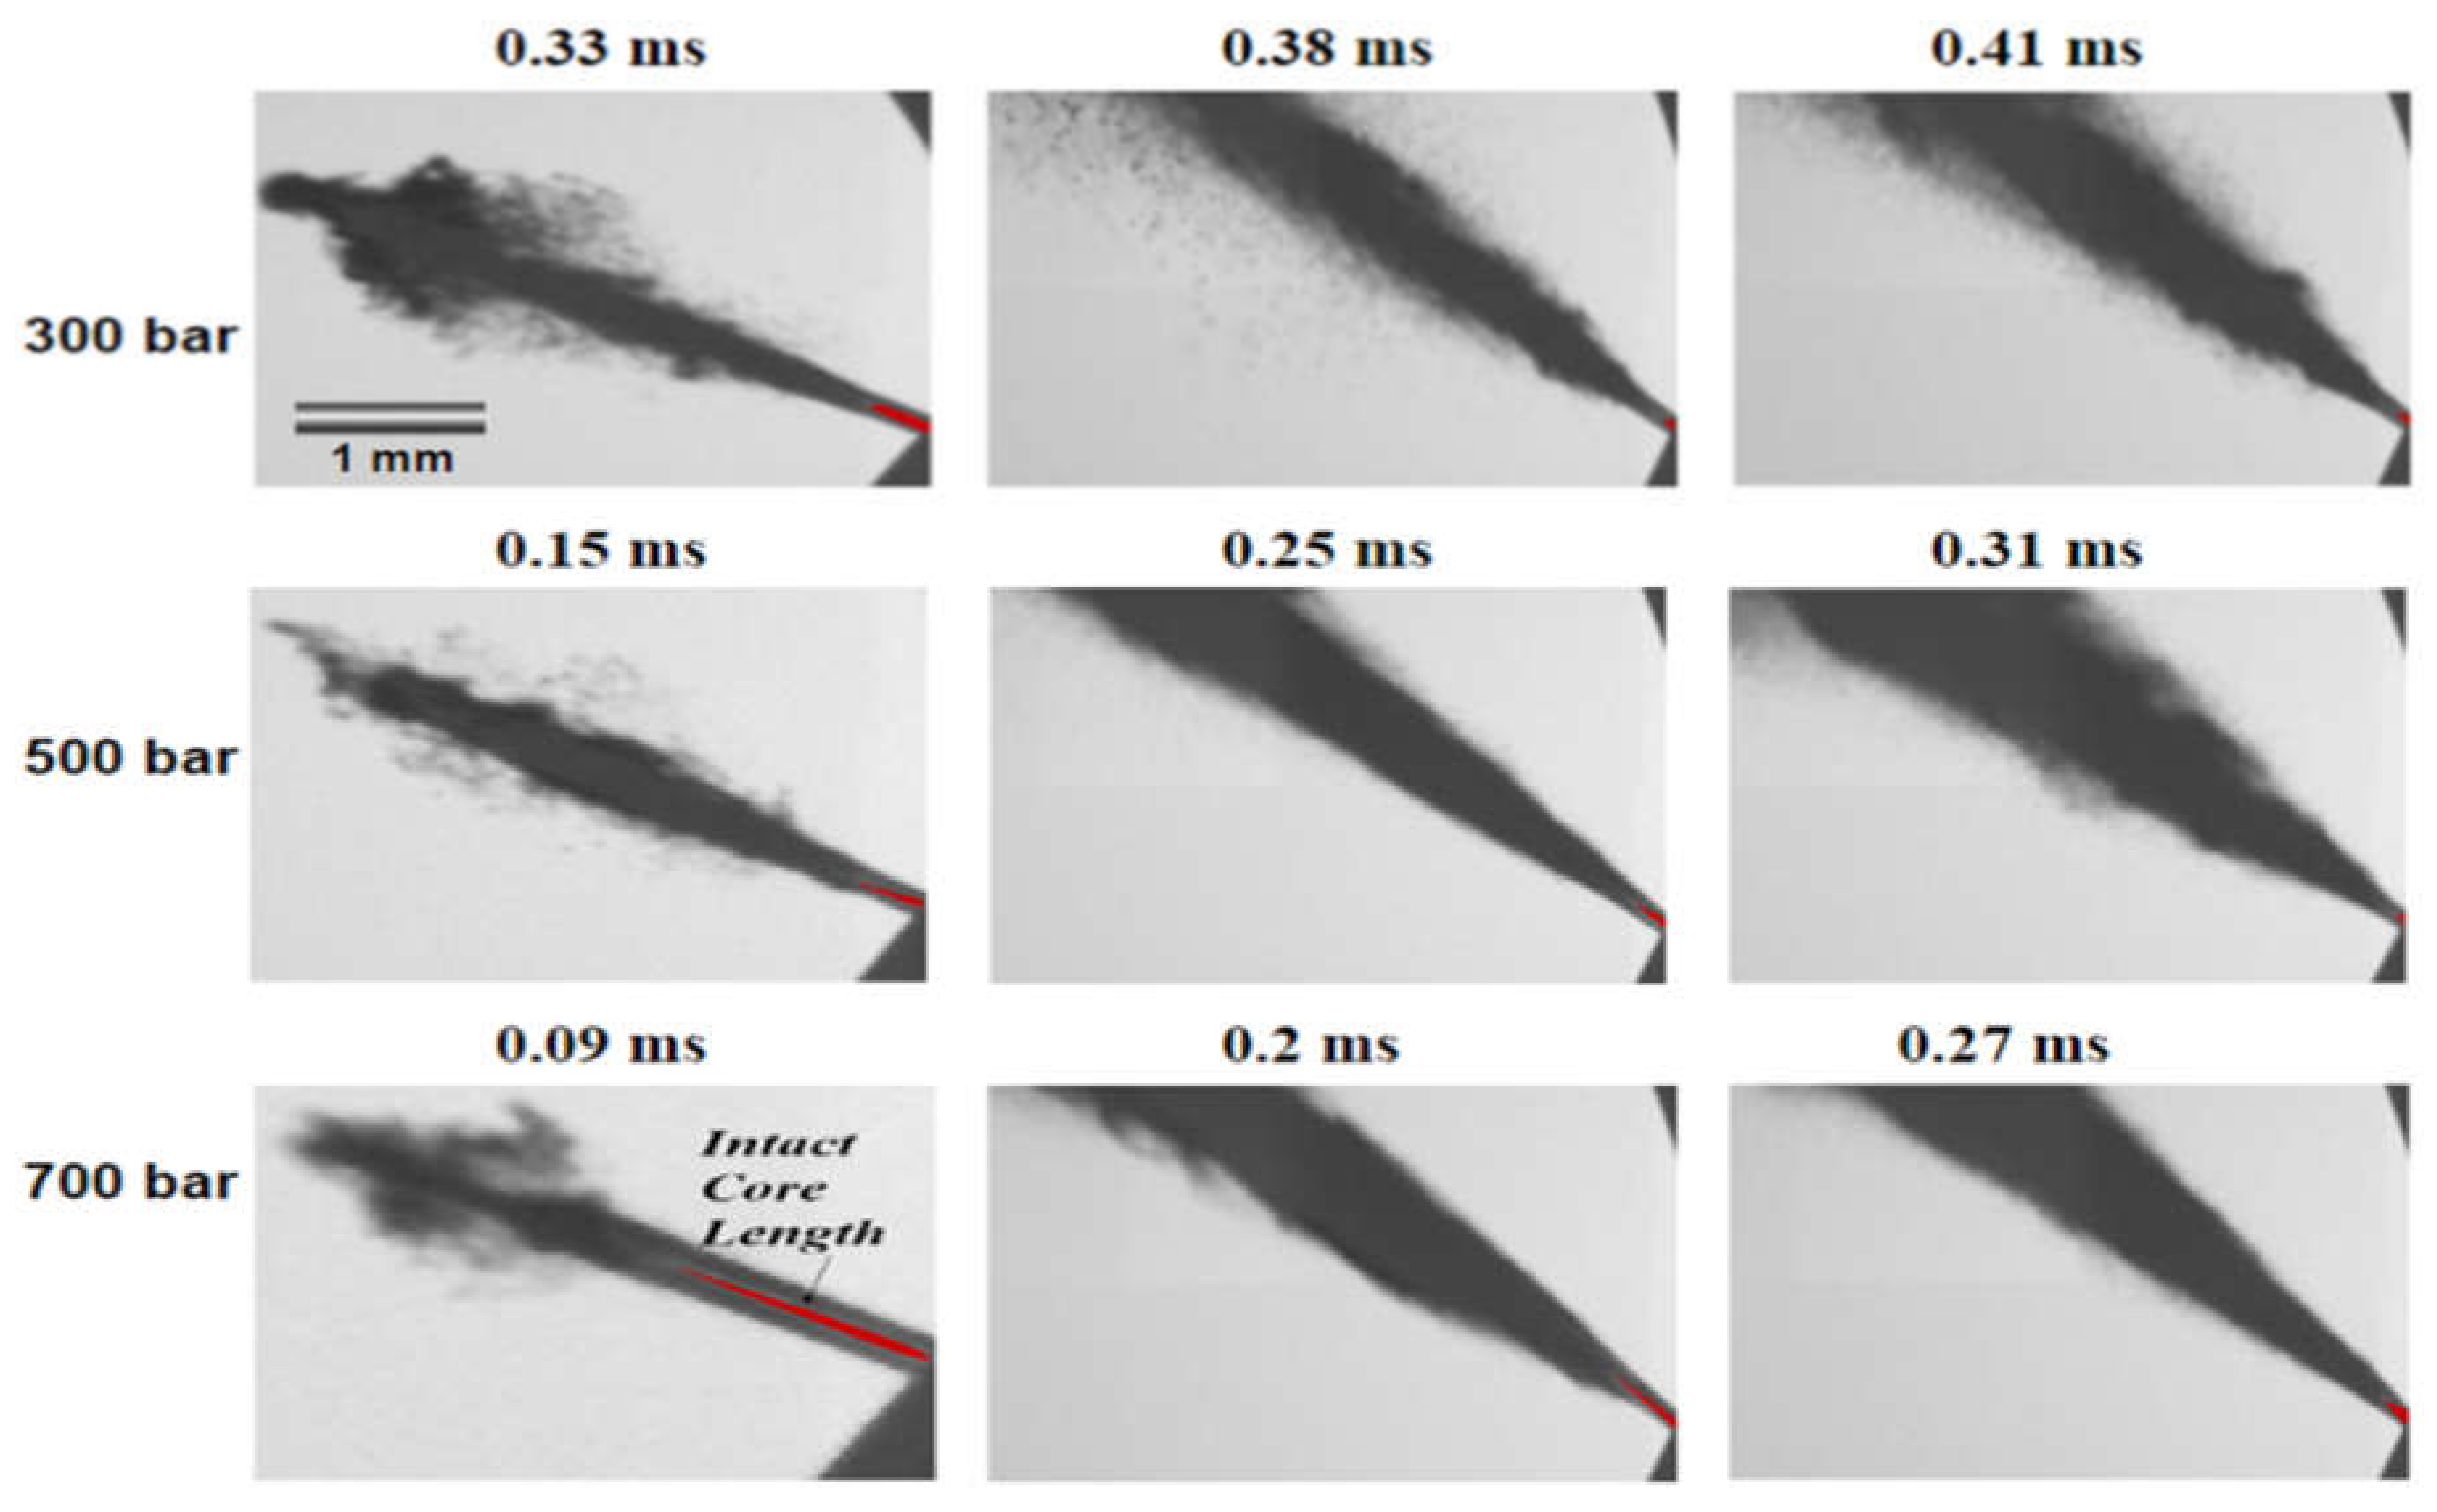
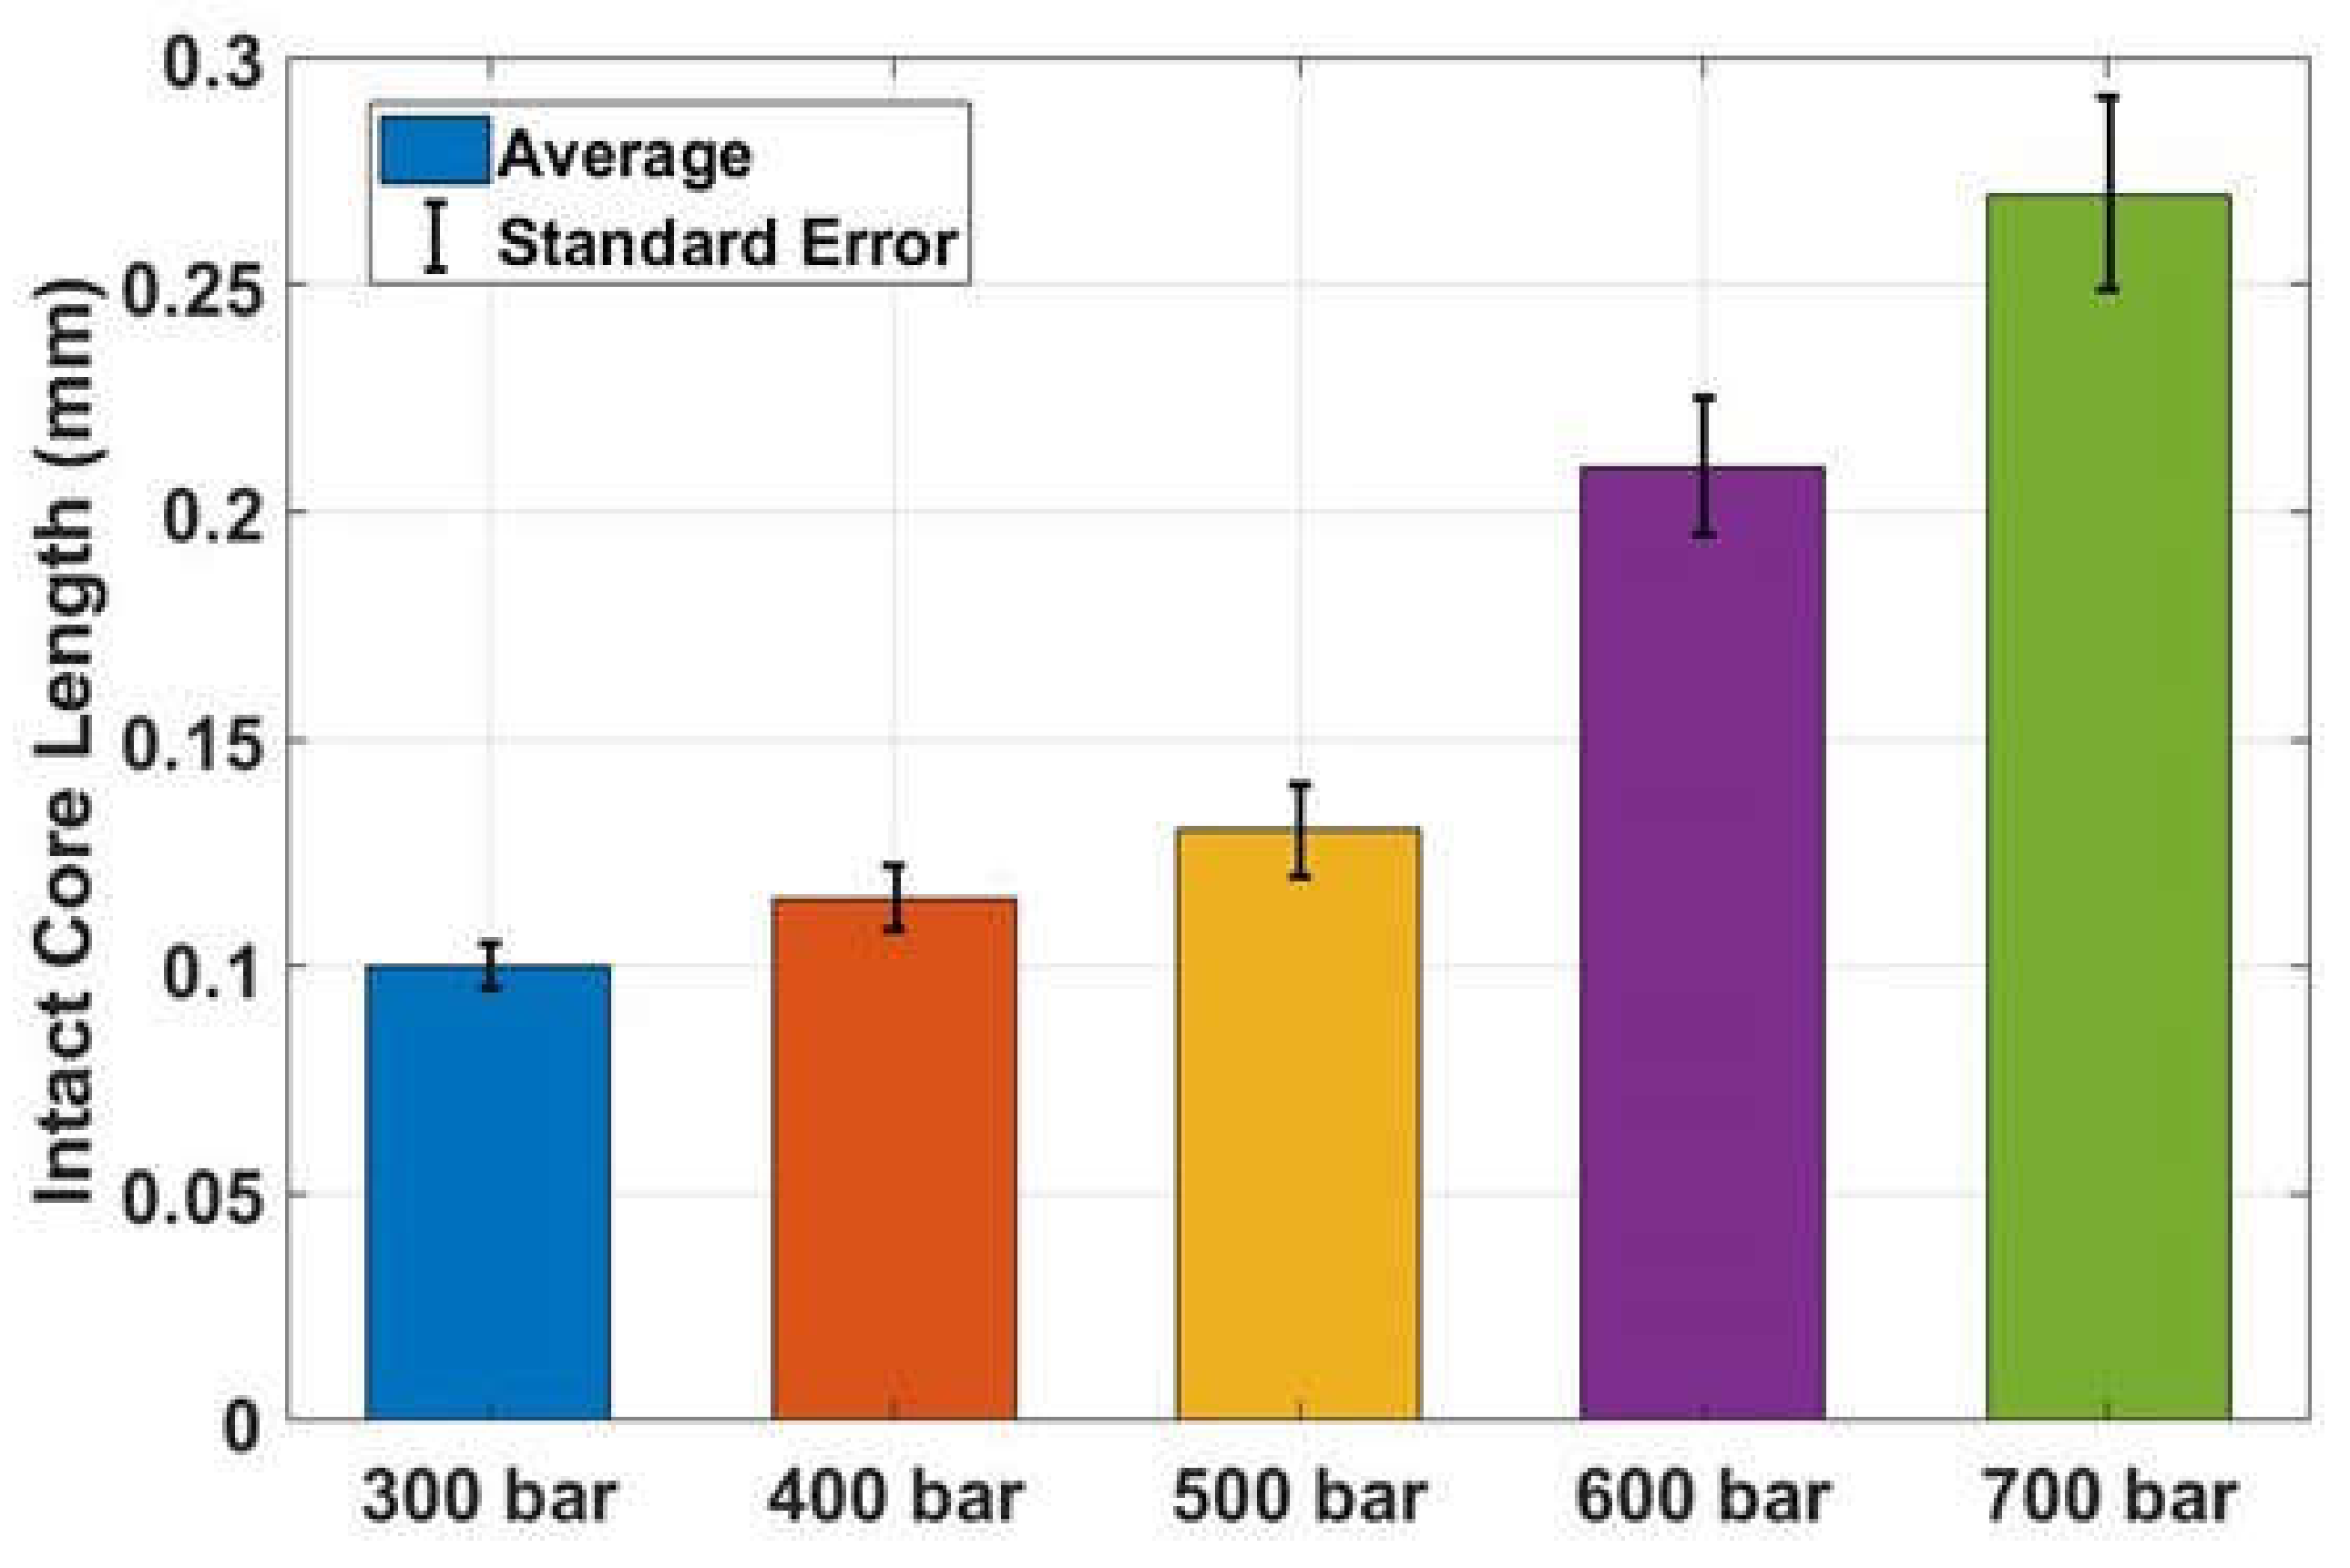
6.1.3. Core Length
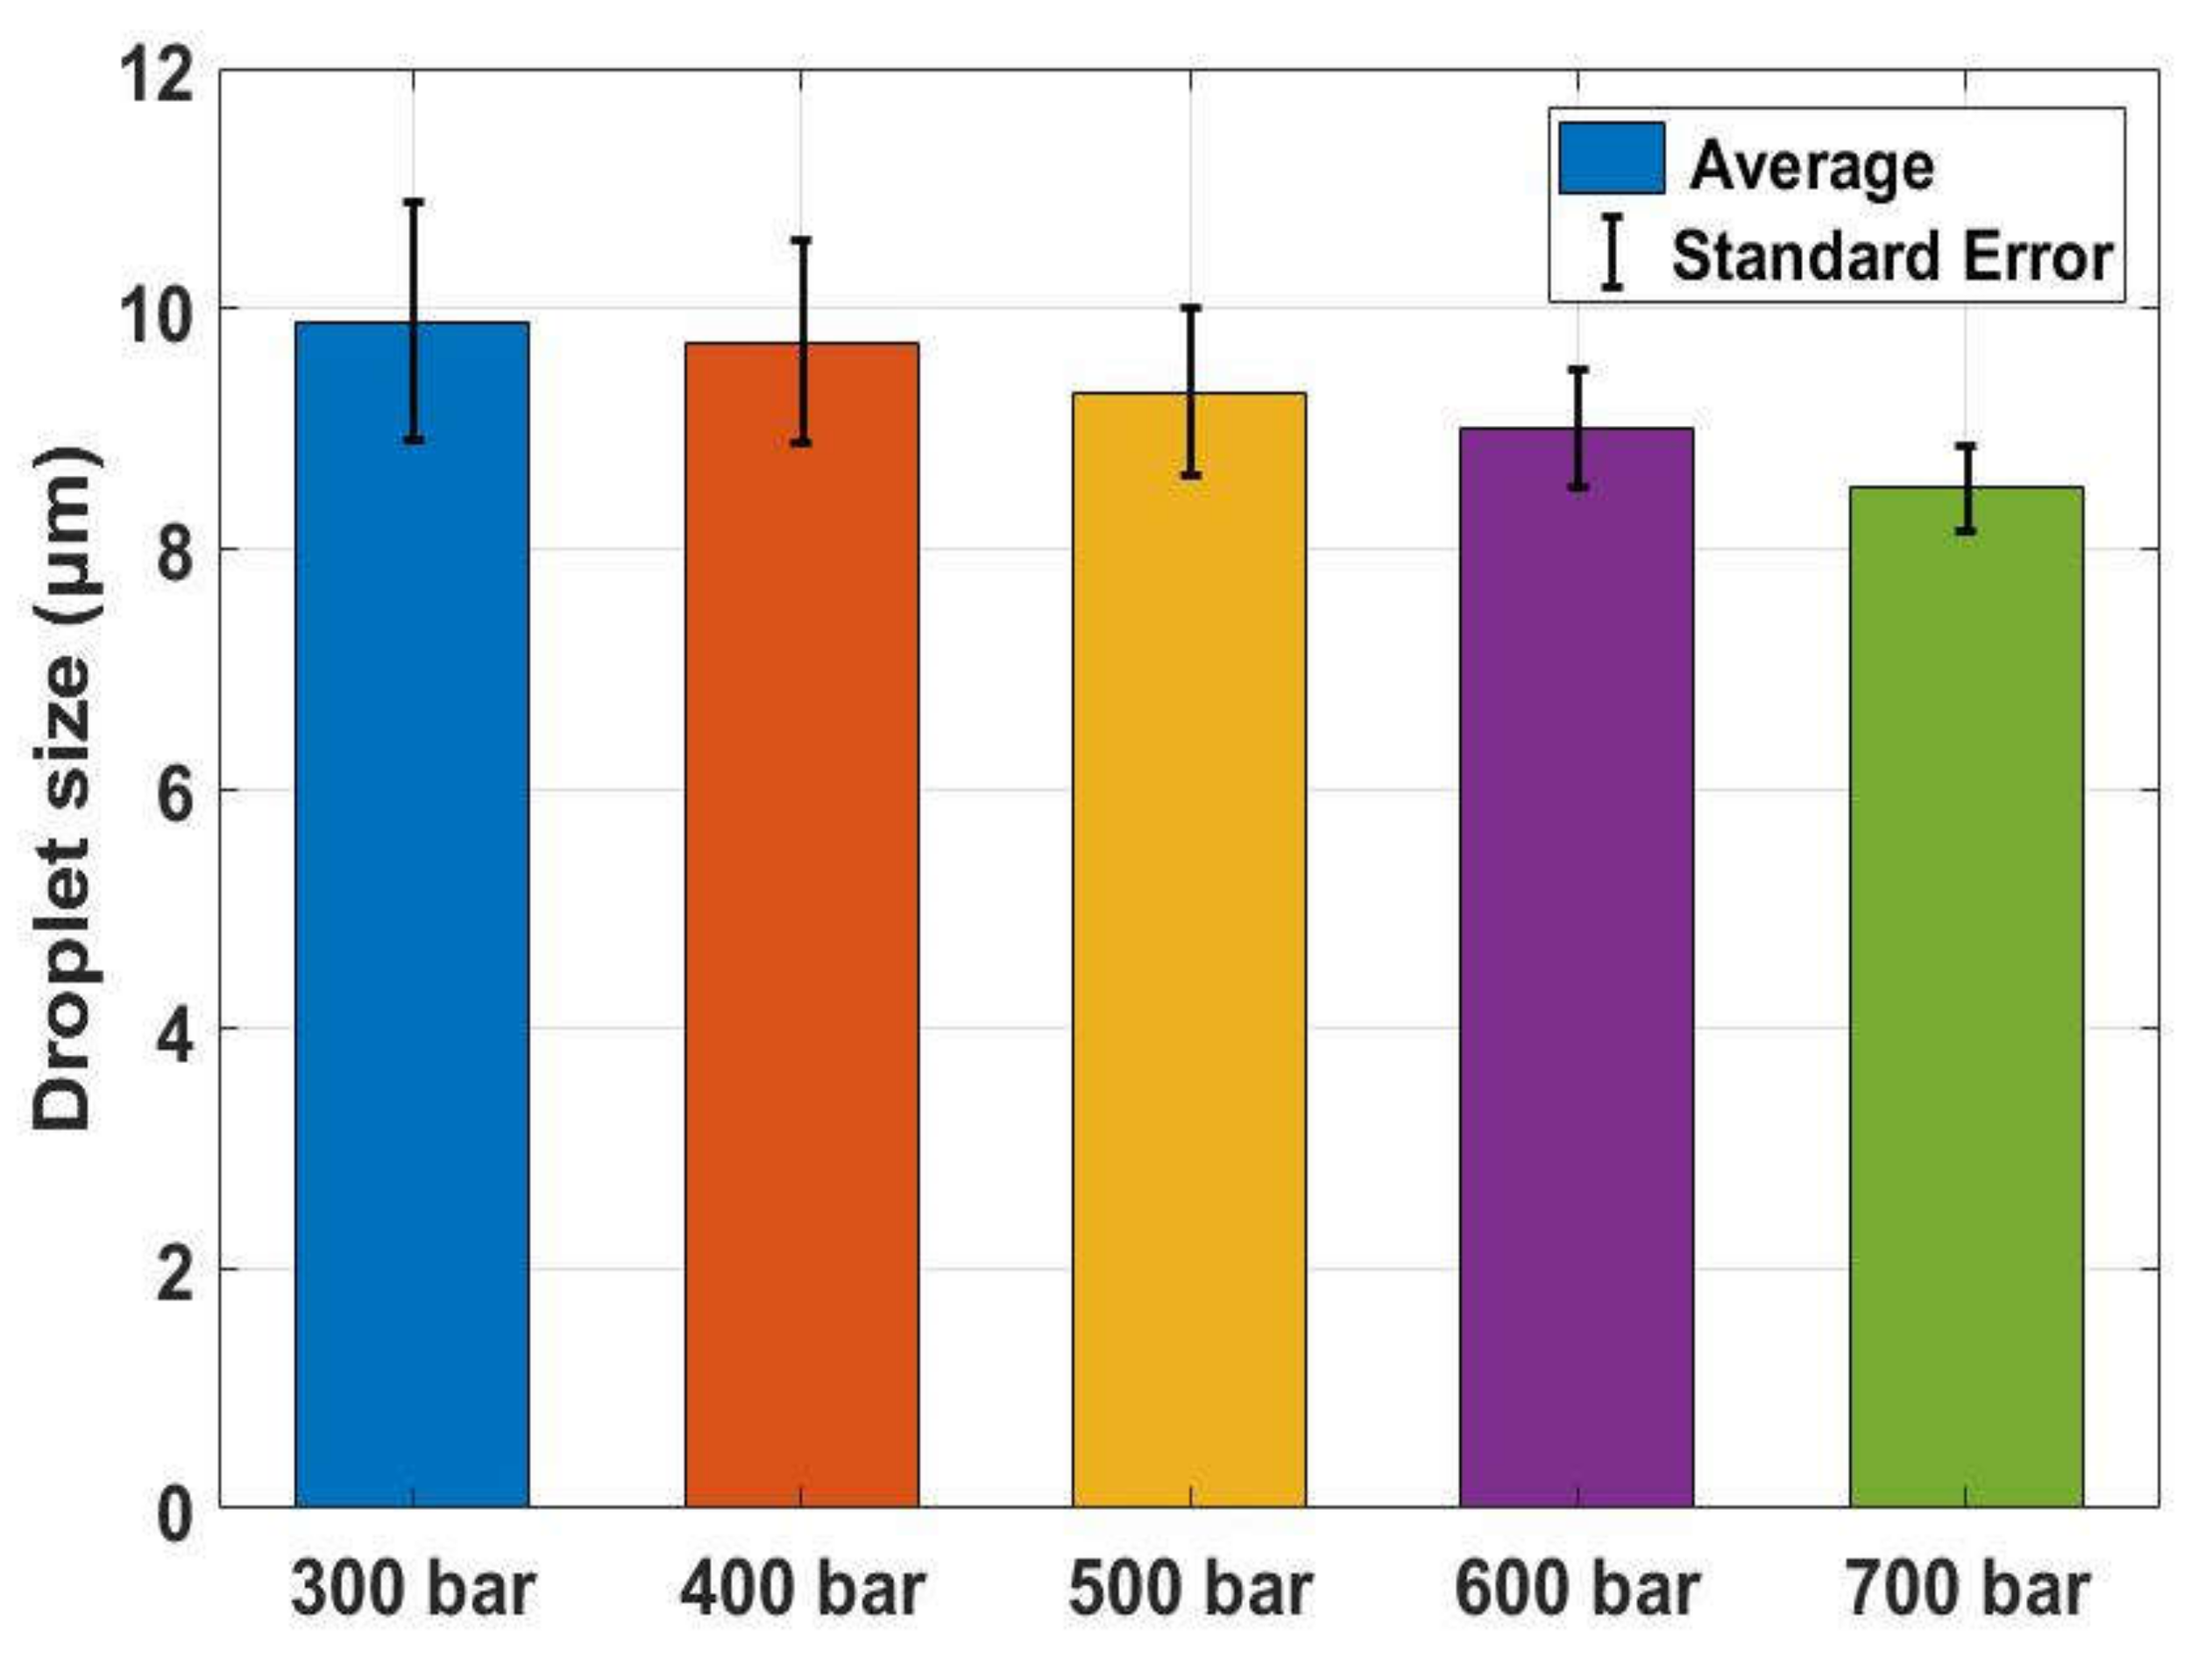
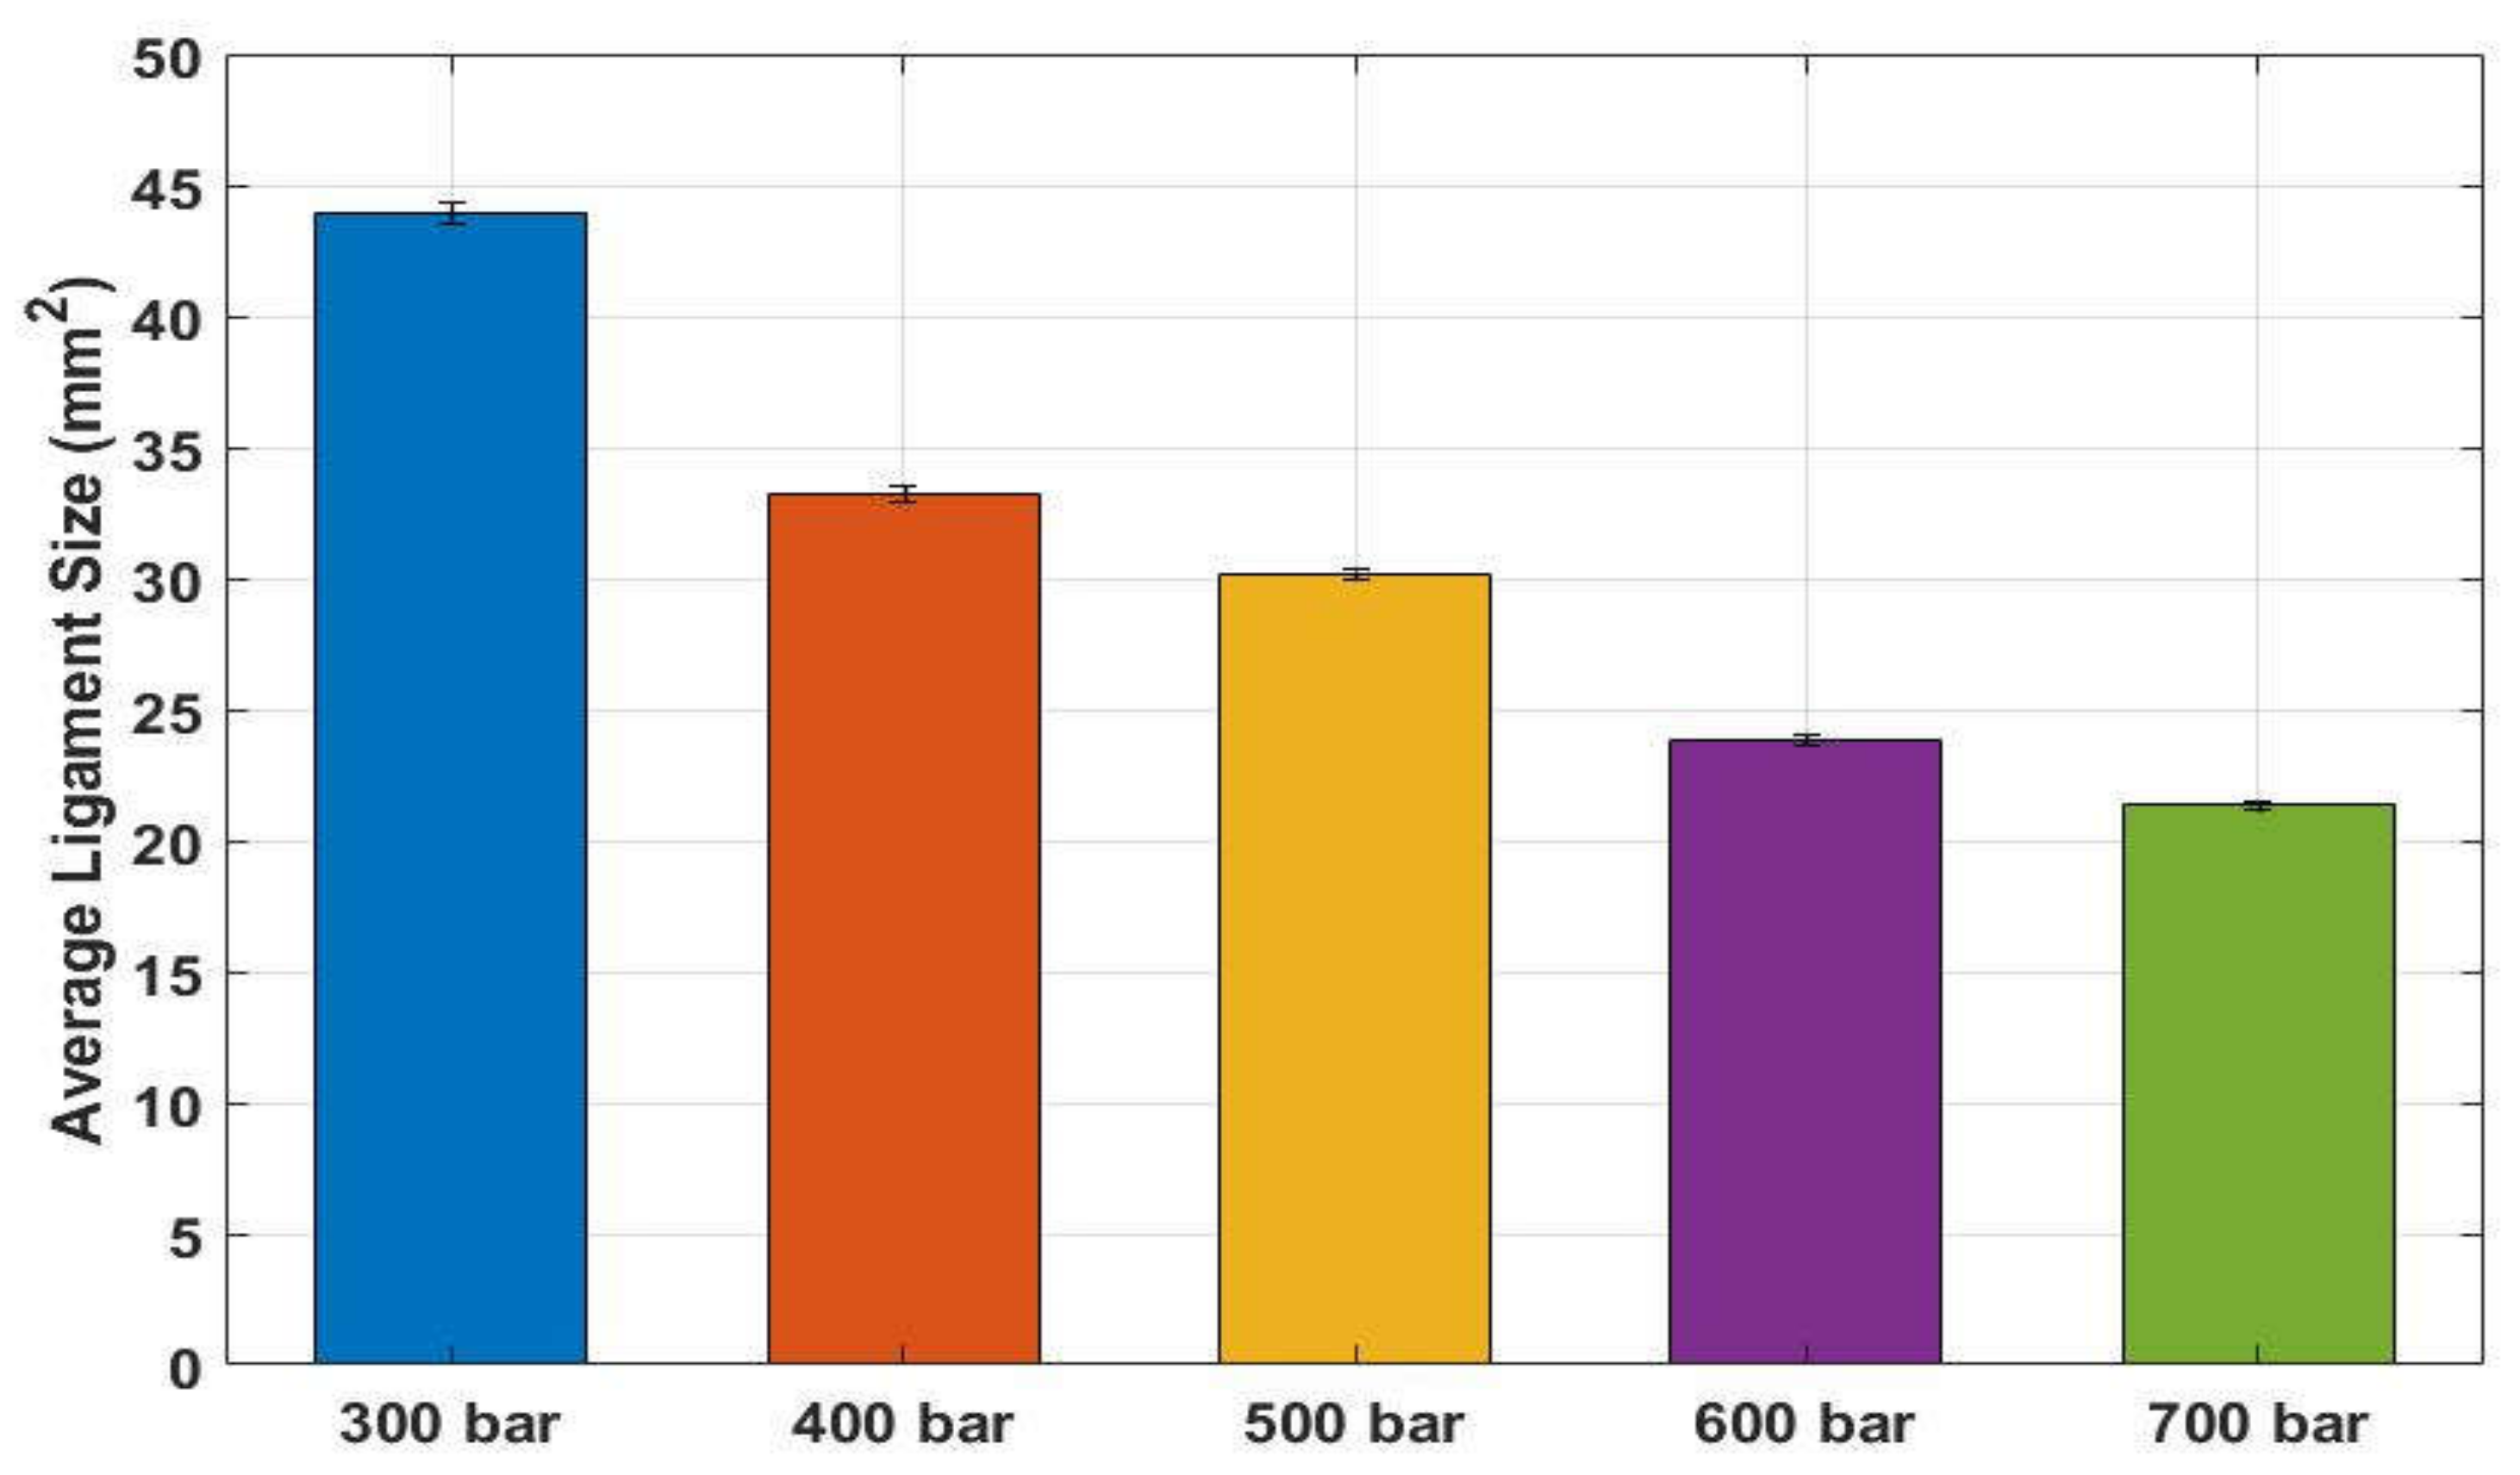
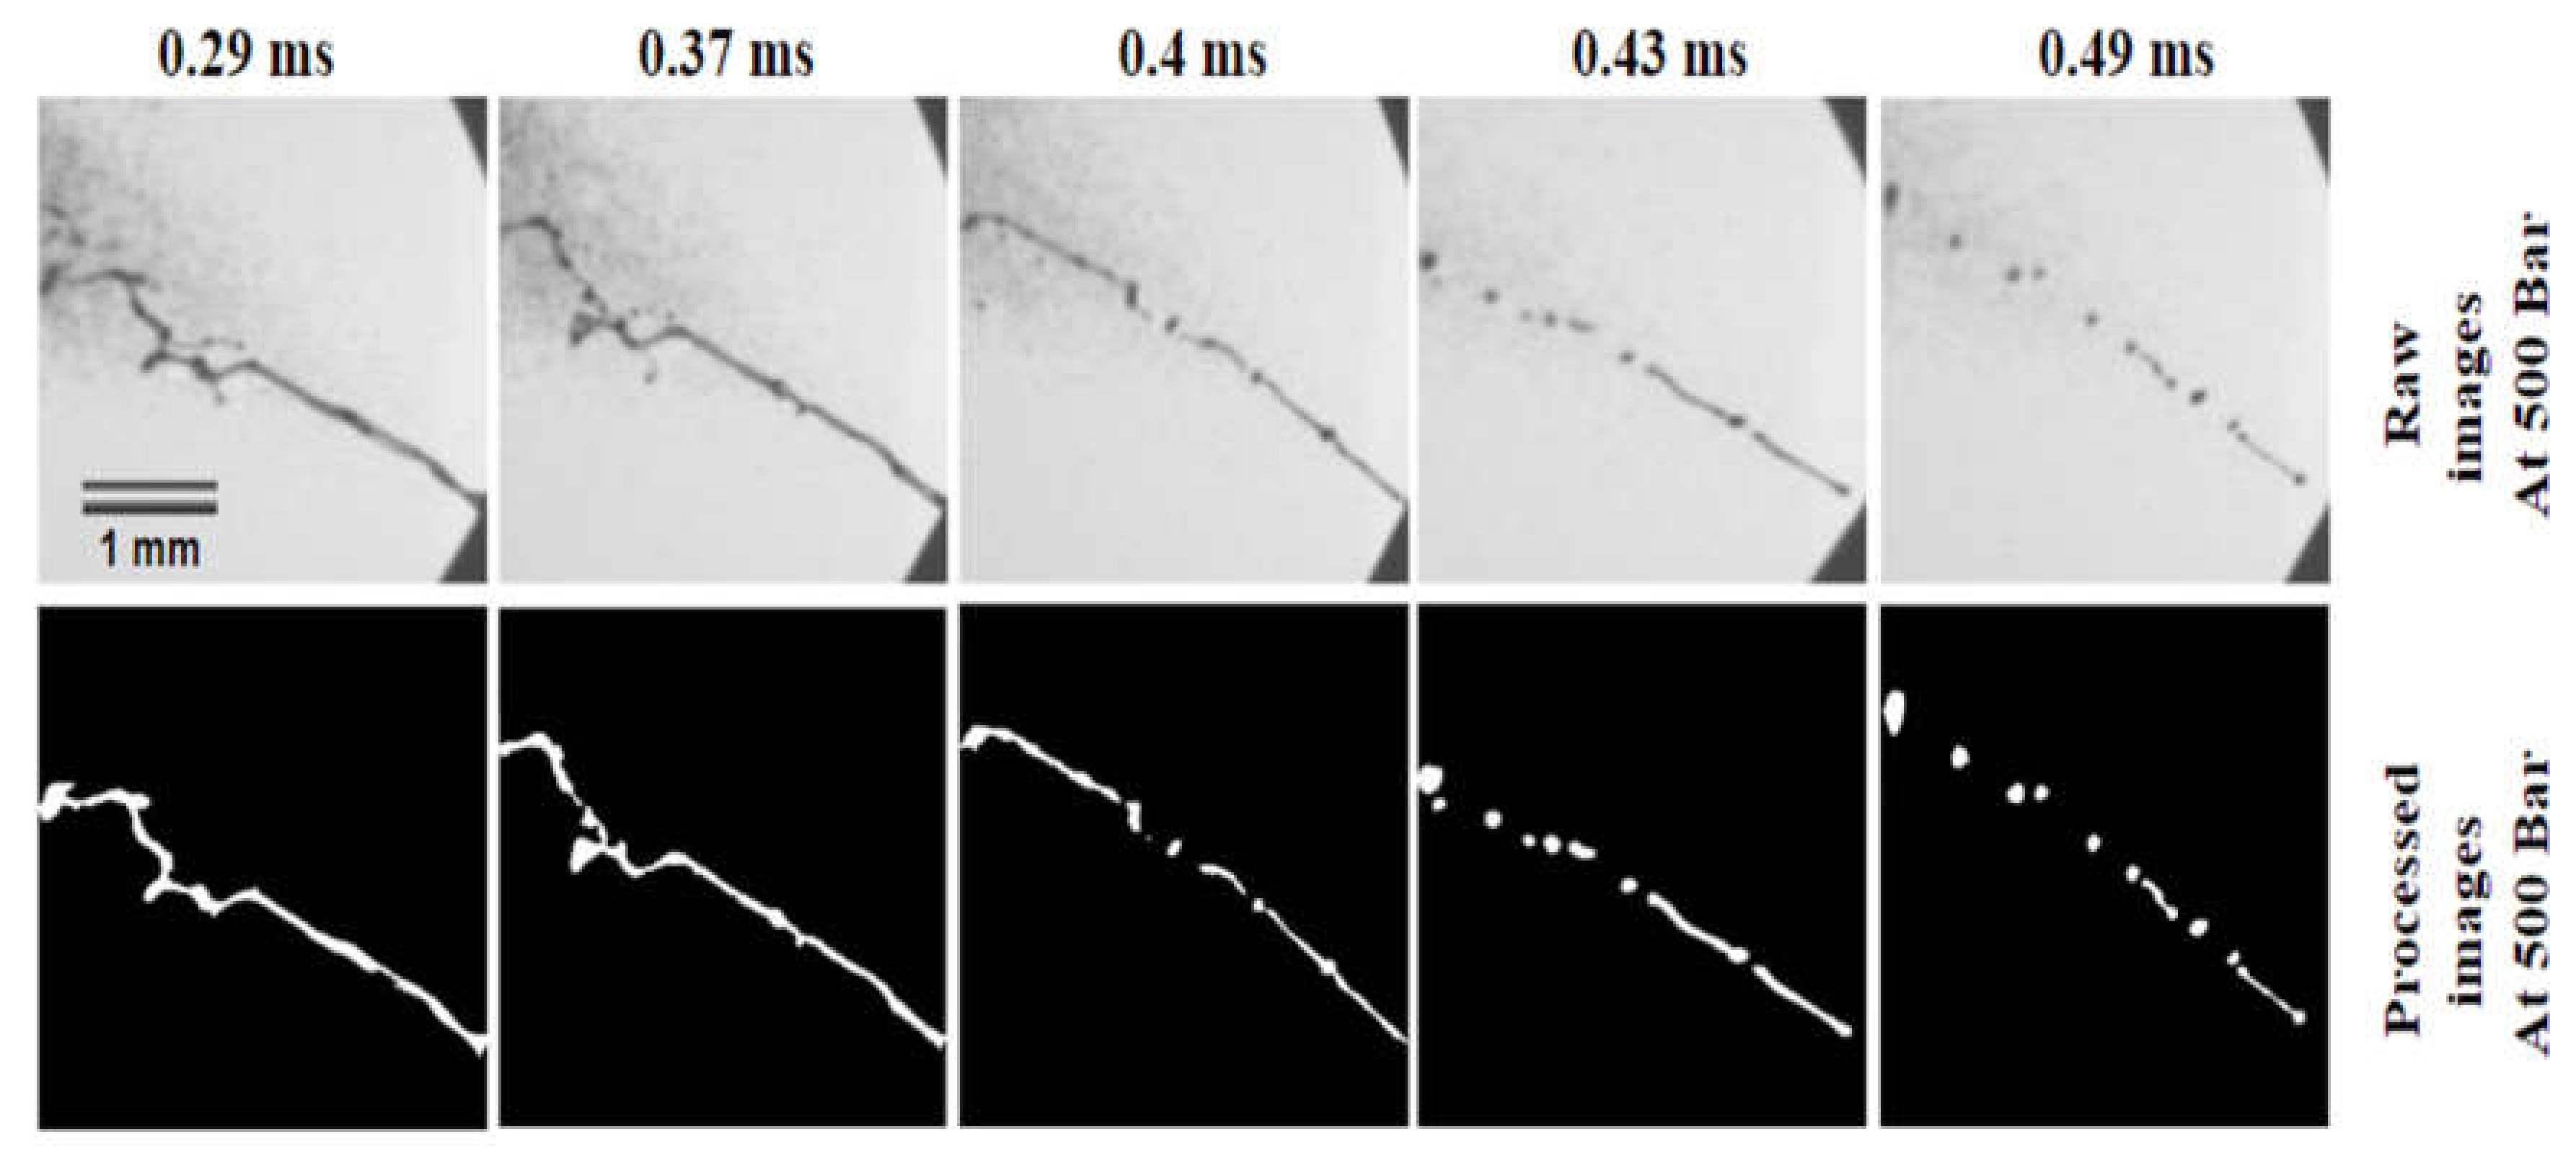
6.1.4. Droplet Size
6.1.5. Dribbling after the End of Injection (EOI)
7. Conclusions
- A higher injection pressure increased not only the axial but also the radial dispersion of the liquid phase fuel, thus resulting in longer penetration and wider cone angles. This is due to the higher momentum exchange between the liquid spray and ambient air.
- Droplets formed in the periphery of the spray displayed a decreased diameter from 10 μm to 8.5 μm as the injection pressure increased from 300 bar to 700 bar thanks to enhanced turbulence. This indicates an improved atomization process with a higher injection pressure.
- Higher injection pressure also showed potential benefits for engine application by reducing dribbling. The dribbling fuel and time were significantly reduced as injection pressure increased. This indicates that the formation of particulate matter emissions can be reduced by an enhanced dribbling process with higher injection pressure.
Author Contributions
Funding
Data Availability Statement
Conflicts of Interest
References
- Lee, S.; Park, S. Experimental study on spray break-up and atomization processes from GDI injector using high injection pressure up to 30 MPa. Int. J. Heat Fluid Flow 2014, 45, 14–22. [Google Scholar] [CrossRef]
- Agarwal, A.K.; Dhar, A.; Gupta, J.G.; Kim, W.I.; Lee, C.S.; Park, S. Effect of fuel injection pressure and injection timing on spray characteristics and particulate size-number distribution in a biodiesel fueled common rail direct injection diesel engine. Appl. Energy 2014, 130, 212–221. [Google Scholar] [CrossRef]
- Chen, P.C.; Wang, W.C.; Roberts, W.L.; Fang, T. Spray and atomization of diesel fuel and its alternatives from a single-hole injector using a common rail fuel injection system. Fuel 2013, 103, 850–861. [Google Scholar] [CrossRef]
- Varde, K.S.; Popa, D.M.; Varde, L.K. Spray Angle and Atomization in Diesel Sprays. 1984. Available online: https://www.jstor.org/stable/44734209 (accessed on 1 February 2024).
- Li, G.; Cao, J.; Li, M.; Quan, Y.; Chen, Z. Experimental study on the size distribution characteristics of spray droplets of DME/diesel blended fuels. Fuel Process. Technol. 2012, 104, 352–355. [Google Scholar] [CrossRef]
- Park, S.H.; Cha, J.; Kim, H.J.; Lee, C.S. Effect of early injection strategy on spray atomization and emission reduction characteristics in bioethanol blended diesel fueled engine. Energy 2012, 39, 375–387. [Google Scholar] [CrossRef]
- Das, M.; Sarkar, M.; Datta, A.; Santra, A.K. Study on viscosity and surface tension properties of biodiesel-diesel blends and their effects on spray parameters for CI engines. Fuel 2018, 220, 769–779. [Google Scholar] [CrossRef]
- Lee, C.S.; Park, S.W. An experimental and Numerical Study on Fuel Atomization Characteristics of High-Pressure Diesel Injection Sprays. Fuel 2002, 81, 2417–2423. [Google Scholar] [CrossRef]
- Tsolakis, A. Effects on particle size distribution from the diesel engine operating on RME-biodiesel with EGR. Energy Fuels 2006, 20, 1418–1424. [Google Scholar] [CrossRef]
- Garai, A.; Gangopadhyay, T.; Mukhopadhyay, A.; Sen, S. Spray characterisation of diesel using a hybrid atomizer. Energy Fuels 2006, 20, 1418–1424. [Google Scholar] [CrossRef]
- Agarwal, A.K.; Chaudhury, V.H. Spray characteristics of biodiesel/blends in a high pressure constant volume spray chamber. Exp. Therm. Fluid Sci. 2012, 42, 212–218. [Google Scholar] [CrossRef]
- Rashid, M.S.F.M.; Hamid, A.H.A.; Sheng, O.C.; Ghaffar, Z.A. Effect of inlet slot number on the spray cone angle and discharge coefficient of swirl atomizer. Procedia Eng. 2012, 41, 1781–1786. [Google Scholar] [CrossRef]
- Nagaoka, M.; Ueda, R.; Masuda, R.; Von Berg, E.; Tatschl, R. Modeling of Diesel Spray Atomization Linked with Internal Nozzle Flow. 2011. Available online: https://www.tytlabs.co.jp/en/review/issue/files/422_073nagaoka.pdf (accessed on 1 February 2024).
- Varde, K.S. Spray Cone Angle and its Correlation in a High Pressure Fuel Spray. Can. J. Chem. Eng. 1985, 63, 183–187. [Google Scholar] [CrossRef]
- Sovani, S.D.; Chou, E.; Sojka, P.E.; Gore, J.P.; Eckerle, W.A.; Crofts, J.D. High Pressure Effervescent Atomization: Effect of Ambient Pressure on Spray Cone Angle. Fuel 2001, 80, 427–435. [Google Scholar] [CrossRef]
- Jia, T.M.; Yu, Y.S.; Li, G.X. Experimental investigation of effects of super high injection pressure on diesel spray and induced shock waves characteristics. Exp. Therm. Fluid Sci. 2017, 85, 399–408. [Google Scholar] [CrossRef]
- Gülder, Ö.L.; Smallwood, G.J.; Snelling, D.R. Diesel Spray Structure Investigation by Laser Diffraction and Sheet Illumination. J. Engines 1992, 101, 1046–1053. [Google Scholar]
- Han, J.-S.; Lu, P.-H.; Xie, X.-B.; Lai, M.-C.; Henein, N.A. Investigation of Diesel Spray Primary Break-up and Development for Different Nozzle Geometries. J. Engines 2002, 111, 2528–2548. Available online: https://www.jstor.org/stable/44743268 (accessed on 1 February 2024).
- Turner, M.R.; Sazhin, S.S.; Healey, J.J.; Crua, C.; Martynov, S.B. A breakup model for transient Diesel fuel sprays. Fuel 2012, 97, 288–305. [Google Scholar] [CrossRef]
- Agarwal, A.; Trujillo, M.F. The effect of nozzle internal flow on spray atomization. Int. J. Engine Res. 2020, 21, 55–72. [Google Scholar] [CrossRef]
- Kulkarni, A.P.; Megaritis, T.; Ganippa, L.C. Insights on the morphology of air-assisted breakup of urea-water-solution sprays for varying surface tension. Int. J. Multiph. Flow 2020, 133, 103448. [Google Scholar] [CrossRef]
- Beale, J.C.; Reitz, R.D. Modeling spray atomization with the Kelvin-Helmholtz/Rayleigh-Taylor hybrid model. At. Sprays 1999, 9, 623–650. [Google Scholar] [CrossRef]
- Hwang, J.; Bae, C.; Patel, C.; Agarwal, A.; Gupta, T. Near Nozzle Flow and Atomization Characteristics of Biodiesel Fuels. In Proceedings of the International Powertrains, Fuels & Lubricants Meeting, Beijing, China, 16–19 October 2017; SAE Technical Paper. Volume 01. [Google Scholar]
- Roth, A.; Frantz, D.; Chaze, W.; Corber, A.; Berrocal, E. High-speed imaging database of water jet disintegration Part I: Quantitative imaging using liquid laser-induced fluorescence. Int. J. Multiph. Flow 2021, 145, 103641. [Google Scholar] [CrossRef]
- Moon, S.; Huang, W.; Li, Z.; Wang, J. End-of-injection fuel dribble of multi-hole diesel injector: Comprehensive investigation of phenomenon and discussion on control strategy. Appl. Energy 2016, 179, 7–16. [Google Scholar] [CrossRef]
- Suh, H.K.; Lee, C.S. Effect of cavitation in nozzle orifice on the diesel fuel atomization characteristics. Int. J. Heat Fluid Flow 2008, 29, 1001–1009. [Google Scholar] [CrossRef]
- Koci, C.; Dempsey, A.; Nudd, J.; Knier, B. Understanding Hydrocarbon Emissions in Heavy Duty Diesel Engines Combining Experimental and Computational Methods. SAE Int. J. Engines 2017, 10, 1093–1109. [Google Scholar] [CrossRef]
- Pos, R.; Avulapati, M.; Wardle, R.; Cracknell, R.; Megaritis, T.; Ganippa, L. Combustion of ligaments and droplets expelled after the end of injection in a multi-hole diesel injector. Fuel 2017, 197, 459–466. [Google Scholar] [CrossRef]
- Cha, Y.; Kim, S. PDE-based Interpolation Methods for Image Super Resolution. In Proceedings of the Future Generation Communication and Networking (FGCN 2007), Jeju, Republic of Korea, 6–8 December 2007. [Google Scholar]
- Zhou, X.; Li, T. Modeling of the entire processes of diesel spray tip penetration including the start- and end-of-injection transients. J. Energy Inst. 2021, 98, 271–281. [Google Scholar] [CrossRef]
- Chang, C.T.; Farrell, P.V. A Study on the Effects of Fuel Viscosity and Nozzle Geometry on High Injection Pressure Diesel Spray Characteristics. J. Engines 1997, 106, 558–567. Available online: https://www.jstor.org/stable/44730701 (accessed on 1 February 2024).
- Mithun, M.G.; Koukouvinis, P.; Gavaises, M. Numerical simulation of cavitation and atomization using a fully compressible three-phase model. Phys. Rev. Fluids 2018, 3, 064304. [Google Scholar] [CrossRef]
- Hamid, A.; Hussein, A.; Atan, R.; Rashid, H. Spray cone angle and air core diameter of hollow cone swirl rocket injector. IIUM Eng. J. 2011, 12. [Google Scholar] [CrossRef]
- Yu, S.; Yin, B.; Deng, W.; Jia, H.; Ye, Z.; Xu, B.; Xu, H. Experimental study on the spray characteristics discharging from elliptical diesel nozzle at typical diesel engine conditions. Fuel 2018, 221, 28–34. [Google Scholar] [CrossRef]
- Bao, J.; Wang, H.; Wang, R.; Wang, Q.; Di, L.; Shi, C. Comparative experimental study on macroscopic spray characteristics of various oxygenated diesel fuels. Energy Sci. Eng. 2023, 11, 1579–1588. [Google Scholar] [CrossRef]
- Ming, Z.; Liu, B.; Zhang, X.; Wen, M.; Liu, H.; Cui, Y.; Ye, Y.; Wang, C.; Jin, C.; Yusuf, A.A.; et al. Study of methanol spray flame structure and combustion stability mechanisms by optical phenomenology and chemical kinetics. Fuel Process. Technol. 2023, 252, 252107947. [Google Scholar] [CrossRef]
- Reitz, R.D.; Diwakar, R. Structure of High-Pressure Fuel Sprays. 1987. Available online: https://www.sae.org/publications/technical-papers/content/870598/ (accessed on 1 February 2024).
- Arai, M.; Shimizu, M.; Hiroyasu, H. Break-up length and spray angle of high speed jet. In Proceedings of the 3rd International Conference on Liquid Atomisation and Spray Systems, London, UK, 8–10 July 1985. [Google Scholar]
- Han, D.; Wang, C.; Duan, Y.; Tian, Z.; Huang, Z. An experimental study of injection and spray characteristics of diesel and gasoline blends on a common rail injection system. Energy 2014, 75, 513–519. [Google Scholar] [CrossRef]
- Farrell, P.V.; Chang, C.T.; Su, T.F. High Pressure Multiple Injection Spray Characteristics. SAE Trans. 1996, 105, 1271–1280. [Google Scholar]
- Liu, X.; Xue, R.; Ruan, Y.; Chen, L.; Zhang, X.; Hou, Y. Effects of injection pressure difference on droplet size distribution and spray cone angle in spray cooling of liquid nitrogen. Cryogenics 2017, 83, 57–63. [Google Scholar] [CrossRef]
- Manin, J.; Bardi, M.; Pickett, L.M.; Dahms, R.N.; Oefelein, J.C. Microscopic investigation of the atomization and mixing processes of diesel sprays injected into high pressure and temperature environments. Fuel 2014, 134, 531–543. [Google Scholar] [CrossRef]
- Mlkvik, M.; Stähle, P.; Schuchmann, H.P.; Gaukel, V.; Jedelsky, J.; Jicha, M. Twin-fluid atomization of viscous liquids: The effect of atomizer construction on breakup process, spray stability and droplet size. Int. J. Multiph. Flow 2015, 77, 19–31. [Google Scholar] [CrossRef]
- Doudou, A.; Maslouhi, A. A Macro-Microscopic Investigation of High-Pressure Sprays Injected by a Common Rail System. J. Mech. Sci. Technol. 2007, 21, 1284–1292. [Google Scholar] [CrossRef]
- Deshmukh, D.; Ravikrishna, R.V. Studies on microscopic structure of diesel sprays under atmospheric and high gas pressures. Int. J. Spray Combust. Dyn. 2014, 6, 199–220. [Google Scholar] [CrossRef]
- Chatzigiannakis, E.; Jaensson, N.; Vermant, J. Thin liquid films: Where hydrodynamics, capillarity, surface stresses and intermolecular forces meet. Curr. Opin. Colloid Interface Sci. 2021, 53, 101441. [Google Scholar] [CrossRef]
- Crua, C.; Shoba, T.; Heikal, M.; Gold, M.; Higham, C. High-Speed Microscopic Imaging of the Initial Stage of Diesel Spray Formation and Primary Breakup. In Proceedings of the SAE 2010 Powertrains Fuels & Lubricants Meeting, San Diego, CA, USA, 25–27 October 2010. [Google Scholar]
- Crua, C.; Heikal, M.R.; Gold, M.R. Microscopic imaging of the initial stage of diesel spray formation. Fuel 2015, 157, 140–150. [Google Scholar] [CrossRef]
- Gavaises, M.; Murali-Girija, M.; Rodriguez, C.; Koukouvinis, P.; Gold, M.; Pearson, R. Numerical simulation of fuel dribbling and nozzle wall wetting. Int. J. Engine Res. 2022, 23, 132–149. [Google Scholar] [CrossRef]
- Bae, C.; Kang, J. The structure of a break-up zone in the transient diesel spray of a valve-covered orifice nozzle. Int. J. Engine Res. 2006, 7, 319–334. [Google Scholar] [CrossRef]
- Gong, H.; Huang, W.; Gao, Y.; Wang, J.; Arioka, A.; Sasaki, Y. End-of-injection fuel dribbling dynamics of multi-hole GDI injector. Fuel 2022, 317, 123406. [Google Scholar] [CrossRef]


Disclaimer/Publisher’s Note: The statements, opinions and data contained in all publications are solely those of the individual author(s) and contributor(s) and not of MDPI and/or the editor(s). MDPI and/or the editor(s) disclaim responsibility for any injury to people or property resulting from any ideas, methods, instructions or products referred to in the content. |
© 2024 by the authors. Licensee MDPI, Basel, Switzerland. This article is an open access article distributed under the terms and conditions of the Creative Commons Attribution (CC BY) license (https://creativecommons.org/licenses/by/4.0/).
Share and Cite
El Marnissi, Y.; Hwang, J. Microscopic Imaging on Diesel Spray and Atomization Process. Processes 2024, 12, 359. https://doi.org/10.3390/pr12020359
El Marnissi Y, Hwang J. Microscopic Imaging on Diesel Spray and Atomization Process. Processes. 2024; 12(2):359. https://doi.org/10.3390/pr12020359
Chicago/Turabian StyleEl Marnissi, Yassine, and Joonsik Hwang. 2024. "Microscopic Imaging on Diesel Spray and Atomization Process" Processes 12, no. 2: 359. https://doi.org/10.3390/pr12020359