Article

Power Generation Prediction for Photovoltaic System of Hose-Drawn Traveler Based on Machine Learning Models

1
College of Intelligent Manufacturing, Yangzhou Polytechnic Institute, Yangzhou 225127, China
2
College of Water Resources and Architectural Engineering, Northwest A&F University, Yangling 712100, China
3
Jiangsu Province Engineering Research Center of Intelligent Application for Advanced Plastic Forming, Yangzhou 225127, China
4
School of Mechanical Engineering, Yangzhou University, Yangzhou 225127, China
*
Author to whom correspondence should be addressed.
Processes 2024, 12(1), 39; https://doi.org/10.3390/pr12010039
Submission received: 25 November 2023 / Revised: 17 December 2023 / Accepted: 19 December 2023 / Published: 22 December 2023
(This article belongs to the Special Issue Solar Energy for Sustainable Agriculture)

Abstract

:
A photovoltaic (PV)-powered electric motor is used for hose-drawn traveler driving instead of a water turbine to achieve high transmission efficiency. PV power generation (PVPG) is affected by different meteorological conditions, resulting in different power generation of PV panels for a hose-drawn traveler. In the above situation, the hose-drawn traveler may experience deficit power generation. The reasonable determination of the PV panel capacity is crucial. Predicting the PVPG is a prerequisite for the reasonable determination of the PV panel capacity. Therefore, it is essential to develop a method for accurately predicting PVPG. Extreme gradient boosting (XGBoost) is currently an outstanding machine learning model for prediction performance, but its hyperparameters are difficult to set. Thus, the XGBoost model based on particle swarm optimization (PSO-XGBoost) is applied for PV power prediction in this study. The PSO algorithm is introduced to optimize hyperparameters in XGBoost model. The meteorological data are segmented into four seasons to develop tailored prediction models, ensuring accurate prediction of PVPG in four seasons for hose-drawn travelers. The input variables of the models include solar irradiance, time, and ambient temperature. The prediction accuracy and stability of the model is then assessed statistically. The predictive accuracy and stability of PV power prediction by the PSO-XGBoost model are higher compared to the XGBoost model. Finally, application of the PSO-XGBoost model is implemented based on meteorological data.

Graphical Abstract

1. Introduction

The application of a hose-drawn traveler (Figure 1) driven by photovoltaic (PV)-powered electric motor is becoming increasingly widespread [1]. The PV power generation (PVPG) system used in the hose-drawn traveler is illustrated in Figure 2. The power generation of PV panels is subjected to meteorological conditions such as solar irradiance and ambient temperature [2]. In some regions with poor meteorological conditions, the power generation cannot meet the electricity demand of the hose-drawn traveler. In these regions, it is necessary to enhance the PV panel capacity. However, the determination of reasonable configuration in PV panel capacity of a hose-drawn traveler is often conducted based on experience currently [3,4], resulting in excessive PV panel capacity and wasted costs or low power supply reliability. Therefore, in order to achieve precise deployment of PV panel capacity for a hose-drawn traveler and effectively reduce costs, it is urgent to develop a method for predicting PVPG based on local meteorological conditions.
There are many studies on improving the performance of power controllers and enhancing the stability of PVPG. Karchi et al. [5] utilized the adaptive least mean square (LMS) algorithm to develop controllers for maximum power point tracking (MPPT) and inverter control in a solar PV system. The findings demonstrated that customizing the LMS algorithm according to the specific application can effectively control and enhance the performance of solar PV systems. It was observed that the LMS algorithm exhibits superior performance with a weight adaptation step size of 0.01. Das et al. [6] introduced a solar PV system integrated with a shunt hybrid active filter to mitigate current harmonics and utilize the active power generated by the PV system. The findings indicated that the proposed system effectively maximizes the power output of the PV unit and compensates for current harmonics in nonlinear loads. The adaptive notch filters–recursive least square approach demonstrated significant improvements in reactive power control and total harmonic distortion reduction compared to the adaptive notch filters–least mean square method. Houran et al. [7] analyzed unbalanced power quality conditions in solar PV arrays and a battery energy storage system integrated with an active power filter module. The PSO algorithm was employed as a supplementary method for validation and comparison of the results obtained from the grey wolf optimization process. The result shows that the proposed approach can decrease the load current harmonics to the standard range. The above-mentioned research has made breakthrough progress in the control of PVPG, which is of significant reference value for ensuring power stability. In agriculture, different regions and seasons have a significant impact on the power generation of PV systems, making accurate power prediction for PV generation under different conditions also crucial.
The prediction models can be classified into several categories such as time series models [8], regression models [9], and machine learning models [10]. Machine learning models, represented by the artificial neural network (ANN) [11,12,13], are widely used for PV power prediction. An approach involving the optimized and diversified ANN was proposed for PV power prediction [14]. A hybrid neural network was proposed to model the circuit parameters concerned [15]. Rosato et al. [16] presented three techniques based on neural and fuzzy neural networks to predict the PV power. The ANN model shows its advantages in robustness, memory, nonlinear mapping, and self-learning ability. However, it is also disadvantaged by the low speed of convergence and the susceptibility to local optimum [17]. To address these limitations, support vector machine (SVM) models have been proposed in many studies for prediction. For instance, Eseye et al. [18] put forward a hybrid prediction model that combined wavelet transform, particle swarm optimization (PSO), and SVM for the short-term PV power prediction of a real microgrid PV system. The prediction accuracy of this model was then compared with those of other predicting strategies. The obtained results demonstrated that this approach outperforms the other algorithms. Li et al. [19] applied an improved hybrid multi-verse optimizer SVM model to PV power prediction. Their results showed that this hybrid algorithm has higher optimization ability and stability compared with the other algorithms. Malvoni et al. [20] used the least squares SVM (LS-SVM) to predict the PV power and then validated the model on historical data. Their results showed that this technique has very high performance in prediction. Kazem et al. [21] predicted the PV power using three neural mathematical models. Their results demonstrated that the generalized feedforward networks have higher prediction accuracy in comparison with self-organizing feature maps, multilayer perceptron, and support vector machines. However, this algorithm requires excessive machine memory and runtime when it is used for the large-scale training of samples. Extreme gradient boosting (XGBoost), gradient boosting decision tree (GBDT), and random forest (RF) are all classed as the ensemble machine learning model based on decision tree. Compared with the ANN and SVM, they require fewer parameters and less running time, show a stronger robustness to over-fitting, and achieve a better predictive performance [22,23]. For this reason, they have been widely used for predicting the daily reference evapotranspiration [24,25], the spatial distribution of heavy metals in soils [26], and the daily global solar radiation [27,28]. However, this model involves many hyperparameters that are difficult to adjust manually, which limits its applications.
In this study, to minimize the errors between the actual value and the predictive value of the verification set, integrated tree-based machine learning models are used to predict power generation by the PV system of the hose-drawn traveler.
PVPG is an important basis for the PV capacity configuration of the hose-drawn traveler power supply system. Therefore, there is a high demand for accurate prediction of PVPG. XGBoost is a highly effective machine learning model for prediction. However, configuring its hyperparameters can be challenging. PSO has been widely utilized due to its robustness, fewer required computations, and efficient global search solutions. The PSO based XGBoost (PSO-XGBoost) algorithm has high predictive accuracy, fast training speed, simple implementation process, and the capability of hyperparameter adaptive adjustment. Thus, this paper adopts the PSO-XGBoost algorithm for PV power prediction. The XGBoost model is then evaluated comparatively. The predictive accuracy and stability of the proposed model are analyzed in four seasons of a year. Finally, the PSO-XGBoost model is utilized to estimate the daily average PVPG.
The objective of this study is to determine the PVPG at the location of hose-drawn travelers through establishing PV power prediction models of four seasons. The predicted PV power can serve as a basis for further configuration of PV capacity for hose-drawn travelers in different regions. The main contribution of this paper is the introduction of a PV power prediction method based on meteorological data and PSO-XGBoost model. In this method, the meteorological data are divided into four seasons to obtain prediction models for each season. This enables accurate prediction of PVPG for different seasons and precise allocation of PV panel capacity for a hose-drawn traveler. In addition, this method is applied to calculate the daily average PV power generation in 80 regions across China. This research can provide reference data for the PV capacity configuration of the hose-drawn traveler power supply system.
The rest of this paper is organized as follows: in Section 2, PSO-XGBoost methodology and the construction processes of the prediction model are described. In Section 3, the accuracy and stability of the PV power prediction and the validation results are analyzed. In Section 4, the application of the proposed method is carried out. The discussion is provided in Section 5. Finally, conclusions and proposals for future work are provided in Section 6.

2. Materials and Methods
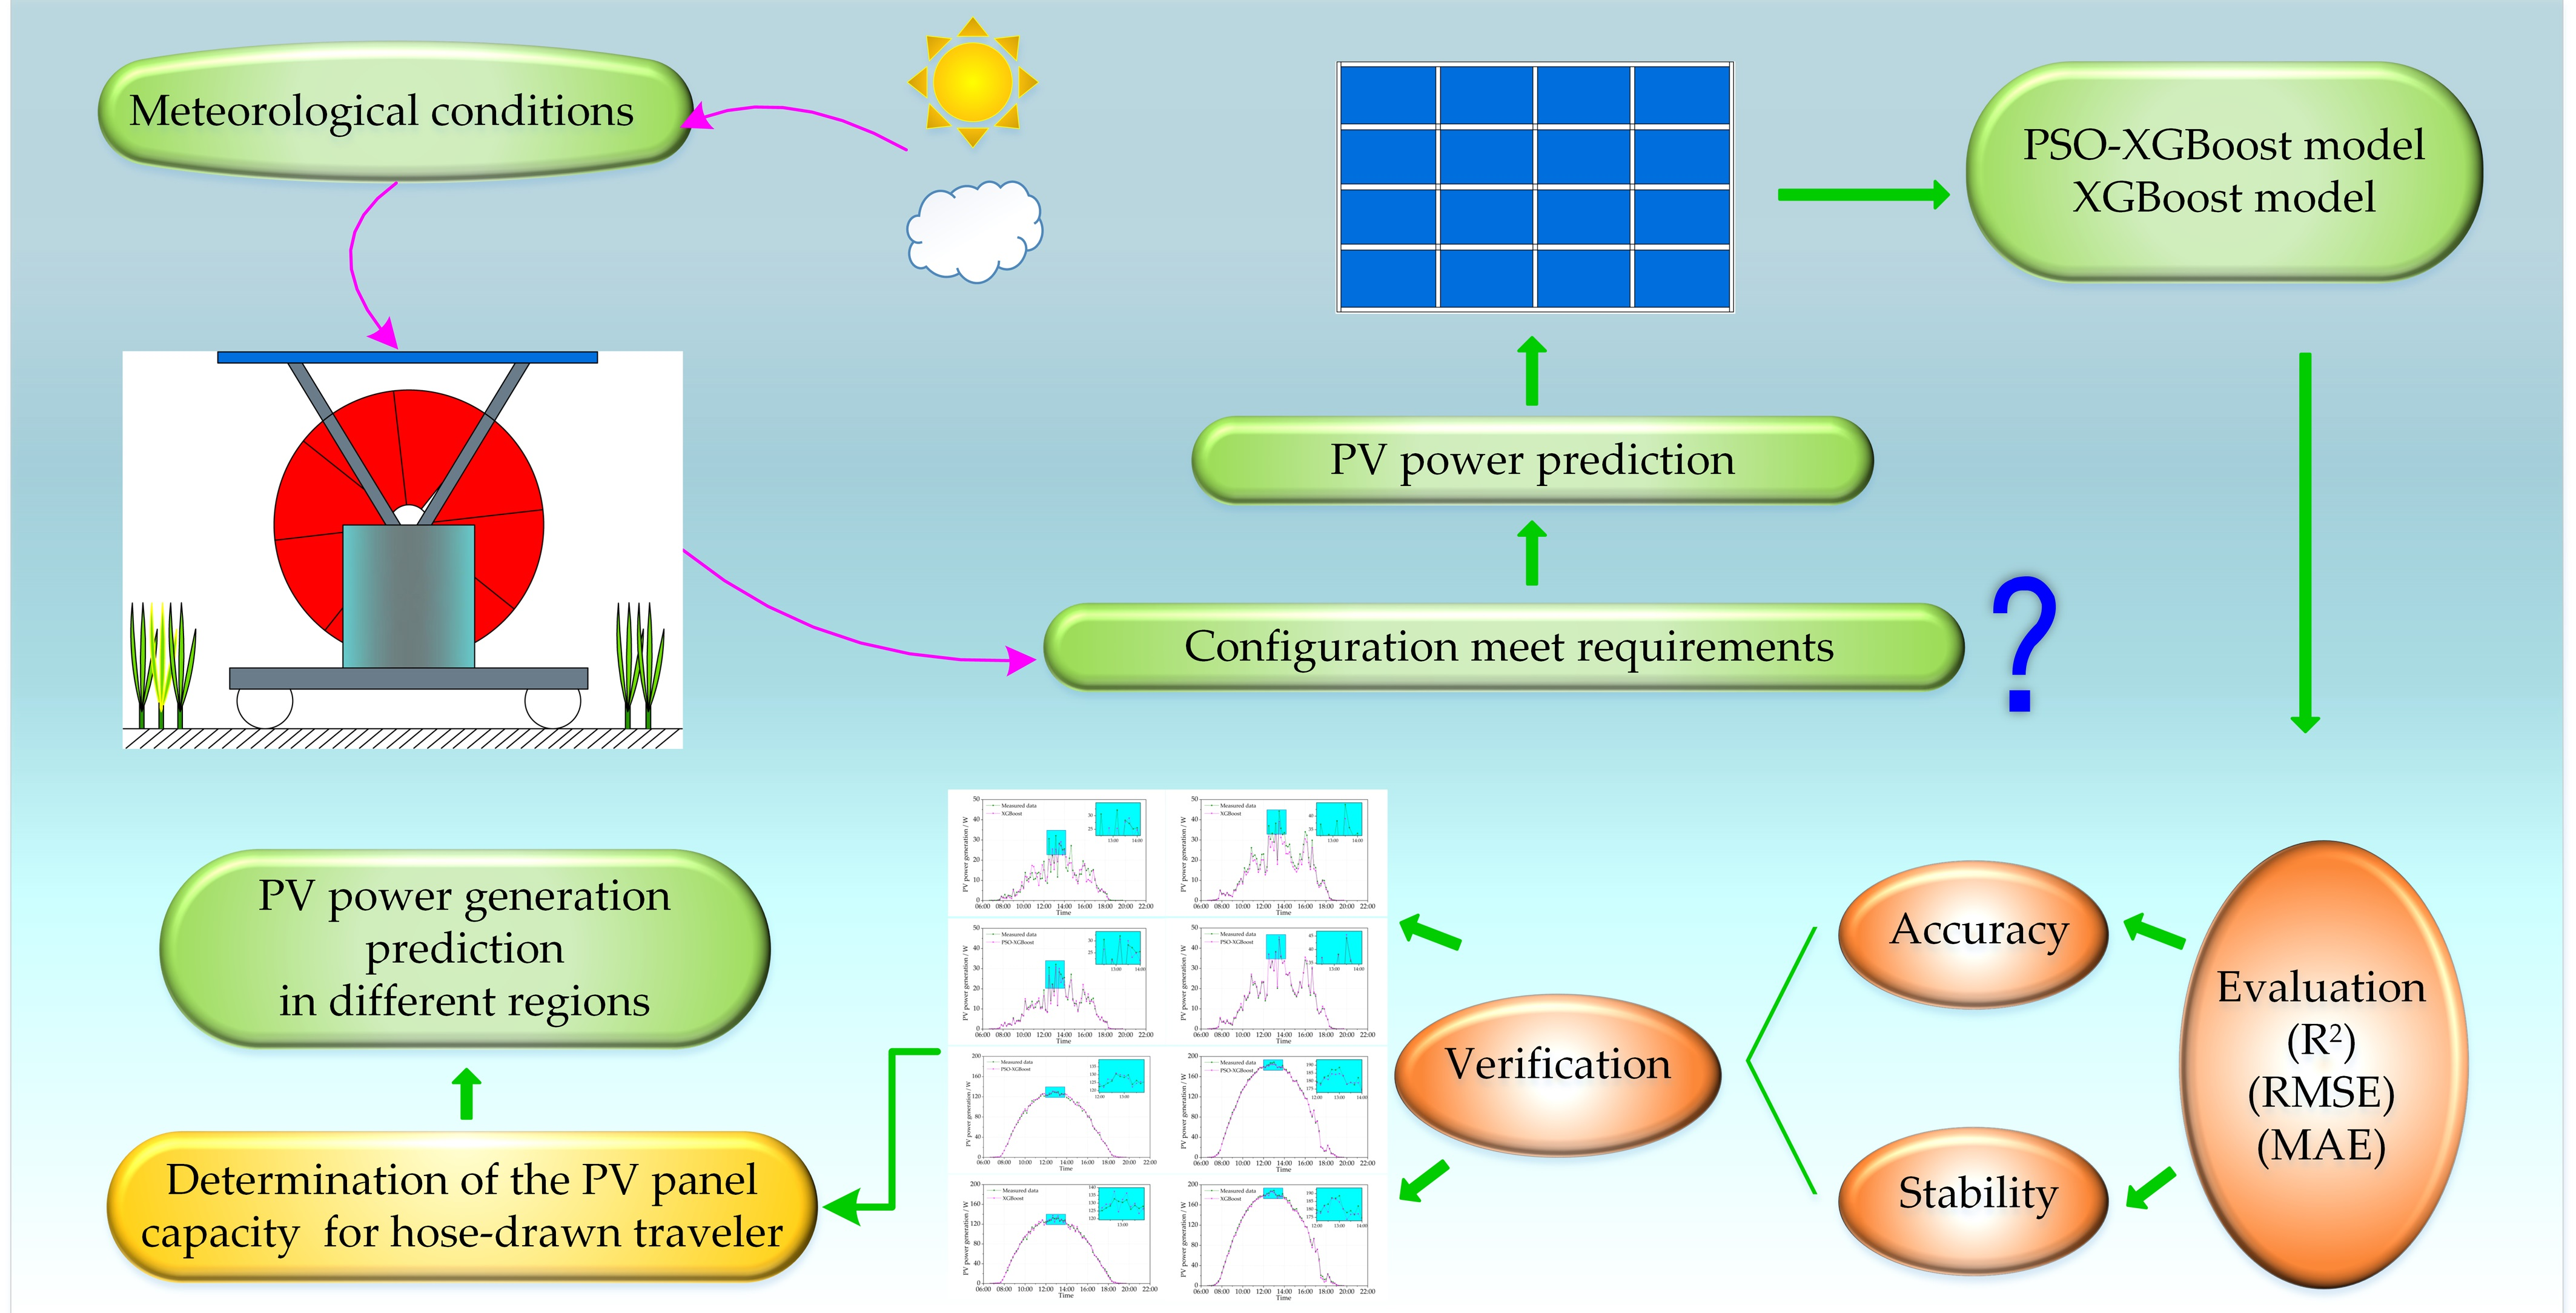
2.1. Methodology

2.1.1. PSO-XGBoost Model

XGBoost is developed based on the gradient decision tree. Compared with the conventional model, XGBoost can conduct parallel computing with multi-core CPUs. Thus, it has a strong advantage in terms of computational speed. In addition, compared with the first-order expansion, XGBoost has second-order derivative expansion and its accuracy is significantly increased when optimizing the function of the target error.
The XGBoost model can be considered as an accumulation model consisting of K decision trees. Each decision tree function of the input vector set D = {(xi, yi)} used for PV power prediction is represented by fk. After stacking K decision trees, the predicted PV power of the i-th sample is given by Equation (1) [27].
y ^ i k = k = 1 K f k ( x i ) = k = 1 K w j k   ( f 0   =   0 )
where j = φ(xi) denotes the leaf node of the k-th decision tree and ω denotes the scores vector in the leaves.
The error function of all the samples is then summed to obtain S:
S = i = 1 n s ( y i , y ^ i K ) + k = 1 K Ω ( f k )
Ω ( f ) = γ Z + 1 2 λ w 2
where  s ( y i , y ^ i k )  is the loss function, γ and λ are hyperparameters, Z is the amount of leaf nodes, and Ω(f) is a regular term.
According to Equation (2), after the superposition of the k-th decision tree, the obtained loss function is expressed as:
S k = i = 1 n s ( y i , y ^ i k 1 + f k ( x i ) ) + Ω ( f k ) + a
Equation (4) is then expanded by Taylor series:
S k = i = 1 n ( s ( y i , y ^ i k 1 ) + u i f k ( x i ) ) + 1 2 v i f k 2 ( x i ) + Ω ( f k ) + a
where:
u i = s ( y i , y ^ i k 1 ) / y ^ i k 1
v i = 2 s ( y i , y ^ i k 1 ) / y ^ i 2 ( k 1 )
During the derivation of the minimum value, the constant term in Equation (5) has no effect on the result. Thus, after removing the constant term, the simplified objective function is obtained:
S k = i = 1 n ( u i f k ( x i ) + 1 2 v i f k 2 ( x i ) ) + Ω ( f k )
Due to the fact that  f k ( x i ) = w j k , Sk is given by:
S k = i = 1 n ( u i w j k + 1 2 v i ( w j k ) 2 ) + γ Z + 1 2 j = 1 Z ( w j k ) 2
The k-th tree contains a leaf node in the sample set Ij (i.e., iIj) and, therefore, Sk can be expressed as:
S k = j = 1 Z ( ( i I i u i ) w j k ) 2 + 1 2 ( ( i I i v i ) + λ ) ( w j k ) 2 ) + γ Z
Assuming  U j = i I i u i V j = i I i v i , the value obtained by solving Equation (10) and the minimum value of Sk are shown in Equations (11) and (12).
w j k = U j V i + λ
S k = 1 2 j = 1 Z U j 2 V i + λ
As γ, λ, and Z are unknown results, it is necessary to further use the obtained results to calculate the shape of the tree that the sample set can produce.
In the XGBoost model, the process of generating a tree is consistent with the decision tree, and only the selection criteria need to be changed from information gain to the objective function. The optimal splitting node of the feature is then obtained as:
G = 1 2 ( U L 2 V L + λ + U R 2 V R + λ ( U L + U R ) 2 V R + V L + λ )
where G is the information gain, UL is the first-order partial derivative sum on the left side of the split node, VL is the partial derivatives on the left of the split node, UR is the first-order partial derivative sum on the right, and VR is the partial derivatives on the right.
Using this model, the decision tree of the k-th weak classifier can be constructed based on the depth d of the set tree, and the previously mentioned unknown parameters can be obtained. To prevent all learning deficiencies, a learning rate η is added to Equation (1). By setting a learning rate, the learning model can be obtained:
y ^ i K = k = 1 K η f k ( x i )
In this model, the parameters that need to be set are K, d, η, γ, and λ. When the sample is known, the parameter setting is the key factor of the model accuracy. It is difficult to find the precise parameters by artificial settings. Therefore, this study uses the PSO method to find optimal parameters [1]. The objective function is the square of the difference between the estimated value and the actual value of all the sample data:
E = i = 1 n ( F ( K , d , η , λ , γ , x i ) y i ) 2
where K ≥ 1, η∈[0, 1], d∈[0, ∞], and γ, λ ≥ 0.

2.1.2. Statistical Indicator

The coefficient of determination (R2), the root mean squared error (RMSE), and the mean absolute error (MAE) are the evaluation indicators for PV power prediction:
R 2 = i = 1 n E i E i ¯ M i M i ¯ 2 i = 1 n E i E i ¯ 2 i = 1 n M i M i ¯ 2
R M S E = i = 1 n ( E i M i ) 2 n
M A E = i = 1 n E i M i n
where Ei, Mi E i ¯ M i ¯ , and n are the measured power, predicted power, mean of the measured power, mean of the predicted power, and number of samples, respectively.
Note that an R2 value close to 1 indicates a high prediction performance. In contrast, low RMSE and MAE values indicate a high prediction performance.

2.2. Model Construction

2.2.1. Data Description

The PV power is affected by many factors, such as the meteorological conditions, operation conditions, and operation time. The effect of the PV panel status and actual operating conditions also have an impact on PV power. Thus, the accuracy is limited in the prediction of short-term power if some insignificant factors are used as input parameters. To increase the prediction accuracy, various factors that affect the PV power need to be considered when developing a prediction model of short-term PV power. There are periodic changes in solar irradiance and environmental temperature over time. Therefore, in this study, the solar irradiance, time, and ambient temperature are considered as the input parameters for the prediction model.
The data of PV power, solar irradiance, and ambient temperature were collected from PVPG tests in Yangling (34°18′ N, 108°24′ E; 521 m a.s.l.), Shaanxi, China. Yangling is a typical arid and semi-arid region in China, and its climate data are well representative. The instruments and equipment used for data collection are shown in Figure 3. The CS5M32-260 single crystal PV panels (Golden Electronics Co., Limited, Taizhou, China), having a peak power of 260 W, a peak voltage of 49.71 V, and a peak current of 5.25 A, were used. The PV power, solar irradiance, and ambient temperature were measured by the AV6592 PV cell tester (China Electronics Technology Group Corporation, Beijing, China), having a voltage test precision of 0.01 V, a current test precision of 0.001 A, a power test range of 0.1–500 W, and an acquisition interval of 10 min. The charging and discharging were controlled by an MPPT controller (Jiangsu Hengtong General Electric Co., Ltd., Xuzhou, China; 48 V, 20 A). The PV cell tester was connected to the computer through attached Bluetooth transmission for display and storage.

2.2.2. Model Construction Based on the Data of Each Season

The flowchart of the prediction process is presented in Figure 4. The data of a year were divided into four parts: spring, summer, autumn, and winter. In total, 70% of the data collected in the four seasons were used as a training dataset, while 30% were used as a testing dataset for PV power prediction. The PV power was considered as the dependent variable. The time, ambient temperature, and solar irradiance were considered as the independent variables. The PSO-XGBoost and XGBoost models were used to build the PV power prediction model. Finally, the R2, RMSE, and MAE were used to assess the prediction accuracy and stability of the machine learning models.
The machine learning models were implemented in Python 3.6. The implementation process is as follows: (1) the file is imported and all the features are converted to float form; (2) the dataset is divided into subsets for easy cross-validation; (3) a data subset is constructed (random sampling) and the optimal feature is selected under the specified number of features (manually adjusting the parameters); (4) a decision tree is constructed; (5) extreme gradient boosting is created; and (6) the test set is input, testing is conducted, and the prediction results are output.
The optimal parameters of PSO are obtained when the objective function reaches its minimum within the parameter range during the prediction process. The cognitive and social coefficients are empirically set to 2.05. The maximum number of iterations is determined by the stability of the fitness function. If the fitness function remains unchanged for an extended period, the iteration is terminated. After pre-simulation, the iteration maximum is capped at 150 to prevent excessive simulation time. Additionally, the particle velocity range is limited to −3 to 3 to balance between avoiding skipping the optimal solution due to excessive speed and ensuring convergence. Given the relative simplicity of the optimization problem in this study, the number of particles and population are, respectively, set at 20 and 1 to 70. Through multiple pre-simulations and PSO parameter adjustments, it was found that, when setting the PSO parameters according to the above approach, the objective function achieved the minimum value within the allowable margin of error. Table 1 presents the default values of key parameters for the XGBoost model, while Table 2 presents the selected parameters of PSO-XGBoost model and XGBoost model. The key parameters of PSO-XGBoost model are obtained after optimization by PSO algorithm based on the prediction requirements in this study. The key parameters of the XGBoost algorithm are obtained through multiple adjustments based on experience.

3. Results

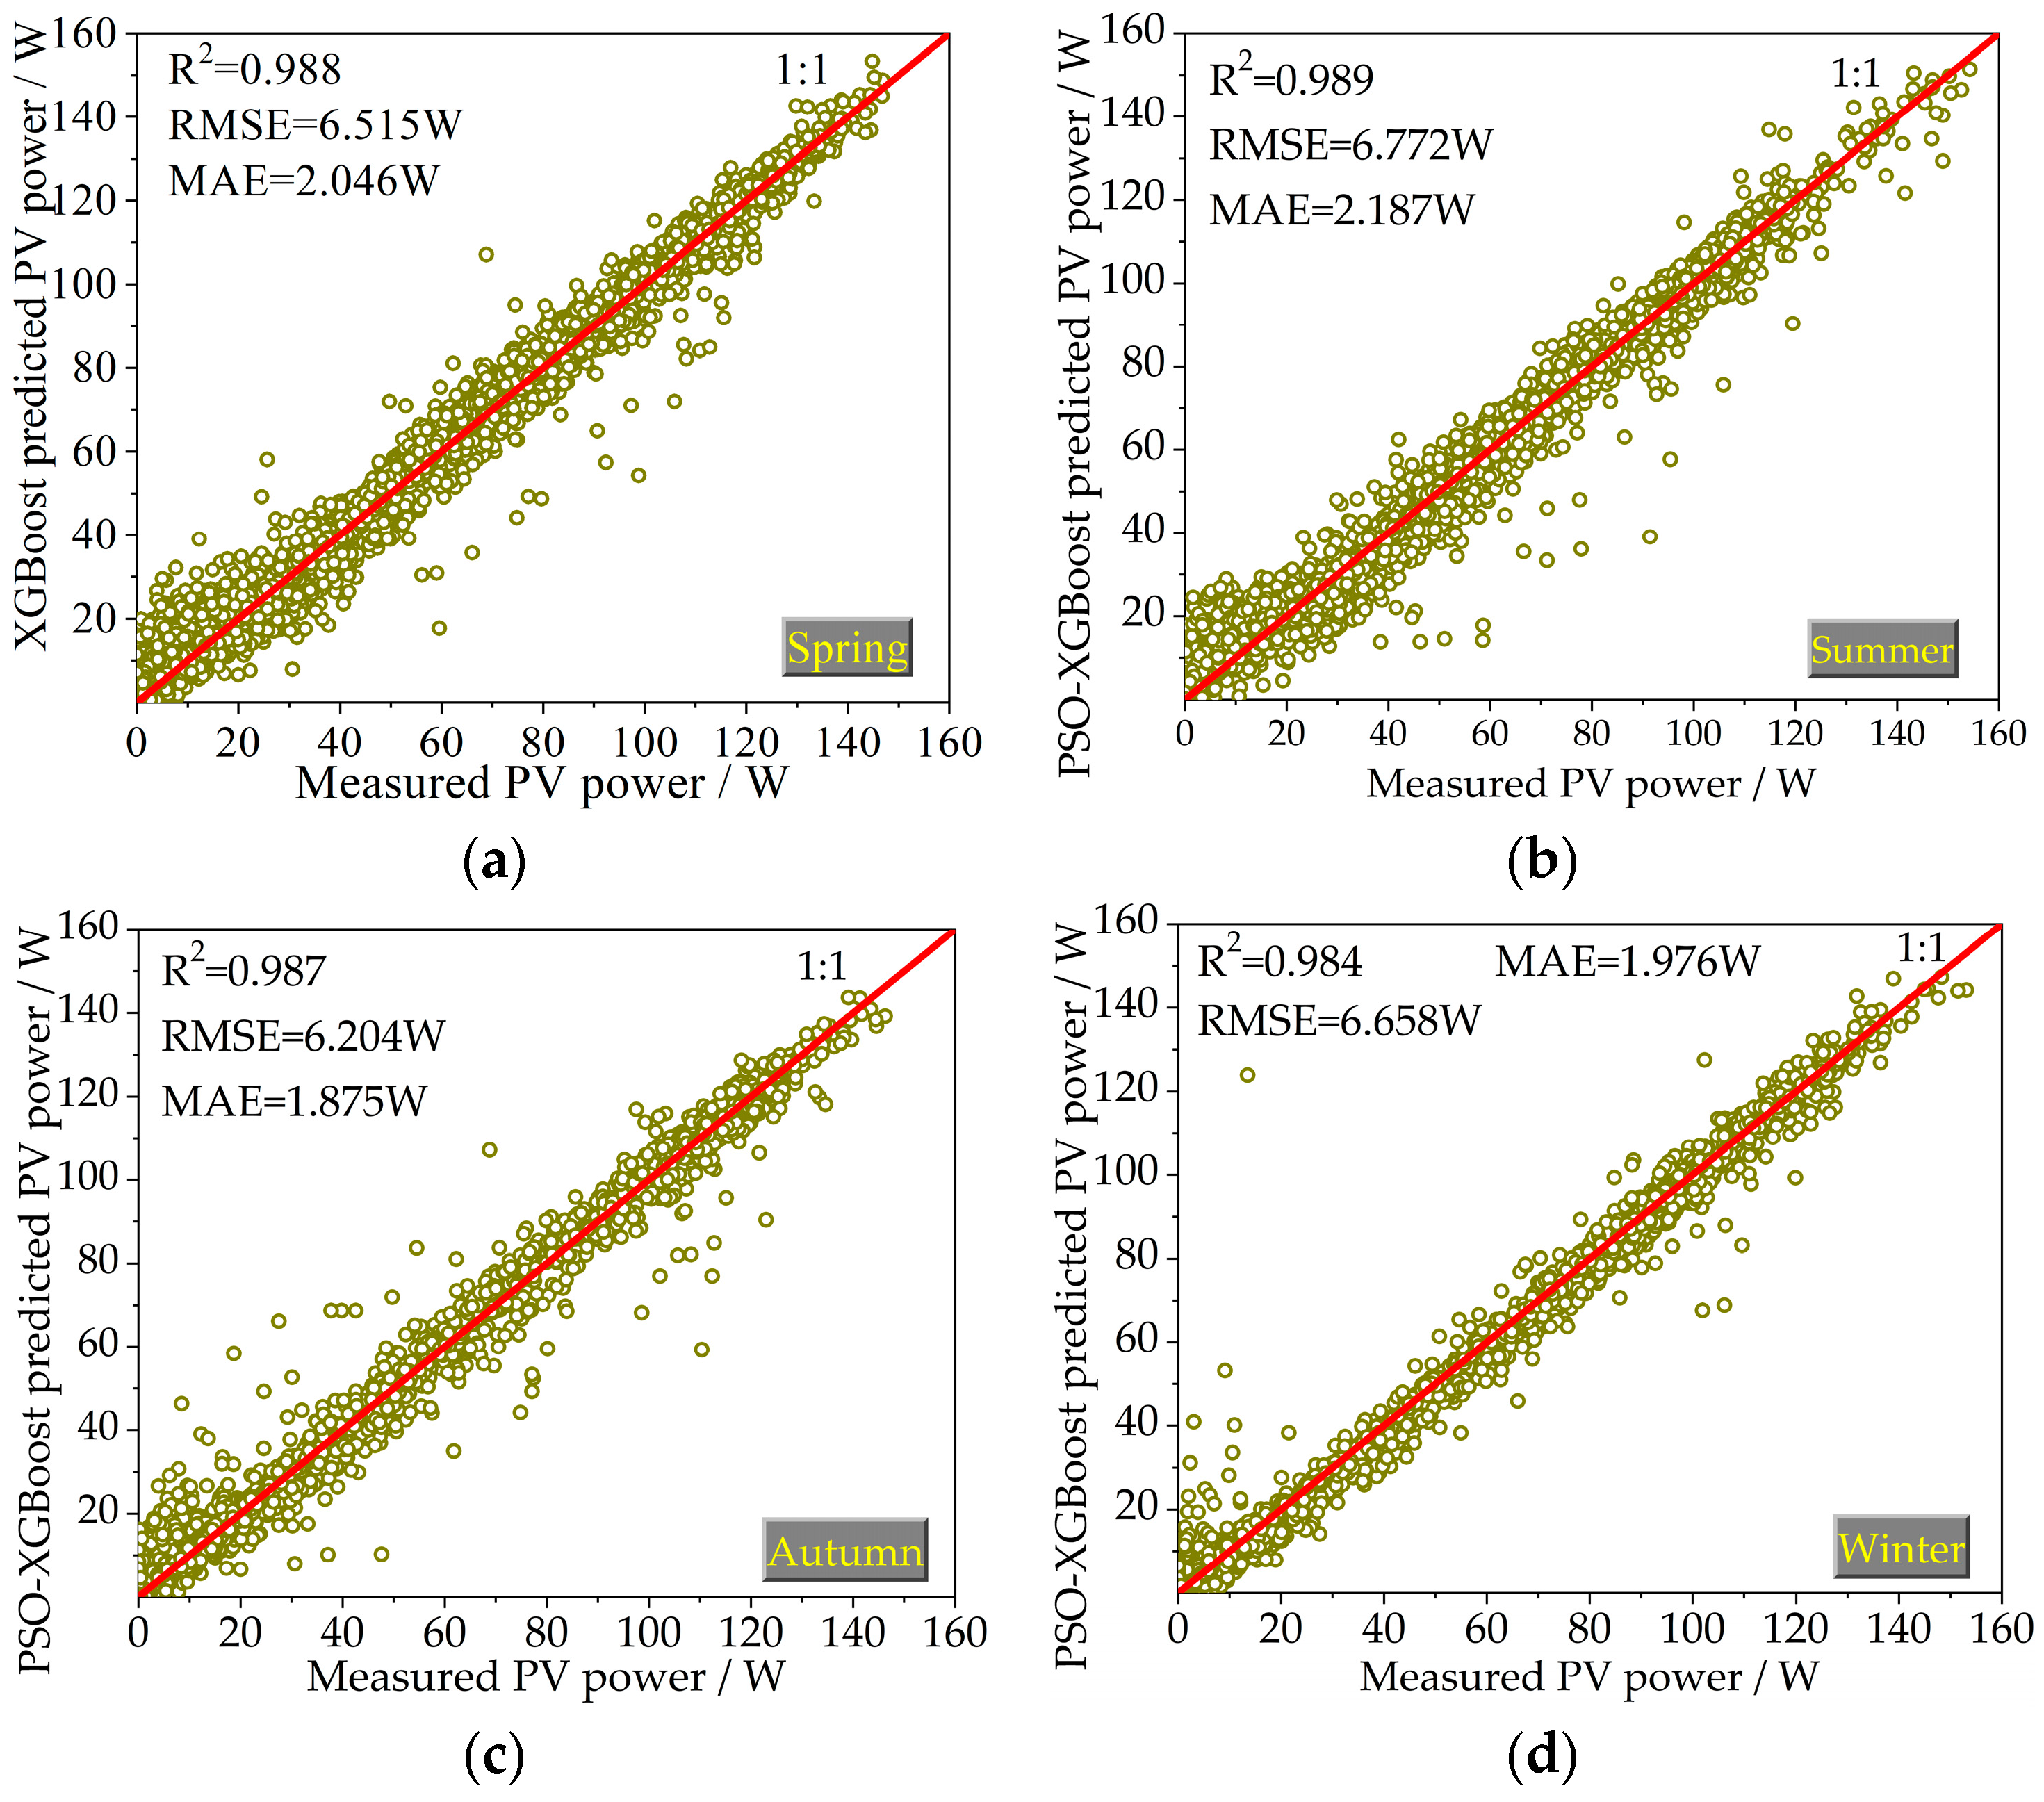
3.1. Accuracy of the PV Power Prediction in Four Seasons

The machine learning techniques, namely the PSO-XGBoost and XGBoost models, were used to predict the generation power of the PV system of a hose-drawn traveler in four seasons. The predicted values of the PV power obtained by machine learning models in testing phases are shown in Figure 5 and Figure 6. The horizontal axis denotes the measured PV power, and the vertical axis represents the predicted PV power. Under a measured value in the horizontal axis, the closer the corresponding predicted value in the vertical axis to the 1:1 curve, the closer its value to the measured one and the more accurate the prediction effect. The values of the statistical indicators for all the studied models in the testing phases are also presented in Figure 5 and Figure 6.
The predicted points of the PSO-XGBoost model are more evenly distributed on the two sides of a 1:1 straight line compared with the XGBoost model in the four seasons. The R2 values of the two models in the training and testing phases are all greater than 0.9. This indicates that the regression model based on solar irradiance, ambient temperature, and time can accurately predict the PV power.
Taking the summer season as an example, in the testing phase, the decision coefficients R2 of the PSO-XGBoost and XGBoost models are, respectively, 0.989 and 0.980, the RMSE values are, respectively, 6.772 and 7.656 W, and the MAE values are 2.187 and 2.482, respectively. The prediction accuracy of PSO-XGBoost is higher than that of the XGBoost model. For the four seasons, on average, the PSO-XGBoost model has R2 = 0.987 W, RMSE = 6.537 W, and MAE = 2.021 W, which outperforms the XGBoost model having R2 = 0.983, RMSE = 7.560 W, and MAE = 2.431 W for predicting the PV power in the testing phase. The predictive accuracy of PV power prediction by the PSO-XGBoost model was higher compared to the XGBoost model. The superiority of the PSO-XGBoost model over the XGBoost model is evident.

3.2. Stability of the PV Power Prediction in Four Seasons

The percentage increase (PI) in testing RMSE over training RMSE for four seasons is shown in Figure 7. The PSO-XGBoost model has the highest prediction accuracy during the testing process. The average increment in RMSE of the testing phases relative to the training phases is also shown in Figure 7.
The range of RMSE differences between the training phase and the testing phase during the four seasons were 3.12–8.21% and 6.17–13.07% for the PSO-XGBoost and XGBoost model, respectively. The RMSE increase of the PSO-XGBoost model was lower than that of the XGBoost model in the four seasons during testing. This indicates that the PSO-XGBoost model demonstrates a more stable predictive performance compared to the XGBoost model.

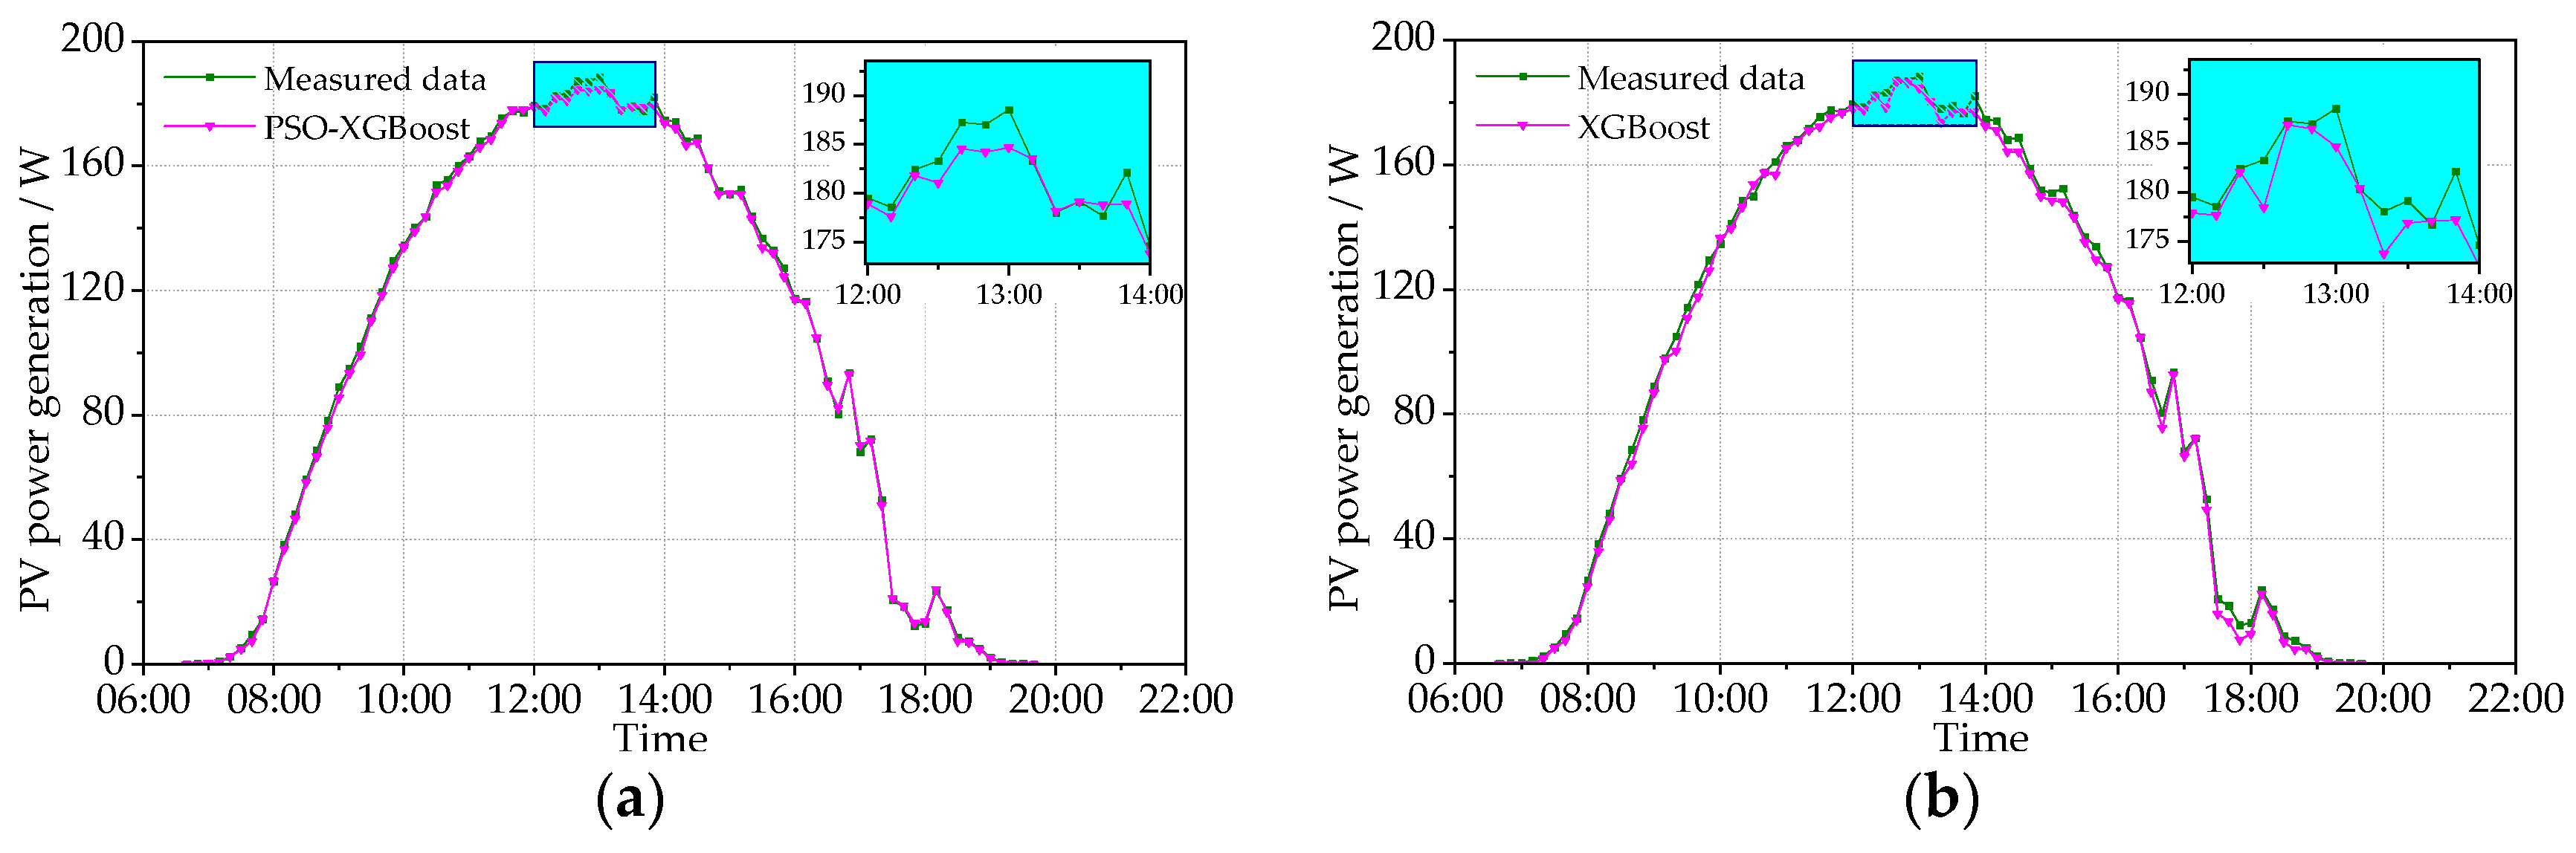
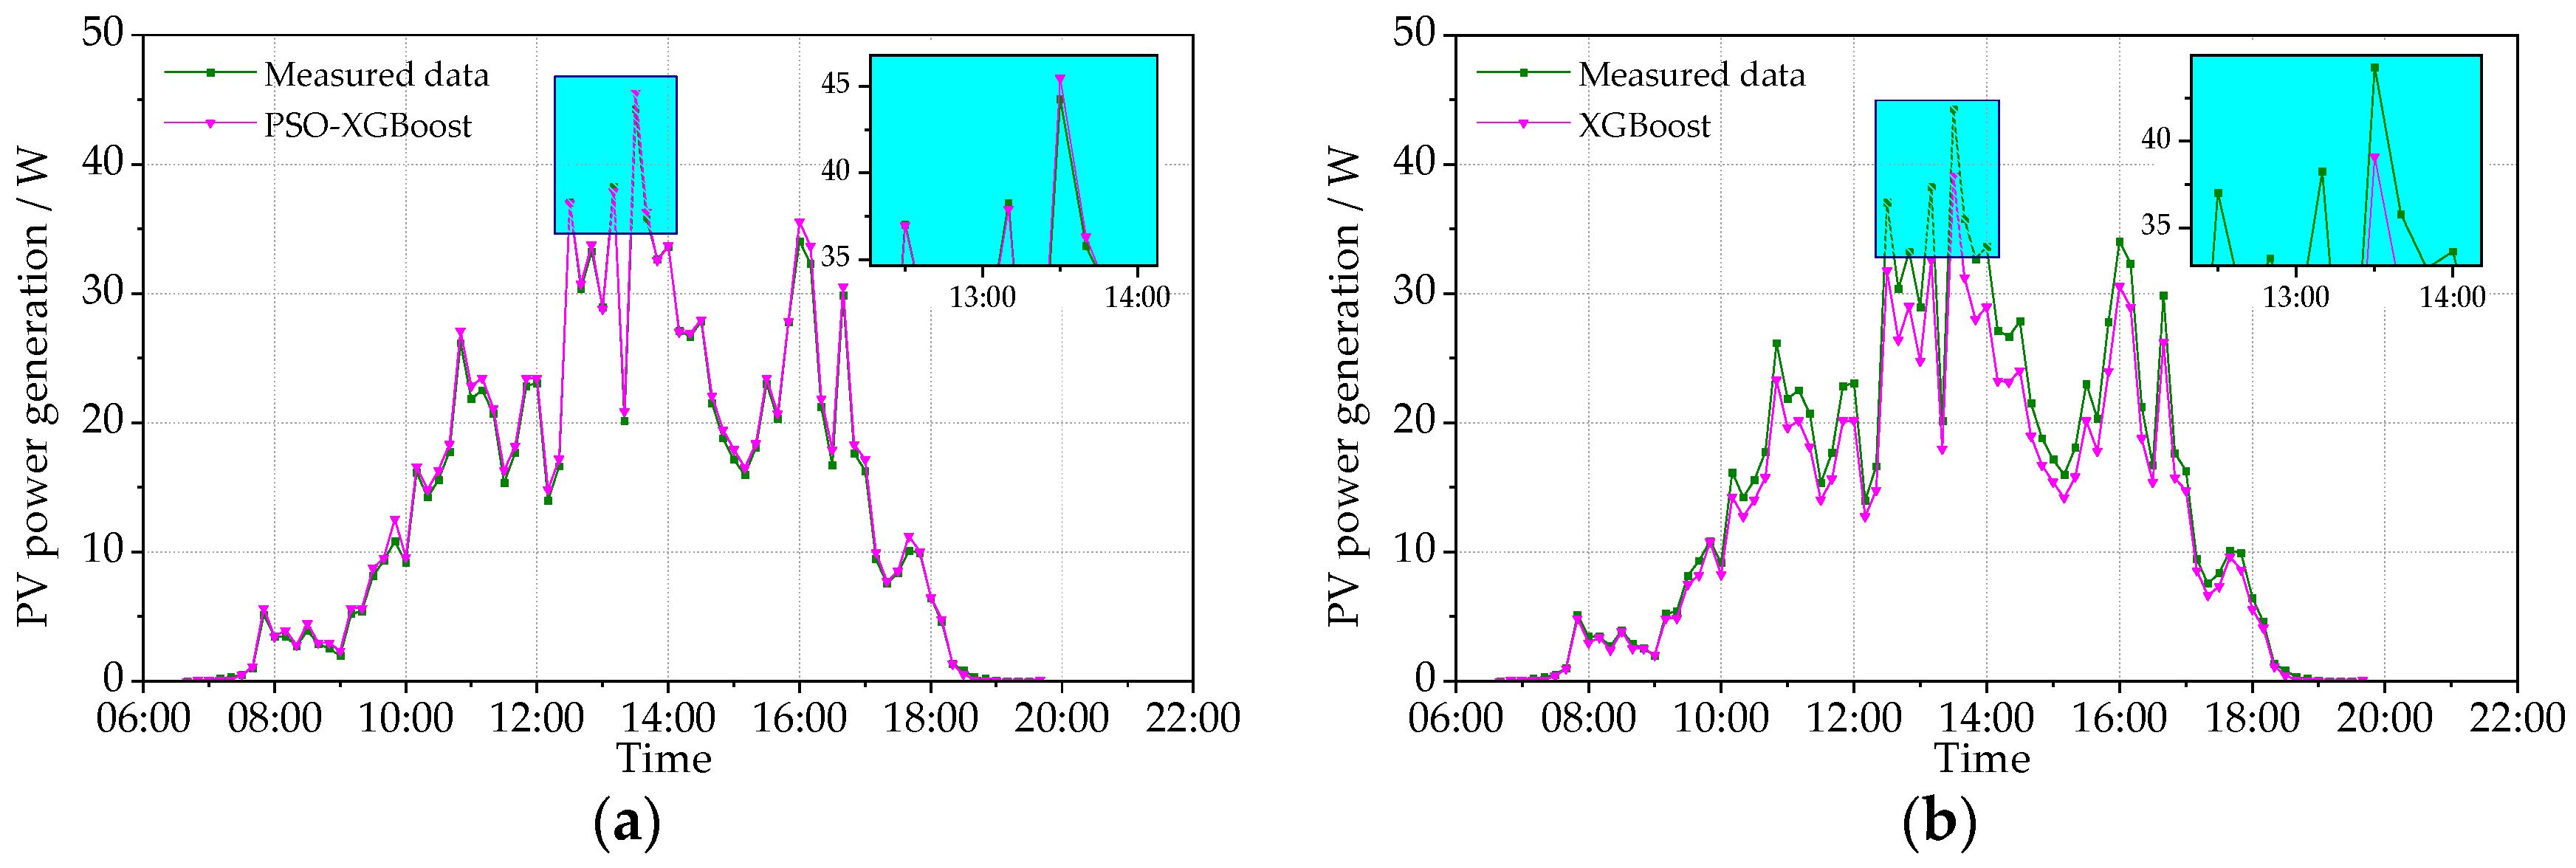
3.3. Experimental Study of the PV Power Prediction Accuracy in Typical Days

This study tests the PV power prediction accuracy of the models in typical sunny and cloudy conditions. The data of typical sunny condition were tested on 22 September 2021 (the maximum temperature = 32.1 °C; the minimum temperature = 13.5 °C) and 9 November 2021 (the maximum temperature = 7.5 °C; the minimum temperature = 1.5 °C). The data of typical cloudy condition were tested on 6 October 2021 (the maximum temperature = 15.2 °C; the minimum temperature = 10.6 °C) and 24 December 2021 (the maximum temperature = 3.4 °C; the minimum temperature = −9.3 °C). The obtained results are shown in Figure 8, Figure 9, Figure 10 and Figure 11, including the data of the predicted and measured PV power. Figure 8 and Figure 9 show the measured PV power and the predicted PV power obtained by the PSO-XGBoost and XGBoost models on typical sunny days. The abscissa axis denotes the predicted periods in a day, and the vertical axis represents the PV power value. From Figure 8 and Figure 9, the accuracy of prediction by PSO-XGBoost is higher than that by XGBoost. The RMSE values of PSO-XGBoost and XGBoost on 22 September 2021 are, respectively, 1.708 and 2.035 W, while those on 9 November 2021 are 1.820 and 1.856 W, respectively.
Figure 10 and Figure 11 show the measured PV power and the predicted PV power obtained by the PSO-XGBoost and XGBoost models on typical cloudy days. The fluctuation of the PV power on cloudy days is more intense than that on sunny days. Although there are fluctuations, the stability of prediction by PSO-XGBoost is still higher than that by XGBoost. The RMSE values of PSO-XGBoost and XGBoost on 6 October 2021 are, respectively, 1.653 and 2.610 W, while those on 24 December 2021 are 1.226 and 3.023 W, respectively. It is obvious that the prediction accuracy of the PSO-XGBoost model is higher than that of the XGBoost model.

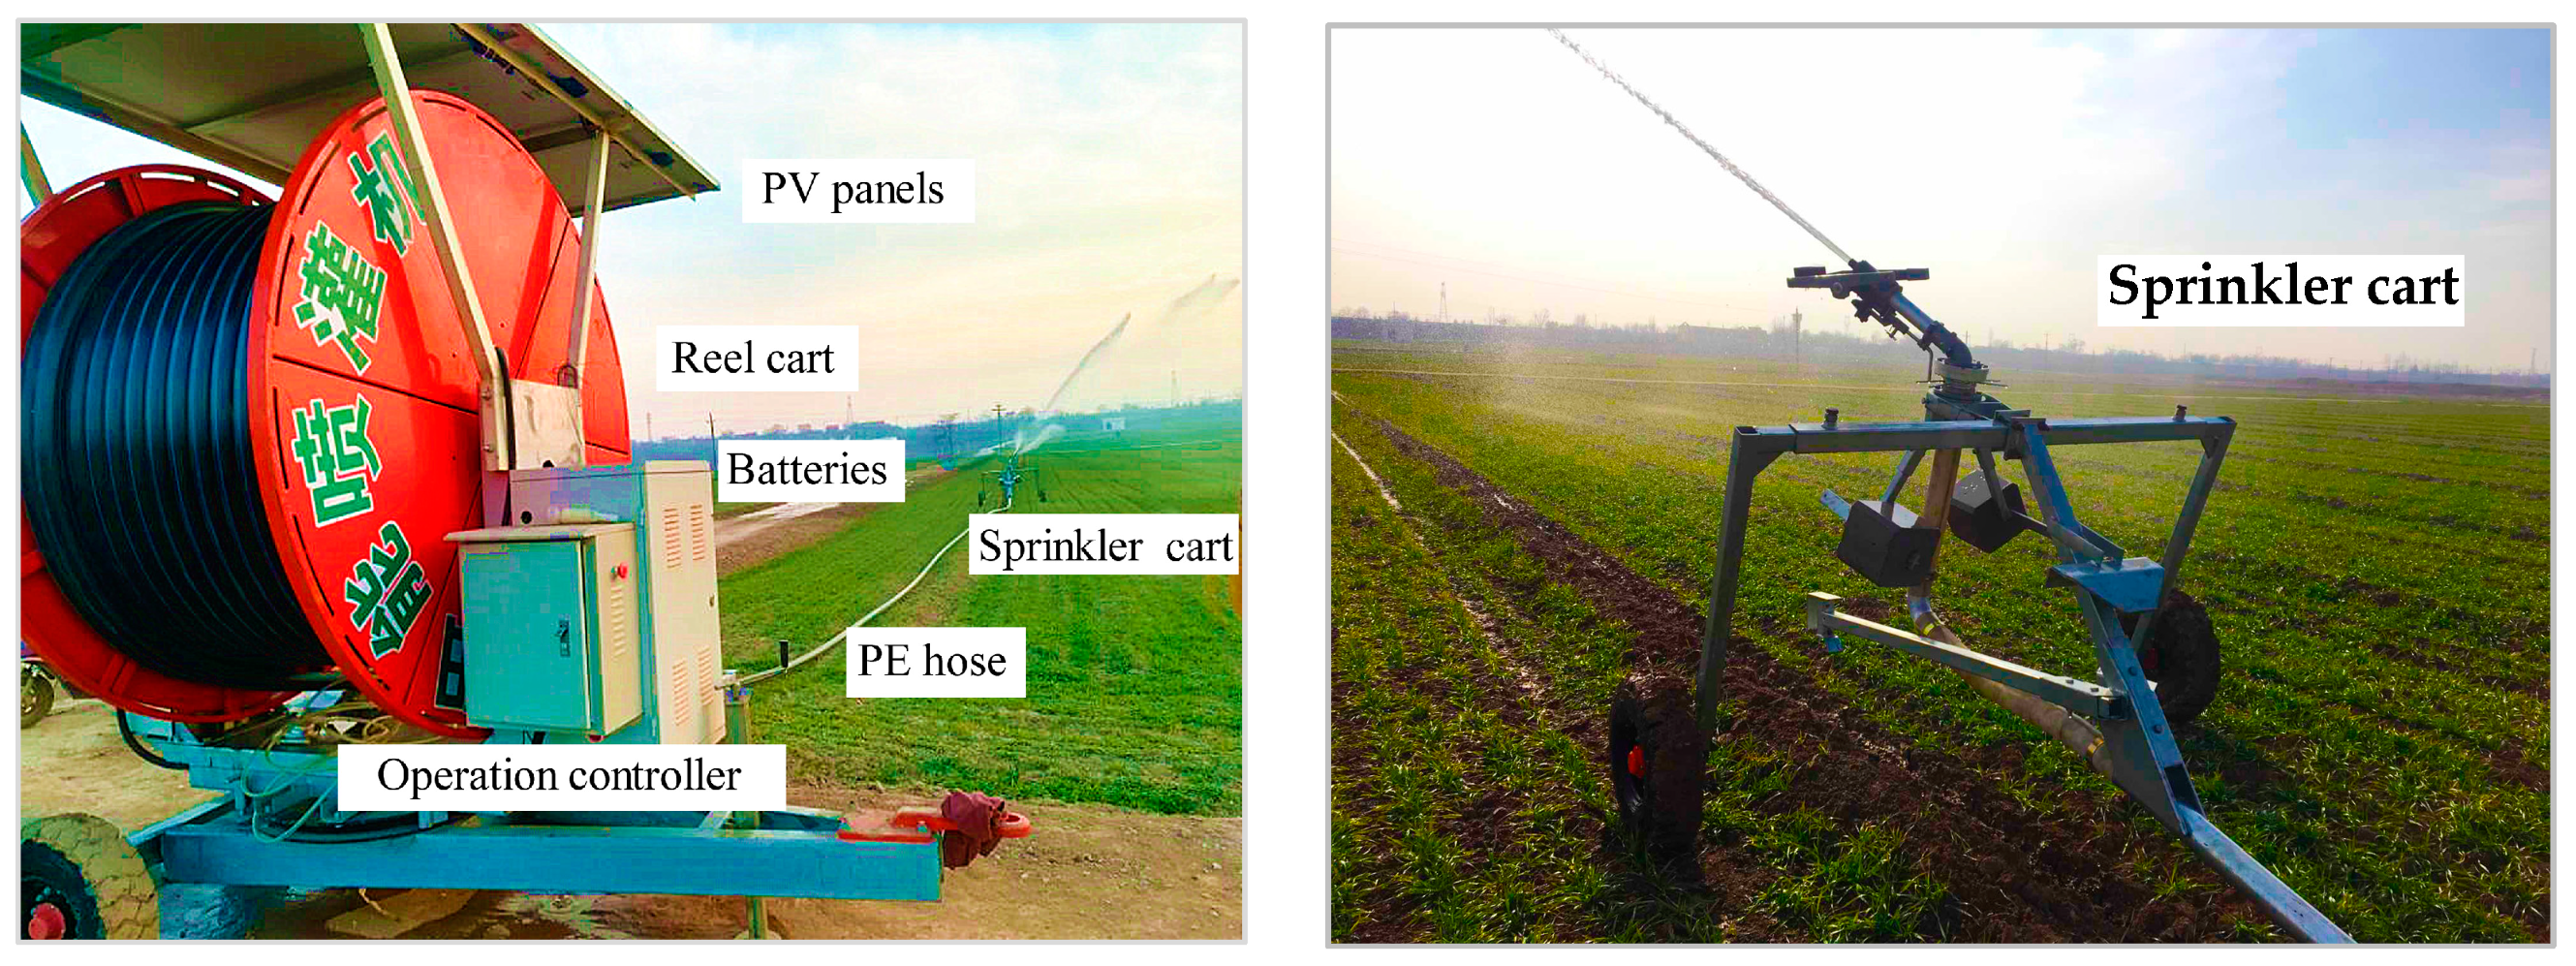
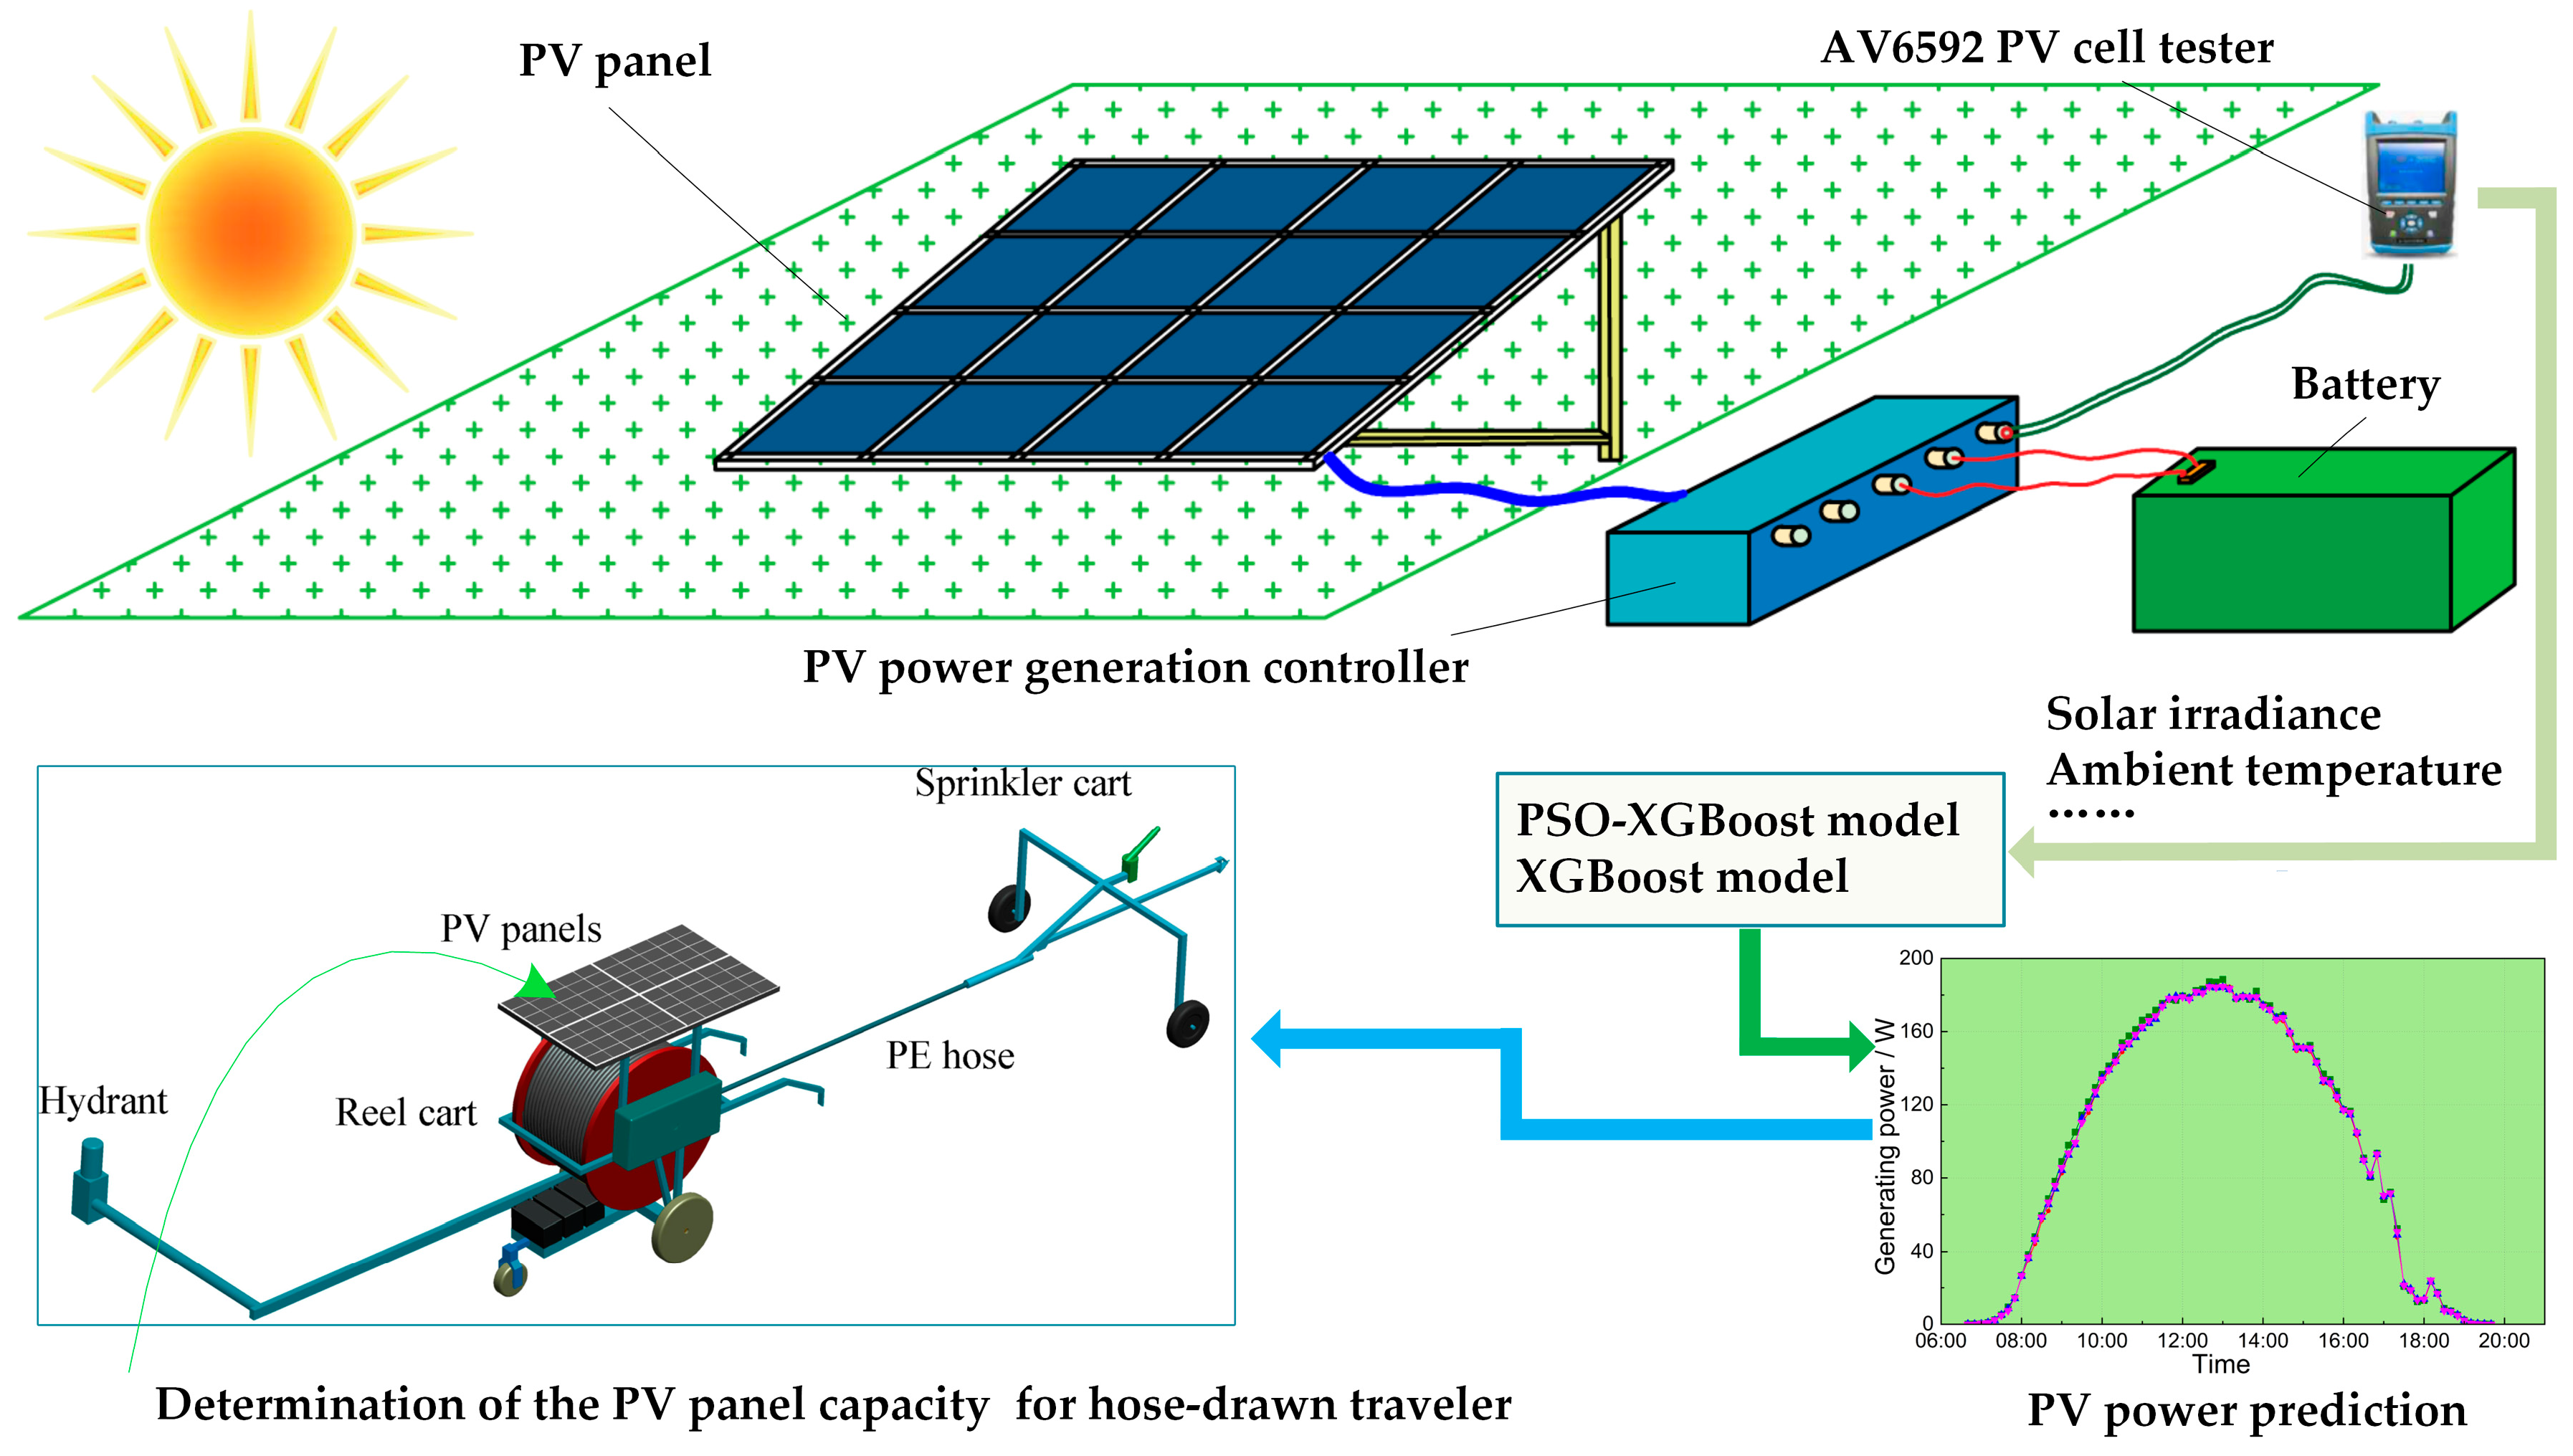
4. Application of PSO-XGBoost Model

The daily meteorological data from 2011 to 2020 are obtained for application of PSO-XGBoost model from the National Meteorological Information Center (NMIC) of China Meteorological Administration (CMA) [29]. The method proposed in reference [30] is used to calculate irradiance of 80 typical meteorological stations in China, as shown in Figure 12. Afterwards, the PSO-XGBoost model is used to estimate the daily average PVPG of 80 typical meteorological stations. Based on the estimation results, the PVPG system of hose-drawn travelers can be configured and optimized in different regions [1].
The daily average PVPG in four seasons is estimated using the PSO-XGBoost model. Then, the daily average of PVPG is plotted using the ArcGIS platform and the Kriging interpolation method, as shown in Figure 13. The daily average of PVPG varies significantly between different spatiotemporal distributions. In terms of spatial distribution nationwide, the daily average of PVPG is higher in the west and the south than in the east and the north. Given the dominance of arid climate in most parts of Northwest China, there are obvious variations in the daily average of PVPG. In four seasons, the maximum daily average PVPG value of 110 W is achieved in summer, while the mean value is attained during spring and autumn and the minimum value of 30 W is reached in winter. In winter, the daily average of PVPG shows a decreasing trend with the decline in sunshine hours. The range in which the daily average of PVPG varies between four seasons is 30–110 W/(m2·d).
It can be seen that there are differences in PVPG among different regions and seasons. In regions where the power generation is lowest among the four seasons, it is necessary to increase the capacity of PV panels in order to ensure the normal operation of irrigation machines. On the other hand, regions with high power generation need to avoid investing excessive capacity in PV panels to prevent wastage.

5. Discussion

The application of PV-powered hose-drawn travelers contributes to the reduction in fuel consumption and lower emissions. The accurate prediction of PVPG plays a critical role in the operation of PV-driven hose-drawn travelers. The proposed prediction model, which involves the use of PSO-XGBoost model, contributes to the stability of power supply and the capacity of power generation. In the research of PV power prediction, machine learning models are most used [31]. There are many similar studies to this paper that have been conducted, such as the assessment of PV power potential based on a machine learning model [32], the short-term prediction model developed for power system inertia on the basis of XGBoost [33], and PV power forecasting using Wavelet-PSO-SVM model [18]. However, these studies focus on prediction models, with little attention paid to the grouping of meteorological data. In this paper, the separate data of each season are used to develop the model of PV power prediction, which is one of the highlights of this study. This study focuses on addressing the issue of predicting PVPG for the power supply system of a hose-drawn traveler in four seasons. This method may also be applied to predict the power generation of solar plant in different seasons.
The PSO-XGBoost model performs better than the XGBoost model. The reason for this is that the PSO-XGBoost model can be used to search for the optimal prediction parameters automatically. PSO-XGBoost is effective in solving the problem of excessive hyperparameters in XGBoost, such as learning rate, the maximum depth of decision tree, and the minimum child weight. Additionally, the proposed model can address the difficulty in determining them manually [18]. The PSO-XGBoost model alleviates the overfitting encountered by the XGBoost model, which improves the accuracy of data fitting and predictive performance.
In the PSO-XGBoost algorithm, the optimization of XGBoost hyperparameters is vital for achieving optimal prediction results. To ensure effectiveness, this study merged prediction requirements and identified the square of the difference between the estimated value and the actual value of all the sample data as the target function for minimization. Extensive pre-simulations determined parameters like particle velocity, position, and iteration times, thereby preventing PSO optimization from getting stuck in local optima. This approach facilitated the acquisition of optimized XGBoost hyperparameters, resulting in superior predictions given the current conditions.
Given no need for irrigation on rainy days, there are only two scenarios of using the PV-driven hose-drawn traveler: sunny and cloudy weather. Thus, two days (a sunny and a cloudy day) are randomly selected in this study to measure the meteorological data and PVPG data to verify the predictive accuracy of the proposed model. This is considered sufficient because the data of other weather events show similarities.
Nevertheless, there are some limitations on this work, for example, the data collected from a typical region are used for prediction research and the sample size is insufficient. In future study, the sample size will be increased. Additionally, energy efficiency also has an impact on the PVPG. We will conduct further research in this area in the future.

6. Conclusions

In this paper, the PSO-XGBoost model was introduced to develop the model of PVPG prediction for hose-drawn travelers. The PSO algorithm was used to automatically search for the optimal hyperparameters of the XGBoost model for achieving effective prediction of PVPG. The accuracy and stability of prediction by the proposed model were assessed in four seasons. The predictive accuracy of PV power prediction by the PSO-XGBoost model was higher compared to the XGBoost model. The stability of the proposed model was also superior to XGBoost model. The test results under typical weather conditions showed that the proposed model achieved higher predictive accuracy than the XGBoost model. The construction process based on the proposed model is relatively simple and only the parameters of the optimization model require adjustment. Finally, the PSO-XGBoost model was applied using data from 80 meteorological stations across China, and the daily average PVPG in different regions of China were obtained through prediction. The results provide a theoretical reference for the accurate prediction of PVPG. It can also provide a practical foundation for the application of PV-powered hose-drawn travelers.

Author Contributions

Conceptualization, D.L. and D.Z.; methodology, D.L.; software, D.L.; validation, D.L.; formal analysis, D.L., J.Q. and D.Z.; investigation, T.T. and D.Z.; resources, T.T. and D.Z.; data curation, J.Q.; writing—original draft preparation, D.L.; writing—review and editing, D.L.; visualization, J.Q.; supervision, T.T. and D.Z.; project administration, T.T.; funding acquisition, D.L. and T.T. All authors have read and agreed to the published version of the manuscript.

Funding

This research was funded by the Natural Science Foundation of the Jiangsu Higher Education Institutions, grant number 22KJD510012; the Jiangsu Provincial Natural Science Foundation, grant number BK20210823; the Jiangsu agricultural science and technology innovation fund, grant number CX (21) 3153; and Lvyangjinfeng Talent Project of Yangzhou, grant number YZLYJFJH2021YXBS055.

Data Availability Statement

Data are contained within the article.

Acknowledgments

The authors are grateful for the support by Jiangsu Province Engineering Research Center of Intelligent Application for Advanced Plastic Forming. The authors also express their sincere appreciation to the editor and referees for their valuable time and efforts on our manuscript.

Conflicts of Interest

The authors declare no conflicts of interest.

Nomenclature

TitleAbbreviation
PVPhotovoltaic
PSOParticle swarm optimization
XGBoostExtreme gradient boosting
PSO-XGBoostExtreme gradient boosting model based on particle swarm optimization
PVPGPhotovoltaic power generation
LMSLeast mean square
RMSERoot mean squared error
ANNArtificial neural network
SVMSupport vector machine
LS-SVMLeast squares support vector machine
GBDTGradient boosting decision tree
RFRandom forest
R2Coefficient of determination
MAEMean absolute error
MPPTMaximum power point tracking
PIPercentage increase
NMICNational meteorological information center
CMAChina meteorological administration
WT-PSO-SVM Wavelet transform-particle swarm optimization-support vector machine

References

  1. Li, D.; Zhu, D.; Ge, M.; Wu, S.; Wang, R.; Wang, B.; Wu, Y.; Yang, Y. Optimal configuration and field experiments for photovoltaic generation system of solar-powered hose-drawn traveler. Trans. ASABE 2019, 62, 1789–1801. [Google Scholar] [CrossRef]
  2. Graditi, G.; Ferlito, S.; Adinolfi, G. Comparison of photovoltaic plant power production prediction methods using a large measured dataset. Renew. Energy 2016, 90, 513–519. [Google Scholar] [CrossRef]
  3. Zhao, W.; Zhang, H.; Zheng, J.; Dai, Y.; Huang, L.; Shang, W.; Liang, Y. A point prediction method based automatic machine learning for day-ahead power output of multi-region photovoltaic plants. Energy 2021, 223, 120026. [Google Scholar] [CrossRef]
  4. Hu, K.; Cao, S.; Wang, L.; Li, W.; Lv, M. A new ultra-short-term photovoltaic power prediction model based on ground-based cloud images. J. Clean Prod. 2018, 200, 731–745. [Google Scholar] [CrossRef]
  5. Karchi, N.; Kulkarni, D.; Prado, R.P.d.; Divakarachari, P.B.; Patil, S.N.; Desai, V. Adaptive least mean square controller for power quality enhancement in solar photovoltaic system. Energies 2022, 15, 8909. [Google Scholar] [CrossRef]
  6. Das, S.R.; Hota, A.P.; Pandey, H.M.; Sahoo, B.M. Industrial power quality enhancement using fuzzy logic based photovoltaic integrated with three phase shunt hybrid active filter and adaptive controller. Appl. Soft. Comput. 2022, 121, 108762. [Google Scholar] [CrossRef]
  7. Houran, M.A.; Sabzevari, K.; Hassan, A.; Oubelaid, A.; V’eliz, M.T.; Khosravi, N. Active power filter module function to improve power quality conditions using GWO and PSO techniques for solar photovoltaic arrays and battery energy storage systems. J. Energy Storage 2023, 72, 108552. [Google Scholar] [CrossRef]
  8. Alia, A.; Norb, N.M.; Ibrahimc, T.; Romlied, M.F. Sizing and placement of solar photovoltaic plants by using time-series historical weather data. J. Renew. Sustain. Energy 2018, 10, 023702. [Google Scholar] [CrossRef]
  9. Mubarak, H.; Hammoudeh, A.; Ahmad, S.; Abdellatif, A.; Mekhilef, S.; Mokhlis, H.; Dupont, S. A hybrid machine learning method with explicit time encoding for improved Malaysian photovoltaic power prediction. J. Clean Prod. 2023, 382, 134979. [Google Scholar] [CrossRef]
  10. Yang, M.; Huang, X. Ultra-short-term prediction of photovoltaic power based on periodic extraction of PV energy and LSH algorithm. IEEE Access 2018, 6, 51200–51205. [Google Scholar] [CrossRef]
  11. Rana, M.; Koprinska, I. Neural network ensemble based approach for 2D-interval prediction of solar photovoltaic power. Energies 2016, 9, 829. [Google Scholar] [CrossRef]
  12. Alghamdi, H.; Maduabuchi, C.; Albaker, A.; Alatawi, I.; Alsenani, T.R.; Alsafran, A.S.; Almalaq, A.; AlAqil, M.; Abdelmohimen, M.A.H.; Alkhedher, M. A prediction model for the performance of solar photovoltaic-thermoelectric systems utilizing various semiconductors via optimal surrogate machine learning methods. Eng. Sci. Technol. 2023, 40, 101363. [Google Scholar] [CrossRef]
  13. Yadav, A.K.; Chandel, S.S. Identification of relevant input variables for prediction of 1-minute time-step photovoltaic module power using artificial neural network and multiple linear regression models. Renew. Sustain. Energy Rev. 2017, 77, 955–969. [Google Scholar] [CrossRef]
  14. Al-Dahidi, S.; Ayadi, O.; Alrbal, M.; Adeeb, J. Ensemble approach of optimized artificial neural networks for solar photovoltaic power prediction. IEEE Access 2019, 7, 81741–81758. [Google Scholar] [CrossRef]
  15. Dong, X.; Shen, J.; Ma, Z.; He, Y.J. Simultaneous operating temperature and output power prediction method for photovoltaic modules. Energy 2022, 260, 124909. [Google Scholar] [CrossRef]
  16. Rosato, A.; Altilio, R.; Araneo, R.; Panella, M. Prediction in photovoltaic power by neural networks. Energies 2017, 10, 1003. [Google Scholar] [CrossRef]
  17. Mayer, M.-J.; Yang, D. Pairing ensemble numerical weather prediction with ensemble physical model chain for probabilistic photovoltaic power forecasting. Renew. Sust. Energ. Rev. 2023, 175, 113171. [Google Scholar] [CrossRef]
  18. Eseye, A.T.; Zhang, J.H.; Zheng, D.H. Short-term photovoltaic solar power forecasting using a hybrid Wavelet-PSO-SVM model based on SCADA and meteorological information. Renew. Energy 2018, 118, 357–367. [Google Scholar] [CrossRef]
  19. Li, L.; Wen, S.; Tseng, M.; Wang, C. Renewable energy prediction: A novel short-term prediction model of photovoltaic output power. J. Clean Prod. 2019, 228, 359–375. [Google Scholar] [CrossRef]
  20. Malvoni, M.; Giorgi, M.G.D.; Congedo, P.M. Photovoltaic predict based on hybrid PCA-LSSVM using dimensionality reducted data. Neurocomputing 2016, 211, 72–83. [Google Scholar] [CrossRef]
  21. Kazem, H.A.; Yousif, J.H. Comparison of prediction methods of photovoltaic power system production using a measured dataset. Energy Convers. Manag. 2017, 148, 1070–1081. [Google Scholar] [CrossRef]
  22. Wang, J.; Ran, R.; Zhou, Y. A short-term photovoltaic power prediction model based on an FOS-ELM algorithm. Appl. Sci. 2017, 7, 423. [Google Scholar] [CrossRef]
  23. Zhu, R.; Guo, W.; Gong, X. Short-term photovoltaic power output prediction based on k-Fold cross-validation and an ensemble model. Energies 2019, 12, 1220. [Google Scholar] [CrossRef]
  24. Fan, J.; Yue, W.; Wu, L.; Zhang, F.; Cai, H.; Wang, X.; Lu, X.; Xiang, Y. Evaluation of SVM, ELM and four tree-based ensemble models for predicting daily reference evapotranspiration using limited meteorological data in different climates of China. Agric. For. Meteorol. 2018, 263, 225–241. [Google Scholar] [CrossRef]
  25. Feng, Y.; Cui, N.; Gong, D.; Zhang, Q.; Zhao, L. Evaluation of random forests and generalized regression neural networks for daily reference evapotranspiration modelling. Agric Water Manag. 2017, 193, 163–173. [Google Scholar] [CrossRef]
  26. Tan, K.; Wang, H.; Chen, L.; Du, Q.; Du, P.; Pan, C. Estimation of the spatial distribution of heavy metal in agricultural soils using airborne hyperspectral imaging and random forest. J. Hazard. Mater. 2020, 382, 120987. [Google Scholar] [CrossRef]
  27. Fan, J.; Wang, X.; Wu, L.; Zhou, H.; Zhang, F.; Yu, X.; Lu, X.; Xiang, Y. Comparison of support vector machine and extreme gradient boosting for predicting daily global solar radiation using temperature and precipitation in humid subtropical climates: A case study in China. Energy Convers. Manag. 2018, 164, 102–111. [Google Scholar] [CrossRef]
  28. Feng, Y.; Cui, N.; Chen, Y.; Gong, D.; Hu, X. Development of data-driven models for prediction of daily global horizontal irradiance in Northwest China. J. Clean Prod. 2019, 223, 136–146. [Google Scholar] [CrossRef]
  29. Available online: https://data.cma.cn/dataService/cdcindex/datacode/A.0012.0001/show_value/normal.html (accessed on 6 January 2022).
  30. Pardo-Picazo, M.Á.; Juárez, J.M.; García-Márquez, D. Energy consumption optimization in irrigation networks supplied by a standalone direct pumping photovoltaic system. Sustainability 2018, 10, 4203. [Google Scholar] [CrossRef]
  31. Zhou, Y.; Zhou, N.; Gong, L.; Jiang, M. Prediction of photovoltaic power output based on similar day analysis, genetic algorithm and extreme learning machine. Energy 2020, 204, 117894. [Google Scholar] [CrossRef]
  32. Song, Z.; Cao, S.; Yang, H. Assessment of solar radiation resource and photovoltaic power potential across China based on optimized interpretable machine learning model and GIS-based approaches. Appl. Energy 2023, 339, 121005. [Google Scholar] [CrossRef]
  33. Lei, Z.; Guo, Z.; Tao, Q.; Xiong, Z.; Ye, J. XGBoost-based short-term prediction method for power system inertia and its interpretability. Energy Rep. 2023, 9, 1458–1469. [Google Scholar] [CrossRef]
Figure 1. Hose-drawn traveler with PV supply system.
Processes 12 00039 g001
Figure 2. Schematic diagram for the PV power prediction of the hose-drawn traveler.
Processes 12 00039 g002
Figure 3. The data collection instruments and equipment for experiment. (a) PVPG testing system; (b) AV6592 PV cell tester; and (c) MPPT controller.
Processes 12 00039 g003
Figure 4. Flowchart of the PV power prediction process based on the data of each season.
Processes 12 00039 g004
Figure 5. Scatterplots of the predicted PV power values by the PSO-XGBoost model versus corresponding measured values for the testing phase: (a) spring; (b) summer; (c) autumn; and (d) winter (note: the red lines represent the 1:1 line).
Processes 12 00039 g005
Figure 6. Scatterplots of the predicted PV power values by the XGBoost model versus corresponding measured values for the testing phase: (a) spring; (b) summer; (c) autumn; and (d) winter (note: the red lines represent the 1:1 line).
Processes 12 00039 g006
Figure 7. Percentage increase in testing RMSE over training RMSE for (a) PSO-XGBoost model; and (b) XGBoost model in four seasons.
Processes 12 00039 g007
Figure 8. Comparison between the predicted and measured PVPG on a sunny day (22 September 2021): (a) PSO-XGBoost model; and (b) XGBoost model.
Processes 12 00039 g008
Figure 9. Comparison between the predicted and measured PVPG on a sunny day (9 November 2021): (a) PSO-XGBoost model; and (b) XGBoost model.
Processes 12 00039 g009
Figure 10. Comparison between the predicted and measured PVPG on a cloudy day (6 October 2021): (a) PSO-XGBoost model; and (b) XGBoost model.
Processes 12 00039 g010
Figure 11. Comparison between the predicted and measured PVPG on a cloudy day (24 December 2021): (a) PSO-XGBoost model; and (b) XGBoost model.
Processes 12 00039 g011
Figure 12. The distribution of 80 typical weather stations in China.
Processes 12 00039 g012
Figure 13. The distribution of daily average PV power: (a) spring; (b) summer; (c) autumn; and (d) winter.
Processes 12 00039 g013aProcesses 12 00039 g013b
Table 1. Default values of key parameters for XGBoost model.
Key ParametersDefault ValueRange
max_depth6[0, ∞)
min_child_weight1[0, ∞)
learning_rate0.3[0, 1]
gamma1[0, ∞)
subsample1(0, 1]
colsample_bytree1(0, 1]
Table 2. Key parameters of the XGBoost and PSO-XGBoost models with four seasons.
Key ParametersSpringSummerAutumnWinter
XGBoostPSO-XGBoostXGBoostPSO-XGBoostXGBoostPSO-XGBoostXGBoostPSO-XGBoost
max_depth511510410412
min_child_weight98765798
learning_rate0.350.380.430.450.400.420.340.31
gamma0.540.650.620.730.610.780.520.61
subsample0.610.420.520.350.640.440.770.27
colsample_bytree0.740.410.630.560.780.490.810.22
Disclaimer/Publisher’s Note: The statements, opinions and data contained in all publications are solely those of the individual author(s) and contributor(s) and not of MDPI and/or the editor(s). MDPI and/or the editor(s) disclaim responsibility for any injury to people or property resulting from any ideas, methods, instructions or products referred to in the content.

