Article

Heat and Mass Transfer Characteristics of Oily Sludge Thermal Desorption

School of Mechanical Engineering, Yangtze University, Jingzhou 434023, China
*
Author to whom correspondence should be addressed.
Processes 2024, 12(1), 227; https://doi.org/10.3390/pr12010227
Submission received: 19 December 2023 / Revised: 18 January 2024 / Accepted: 19 January 2024 / Published: 21 January 2024
(This article belongs to the Topic Applied Heat Transfer)

Abstract

:
Oily sludge is a loose material containing solid and multiple liquid components. Thermal desorption is an efficient method of disposing of liquids from oily sludge. Most existing studies have mainly discussed the effect of some external process parameters on thermal desorption, with little discussion on the heat transfer characteristics and the variation in the wet component mass of oily sludge under heating. Small-scale experiments have been performed to measure the rise in temperature and liquid phase content change of the sludge during heating. The temperature rise rate increases with material density and increases faster during the initial heating stage, while it slows down as the liquid phase evaporates. The adhesive shear stress is determined by measuring the pulling force of the test rod, which decreases with decreasing water content and increases significantly with decreasing oil phase content. Heat transfer and energy distribution models have been developed to calculate the rise in the temperature of materials and the evaporation of contained liquids. The heat and mass transfer processes are obtained from simulation calculations by taking the initial material with a mass content of 25% water and 10% oil under a heating temperature of 500 °C. When the heating time reaches 135 min, the drying region reaches the boundary of the test container, at which the material temperature exceeds 350 °C. During the evaporation of different liquid-phase components, there are multiple segments in the corresponding temperature curves. The processing time and heat source temperature can be reasonably determined by analyzing the temperature rise of the material, and the effect of the disposal of liquids from oily sludge can be predicted by analyzing the changes in liquid content. The results may guide the formulation of process parameters for engineering project schemes for oily sludge disposal.

1. Introduction

Oily sludge produced in petroleum exploitation and the petrochemical industry has been classified as hazardous waste [1]. According to approximate estimates, the volume of such waste worldwide is at least 60 million tons annually, and accumulated waste due to the lack of treatment amounts to more than a billion tons [2]. Around the world, there are relatively strict regulations on the treatment and discharge of oily sludge, and the trend is becoming more and more stringent. Among the many treatments, thermal desorption of oily sludge is a resource treatment technique with significant advantages in terms of adaptability, resource recovery, and flexibility of treatment methods. It has obvious benefits in industrial applications [3,4].
Thermal desorption is the process of vaporizing pollutants under heating conditions to separate them from soil solids. It can be divided into ex situ thermal desorption and in situ thermal desorption, which are widely applied [5,6]. Ex situ thermal desorption is applied at remediation sites and works by extracting soil from a contaminated site and then treating it through a specialized thermal desorption system device. Most ex situ thermal desorption requires pre-processing, such as sorting or pre-drying, and the disposal process is relatively lengthy. It requires high device stability, such as against coking or corrosion, which can lead to unstable device operation. In situ thermal desorption techniques are used to remediate contaminated soil without excavation. In particular, in situ thermal desorption not only inherits the advantages of most ex situ thermal desorption treatments but also does not require moving equipment such as feed and discharge conveyors, making operations simpler. It can be used to treat contaminated sites where ex situ remediation is difficult, especially in areas where excavation is inconvenient [7,8]. Compared to ex situ treatment, in situ thermal desorption techniques have less environmental interference and secondary pollution, which aligns more with sustainability. At the same time, it saves costs such as those from the digging, transportation, and pre-treatment of the sludge [9]. Thermal desorption mainly involves enhanced evaporation of the liquid phase, which generates vapor collected for resource recovery and may contain some toxic gases. The vapor should be treated efficiently. There is a risk that harmful substances will diffuse into the air, posing secondary pollution with implications for human health [10]. The engineering applications of in situ thermal desorption techniques have been increasing and have received much attention in recent years, with a wide range of prospects [11].
Experimental methods are the most direct way to study the thermal desorption process. Researchers have adopted small-scale or pilot-scale experimental methods, with most focusing on discussing the impact of parameters such as temperature, residence time, final temperature, heating rate, and addition of catalyst on the treatment effect [12]. The different processes were determined by comparing the environmental benefits and economic indicators [13]. For ex situ thermal desorption, Zhang et al. [14] performed thermal desorption tests at different temperatures (300–550 °C) in conditions with residence times of 7 min and 12 min, respectively. Zhan et al. [15] investigated oily sludge with the oil recovery rate as the assessment index under different heating rates. Zheng et al. [16] tested the composition of gas-phase products under different final temperatures. Li et al. [17] used the self-made Al-MCM-41 catalyst, which served in the pyrolysis treatment of oil sludge. For in situ thermal desorption, a large in situ thermal desorption project in America [18], which heated simultaneously using a total of 907 heater wells in a 3.2-acre source zone, the soil goals were reached after 238 days. Ji et al. [19] researched the temperature variation of surrounding soil during the heating and cooling process with a single heating tube. Kunkel et al. [20] designed soil column experiments to investigate the effects of airflow rate and temperature on the in situ thermal desorption process. Less optimistic is that experimental results in small-scale and pilot-scale experiments vary depending on test methods and operating conditions, making them poorly generally applicable.
Researchers studied oily sludge’s pyrolysis behavior and kinetics by thermogravimetric analysis (TGA). Many experimental results have shown that the heating rate is an important parameter affecting the pyrolysis kinetics of oily sludge [21,22]. Cheng et al. [23] studied and compared the pyrolysis behaviors of different oil sludge samples by TGA. Ma et al. [24] researched the effect of different heating rates on oilfield sludge pyrolysis by TGA and investigated the pyrolysis kinetics using the distributed activation energy model (DAEM). Duan et al. [25] calculated the kinetic parameters of sludge pyrolysis by comparing different methods. Due to the small experimental samples, the TGA method makes it difficult to reflect heat and mass transfer characteristics during heating.
The adhesion property of sludge will change due to the content changes of liquid components during heating, which may impact the equipment’s stable and safe operation [26]. The formation of a drying layer during thermal desorption causes an increase in thermal resistance and a decrease in heating efficiency, and the running resistance of moving parts of equipment increases due to the increased adhesive force, even causing it to fail to operate properly. There are some methods for testing adhesion, such as Ferrasse et al. [27] determining adhesion force based on changes in stirring power, Peeters et al. [28] developing a more straightforward plate method based on the shear box method, and Li et al. [29] judging the adhesion force based on the amount of sludge adhering to the metal wall surface. The adhesion properties of sludge, which contain water and oil, have been poorly studied during heating, and the liquid phase content of the material has the most direct influence on the adhesion properties [30].
Characteristics of the mixed material, such as the mixture density, specific heat capacity, and thermal conductivity, vary with the content of each liquid component, making the analysis difficult. Existing studies have mainly discussed the effect of some external process parameters on thermal desorption, with little discussion on the heat transfer characteristics of oily sludge and the variation in wet component mass under thermal driving. Establishing a reasonable model and further investigating the transfer law in thermal desorption is necessary [31].
In this paper, we create a customized heating device to understand the heat and mass changes during thermal experiments and also attempt to evaluate the adhesion properties quantitatively. By analyzing the temperature rise, heat transfer, and evaporation of the liquid phase, an analytical model is developed to investigate the thermal desorption process further and reasonably calculate the mass and heat changes due to the phase transition during evaporation and their effect on the temperature. This study provides a method for predicting the effects of oily sludge thermal desorption disposal. For in situ thermal desorption, we can more reasonably formulate the process parameters of thermal desorption treatment, such as the heating temperature, the heating time, and the effective treatment area of a single heat source, which can guide the implementation of the construction scheme.

2. Thermal Desorption Experiment

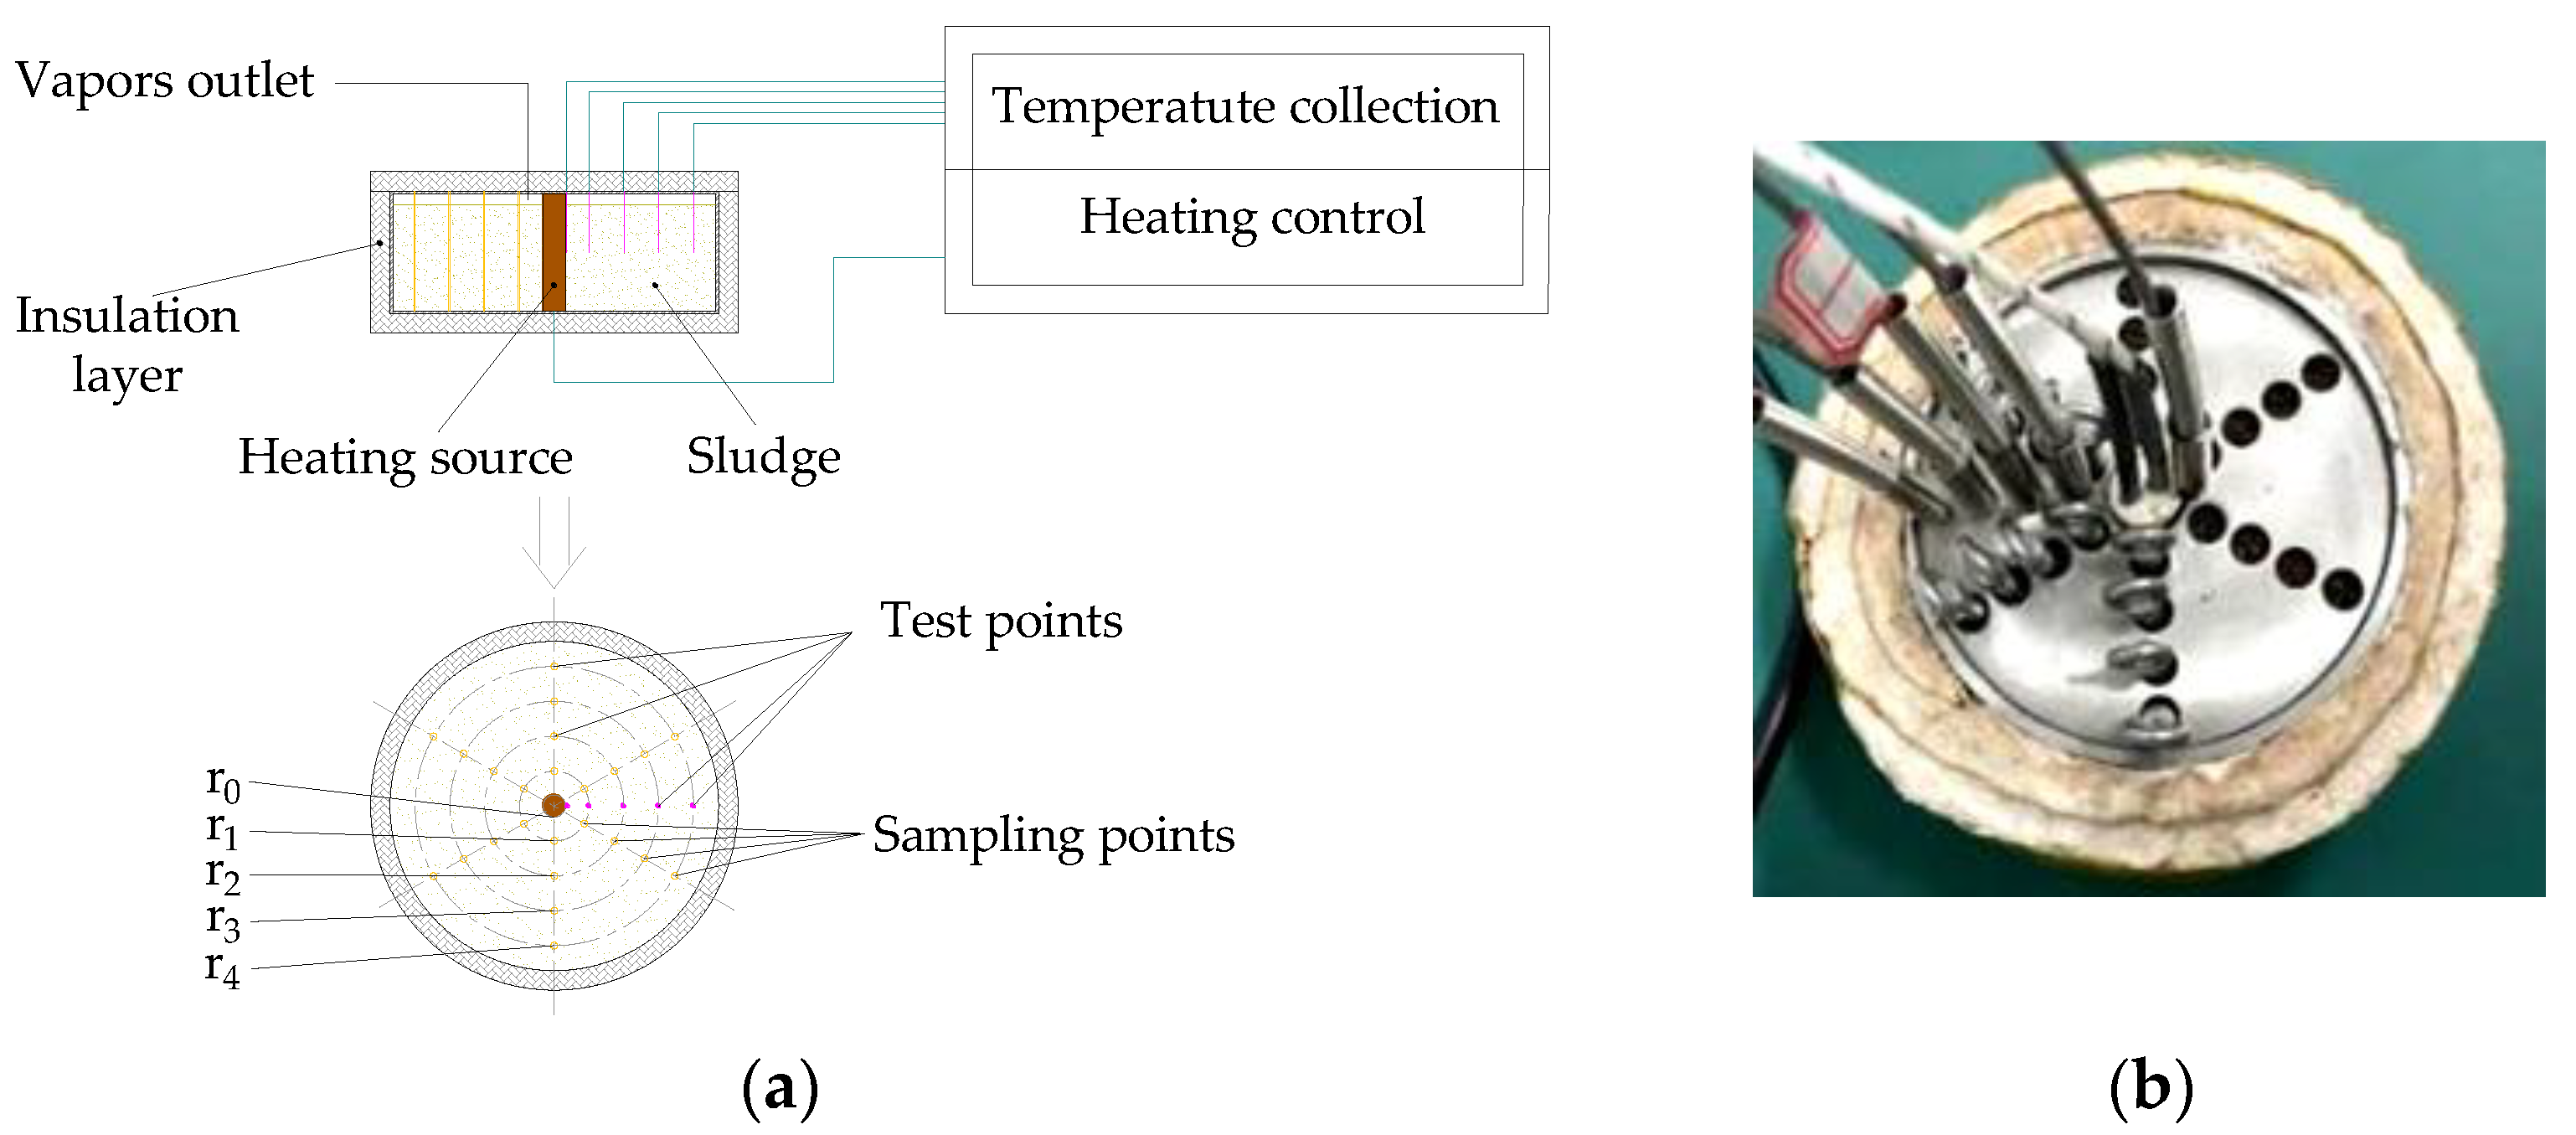
2.1. Experimental Methods and Processes

The experimental scheme is shown in Figure 1 and mainly consists of a material container, a heating controller, and a temperature measurement system. Based on the characteristics of radial heat transfer, the container is designed to be cylindrical, with a heating rod as the central heat source. In the radial direction, temperature probes are arranged at equidistant positions, where temperature variations are monitored over time. Samples were taken at different stages of material heating to determine the residual liquid content. Each sampling point has an equal radius to the corresponding temperature measurement point, and the temperature at the sampling point is consistent with that at the temperature measurement point.
The test rod for adhesion characteristics is a small-diameter cylindrical rod of equal gauge. Before heating, it is arranged on a circumference of equal radius where the temperature measurement point is located. The temperature at the test rod point is consistent with that of the equal radius temperature measuring point. The adhesion force is calculated by pulling out the test rod.
The experimental material is prepared in the laboratory by mixing dry soil, water, and white oil according to a certain mass fraction. The initial density of the material and the content of each component are shown in Table 1, and the white oil flash point is 169 °C.

2.2. Experimental Results and Analysis

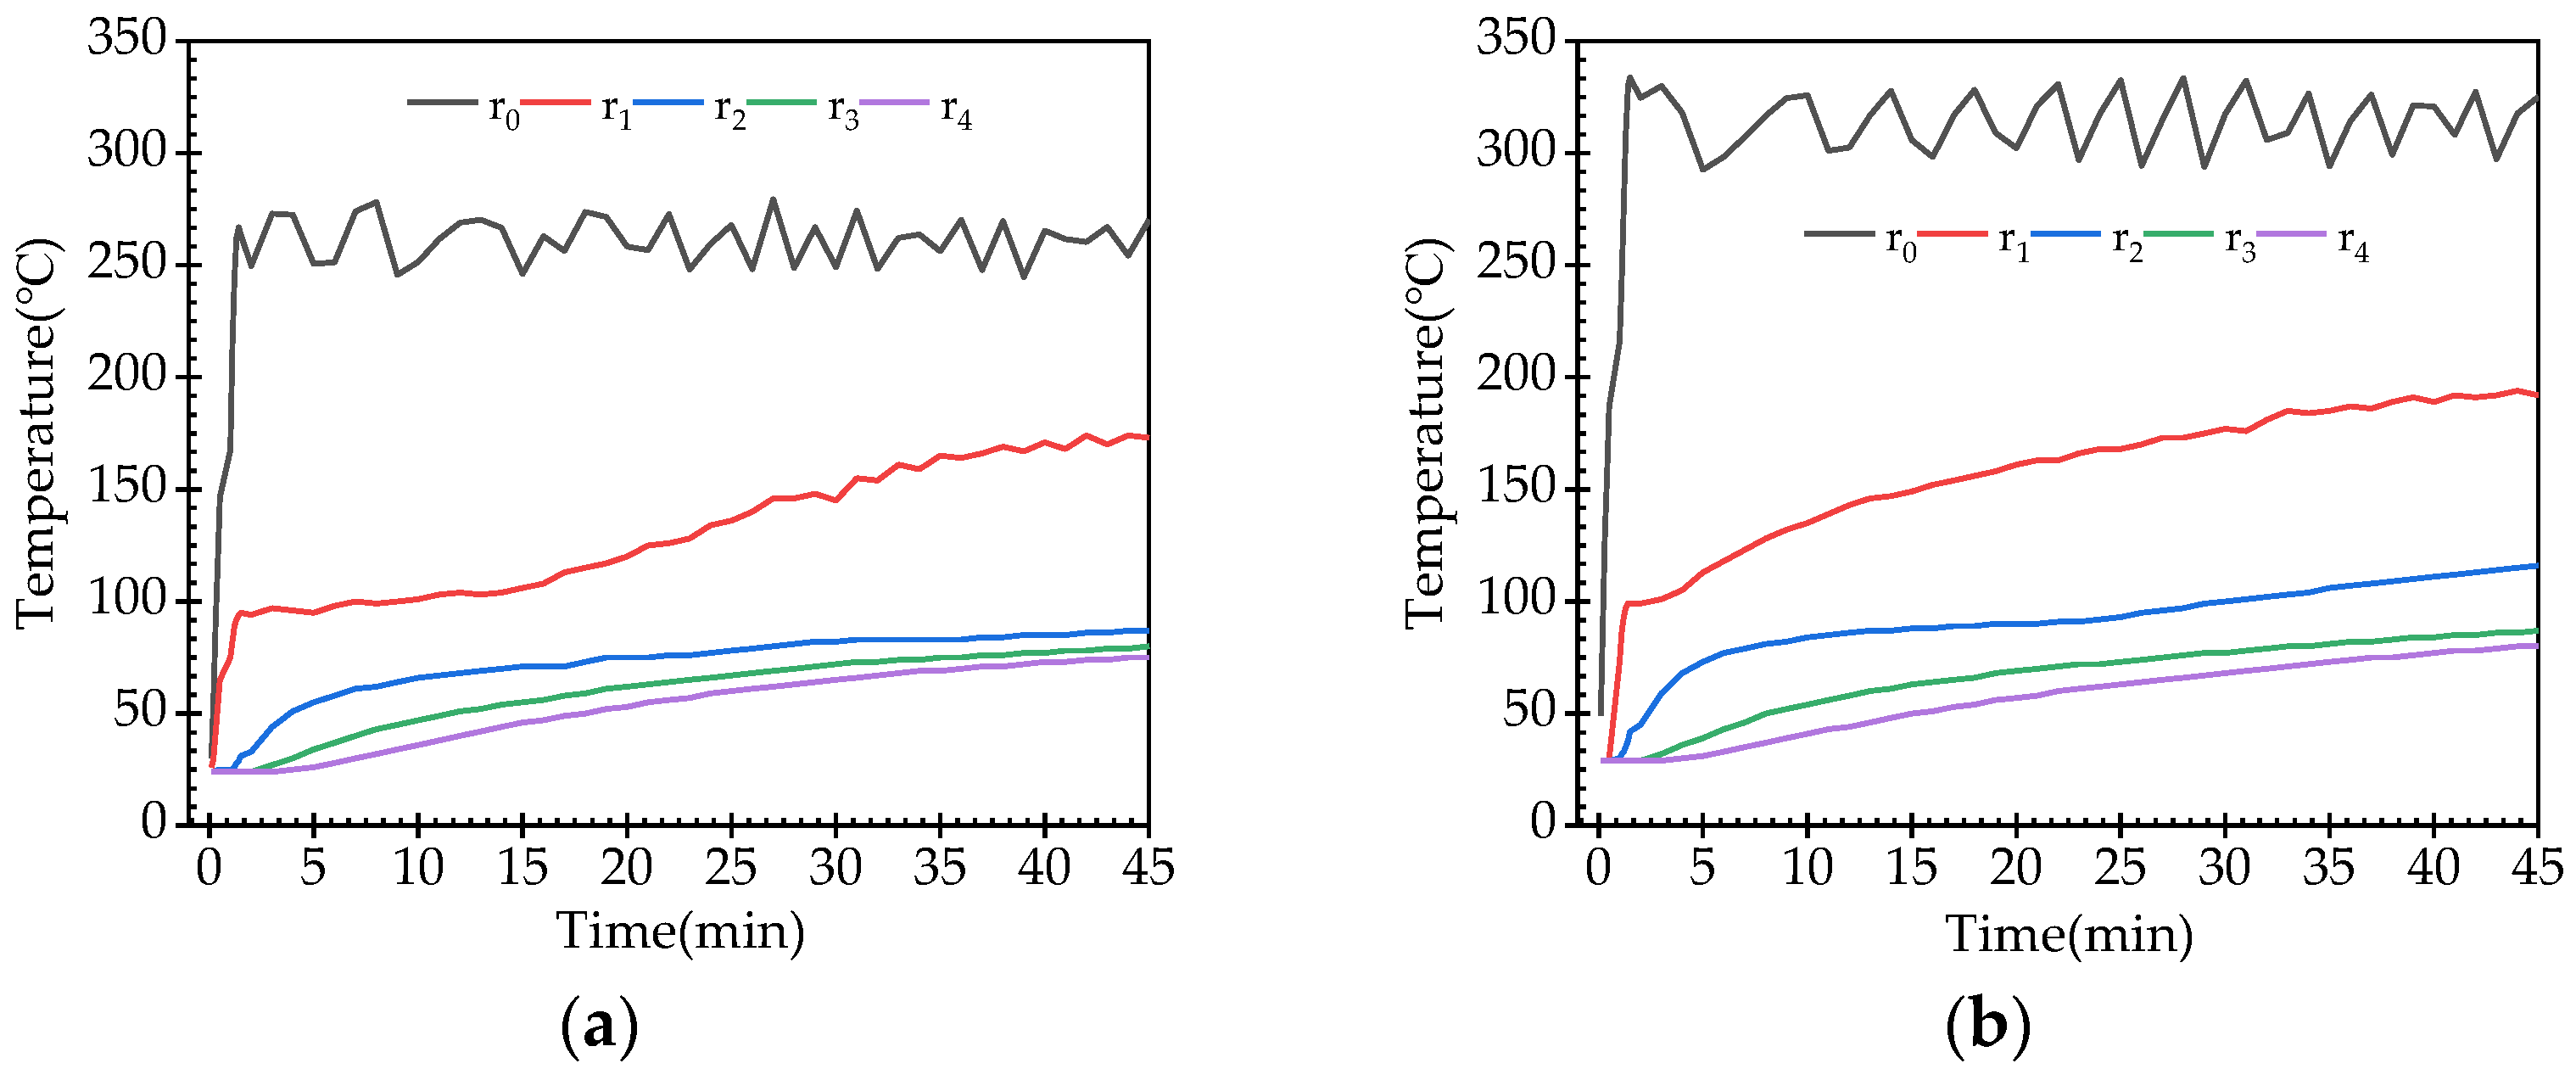
2.2.1. Temperature Changes

The temperature variation with time for each measurement point of the material is shown in Figure 2. It can be seen that the temperature of the heat source rises rapidly in the early stages of heating and reaches the set temperature in a short time. After reaching the preset temperature, there is a small fluctuation of the value, which is caused by the dynamic change in the energy required to evaporate the liquid phase during the heating of the material.
At the position with a radius of r1, the material temperature rapidly increases with the heat source temperature rise in a short time. The material temperature remains unchanged for a short period after reaching 100 °C and then slowly rises with the heating time increase. The farther the temperature measurement point is from the heat source, the slower its temperature rises. At the same heating time, the temperature of the points at radii r2 to r4 is significantly lower than that at r1. The trend of the rise in temperature of the material is generally consistent until the temperature of the liquid component reaches the evaporation point. After reaching the evaporation point, the temperature of the material has a residence time, which varies depending on the content of liquids.
The temperature variation over time for materials with different initial densities is shown in Figure 3. Materials with higher initial densities require less time to reach a particular temperature value. The higher the initial density, the higher the material’s temperature within the same heating time. It can be considered that the higher the density of the material, the higher the efficiency of heat transfer.

2.2.2. Mass Content Changes of Wet Components

The mass fraction variation of the liquid phase of the material is shown in Figure 4. The liquid phase content of each sampling point was measured at heating times of 15, 30, and 45 min. At the location of radius r1, the mass fraction decreases rapidly within 15 min, and the rate of decrease tends to moderate within 15–45 min. When the oil phase is added to the material, the liquid phase content change rate at radius r2 increases significantly, indicating that the energy required for water evaporation is significantly higher than for oil evaporation. The total amount of liquid phase contained in the material gradually decreases with time, and the liquid content changes significantly near the heat source, spreading toward the radial direction with time.

2.2.3. Adhesion Test

Adhesion test rods are embedded in the material before heating. The temperature at the test rod point is consistent with that measured at equal radius. The adhesion stress ( τ ) is calculated by pulling out the test rod, and the formula for the calculation is as follows:
τ = F p m 0 g π d 0 h 0
where m 0 , d 0 , and h 0 are the test rod’s weight, diameter, and embedded depth, respectively, and F p is the force measured when pulling the test rod vertically, measured using a tensile tester.
The results of the adhesion stress test are shown in Table 2. When the liquid content is at a relatively low level (<20%), for sludge containing only water, the higher the liquid content, the lower the adhesion stress, which is negatively correlated with the liquid mass fraction, while for water–oil mixed sludge, the adhesion stress is positively correlated with the liquid mass fraction, with a significantly lower value compared to clay containing only water. It can be found by comparison that adding oil reduces the adhesion effect of the material.
The effect of density on the adhesive stress is shown in Figure 5. The higher the initial density of the material, the greater the adhesive stress. The adhesion stress is positively correlated with the initial density of the mixed material, both for water-only and water–oil mixed sludge.

3. Process Simulation of Thermal Desorption

3.1. Governing Equations

The calculated region has an axisymmetric geometry, and its cross section is shown in Figure 6. The radius of the thermal wall of the heating source is r0, the maximum radius of the calculated region is R, and the thickness is zh. The heating source is controlled by constant power or constant temperature.
There are some supposed conditions that should be taken into account in the calculation. The fluidity of the wet components in the oily sludge is not considered because they have a lower mass content and are generally unsaturated. The effect of vapor diffusion on the material temperature is not considered because the vapor’s residence time is short after evaporation. A small number of possible chemical reactions are ignored since the heating temperature is lower than the reaction temperature, and the physical evaporation process is mainly considered.
According to the solution region, the Fourier heat conduction differential equation is represented as follows:
ρ c t τ = λ 2 t r 2 + λ 2 t z 2 + q v
The source term in the equation represents the change in energy caused by the mass change in the liquid phase, and the source term of the governing equation can be written as follows:
q v = 1 V   h c j m c j τ
where V is the volume of the control volume, h c j is the heat caused by the phase transition of each wet component, and m c j τ is the mass change rate of each wet component.

3.2. Model Solution

3.2.1. Equation Discretization

The finite volume method is used to discretize the solution domain. The conservation equation and the unsteady term, source term, and diffusion term are expressed as follows:
Φ τ n + 1 = Φ Γ n + 1 + Φ v n + 1
Φ τ n + 1 = ρ i , k n c i , k n V i , k t i , k n + 1 t i , k n Δ τ
Φ v n + 1 = j Δ m c j i , k n h c j Δ τ
Φ Γ n + 1 = λ i , k n s i Δ z t i 1 , k n t i , k n Δ r + λ i , k n s i Δ z t i + 1 , k n t i , k n Δ r + λ i , k n s i Δ r t i , k 1 n t i , k n Δ z + λ i , k n s i Δ r t i , k + 1 n t i , k n Δ z
The node temperature control equation is obtained as follows.
t i , k n + 1 = F o _ r i , k n t i + 1 , k n + t i 1 , k n + F o _ z i , k n t i , k + 1 n + t i , k 1 n + 1 2 F o _ r i , k n 2 F o _ z i , k n t i , k n + Δ τ ρ i , k n c i , k n q v i , k n
F o _ r i , k n = a i , k n Δ τ Δ r 2 , F o _ z i , k n = a i , k n Δ τ Δ z 2
a i , k n = λ i , k n ρ i , k n c i , k n
where F o _ r i , k n and F o _ z i , k n are the Fourier numbers with grid sizes Δ r and Δ z as feature scales, respectively; a i , k n is the thermal diffusivity; and λ i , k n , ρ i , k n , c i , k n are thermal conductivity, density, and specific heat capacity, respectively.

3.2.2. Energy Distribution Model

The source term in the discrete equation is the change in energy caused by the change in liquid-phase content in the control volume. For the convenience of solving equations, it is necessary to develop a supplementary equation, the energy distribution model, which relates the energy to the change in mass of each liquid phase.
When the temperature does not reach the initial boiling point (IBP) temperature of the wet components contained, all the heat transmitted to the control volume is used to raise the material temperature. When the temperature reaches the IBP temperature of a wet component in the material, this wet component begins to evaporate. After this component is completely evaporated, the material temperature will continue to rise. The evaporation sequence of wet components is arranged from low to high according to their IBP temperatures. The evaporation mass depends on the heat transferred into the control volume. If the heat transferred into the control volume is still surplus after all wet components have evaporated, it will continue to be used for the material temperature rise.
The wet components of oily sludge are mainly divided into three types (water, light oil, and heavy oil), and their IBP temperatures are set as Tc1, Tc2, and Tc3, respectively, and Tc1 < Tc2 < Tc3. The energy distribution relations are shown in Table 3.

3.2.3. Boundary Conditions

As shown in Figure 6, r0 is the radius of the heating rod, and the corresponding cylindrical surface is the boundary of the heat source. The heating source outputs constant power when the temperature of the thermal wall is lower than the set temperature. When it reaches a set value, thermal wall temperature stability is maintained by constant temperature control.
The boundary conditions of the thermal wall can be written as follows:
t ( r = r 0 ) < T s ,   q ( r = r 0 ) = p w / 2 π r 0 z h t ( r = r 0 ) T s ,   q ( r = r 0 ) = 0                                            
where p w is the thermal wall power density of the heat source.
q r = R = h R t R T 0       q z = 0 = h z 0 t z 0 T 0   q z = z h = h z h t z h T 0
where h R , h z 0 , and h z h are the convective heat transfer coefficients at the outer boundary. These convective heat transfer coefficients are approximately taken to be zero when there are insulating layers on the outer boundaries.

3.3. Simulation Results and Analysis

3.3.1. Model Validation

The solution program was developed for the established model based on Matlab software (R2014b). The validation calculations of the numerical simulations were performed with the same initial and operating conditions as the experiments, and the comparison of the material temperature variations is shown in Figure 7. The temperature at each measurement point of the material gradually increases with the heating time. The two results for the material temperatures at different measurement points have good consistency. Due to the presence of multiple wet components in the material and the varying mass content of each component during heating, it is difficult to determine the thermal conductivity of the material, leading to some discrepancies between simulations and experimental results. From the comparison of the results in Figure 7, it can be concluded that the established model is reasonable and provides a basis for further investigations of the heat and mass transfer laws during thermal desorption.
Further detailed simulations of the thermal desorption process were performed to analyze the temperature profile of the material and the variation in the content of each liquid component. The initial material has a water content of 25% and an oil content of 10% (with light oil accounting for 80% and heavy oil accounting for 20% of the oil content). The heat source temperature is set to 500 °C.

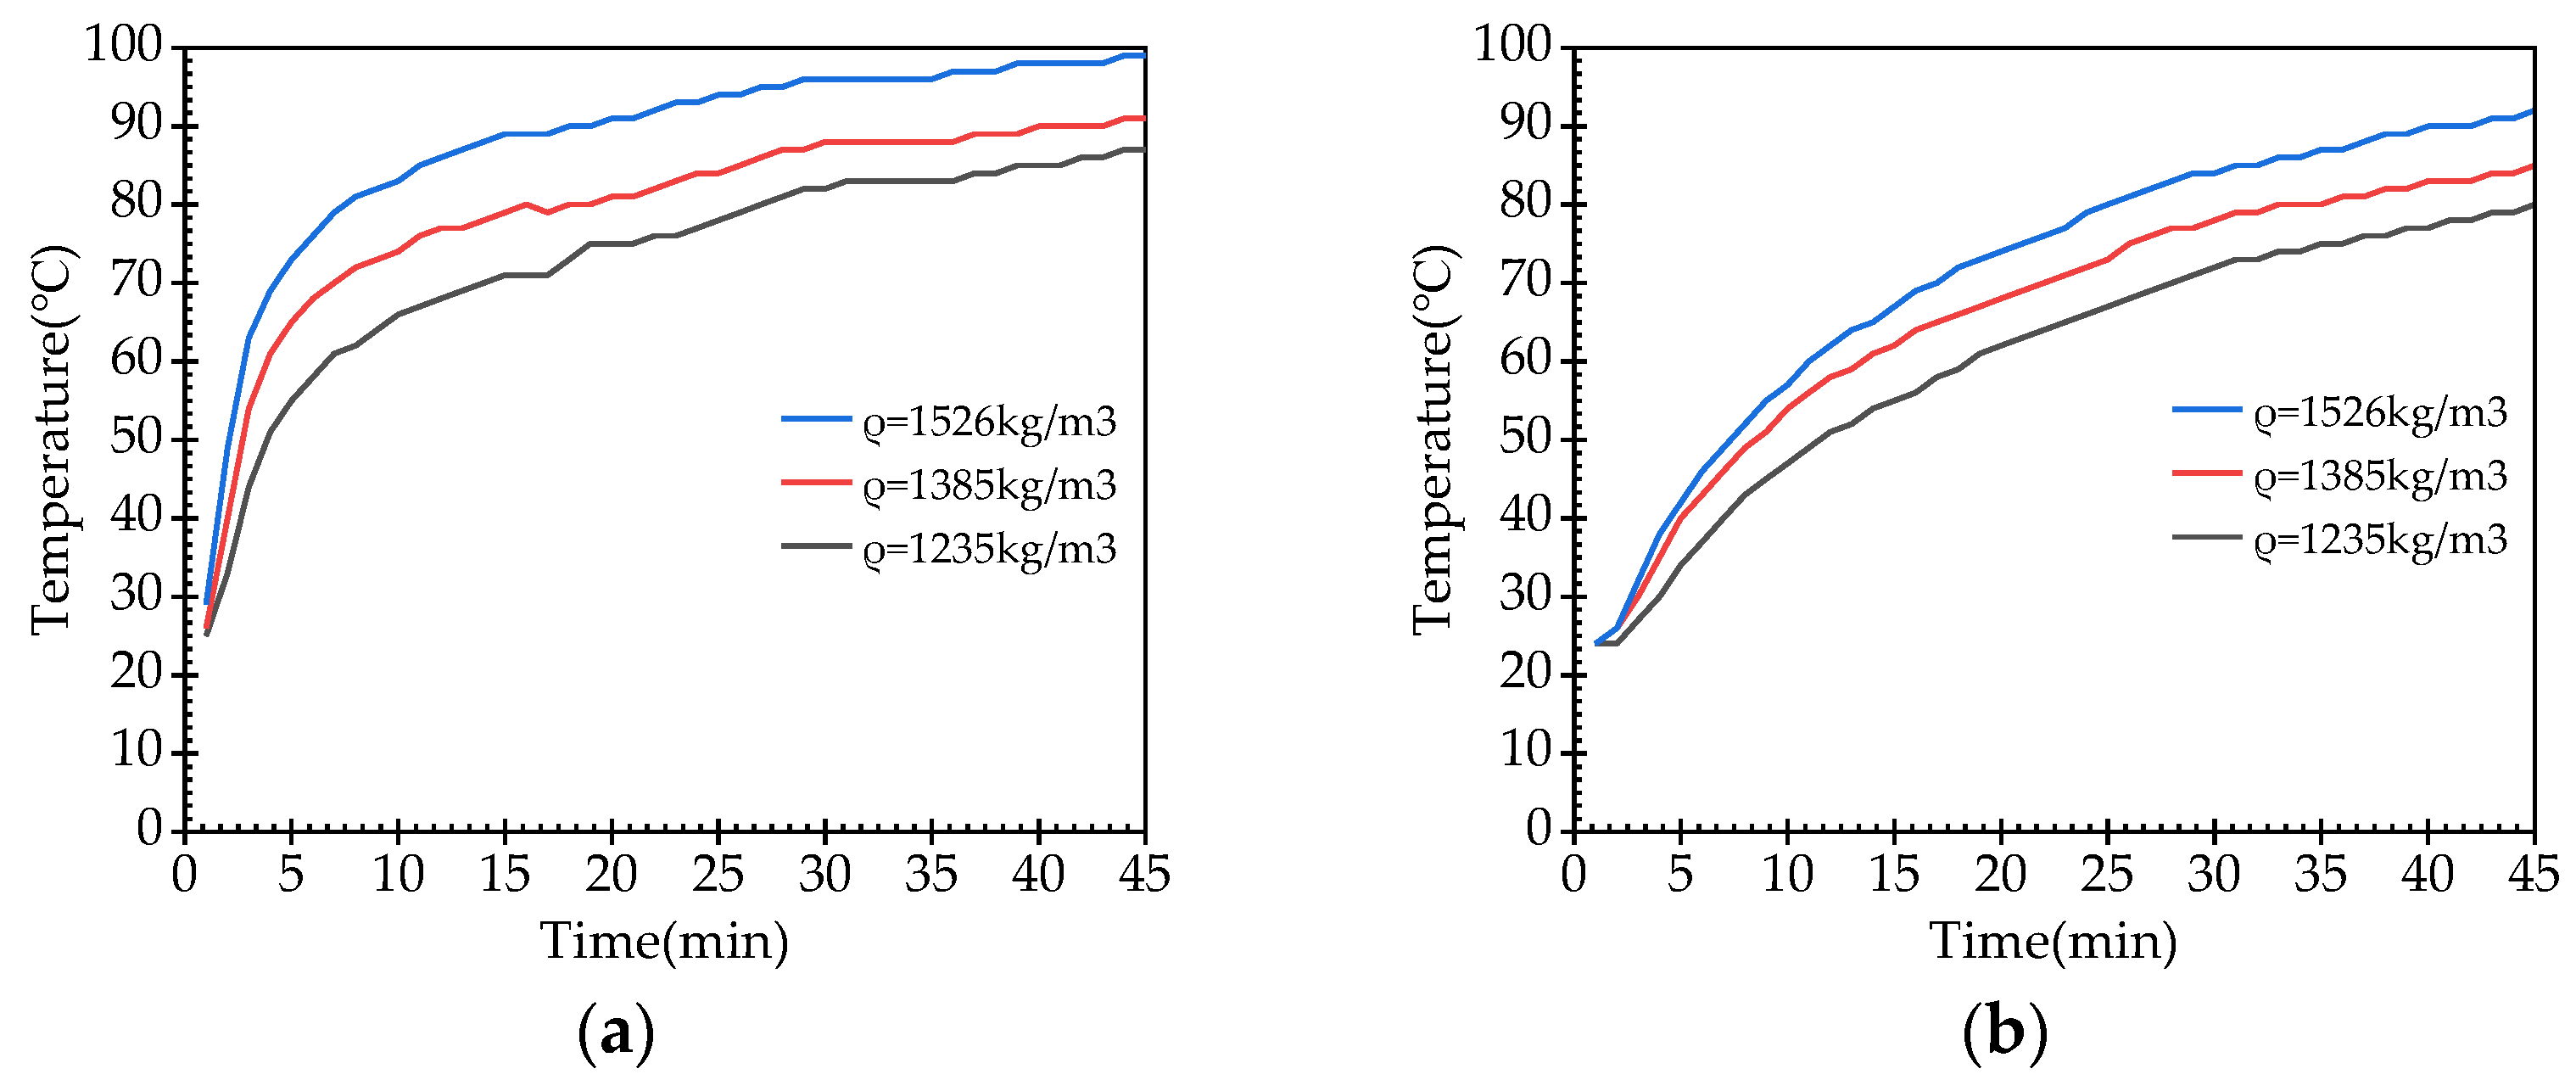
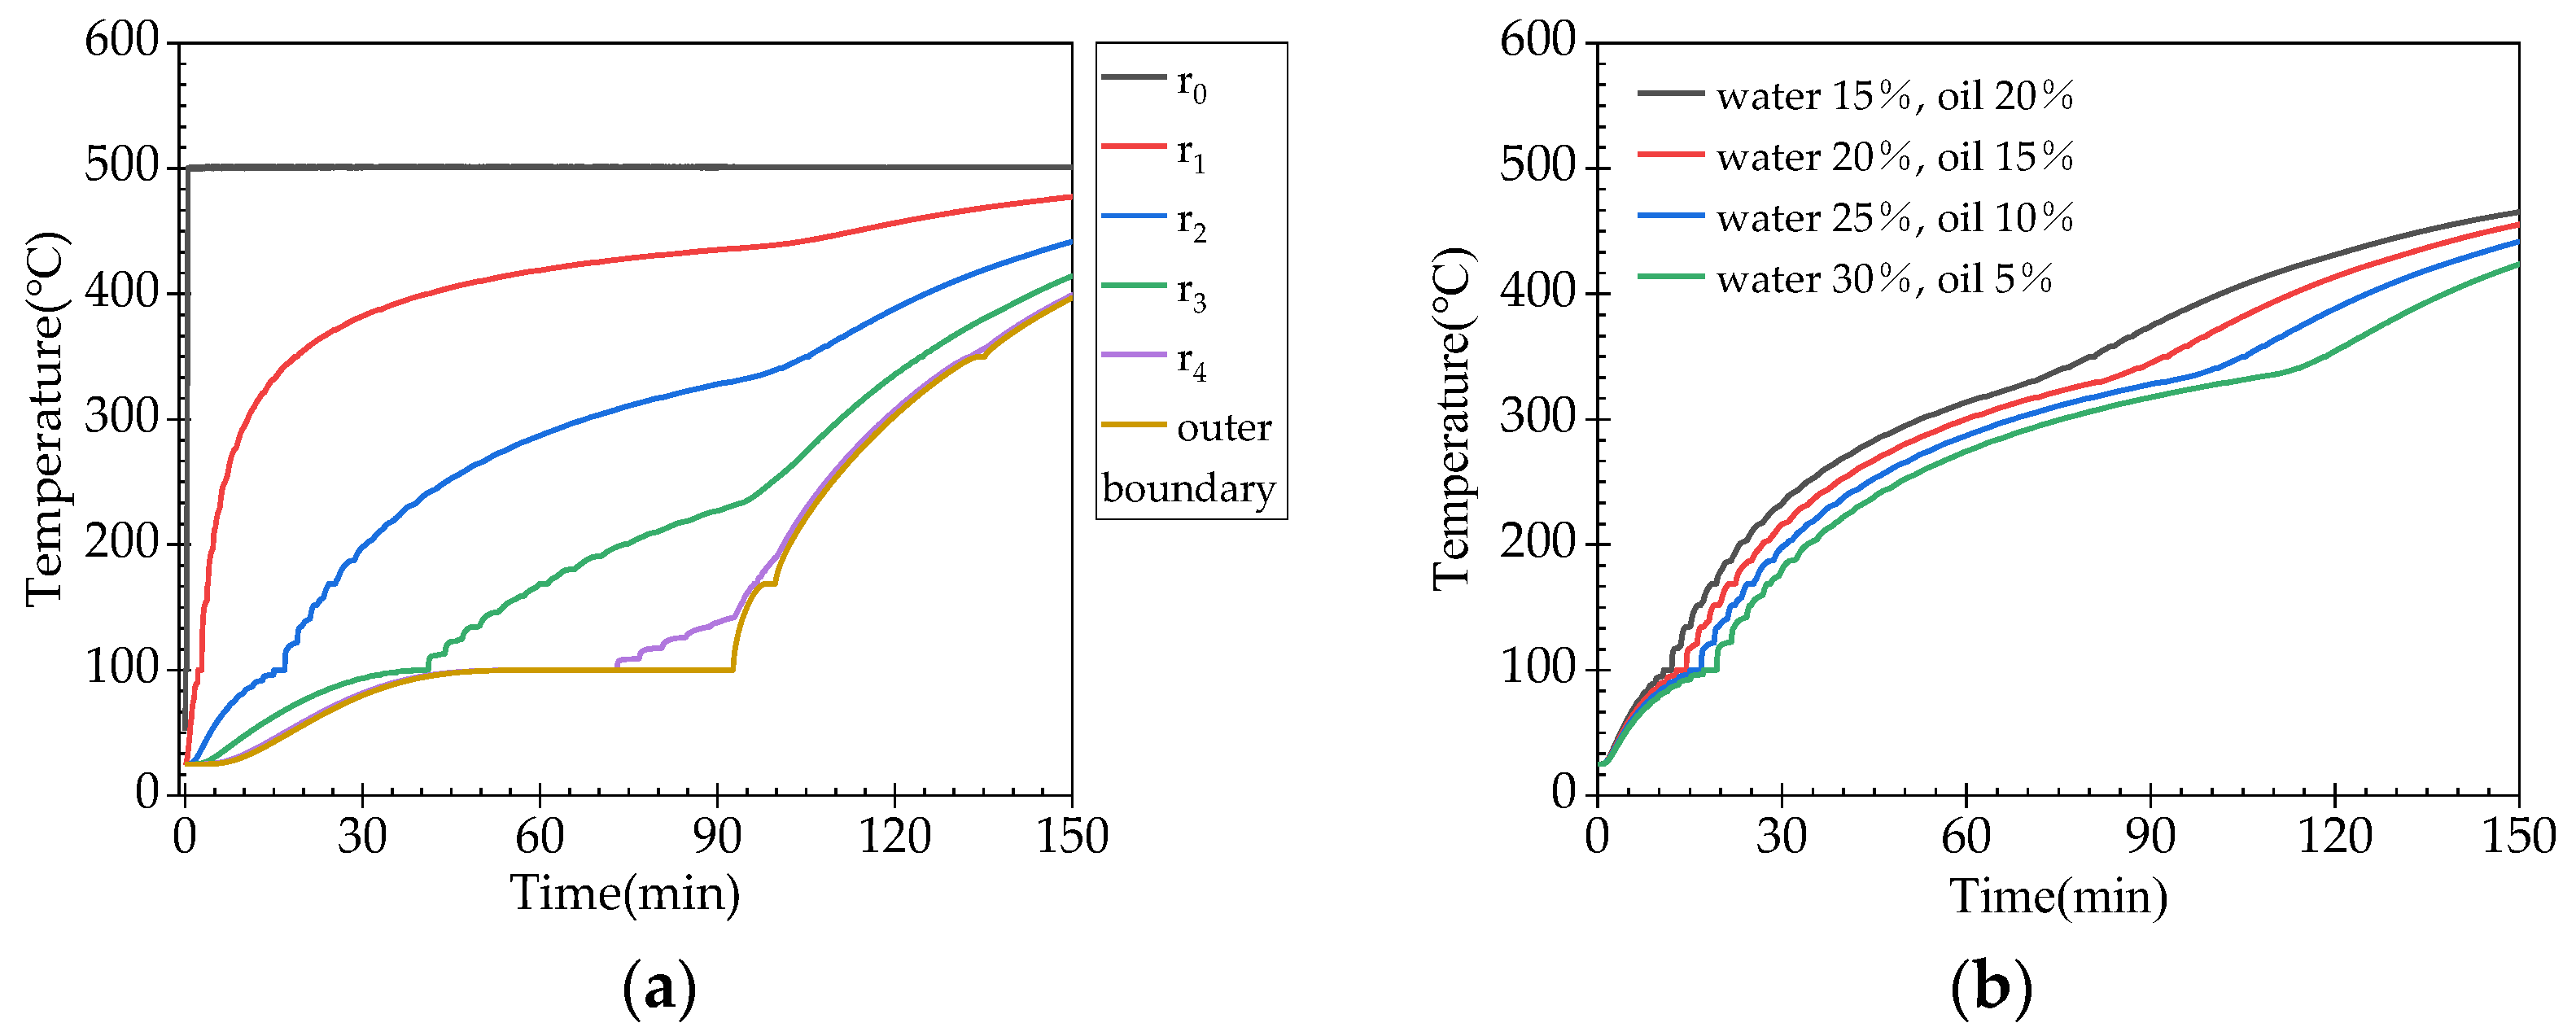
3.3.2. Temperature Changes

The temperature profiles of the material at different times are shown in Figure 8. The temperature of the material gradually shifts along the radial direction from the wall of the heat source as time increases. In the early stages of heating, the temperature gradient at the boundary of the thermal wall is relatively large and the temperature of the boundary material rises rapidly. Over a relatively short period of time, its temperature rises to be essentially the same as that of the thermal wall. The lowest temperature of the material is located at the edge of the container. As the heating time increases, the low-temperature region gradually shrinks. When the heating time reaches 135 min, the outermost edge of the material exceeds 350 °C.
The temperature changes with time at different points from the heat source are shown in Figure 9a. After starting the heating, the temperature of the heating wall rises rapidly to the set value and the temperature stabilizes, achieving constant temperature control. The rise rate of the temperature is different for each measurement point in the radial direction. The trend of the temperature rise at the measurement point with smaller radii is similar to the variation in the temperature of the heat source, while the temperature rise is slower at measurement points with larger radii. When the material temperature reaches the evaporation temperature of liquid water (100 °C), a sluggish temperature stage can be observed in the temperature change curve. The farther the measurement point from the central heat source, the longer the duration of this sluggish stage. The heat transferred in this stage is mainly used for the evaporation of liquid water, while the temperature remains essentially unchanged. As can be seen more clearly from the boundary temperature-change curves, there are sluggish stages when the material temperature reaches the evaporation point of each component (100 °C, 169 °C, 350 °C), and the duration of the sluggish stage depends on the mass fraction and type of the component.
The temperature change curves of materials with different initial mass fractions of water and oil are similar, which are shown in Figure 9b.

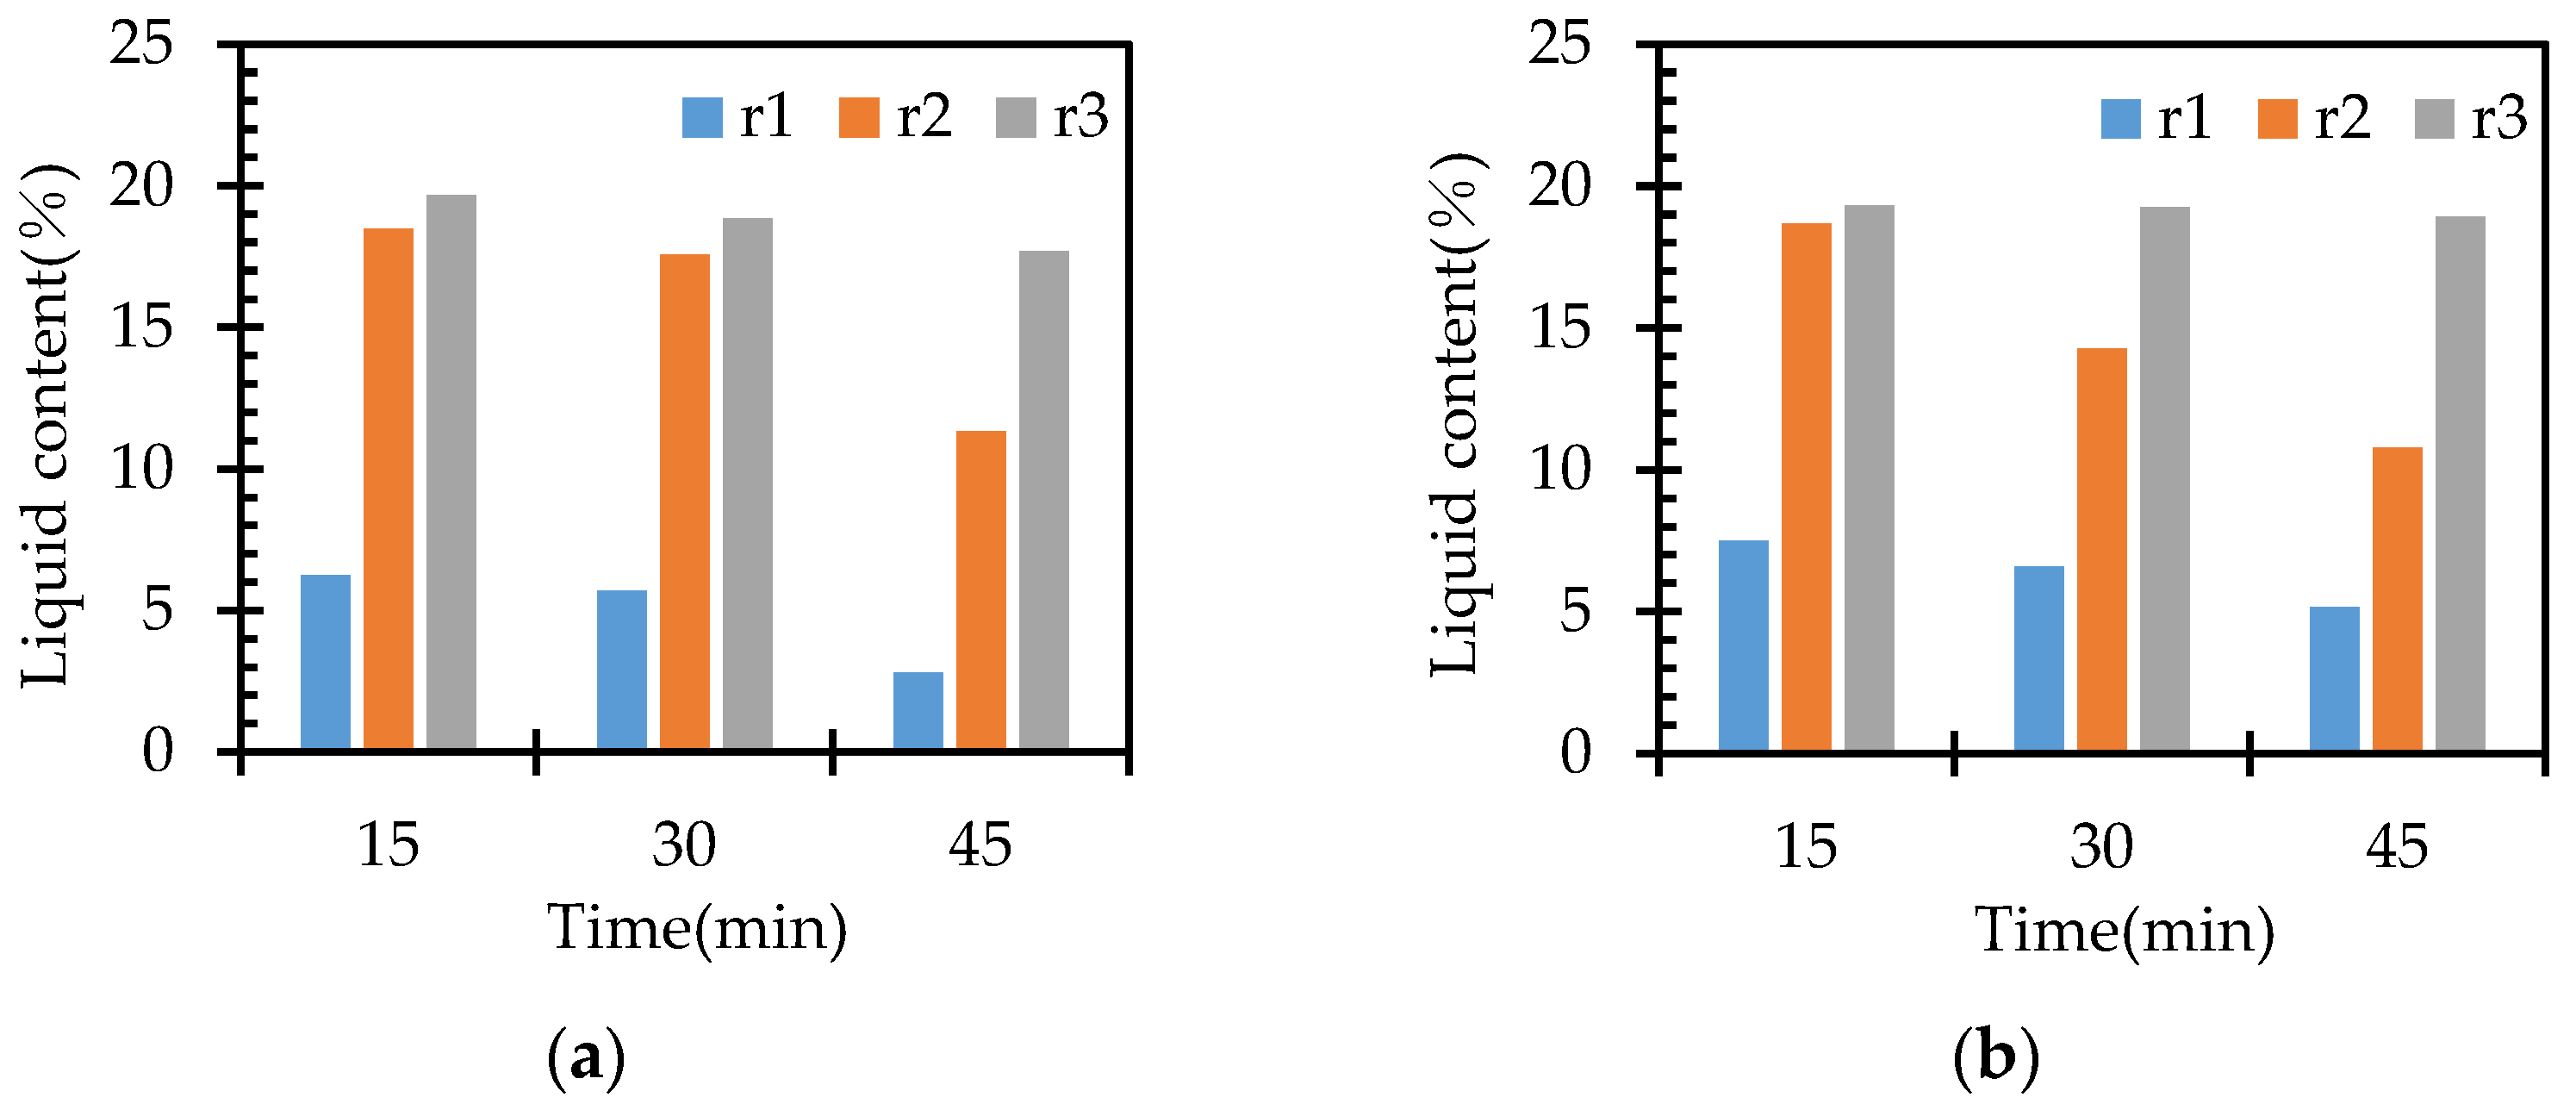
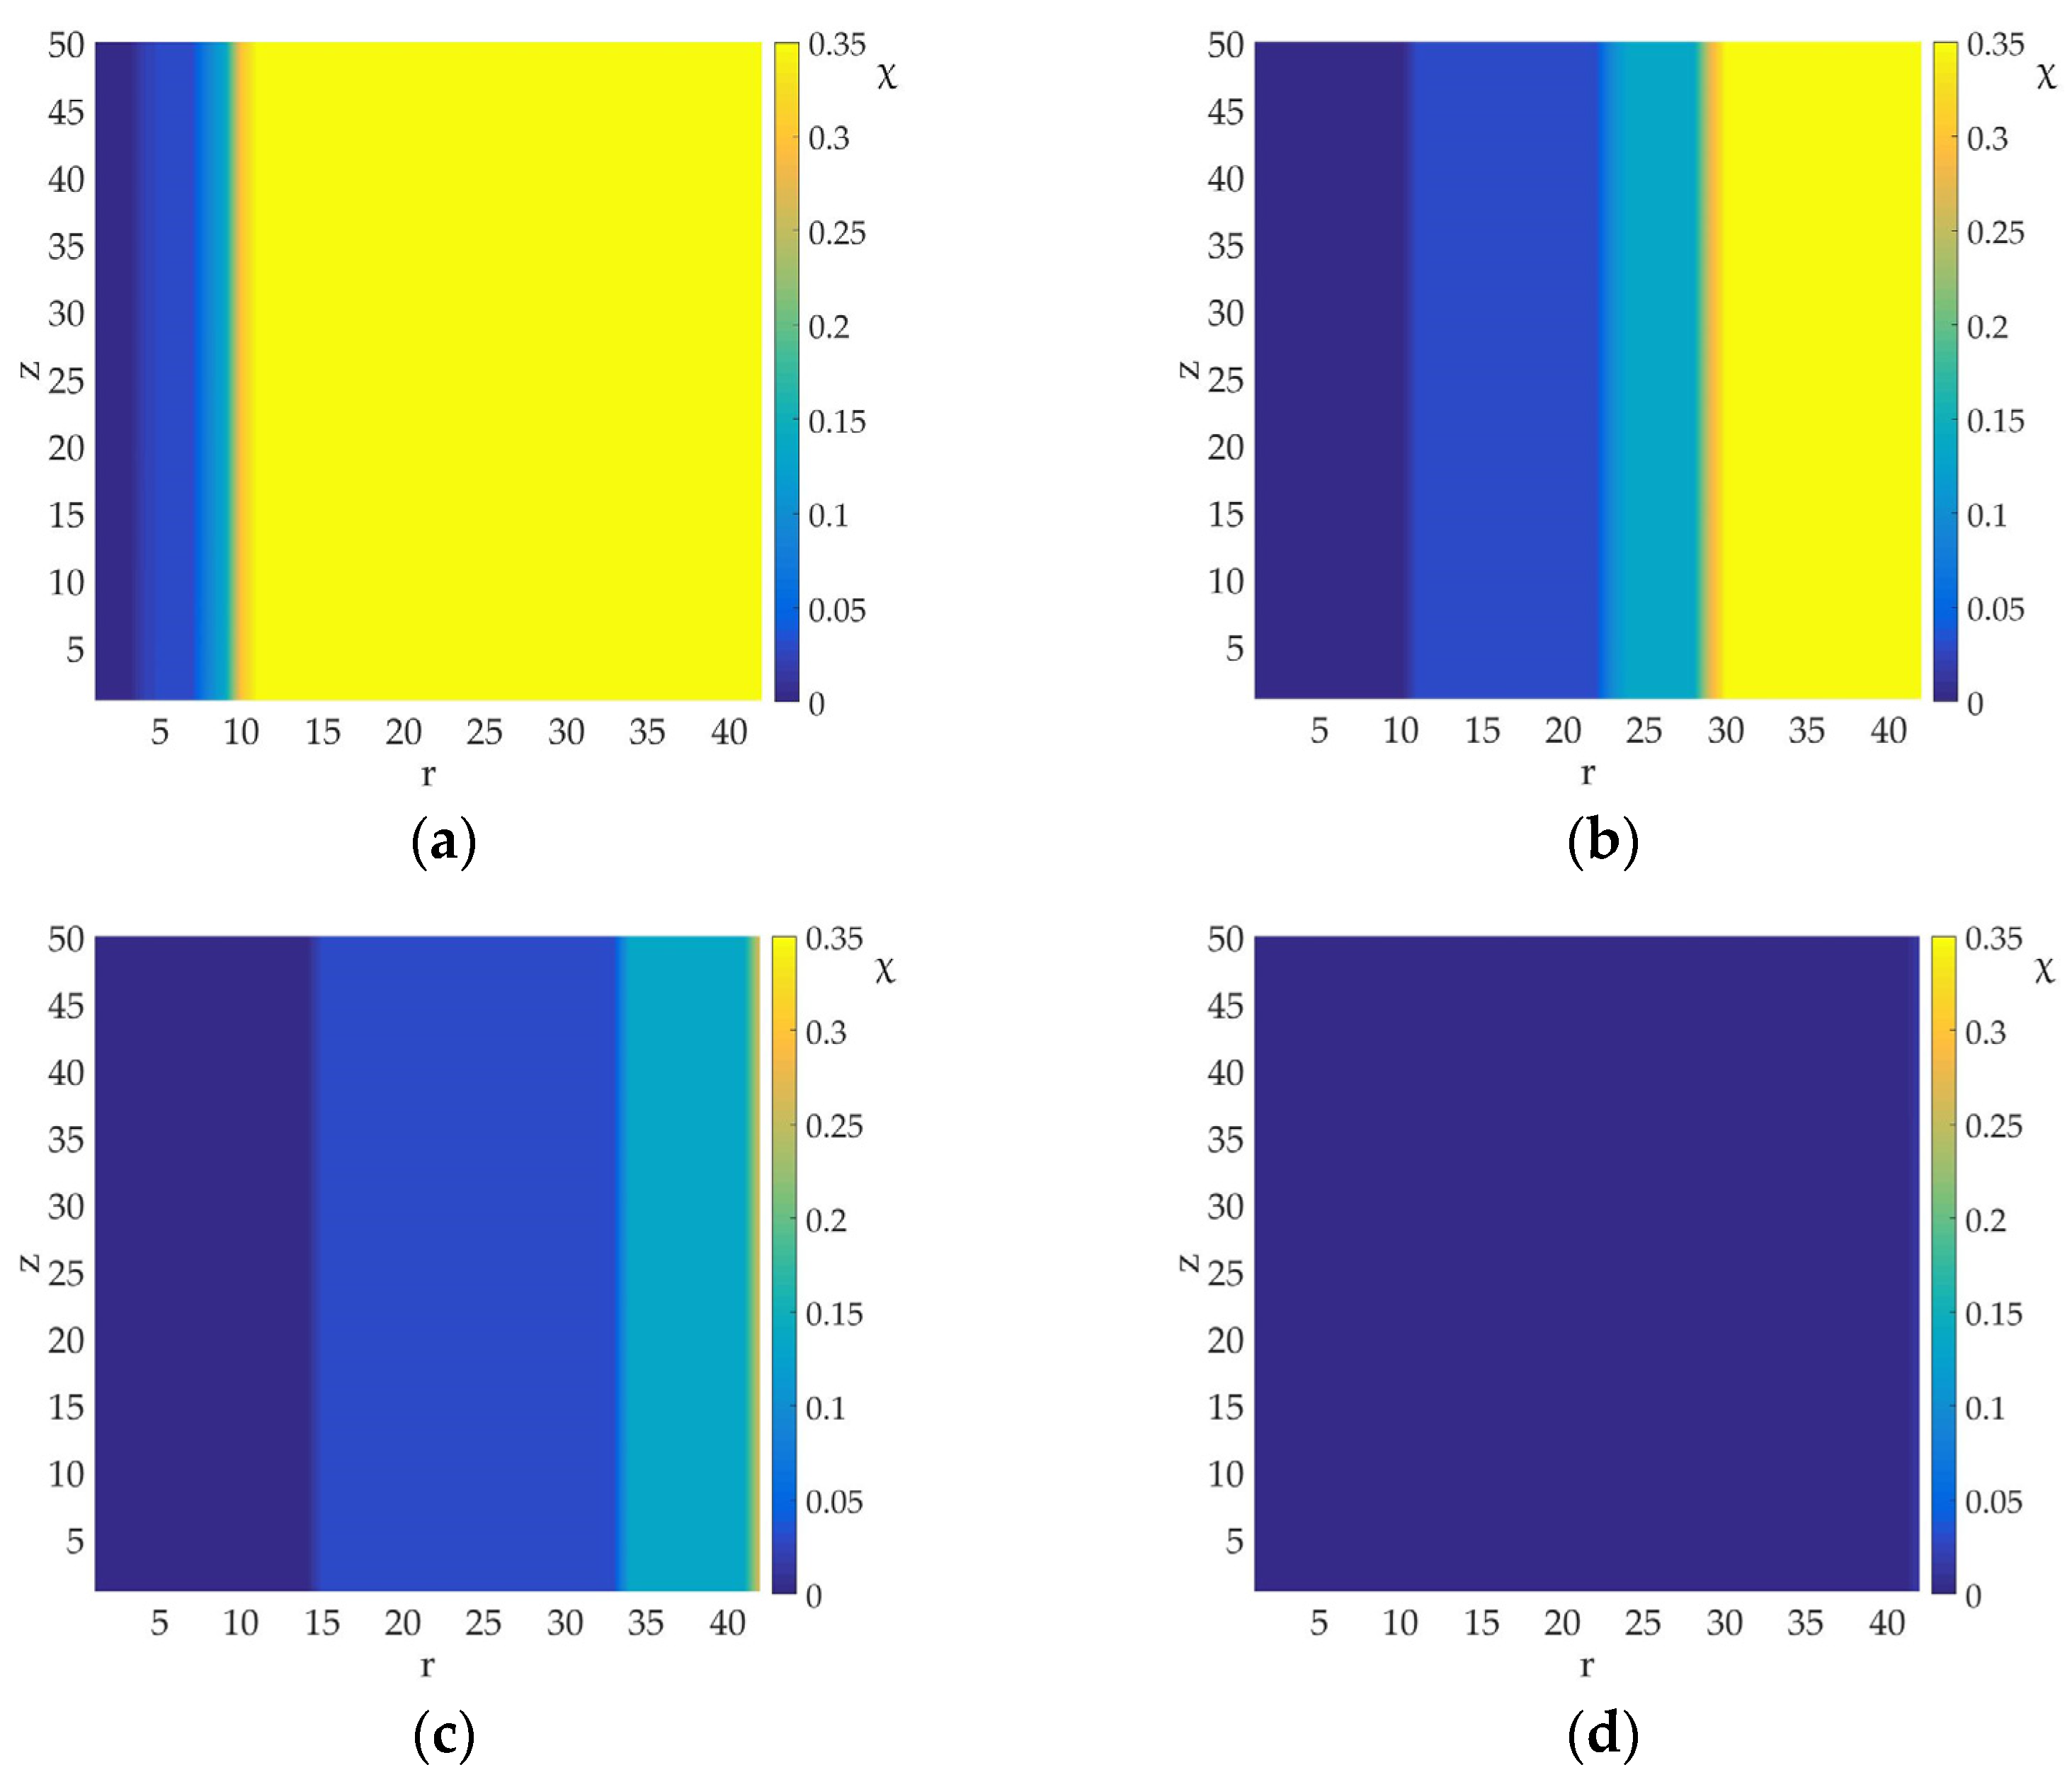
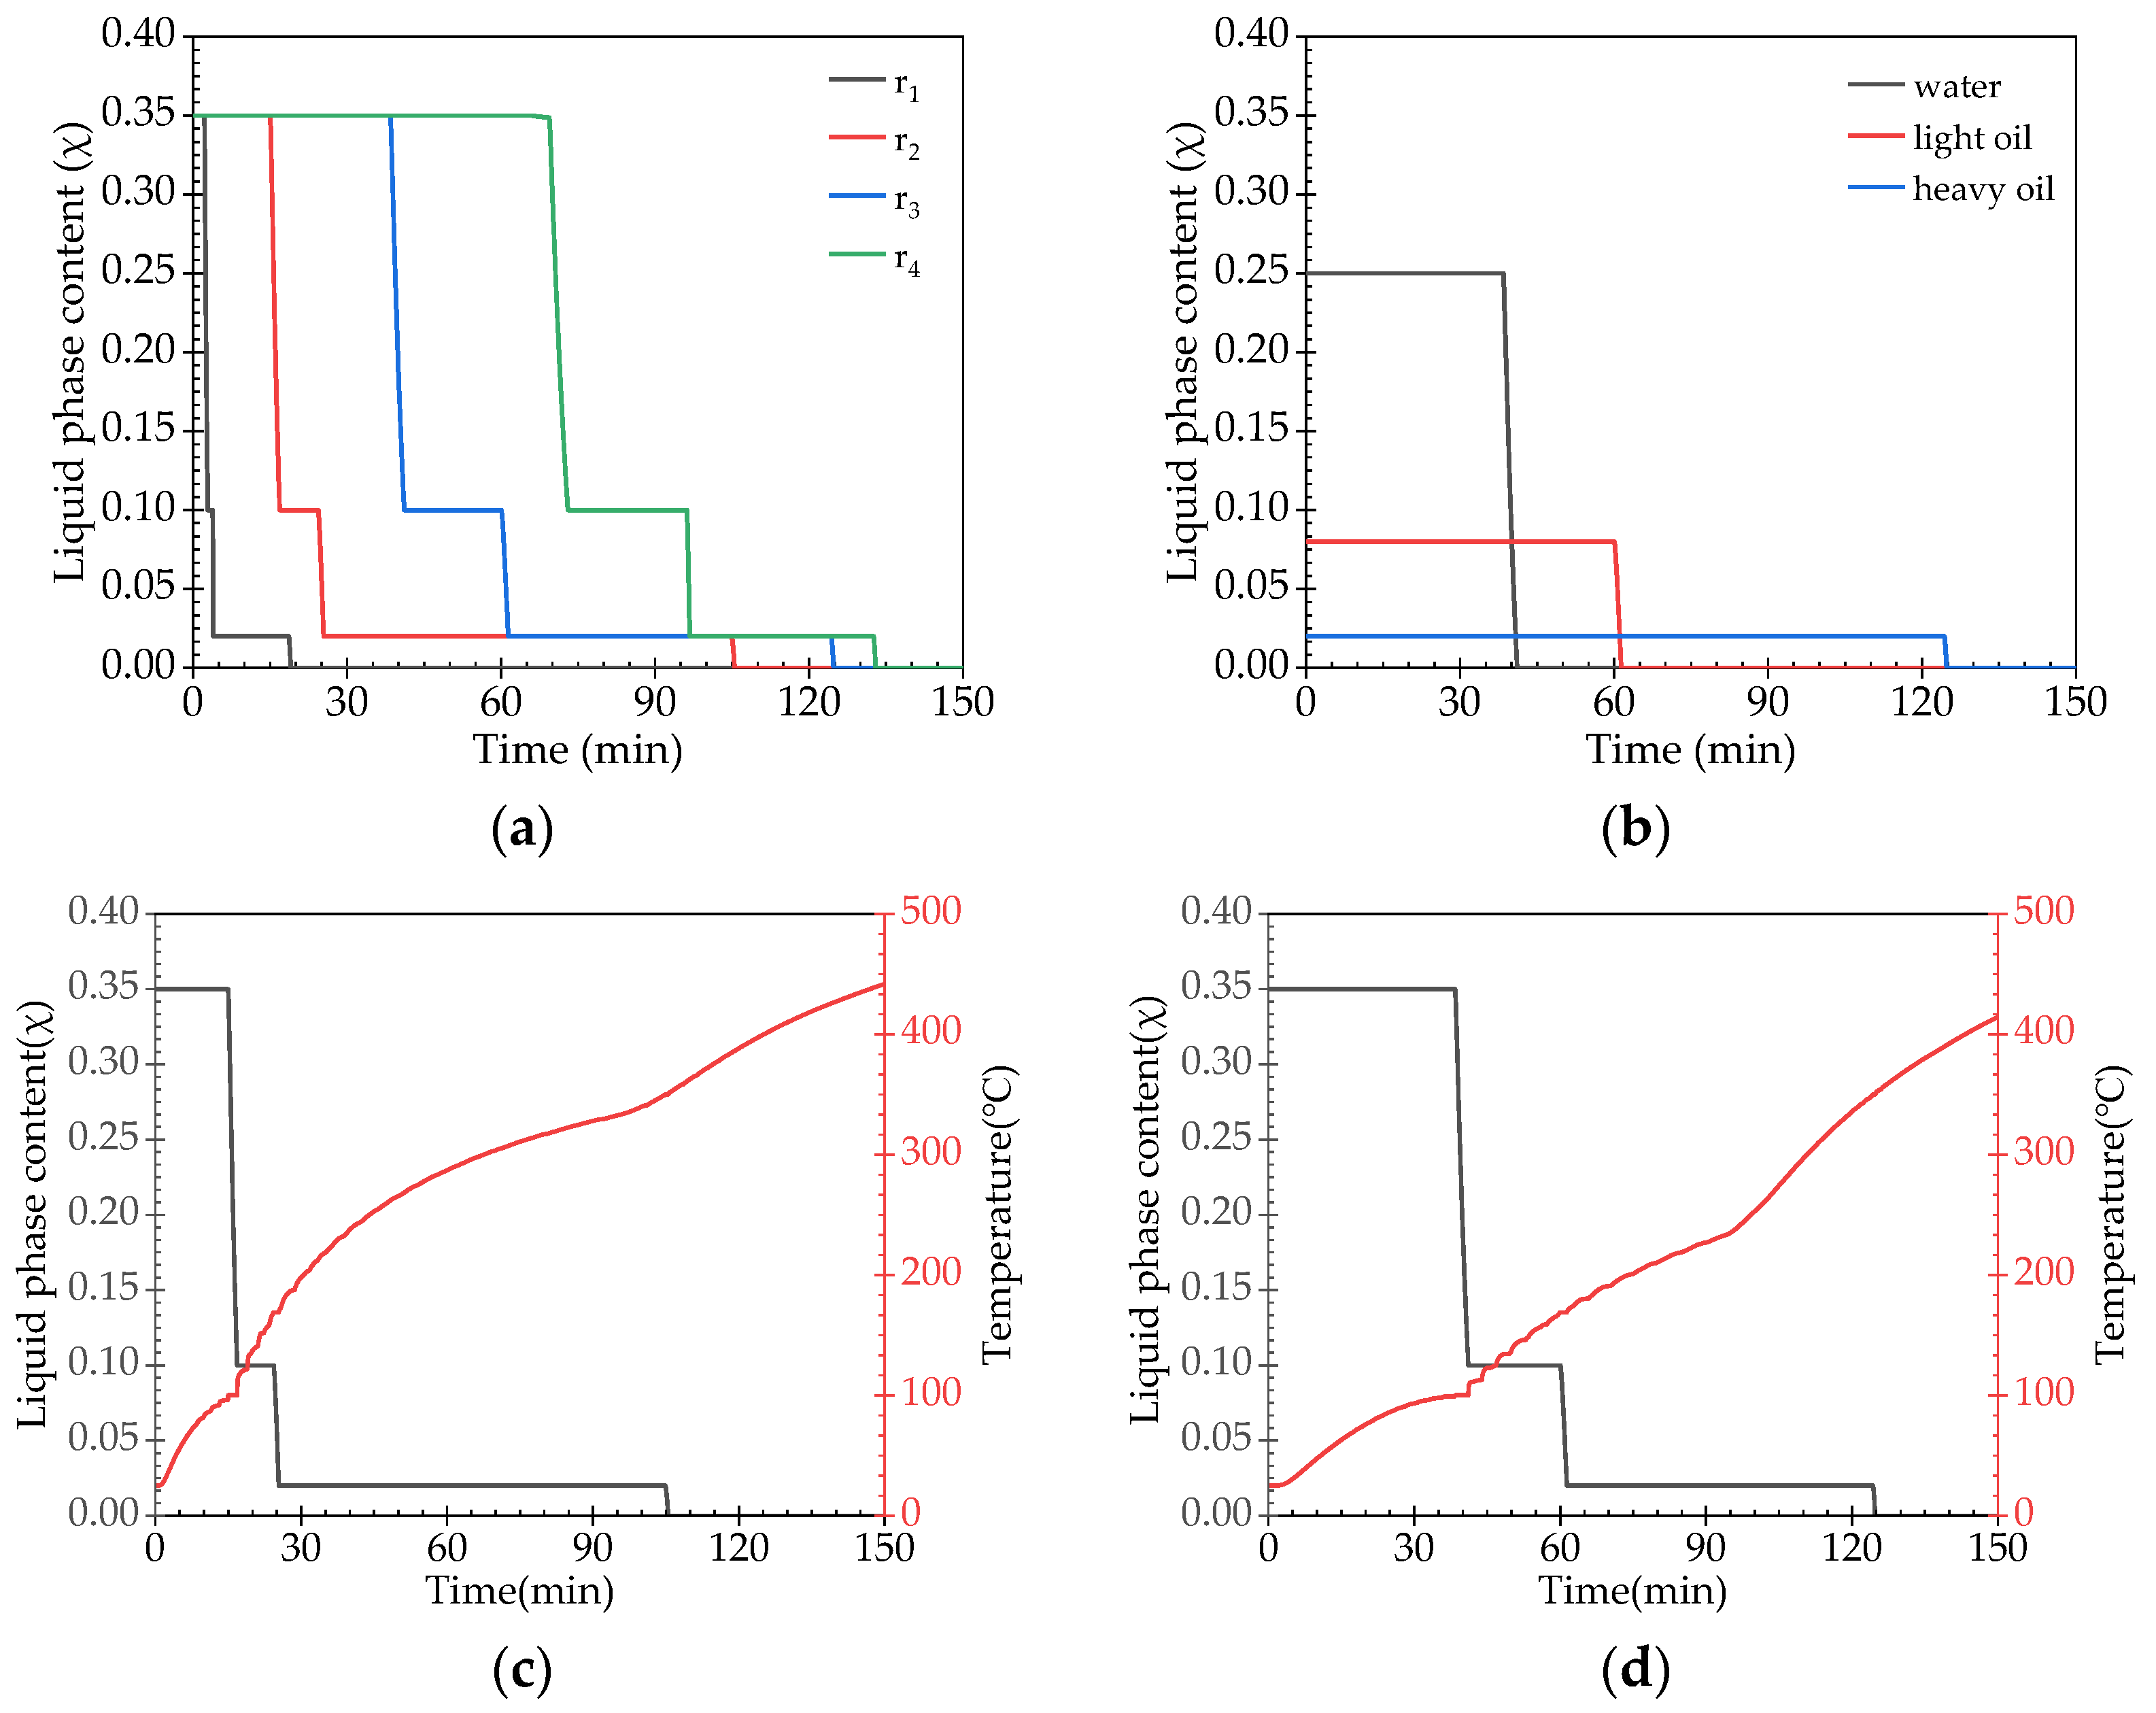
3.3.3. Liquid Component Content Changes

The distribution of the liquid phase in the material with heating time is shown in Figure 10. For a short time, the liquid content of the material near the heater wall decreases to zero and a drying region is formed. As time increases, the drying region gradually spreads radially until it reaches the outer boundary of the container.
Figure 11a shows the variation in the liquid phase content with heating time at different radius locations. There are three descending segments in the liquid phase content change curve, corresponding to the content changes of the three liquid phase components. In detail, the changes in the content of three different liquid components are shown in Figure 11b. When the temperature does not reach the evaporation point of the liquid phase, its content remains unchanged. The curve segment where the content sharply decreases is the liquid evaporation stage, at which the material temperature is approximately equal to the evaporation temperature of this liquid phase, as shown in Figure 11c,d.
It can be seen that the temperature of the material, the content change of each liquid phase, and the heating time are the relevant parameters. For applications in the disposal of oily sludge, these three parameters should be correlated and planned in terms of the initial content of each liquid phase contained. In existing studies dealing with the process parameters of thermal desorption, it may not be reasonable to discuss these three parameters as independent variables.

4. Conclusions

In the process of thermal desorption, the temperature rise of the material is affected by two factors. First, it is affected by the liquid phase content in the material. During the evaporation of the liquid phase, the material’s temperature rise becomes stagnant due to the energy devoted to evaporation. The second factor is the heat conductivity of the material. The factors affecting thermal conductivity are complex, but the basic rule by which it can be judged is that the rate of temperature rise of the material slows down after the formation of the drying layer. That is, the dry layer reduces the rate of heat conduction. Therefore, when designing the heat source power, matching the heat transfer rate should be considered, and there is no need to pursue high power blindly.
Evaporation of the liquid component in the material requires reaching the IBP temperature, and the amount of transmitted energy determines the evaporation rate. The difference in material temperature near the heating wall is significant, and the material heating rate is fast. When the temperature near the hot wall reaches the IBP of the wet component, it first vaporizes, and the material in this region starts to form a dry layer. As temperature and energy are radially transferred, the wet component gradually vaporizes, and the dry layer continuously migrates outward until all liquid phases are removed.
The initial state of the material has an effect on heat and mass transfer, and the content of the liquid phase component directly affects the time required for treatment. During thermal desorption, the evaporation of the liquid follows the order of the IBP temperature from low to high, so the initial water content significantly affects the processing time. At the same time, the initial density also affects the heat transfer rate, with an increase in density favoring heat transfer. The material adhesion stress is related to the liquid content. In the unsaturated state, the water and oil content have opposite effects on the adhesion stress for sludge.
This study focuses on discussing heat and mass transfer properties in thermal desorption, which can guide the formulation of process parameters for engineering project schemes for oily sludge disposal. The treatment time and the heat source temperature can be reasonably determined by analyzing the rise in temperature of the material, and the effect of liquid removal from oily sludge can be predicted by analyzing the changes in liquid content.

Author Contributions

Conceptualization and methodology, X.Z.; analysis model and numerical simulation, K.L. and A.C.; validation and experiments, K.L. and Y.T.; writing—original draft preparation, K.L and A.C.; writing—review and editing, X.Z.; funding acquisition, X.Z. All authors have read and agreed to the published version of the manuscript.

Funding

This research was funded by the Scientific Research Project of Hubei Provincial Department of Education, grant number D20211304.

Data Availability Statement

The data supporting the findings of this study are available within the article.

Conflicts of Interest

The authors declare no conflicts of interest.

References

  1. Environmental Protection Department (EPD). The National Hazardous Waste List. 000014672/2020-01495. Available online: https://www.mee.gov.cn/xxgk2018/xxgk/xxgk02/202011/t20201127_810202.html (accessed on 27 November 2020).
  2. Egazar’yants, S.V.; Vinokurov, V.A.; Vutolkina, A.V.; Talanova, M.Y.; Frolov, V.I.; Karakhanov, E.A. Oil Sludge Treatment Processes. Chem. Technol. Fuels Oils 2015, 51, 506–515. [Google Scholar] [CrossRef]
  3. Cheng, S.; Wang, Y.; Fumitake, T.; Kouji, T.; Li, A.; Kunio, Y. Effect of steam and oil sludge ash additive on the products of oil sludge pyrolysis. Appl. Energy 2017, 185, 146–157. [Google Scholar] [CrossRef]
  4. Li, J.; Lin, F.; Li, K.; Zheng, F.; Yan, B.; Che, L.; Tian, W.; Chen, G.; Yoshikawa, K. A critical review on energy recovery and non-hazardous disposal of oily sludge from petroleum industry by pyrolysis. J. Hazard. Mater. 2021, 406, 124706. [Google Scholar] [CrossRef] [PubMed]
  5. Li, F.; Zhang, Y.; Wang, S.; Li, G.; Yue, X.; Zhong, D.; Chen, C.; Shen, K. Insight into ex-situ thermal desorption of soils contaminated with petroleum via carbon number-based fraction approach. Chem. Eng. J. 2020, 385, 123946. [Google Scholar] [CrossRef]
  6. Xu, X.; Hu, N.; Wang, Q.; Fan, L.; Song, X. A numerical study of optimizing the well spacing and heating power for in situ thermal remediation of organic-contaminated soil. Case Stud. Therm. Eng. 2022, 33, 101941. [Google Scholar] [CrossRef]
  7. Li, J.; Hu, J.; Ma, W.; Wang, P.; Zheng, H.; Lu, R. Research progress on remediation technology of petroleum contaminated soil. Chin. J. Ecol. 2023, 1–12. [Google Scholar]
  8. Ji, W.; Fu, R.; Gao, C.; Yao, J. The transformation and migration of contaminants during the remediation process of heterogeneous strata by the in-situ thermal conductive heating (TCH) technology: A literature review. Arch. Environ. Prot. 2023, 49, 94–102. [Google Scholar]
  9. Wang, D.; Chen, C.; Li, C.; Xu, X.; Li, F.; Zhang, Y. Overview for in situ thermal desorption and off-gas treatment of organic compounds contaminated soil. Mod. Chem. Ind. 2020, 40, 55–59+65. [Google Scholar] [CrossRef]
  10. Wang, Y.; Ma, F.; Zhang, Q.; Gu, Q. Review of treatment technologies for thermal desorption off gas. J. Environ. Eng. Technol. 2017, 7, 52–58. [Google Scholar]
  11. Wu, J.; Fang, Z.; Xue, C.; Wang, K. Bibliometric analysis of patents for the soil remediation of organic contaminated sites in China. Chin. J. Environ. Eng. 2019, 13, 2015–2024. [Google Scholar]
  12. Wang, J.; Gong, Z.; Zhu, L.; Chu, Z.; Wang, Z. Research progress of catalytic pyrolysis of oil sludge. Appl. Chem. Ind. 2022, 51, 1164–1167+1173. [Google Scholar] [CrossRef]
  13. Zhao, H.; Chen, D.; Hong, L.; Feng, Y. Target Products of Oily Sludges Pyrolysis Disposal. Acta Pet. Sin. Pet. Process. Sect. 2020, 36, 557–567. [Google Scholar]
  14. Zhang, X.; Yao, A. Pilot experiment of oily cuttings thermal desorption and heating characteristics study. J. Pet. Explor. Prod. Technol. 2019, 9, 1263–1270. [Google Scholar] [CrossRef]
  15. Zhan, Y.; Zhang, L.; Xie, J.; Dong, B.; Wei, T.; Huang, Y. Effect of final pyrolysis temperature on characteristics of three-phase products of oily sludge. Chin. J. Environ. Eng. 2021, 15, 2409–2416. [Google Scholar]
  16. Zheng, F.; Li, H.; Lin, F.; Zang, Y.; Wu, Y.; Cheng, Z.; Ma, W.; Chen, G. Pyrolysis characteristics and pollutant release characteristics of Daqing oil sludge. Chem. Ind. Eng. Prog. 2022, 41, 476–484. [Google Scholar]
  17. Li, Y.; Hu, H.; Qu, C.; Yu, T. Influencing factors for catalytic pyrolysis of oily sludge and analysis of pyrolysis products. Mod. Chem. Ind. 2018, 38, 67–71. [Google Scholar]
  18. Heron, G.; Parker, K.; Fournier, S.; Wood, P.; Angyal, G.; Levesque, J.; Villecca, R. World’s Largest In Situ Thermal Desorption Project: Challenges and Solutions. Ground Water Monit. Rem. 2015, 35, 89–100. [Google Scholar] [CrossRef]
  19. Ji, L.; Liu, P.; Wei, Y.; Chen, Y.; Wang, W.; Yang, Y.; Zhan, M.; Yan, L.; Li, S. Research on temperature variation in soil during in-situ heating with single heating tube. Environ. Eng. 2019, 37, 165–169. [Google Scholar]
  20. Kunkel, A.M.; Seibert, J.J.; Elliott, L.J.; Kelley, R.; Katz, L.E.; Pope, G.A. Remediation of elemental mercury using in situ thermal desorption (ISTD). Environ. Sci. Technol. 2006, 40, 2384–2389. [Google Scholar] [CrossRef]
  21. Wang, B.; Ma, Y.; Yue, C.; Li, S.; Tang, X.; Chang, S. Thermal and kinetic study into pyrolysis and combustion of Jihua oil sludge. Pet. Sci. Bull. 2021, 6, 292–301. [Google Scholar]
  22. Wang, J.; Liu, T.; Huang, Q.; Chi, Y.; Ma, Z. Slow pyrolysis characteristics of petroleum sludge. CIESC J. 2017, 68, 1138–1145. [Google Scholar]
  23. Cheng, S.; Chang, F.; Zhang, F.; Huang, T.; Yoshikawa, K.; Zhang, H. Progress in thermal analysis studies on the pyrolysis process of oil sludge. Thermochim. Acta 2018, 663, 125–136. [Google Scholar] [CrossRef]
  24. Ma, Z.; Xie, J.; Gao, N.; Quan, C. Pyrolysis behaviors of oilfield sludge based on Py-GC/MS and DAEM kinetics analysis. J. Energy Inst. 2019, 92, 1053–1063. [Google Scholar] [CrossRef]
  25. Duan, Y.; Gao, N.; Quan, C. Effect of hydrothermal treatment on pyrolysis characteristics and kinetics of oily sludge. Chem. Ind. Eng. Prog. 2023, 42, 603–613. [Google Scholar]
  26. Peeters, B.; Dewil, R.; Vernimmen, L.; Van den Bogaert, B.; Smets, I.Y. Addition of polyaluminiumchloride (PACl) to waste activated sludge to mitigate the negative effects of its sticky phase in dewatering-drying operations. Water Res. 2013, 47, 3600–3609. [Google Scholar] [CrossRef] [PubMed]
  27. Ferrasse, J.H.; Arlabosse, P.; Lecomte, D. Heat, momentum, and mass transfer measurements in indirect agitated sludge dryer. Drying Technol. 2002, 20, 749–769. [Google Scholar] [CrossRef]
  28. Peeters, B.; Dewil, R.; Van Impe, J.F.; Vernimmen, L.; Smets, I.Y. Using a shear test-based lab protocol to map the sticky phase of activated sludge. Environ. Eng. Sci. 2011, 28, 81–85. [Google Scholar] [CrossRef]
  29. Li, H.; Zou, X.; Li, C. Liming pretreatment reduces sludge build-up on the dryer wall during thermal drying. Drying Technol. 2012, 30, 1563–1569. [Google Scholar] [CrossRef]
  30. Li, H.; Zou, S.; Li, Y.; Jin, Y. Characteristics and model of sludge adhesion during thermal drying. Environ. Technol. 2013, 34, 807–812. [Google Scholar] [CrossRef]
  31. Liu, T.; Ma, Y.; Yue, C. Research status of pyrolysis and heat transfer characteristics of oily sludge. Appl. Chem. Ind. 2022, 51, 2675–2680. [Google Scholar]
Figure 1. Experiment approach (a) and heating device (b).
Processes 12 00227 g001
Figure 2. Temperature variation of measurement points with time. Initial content: (a) water 19.35%, oil 0%; (b) water 9.88%, oil 15.94%.
Processes 12 00227 g002
Figure 3. Temperature variation with different initial densities over time. Measurement point on the radius: (a) r2, (b) r3.
Processes 12 00227 g003
Figure 4. The mass fraction variation of liquid phase. Initial content: (a) water 19.35%, oil 0%; (b) water 10.60%, oil 9.33%.
Processes 12 00227 g004
Figure 5. The variation of adhesion stress with the density of the material. (a) Case I; (b) Case II.
Processes 12 00227 g005
Figure 6. Calculated region. (a) Heating container; (b) axisymmetric section.
Processes 12 00227 g006
Figure 7. Temperature comparison.
Processes 12 00227 g007
Figure 8. Temperature distribution at different times: (a) 5 min; (b) 45 min; (c) 90 min; (d) 135 min.
Processes 12 00227 g008
Figure 9. Temperature changes over time. (a) Different measurement points; (b) measurement point on the radius of r2.
Processes 12 00227 g009
Figure 10. Liquid phase distribution at different times: (a) 5 min; (b) 45 min; (c) 90 min; (d) 135 min.
Processes 12 00227 g010
Figure 11. Liquid phase content changes over time. (a) Total liquid content of different measurement points; (b) each liquid component content of measurement point on r3; temperature and total liquid content of measurement point on (c) r2 and (d) r3.
Processes 12 00227 g011
Table 1. Experimental materials.
CaseLiquid Phase Content
(Water, Oil) %
Initial Density of Material
kg∙m−3
Heat Source Temperature
°C
19.35, 01235.0250
19.90, 01385.1250
19.93, 01526.1250
10.60, 7.091402.8300
10.60, 9.331336.3300
9.88, 15.941425.3300
Table 2. The results of the adhesion stress test.
Initial content (water 19.35%, oil 0%)
r1r2r3
liquid content (%)6.2518.4819.30
adhesive stress (Pa)672529161355
Initial content (water 10.60%, oil 7.09%)
r1r2r3
liquid content (%)8.1816.1417.61
adhesive stress (Pa)52310641184
Table 3. Description of energy distribution relations.
TemperaturesEnergy Distribution Relations
t i , k n + 1 < T c 1 Δ m c 1 i , k n + 1 = 0 , Δ m c 2 i , k n + 1 = 0 , Δ m c 3 i , k n + 1 = 0
T c 1 t i , k n + 1 < T c 2 if Φ Γ n + 1 m c 1 i , k n h c 1 Δ τ , Δ m c 1 i , k n + 1 = m c 1 i , k n , Δ m c 2 i , k n + 1 = 0 , Δ m c 3 i , k n + 1 = 0
if Φ Γ n + 1 < m c 1 i , k n h c 1 Δ τ , Δ m c 1 i , k n + 1 = Φ Γ n + 1 Δ τ h c 1 , Δ m c 2 i , k n + 1 = 0 , Δ m c 3 i , k n + 1 = 0
T c 2 t i , k n + 1 < T c 3 if Φ Γ n + 1 m c 1 i , k n h c 1 Δ τ + m c 2 i , k n h c 2 Δ τ , Δ m c 1 i , k n + 1 = m c 1 i , k n , Δ m c 2 i , k n + 1 = m c 2 i , k n , Δ m c 3 i , k n + 1 = 0
if m c 1 i , k n h c 1 Δ τ Φ Γ n + 1 < m c 1 i , k n h c 1 Δ τ + m c 2 i , k n h c 2 Δ τ , Δ m c 1 i , k n + 1 = m c 1 i , k n , Δ m c 2 i , k n + 1 = Φ Γ n + 1 m c 1 i , k n h c 1 Δ τ Δ τ / h c 2 , Δ m c 3 i , k n + 1 = 0
if Φ Γ n + 1 < m c 1 i , k n h c 1 Δ τ , Δ m c 1 i , k n + 1 = Φ Γ n + 1 Δ τ h c 1 , Δ m c 2 i , k n + 1 = 0 , Δ m c 3 i , k n + 1 = 0
t i , k n + 1 T c 3 if Φ Γ n + 1 m c 1 i , k n h c 1 Δ τ + m c 2 i , k n h c 2 Δ τ + m c 3 i , k n h c 3 Δ τ , Δ m c 1 i , k n + 1 = m c 1 i , k n , Δ m c 2 i , k n + 1 = m c 2 i , k n , Δ m c 3 i , k n + 1 = m c 3 i , k n
if m c 1 i , k n h c 1 Δ τ + m c 2 i , k n h c 2 Δ τ Φ Γ n + 1 < m c 1 i , k n h c 1 Δ τ + m c 2 i , k n h c 2 Δ τ + m c 3 i , k n h c 3 Δ τ , Δ m c 1 i , k n + 1 = m c 1 i , k n , Δ m c 2 i , k n + 1 = m c 2 i , k n , Δ m c 3 i , k n + 1 = Φ Γ n + 1 m c 1 i , k n h c 1 Δ τ m c 2 i , k n h c 2 Δ τ Δ τ / h c 3
if m c 1 i , k n h c 1 Δ τ Φ Γ n + 1 < m c 1 i , k n h c 1 Δ τ + m c 2 i , k n h c 2 Δ τ , Δ m c 1 i , k n + 1 = m c 1 i , k n , Δ m c 2 i , k n + 1 = Φ Γ n + 1 m c 1 i , k n h c 1 Δ τ Δ τ / h c 2 , Δ m c 3 i , k n + 1 = 0
if Φ Γ n + 1 < m c 1 i , k n h c 1 Δ τ , Δ m c 1 i , k n + 1 = Φ Γ n + 1 Δ τ h c 1 , Δ m c 2 i , k n + 1 = 0 , Δ m c 3 i , k n + 1 = 0
Disclaimer/Publisher’s Note: The statements, opinions and data contained in all publications are solely those of the individual author(s) and contributor(s) and not of MDPI and/or the editor(s). MDPI and/or the editor(s) disclaim responsibility for any injury to people or property resulting from any ideas, methods, instructions or products referred to in the content.

