Article

Comparison of the Work of Wastewater Treatment Plant “Ravda” in Summer and Winter Influenced by the Seasonal Mass Tourism Industry and COVID-19

by
Magdalena Bogdanova
1,*,
Ivaylo Yotinov
1,2 and
Yana Topalova
1,2
1
Department of General and Applied Hydrobiology, Faculty of Biology, Sofia University “St. Kliment Ohridski”, 8, Dragan Tzankov Blvd., 1164 Sofia, Bulgaria
2
Center of Competence “Clean Technologies for Sustainable Environment—Water, Waste, Energy for Circular Economy”, 1000 Sofia, Bulgaria
*
Author to whom correspondence should be addressed.
Processes 2024, 12(1), 192; https://doi.org/10.3390/pr12010192
Submission received: 28 November 2023 / Revised: 8 January 2024 / Accepted: 12 January 2024 / Published: 15 January 2024

Abstract

:
Mass tourism puts enormous pressure on wastewater treatment plants due to its expansive growth during the summer months. To adapt to the fluctuations, the Ravda wastewater treatment plant (WWTP) uses innovative methods and technologies, allowing for “shrinking” and “expanding” of the facilities according to the season. This has been built in stages over the years, with two separate biological treatment lines adapting to different numbers of tourists and to the quantity of influent wastewater. The aim of this study is to make a comparative assessment of the work of WWTP Ravda in the summer and winter seasons and its effectiveness, as well as to compare them. In addition, it examines the years of the COVID-19 pandemic, when a much higher consumption of water per person was noted. Data were analyzed for the period of 2018–2022 inclusive, comparing influent and effluent BOD5 and COD in the summer and winter. Nitrogen and phosphorus removal efficiencies were also tracked. The study shows that municipal wastewater treatment is effective, but much higher values, close to the maximum permissible discharge values, are observed during the tourist season. With the continued growth of the tourism sector, the Ravda wastewater treatment plant would not be able to cope with the discharge standards set by the Ministry of Environment and Water, so measures need to be taken promptly.

1. Introduction

Water cycles and tourism are directly linked through water use, water purification, and the circular use of water resources and water. There is another aspect to this specific area of water treatment practice and water management. Water treatment in marine tourism has specificities that distinguish the requirements for water treatment technologies. Some of these specificities are: 1: the protection of the marine ecosystem as a receiver of treated water, the maintenance of its ecological status with compliance with water standards in the Black Sea ecosystem, and the ecological integrity and functioning of trophic marine chains; 2: maintaining the balance between chemical, biological, and microbiological indicators in recreational areas, where various contaminants of allochthonous origin accumulate and transform into elements indigenous to the ecosystem; 3: usually, marine ecosystems are receivers of treated and untreated water, but also an endpoint and receiver of river water and streams, again with the specificity of water as a resource and as an aquatic environment for organisms; and 4: it should be taken into account that we are talking about resort areas and the incorporation of technological water treatment complexes. These complexes need to comply with aesthetic architectural and functional criteria in regions with intensive tourism.
This aspect of the water treatment technology and business has diverse and intertwining environmental, health, functional, and economic issues. We cannot overlook the current trends of circular economy, bioeconomy, green energy, energy and resource efficiency, decarbonization and greenhouse gas reduction, etc. Here, of course, we come to the bigger question—how sustainable tourism corresponds to and guides the “sustainable use and management of water resources”, combining and taking into account the aforementioned and related environmental, economic, social, health, and other issues. Like all other industries, this one must adapt to the UN Sustainable Development Goals by building a plan in line with the 17 sustainable development goals [1]. This will be possible with gradual but steady improvements. When it comes to Sunny Beach, the initiative starts with the Tour Operators, who impose requirements on the hoteliers and make them an integral part of their contracts. In order to accept foreign tourists, higher-class hotels (4 and 5 stars) are required to have sustainability certificates such as TraveLife [2], ESG [3], or ISO 14001 [4], or to have internal practices and procedures related to waste reduction, environmental pollution, and sustainable use of resources. On this occasion, it is important to note that the use of plastic cups and packaging in hotels has been banned and gradually replaced by reusable ones. As a consequence, this has led to greater water consumption. This has inevitably affected the operation of the Ravda water treatment plant, which is examined in this study.
To rationally manage water cycles and water treatment technologies and facilities, it is necessary, against the background of the complexity of problems and professional directions, to differentiate key and critical problems where efforts are concentrated. Key problems can be pointed out. 1: Intelligent professional construction of local water cycles exists with the interweaving of hydrological, technological, and metabolic aspects, as well as trophic/chains/cycles, in the Black Sea. All of this takes into account the local and global concerns of the Black Sea as one of the key water basins, in addition to the subject of multifaceted tourism, economic, and environmental activities. Critical specific issues and principles can be noted: 2: The resorts around the Black Sea are highly seasonal, and the volume of polluted/treated water increases enormously in the tourist season. The pollutant load in terms of quantity and quality also changes. During the off-season, the volume and pollutants “shrink” again. This requires wastewater treatment plants to have very dynamic technologies with the capacity to respond technologically, energetically, and managerially to this challenge [5]. 3: Another specific problem with wastewater treatment in the area of the Black Sea resorts is the presence of toxic pollutants of different natures and quantities during the season of active tourism and in preparation for the tourist peak. These pollutants include antibiotics, other various pharmaceuticals, steroid hormones, disinfectants, various microbial pathogens and conditional pathogens, viruses, petroleum products, dyes, preservatives, and microplastics [6,7,8]. This combination of pollutants may remain in the treated water, accumulate in the sediments, and migrate into the Black Sea ecosystem at the treatment plant discharge points and/or into the recreation area. 4: The concentration of many people from different parts of the world with different habits leads to strong fluctuations and risk problems in the generated wastewater, the waters from the pools, and other problems accompanying the human flow [9]. 5: The use of larger quantities and varieties of pharmaceuticals, plastic packaging with dyes, hormones, canned and imported foods, specific cosmetics, sunscreens with innovations in sun protection, and disinfectants in the numerous pools of tourist resorts also poses a major challenge for the activated sludge and water treatment processes [10]. 6: Design faults are present in existing or newly constructed wastewater treatment plants, such as those in discharge, tertiary treatment, etc. A specific problem is the discharge of treated water into rivers with inconsistent flow or into ravines or near recreation areas, etc. [11,12]. 7: There is a strong impact of tourism and other agricultural activities on deforestation, destruction of protected areas, and loss of biodiversity due to adverse conditions for native flora and fauna, along with the creation of conditions for the introduction of new invasive species [13]. 8: Several other accidental risk factors can be mentioned here, for which specialized algorithms and solutions for risk prevention and minimization must be anticipated and planned.
For the quality of water treatment, the massive use of plastic packaging in hotel chains as well as operating laundry farms during the summer season should also be taken into account [14]. Global warming is also a key factor, as in the last few years, it has led to record high temperatures and heavy rainfall, which have been shown to affect the amount of microplastics released into the environment [15]. Currently, no samples are taken for the presence of plastic in the wastewater of WWTP Ravda and the surrounding marine area, but research in other touristic regions has shown that this industry has a huge impact on the environment [16]. To improve the efficiency of wastewater treatment, a better understanding of the use, transport, and fate of microplastics is needed. That will also help to reach the goals of the European Union to reduce greenhouse gas emissions from the wastewater treatment sector, and the need to remove plastic microparticles and PFAS from urban wastewater before discharge [17].
New technologies and management practices have to be implemented in order to achieve the 2050 climate neutrality target set out in Regulation (EU) 2021/1119 of the European Parliament and the Council [18]. One of the most recurrent solutions invented so far is the decentralized greywater treatment [19]. It contributes to a significant reduction in tap water demand, but also decreases the quantity of polluted influent water in WWTP. In order to develop a circular economy, an eco-toilet has been developed that reuses wastewater as well as rainwater [20]. But to foresee the need for new treatment technologies, taking into account the development of the tourism sector, a simulation model can be made [21]. A good practice has been developed in another resort located in Turkey, Antalya. There, people face the same problem related to the seasonality of tourism, which results in significantly more visitors in summer than in winter. With the growth of the industry in the area, just as in Sunny Beach Resort, there is a growing need to expand the wastewater treatment plant or introduce measures to alleviate it. By using an SD-based simulation model, it can be predicted where and when this will happen. Currently, The Integrated Development Plan of Nessebar Municipality 2021–2027 does not foresee such measures [22].
Another study showed that constructed wetlands with a battery of different organisms have the ability to decrease the toxicity of wastewater from small tourism units [23].
The research was conducted for the period 2019–2022, which includes the pandemic years of 2020 and 2021. Therefore, we cannot ignore this factor or how it affected wastewater treatment processes and tourism. When it comes to mass tourism, and especially after the COVID-19 pandemic, we cannot underestimate the quick and easy propagation of different viruses and bacteria. The analysis of wastewater here comes as an essential aspect of the protection of these resorts and as a consequence to the whole region, country, etc. The cities with mass tourism are usually highly affected and can turn into hot points if not managed properly. This affects the tourists traveling worldwide, but also employees and local citizens. An eventual detection of the virus can lead to the collapse of the industry. To avoid that, a generalized linear regression using a Poisson distribution can be performed to predict COVID-19 [24]. In addition, wastewater can be analyzed with optimized RT-qPCR systems with polymerases, which can show reliable results despite the presence of various inhibitors in water, such as disinfectants, antibiotics, steroid hormones, dyes, microplastics, and other xenobiotics [25]. Although the virus is destroyed in the ambient temperature and climatic conditions, its detection in the sludge would enable us to identify the source and localize the infection [26]. As a consequence, better measures can be taken in order to prevent future spread and ensure a healthy environment in recreational areas.
In this way, the problems and their specificities can be illustrated and described in detail against the background of a case study of a water treatment plant and its operation, focusing on technological schemes and biological and chemical indicators. Some of the critical issues are examined and discussed in the context of the operation of the WWTP “Ravda”. They can serve as a basis for further research in the field because there is a research gap in the comparative analysis between water management and seasonal tourism, as a few other authors have already pointed out [27].

2. Materials and Methods

As it became clear, tourism is among the high-water-demand sectors, so it is crucial to examine it closely in order to build a sustainable product that does not damage the integrity of the environment. This is especially true for resorts such as Sunny Beach near the town of Burgas, Bulgaria, which operates during the summer season with an extremely high load. The main attractions are water parks, beaches, and swimming pools. At the beginning and end of the season, the numerous SPA centers in the resort are also used. This seasonal concentration of tourists requires good water management, using all the innovations of the circular economy. The cooperation between business and research centers is also of utmost importance to developing working practices. A study from Hersonissos, Greece (a resort similar to Sunny Beach), where effluent water is reused mainly for agricultural irrigation, fire protection, and landscape irrigation, shows that for each cubic meter treated, the total annual economic costs for treatment, filtration, and reuse infrastructure were EUR 1.07, 0.05, and 0.08, respectively [28]. This proves the effectiveness of circular solutions and the ability to reduce water supply costs.

2.1. Wastewater Treatment Plant

The wastewater treatment plant “Ravda” (WWTP) is located in the Burgas Region (Bulgaria), and it cleans the waters of Aheloy, the village of Tankovo, the village of Kosharitsa, part of Vlas, and the agglomeration Ravda–Nessebar–Sunny Beach (Figure 1). The last one is the biggest tourist resort in the country, with a total of 196 accommodation places and nearly 5 million overnight stays on an annual basis [29]. Sunny Beach occupies the largest share in the tourism sector of the country, and as such, it has the most significant impact on the environment [29]. Considering the seasonality of tourism in the area, we are discussing mass tourism concentrated in the months of June, July, and August. To meet the needs of the resort, WWTP adapts to seasonal fluctuations by using different types and numbers of facilities (Figure 2).
In the schemas, numbers indicate the quantities of equipment used in the process, since they vary according to the season. There is much more equipment used in the summer than in the winter. This helps to optimize the processes, the use of energy, and other resources linked to monitoring, testing, and maintenance of the equipment.
The summer season is considered to include months from May to September (inclusive). Winter includes the months from October to April.
WWTP Ravda was built in 1970 for the needs of the Sunny Beach resort. The facilities and equipment were adapted to the incoming quantities of wastewater. In the period of 2004–2007, an extension and reconstruction were carried out, and the line with the SBR reactors was built then, which is still in use today [30,31]. In the period of 2013–2015, a new extension and reconstruction of the Ravda WWTP was carried out. The new flow water line and the new sludge holding were constructed. In 2015, a deep-water discharge to the Black Sea water was built, 2.5 km long and 18 m deep. What is innovative here is that there are now two effluent discharge pipes that are able to handle the high water flow in summer.
Since 2017, Ravda WWTP has been operating with the existing line of SBR reactors and newly constructed biobasins (Figure 3).

2.2. Statistical Data

The statistical data used for this research were provided by the National Statistical Institute of Bulgaria and the Black Sea Basin Directorate—Varna [32]. They included the number of tourists, residents, accommodations, and overnight stays, as well as quantity of water used. Historical data on the work of WWTP Ravda were recovered and evaluated for the period of 2018–2022. BOD5, COD, and the concentrations of total nitrogen and phosphate were provided by WWTP Ravda.
Standard deviations (SDs) from the means were determined from at least three independent replicates. Statistical analysis for the evaluation of the differences among the three situations (the treatment groups) regarding the indicators BOD5 and COD was performed using one-way analysis of variance on ranks in SigmaPlot (Version 12.5). Differences were considered statistically significant at p < 0.05.

2.3. Laboratory Results

The laboratory results were provided by Burgas Waterworks and the Ravda WWTP. Samples for the water quality (influent and effluent) were examined in a certified laboratory in the city of Burgas. For periodic laboratory monitoring of the discharged water, an automatic sampling refrigeration station was provided, with the possibility of taking 24 samples of 1 L each.
The influent and effluent water quality data were analyzed from average daily samples collected from 2 automatic sampling stations. Every morning after 8 am, they were collected and taken to the laboratory. The critical control points (CCP) are listed in the table below (Table 1).
The following formulas were used for the calculation of biodegradation indicators. The effectiveness levels of BOD5, COD, P, and N were calculated according to the formula
(Eff): E f f = (Ct1 − Ct2/Ct1) × 100, [%]
where Ct1 is the concentration in the influent and Ct2 is the concentration in the effluent water.
Water used per overnight stay was calculated by dividing the H2O (m3) by the number of overnights.
X = H2O (m3)/overnights
Then, the COD and the BOD5 were divided by the obtained results in order to calculate the COD and BOD5 per 1 m3 of water per overnight.
COD per 1 m3 of water per overnight = COD/X
BOD5 per 1 m3 of water per overnight = BOD5/X

3. Results

3.1. Functioning of Ravda WWTP in Winter

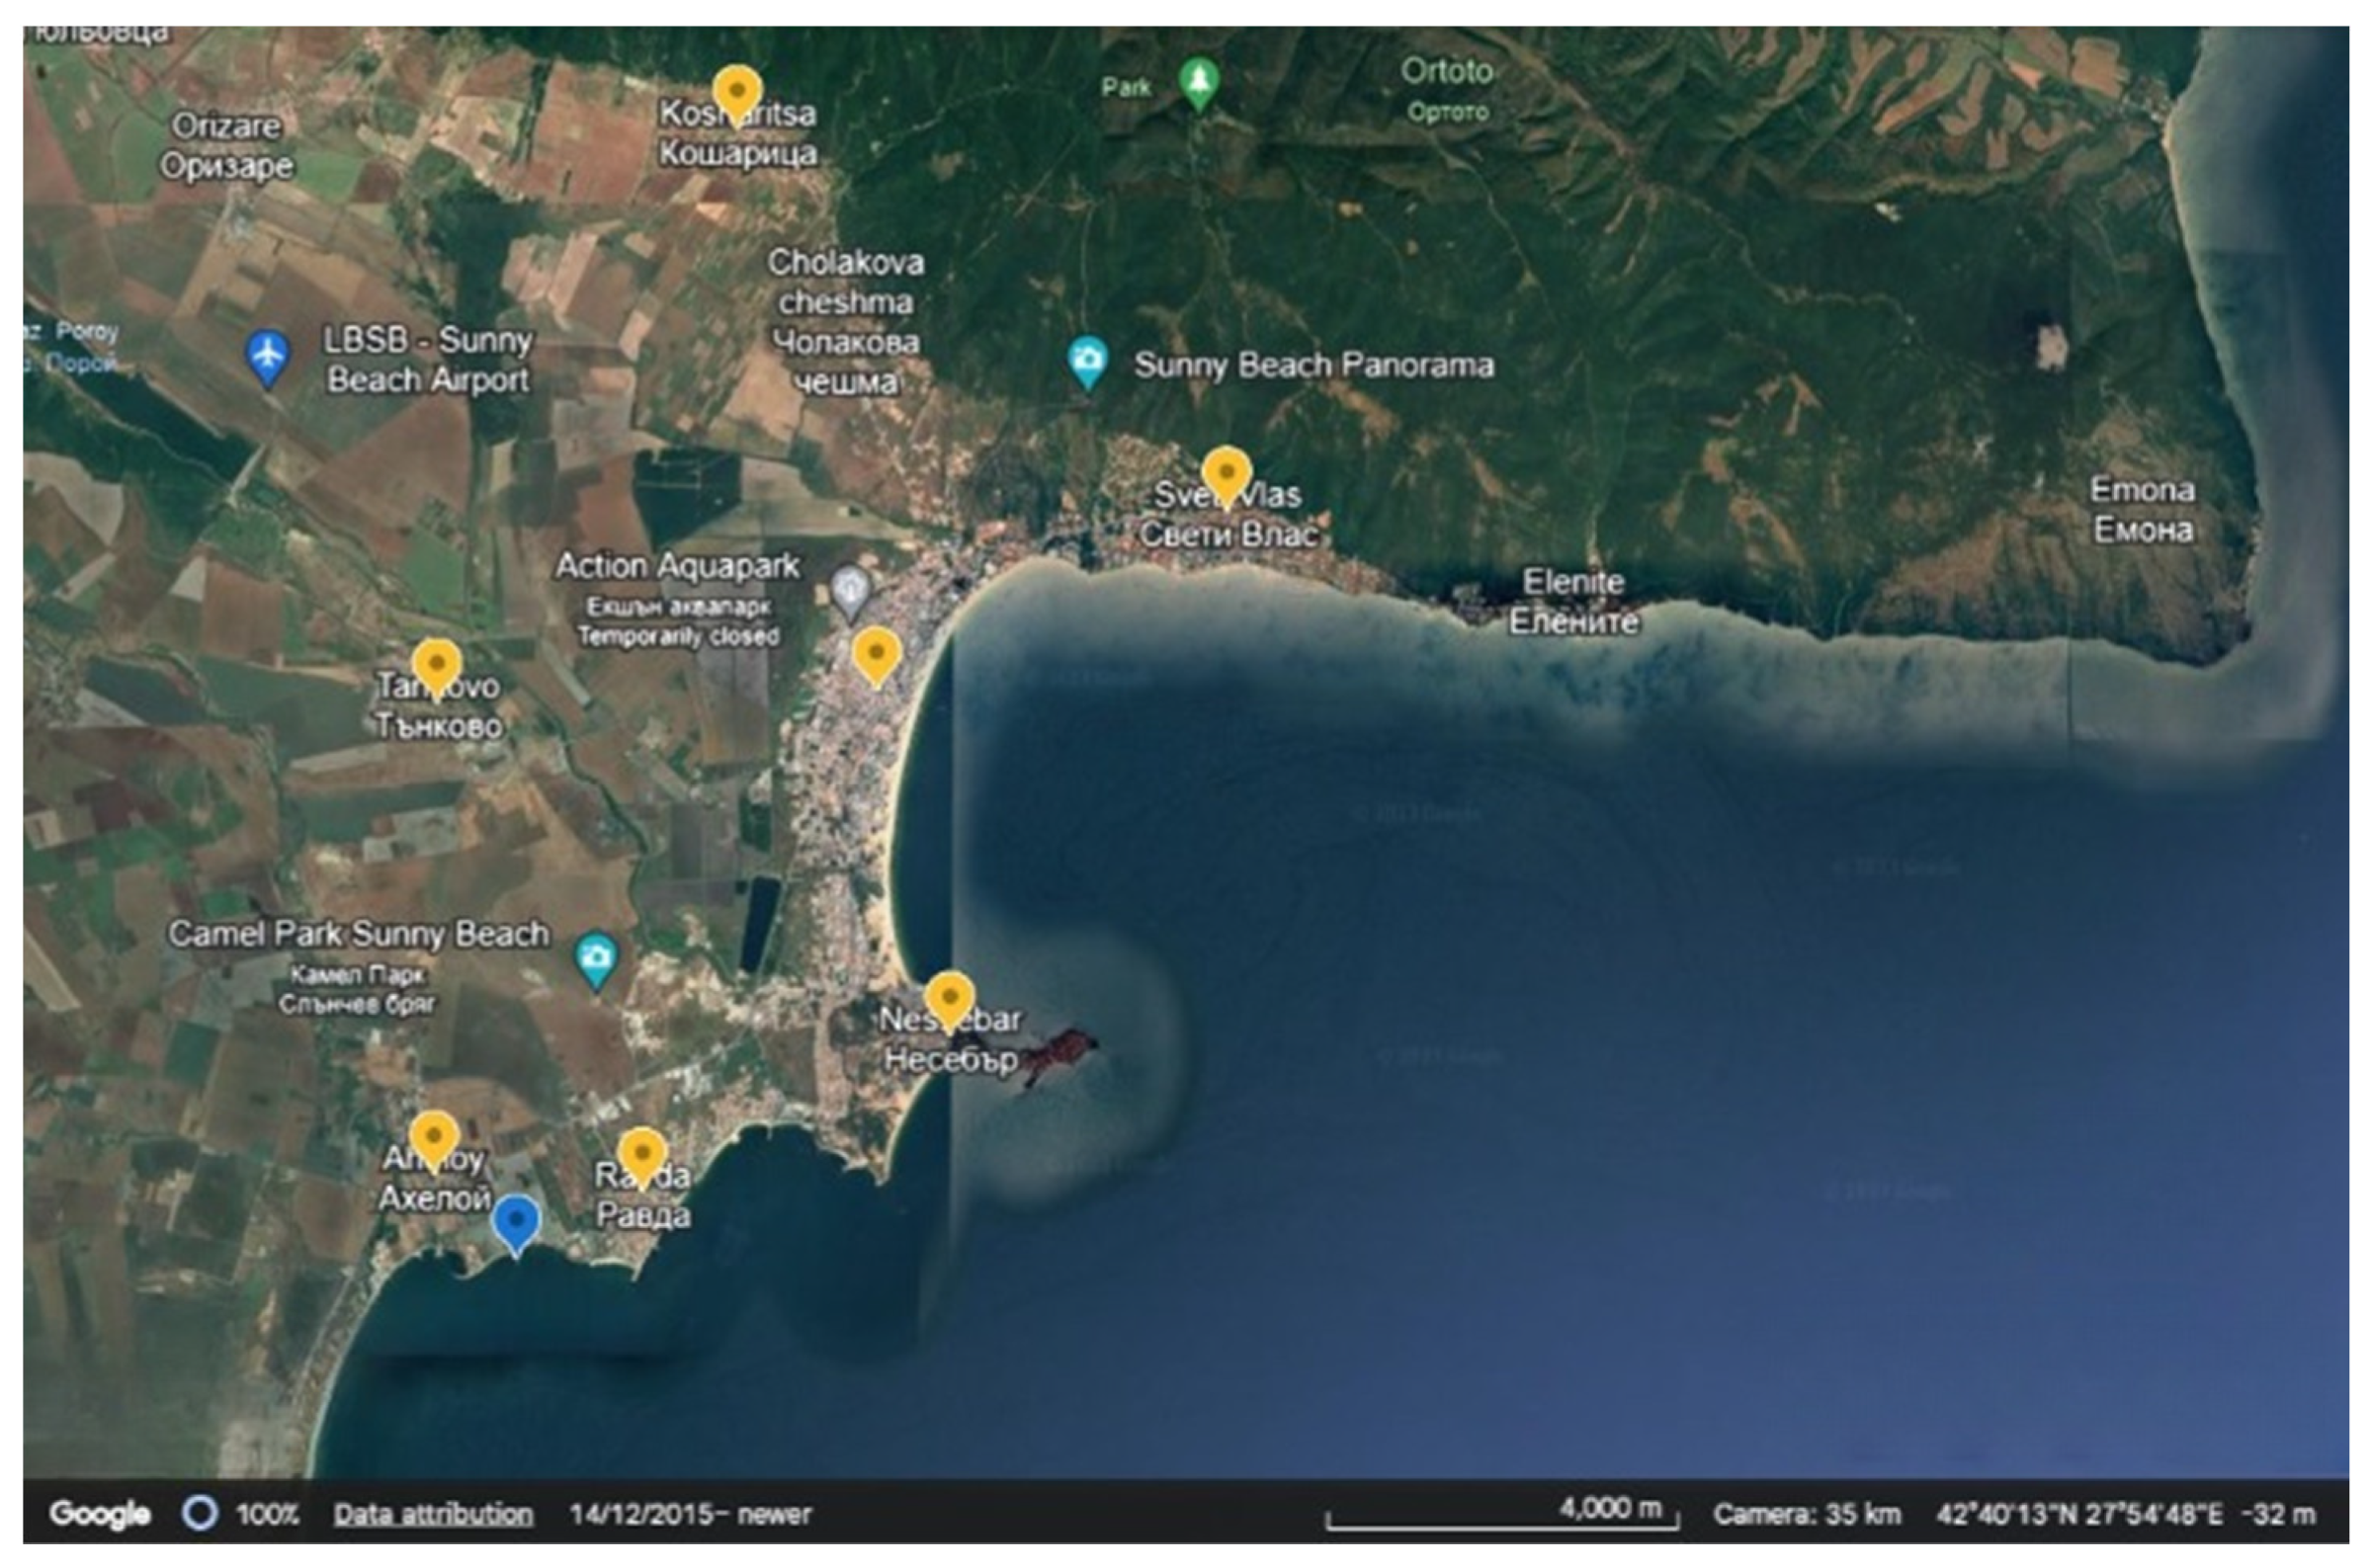
During the winter period, from October to April (inclusive), the wastewater treatment plant operates in winter mode. The reason for this is the small volume of wastewater due to the small number of mainly local inhabitants, numbering 28,968 [34] (data for the municipality of Nessebar, part of which is the tourist resort Sunny Beach). The process is similar, but uses a different number of facilities. The remaining ones are shut down in stages according to the decreasing number of tourists and seasonal workers.
The incoming water passes through two coarse grates with openings of 27 mm. This is followed by three fine grids with 6 mm openings. The water also passes through an aerated sand filter, which removes any remaining coarse or fine sand particles, silt, and gravel. The finely suspended matter, mainly of organic type, is separated in the primary radial clarifier by gravity. The heavier particles settle to the bottom and the lighter ones to the surface.
The next stage of the water treatment passes through a dephosphatization basin, where the biosolids are removed by FeCl3. The wastewater is then treated in a biobasin with a sequential anoxic/denitrification/zone and an aerobic nitrification zone. The technological scheme of water purification during the winter period is shown in Figure 2, and only the biological removal of carbon, nitrogen, and phosphorus is shown in Figure 4. It is necessary to emphasize that the removal of phosphorus is combined with FeCl3 by coagulation, and with the carbon-containing and nitrogen-containing organics by successive heterotrophic denitrification and nitrification. The water passes through an anaerobic denitrification zone and then into an aerobic nitrification zone, after which it is stirred in the part of the biobasin without an oxygen supply.
The water then passes through a secondary settling basin and discharges through two pipes, 2.5 km long and 18 m deep, into the Black Sea. This is necessary because the sea area close to the wastewater outfall pipe is particularly sensitive and vulnerable [35].
Regarding the sludge, it is stored in one methane tank during the winter after digestion for biogas production. Biogas with 60–68% methane content is produced in the anaerobic facilities/methane tanks. This energy source covers up to 30% of the energy needs of the entire facility of Ravda WWTP [36].
The operation of the treatment plant in this mode during the inactive winter period for tourism ensures the appropriate and satisfactory treatment of wastewater. Below, we examine the purification process by presenting the actual technological indicators by year and dynamics.
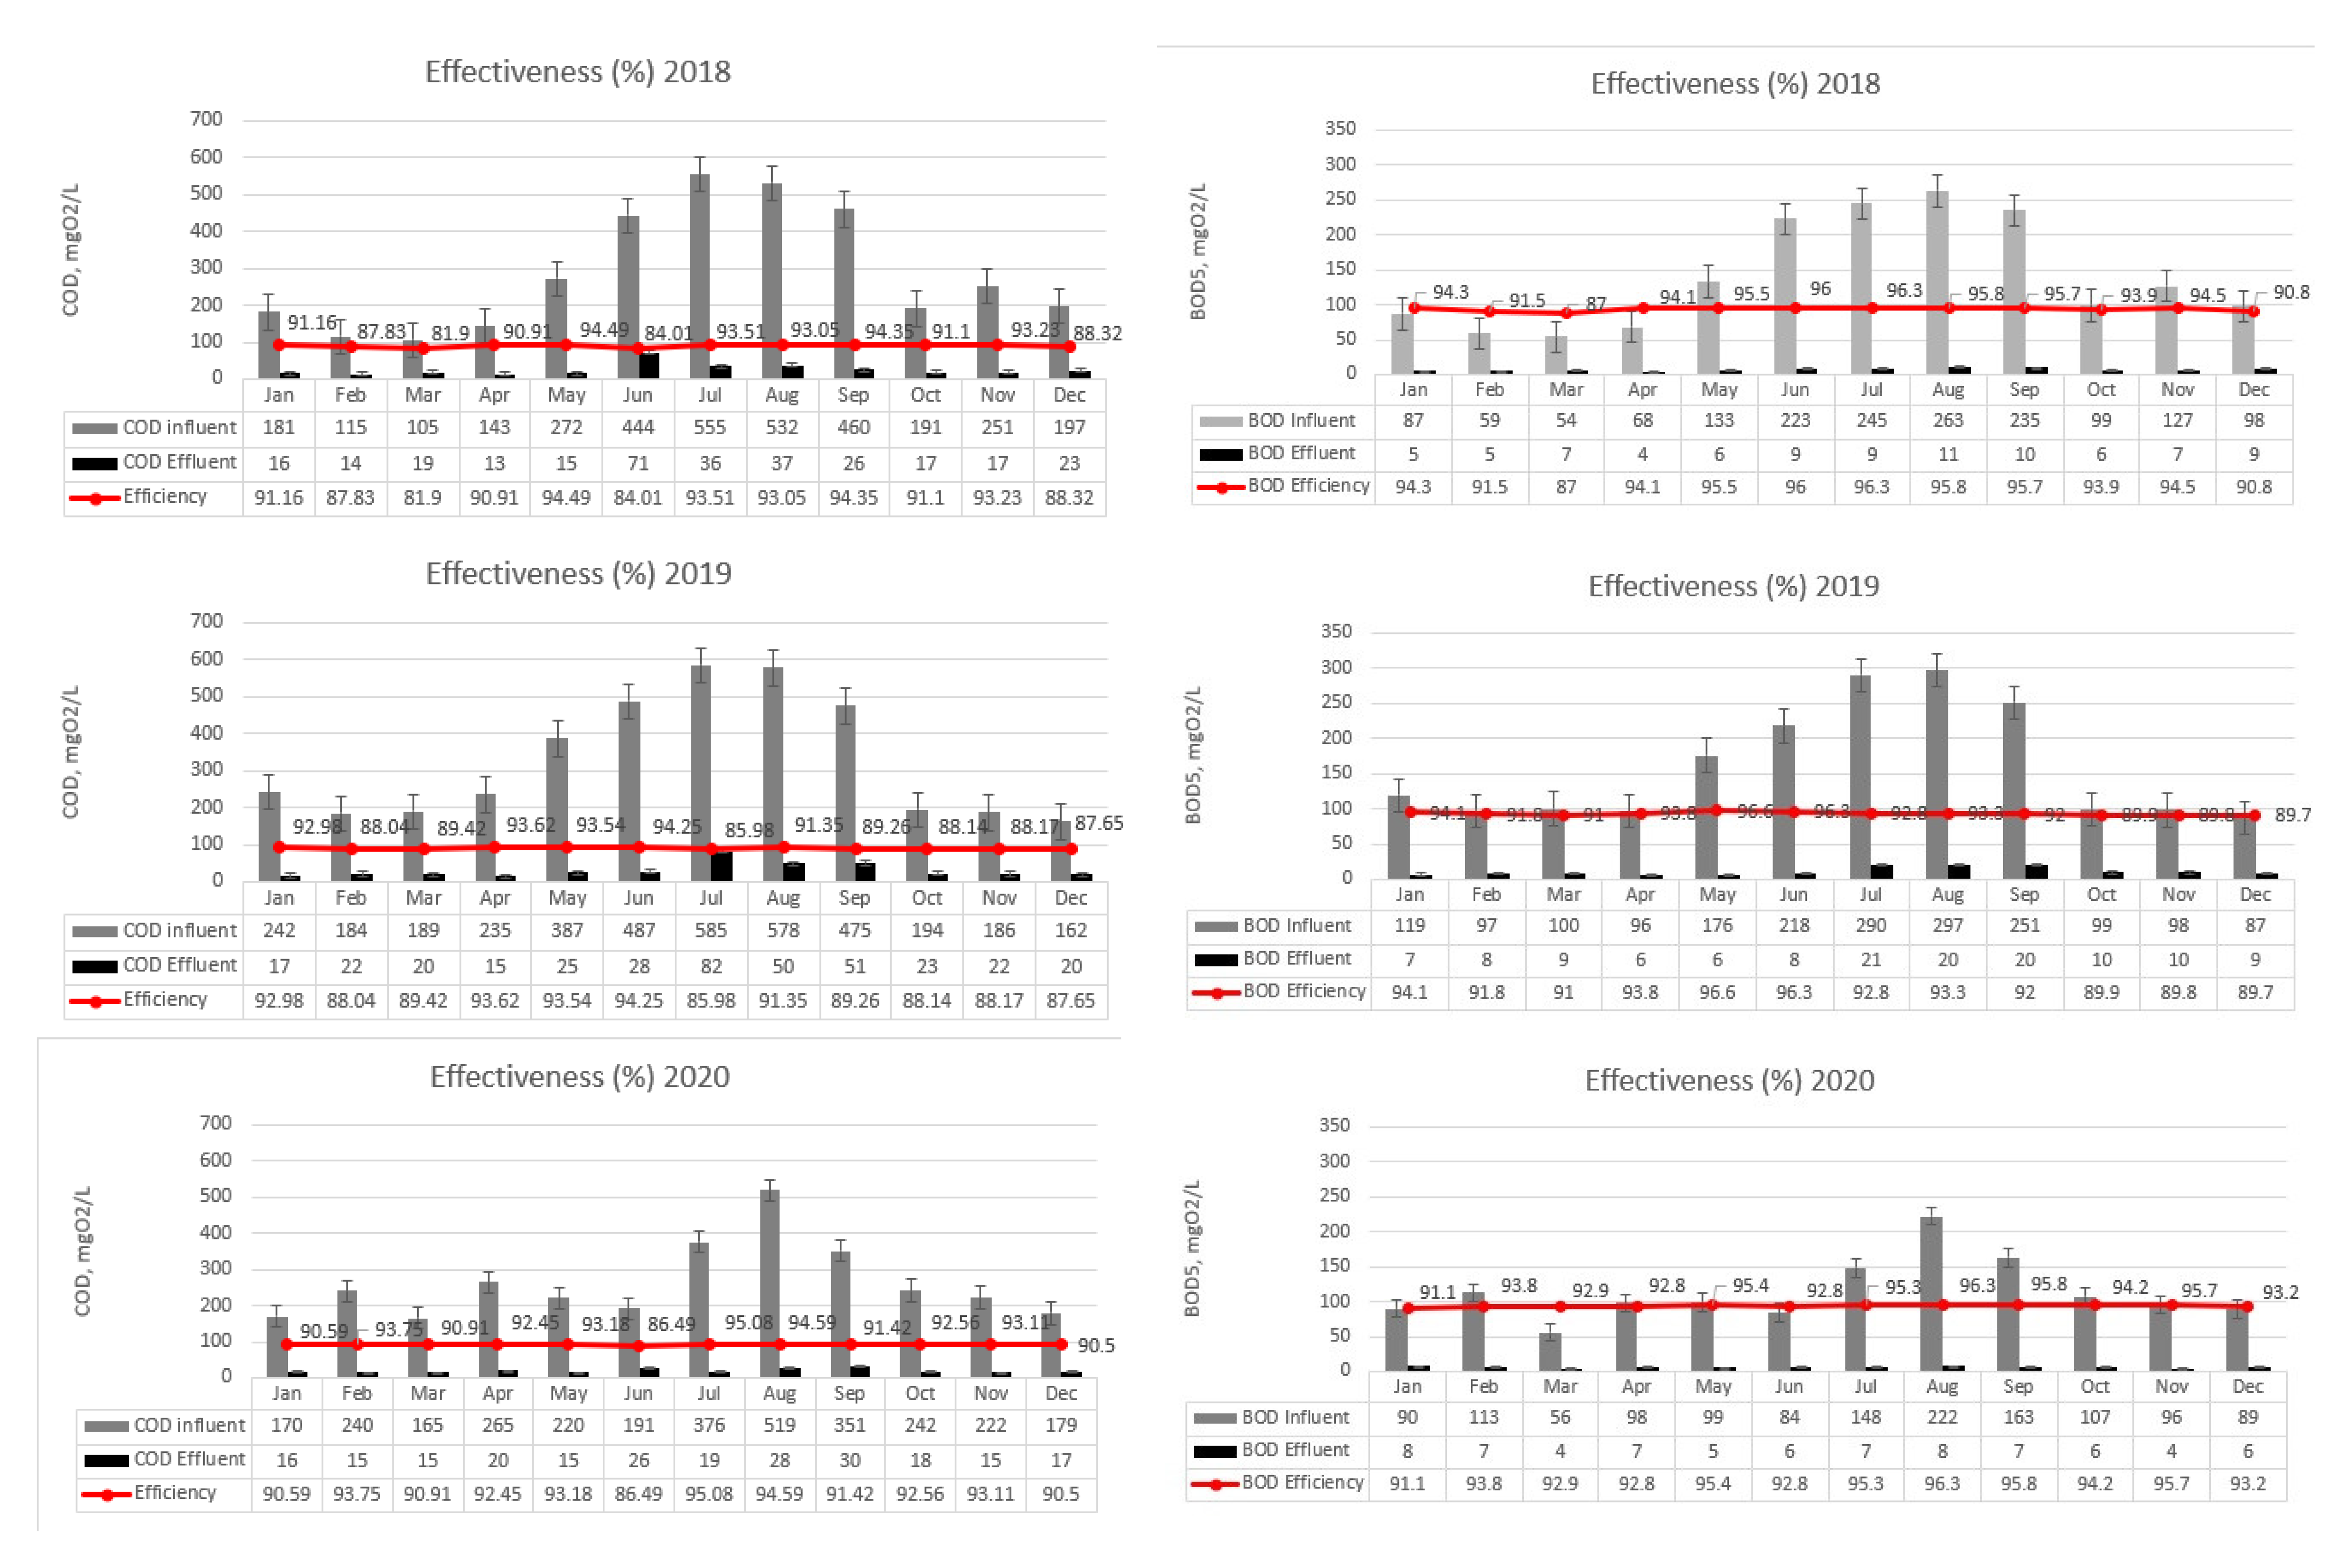
In Figure 5a,b, the COD and BOD5 of the influent and of the effluent are shown. These indicators are compared to the standards for the discharge of treated water into the Black Sea.
The COD rates (a) in influent water during winter are between 105 mgO2/L and 189 mgO2/L. In effluent water, the rates drop until 15 to 23 mgO2/L, which completely meets the legal rate of discharge in Bulgaria [37]. The effectiveness of COD removal is high—between 80 and 90%. This indicates that the treatment plant is highly effective in reducing the organic pollution in the wastewater.
When it comes to the BOD5 (b), in influent water, it reaches 100 mgO2/L in winter, with the highest rates noted in 2019. But in effluent water, the BOD5 is lower than 10 mgO2/L, which means that the concentration of organic pollutants in the water is relatively low and meets the standards. It is an indication of good water quality that it is unlikely to cause significant harm to aquatic life and the environment when discharged into the Black Sea.
Figure 6a,b, respectively, show the removal of nitrogen and phosphorus in the course of water purification in the winter scheme of the treatment plant. The concentrations of nitrogen and phosphorus were tracked comparatively in the influent and effluent water. The figure also shows the dynamics of nitrogen and phosphorus removal effectiveness in the years 2018–2022.
The amount of nitrogen in influent water during winter varies between 9.4 mg/L and 24.3 mg/L. The highest rates were noted in 2019 and 2020. The reason is probably related to the beginning of the COVID-19 pandemic and the massive use of disinfectants, more frequent cleaning of rooms and common areas, and the greater amount of detergents used for washing and cleaning. It is important to note that the increased parameters can also be associated with a greater quantity of drugs discharged through the wastewater of all households. There are some assumptions that, in Nessebar, as early as the winter of 2019 COVID-19 was distributed because of intensive touristic exchange. This fact was not possible to prove in the early phase of COVID-19 distribution. There are no statistics to prove it. In 2021, there was a sharp decrease in the efficiency of nitrogen elimination in the course of purification, and it reached a low value of 40%. In all likelihood, this was due to the presence of inhibitors in the waters as a result of the measures to deal with the COVID-19 epidemic—namely, disinfectants, antibiotics, steroids, medicinal preparations, etc. These activated sludge toxic pollutants led to a decrease in nitrogen removal efficiency, mainly affecting denitrification and total nitrification. However, the rate of elimination was sufficient to maintain nitrogen within the catchment discharge standards.
In 2020 and 2021, a process of decreasing the efficiency of phosphorus elimination was also established. In 2020, it was 40%, and in 2021, it was 20%. This is most likely due to the more complex processes of phosphorus elimination, chemical and biochemical, on the one hand, but on the other hand, to the more difficult adaptation of polyphosphate-accumulating microorganisms in the activated sludge to the resistance and degradation of phosphorus-containing detergents and other xenobiotic substances used in the COVID-19 epidemic. Regardless, the concentration of phosphorus was within the range of discharge norms. In 2022, there was a trend of recovery of the efficiency of operation of the Ravda wastewater treatment plant in terms of the parameters of nitrogen and phosphorus elimination efficiency. Their concentrations were close to the discharge standard rates in the Black Sea.

3.2. Functioning of Ravda WWTP in Summer

One of the major challenges for the operation of treatment plants, which operate in a seasonal mode with contraction and multiple expansions of the volume of treated water and the pollutants within it, is the change in the mode of operation and the expansion and contraction of the station itself in terms of scale and types of facilities. An additional challenge is that, in the peak loading season, treatment must be the deepest, most controlled, and most sustainable because the discharge is adjacent to recreational areas. The load in these periods increases not only the quantity of pollutants in wastewater, but also the variety of pollutants. During this busy tourist season, there are numerous pollutants of a toxic nature in the wastewater, such as detergents, steroid hormones, food preservatives, antibiotics, and other biologically active substances and inhibitors which are actively used in tourist complexes.
In the complexes that we have examined in the period of 2018–2022, there was a significant fluctuation in overnight stays. This includes the active COVID-19 pandemic period of 2020–2021, which was accompanied by a strong reduction in tourist activities on the one hand, but with the imposition of specific measures to disinfect and prevent the spread of SARS-CoV-2. All of this had a significant impact on the structure of wastewater, and, as expected, on the treatment processes. These changes will be further discussed in this article.
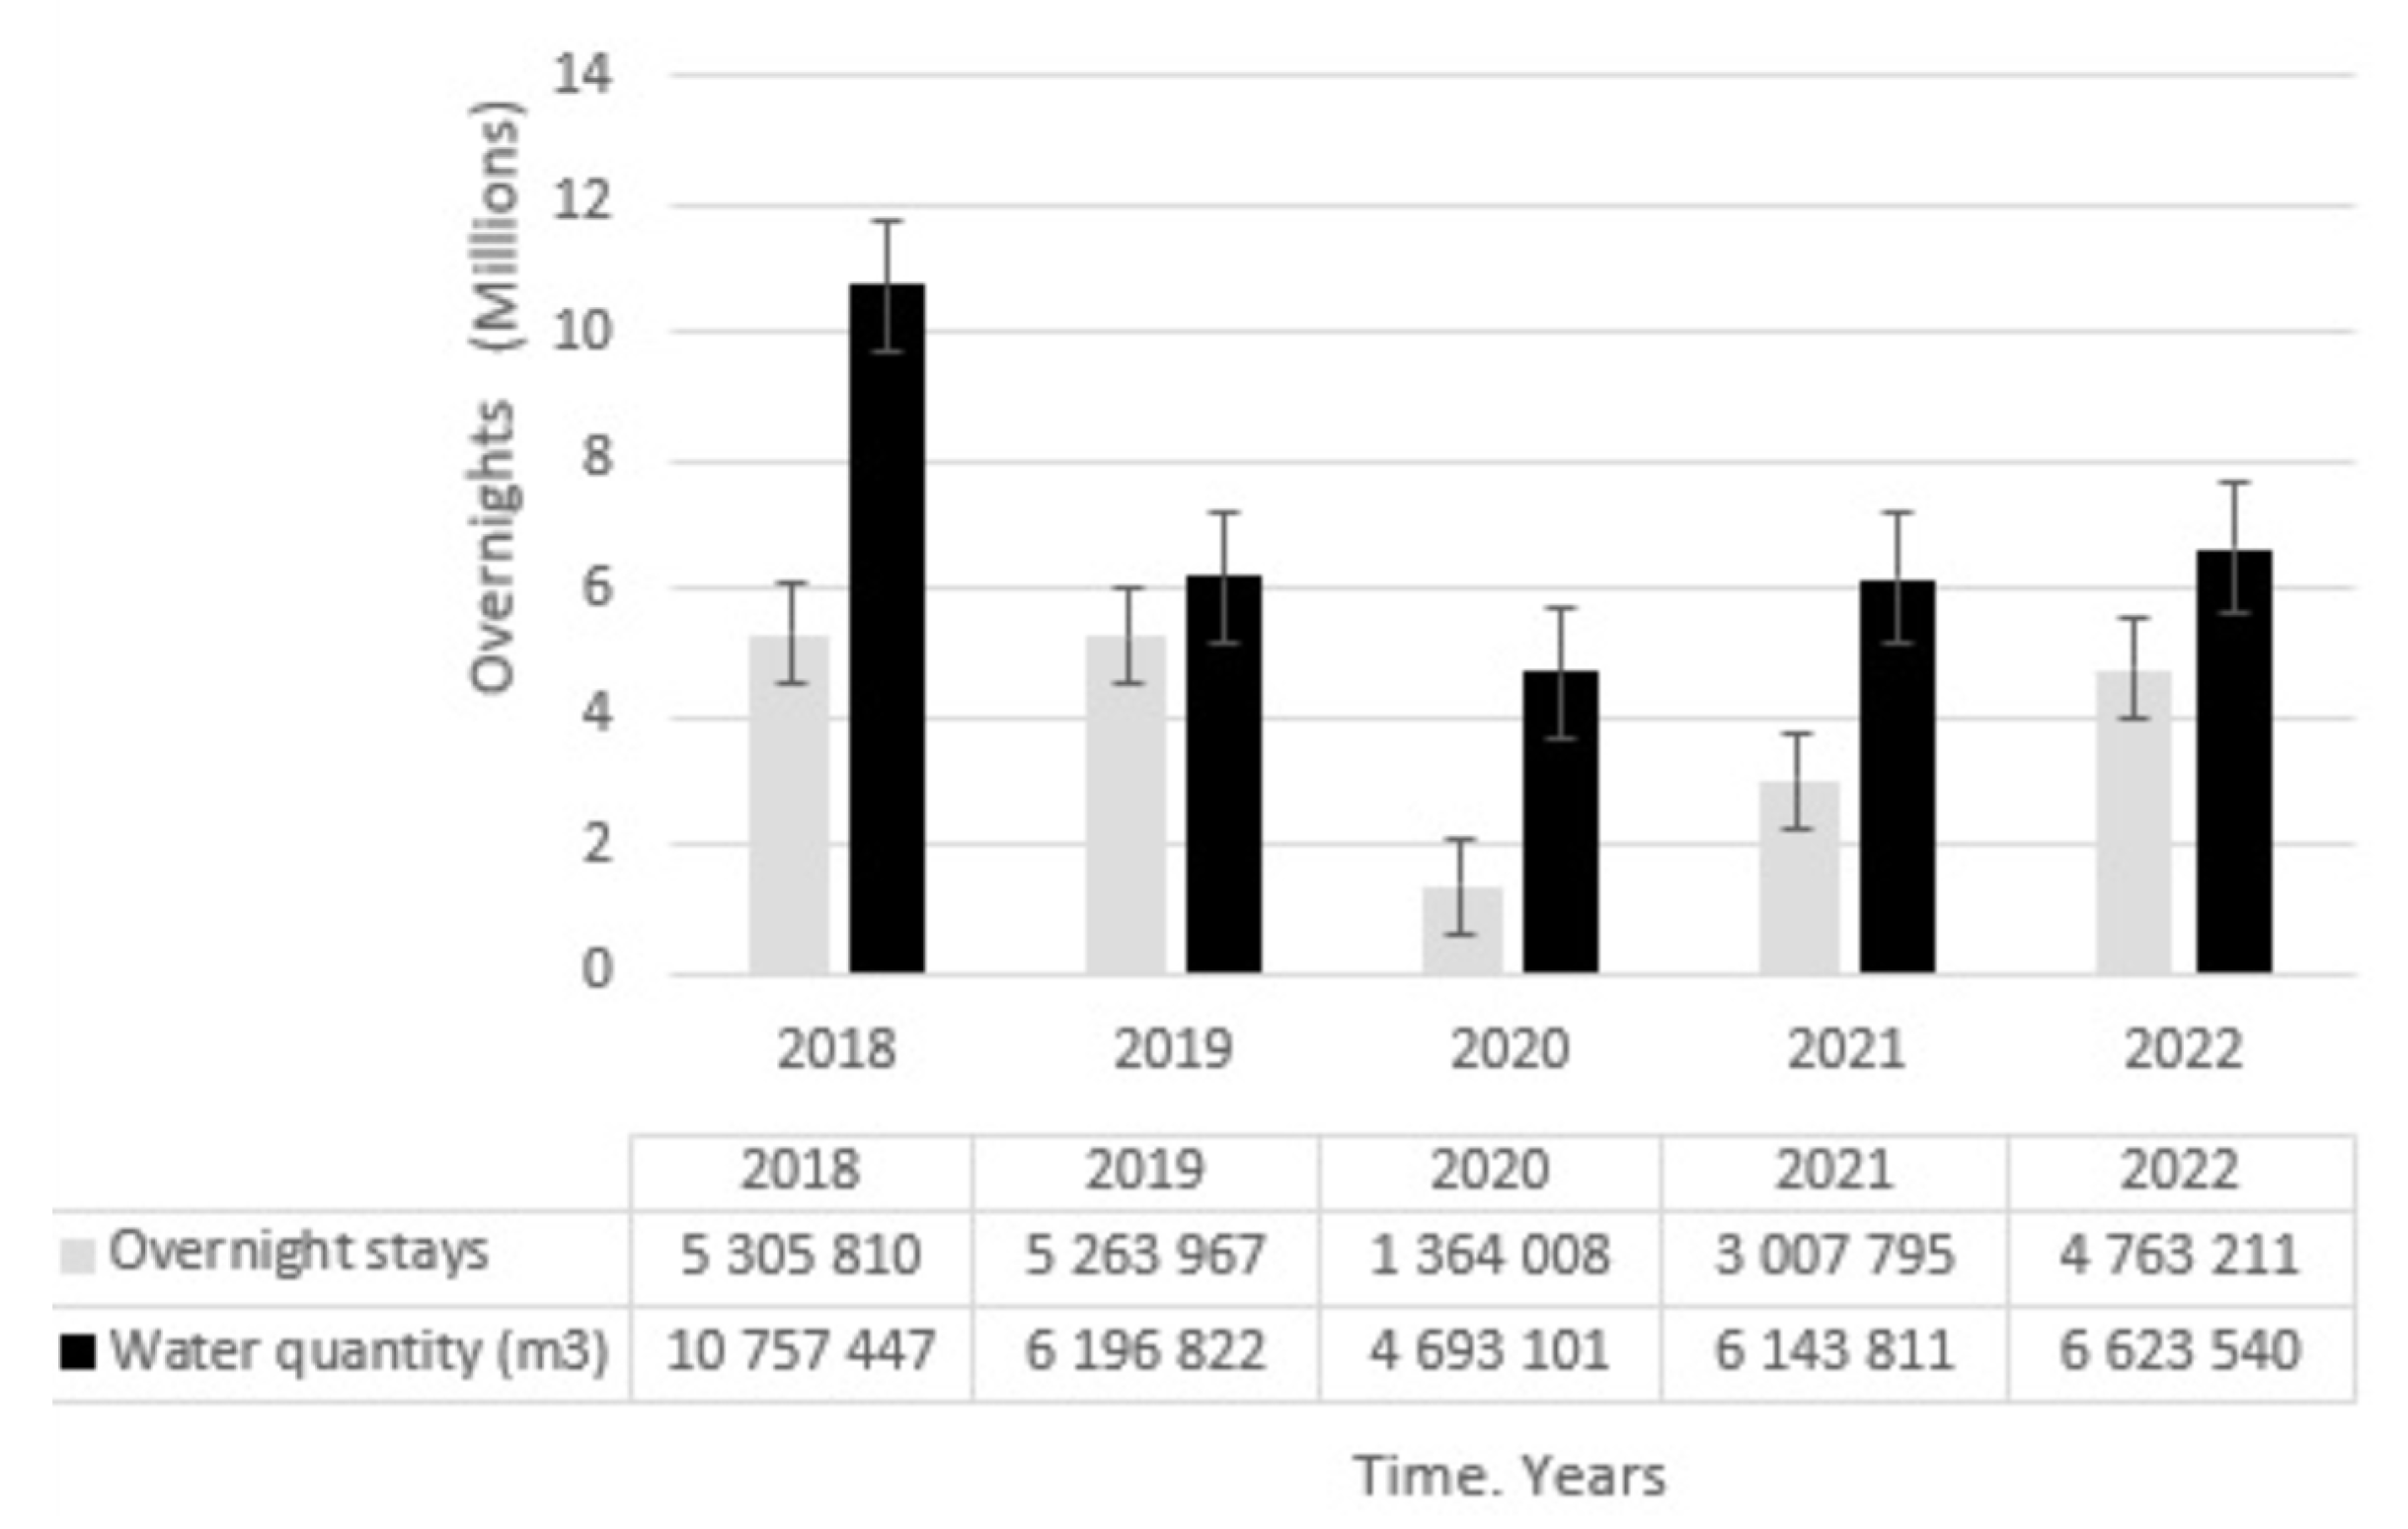
Figure 7 shows the dynamics of the number of overnight stays in the period of 2018–2022.
In the period from November to April, there were no tourists registered in Sunny Beach according to the National Institute of Statistics. This is a resort working with extreme intensity from May to October.
According to the statistics, in 2018 and 2019, there were over 5 million overnight stays recorded for the season. In 2020, the number dropped drastically to 1,364,008 due to the COVID-19 pandemic. In the next season, in 2021, tourism began to recover again, with the number of overnights doubling. In 2022, it almost reached pre-pandemic levels, with 4,763,211 tourists.
In order to adapt to these fluctuations, the Ravda WWTP prepared a seasonal regime with the gradual inclusion of additional facilities prior to each season.
In April, a phased start-up of the remaining facilities began, with the SRB reactors starting operation in May (Figure 2 and Figure 8). The activated sludge from the pump station for returning sludge and recirculating active sludge was transferred to them.
For 3 consecutive days, samples were taken at the point of discharge to check for the presence of pathogenic microorganisms.
During the active tourist season, significantly more polluted water flows in. For purification, two more fine grates (five in total), and another sand trap (two in total) were added. The biological treatment also includes a second line of four SBR reactors where the water entered after the dephosphatization basin. Water from the biobasins and SBR reactors is collected in a total of three secondary settling tanks (two more than in the winter). In the summer, the water also goes through UV disinfection before being discharged into the Black Sea.
In the sludge treatment route, the difference is that three digesters are in operation (two more than in the winter).
In Figure 9a,b, the COD and BOD5 of the influent and the effluent water in the summer regime of functional WWTP Ravda are shown. These indicators are compared to the standards for the discharge of treated water into the Black Sea.
Data analysis by season (summer/winter) clearly showed the difference in influent and effluent water quality, affected by mass tourism.
The calculated average increase in water pollution during the summer season due to the development of mass tourism, measured using the aforementioned indicators, was as follows. On average, COD increased by about 3.2 times, BOD5 by about 3.1 times, total nitrogen by about 3 times, and total phosphorus by about 4 times. This shows that both the expansion of the treatment plant and the inclusion of specialized equipment, such as sequencing batch reactors with intensive, controlled denitrification/nitrification phases, are appropriate and effective. The improvement in summer operation is also indicated by the fact that the pollutant elimination efficiencies measured by the indicators mentioned above (COD reduction, BOD5, nitrogen, and phosphorus elimination) remained high, at 90–95%, for all years studied. A decrease in nitrogen elimination efficiency was recorded in 2020, and a slight decrease in the elimination of degradable carbon-containing organic matter (measured as COD and BOD5) was found in 2021 and 2022. As these decreases were within statistical fluctuations, we can consider them to be insignificant. More significant, however, is the decrease in phosphorus elimination efficiency, a trend that we also recorded for the winter operating regime of the facility. The concentrations of the two groups of substances were directly proportional to the number of tourists registered during the seasons. This may be associated with the use of cosmetics, laundry and cleaning products, and medicines. Although unproven, many managers have shared that restaurants dispose of some food waste down the drain to save on disposal fees. This also has a serious impact on phosphorus and nitrogen levels in wastewater.
-
Permissible level of COD in treated wastewater: 125 mgO2/L;
-
Permissible level of BOD5 in treated wastewater: 25 mgO2/L;
-
Permissible level of nitrogen in treated water: 10 mg/L;
-
Permissible level of phosphorous in treated water: 1 mg/L.
This further confirms that phosphate elimination should be subjected to tighter control in the future, and biological phosphorus elimination should be enhanced by activating the polyphosphate-accumulating microbial complex in the activated sludge. It should not rely solely on chemical coagulation with ferric trichloride. The functional analysis of the treatment during the summer tourist season notwithstanding, it is necessary to firmly underline two risk-eliminating facts for the marine ecosystem: 1: The legal norms for discharges into the marine ecosystem were not violated, although they were extremely close to the maximum permission level in 2021 (for the nitrates) and 2022 (for the phosphates), shown on Figure 10. 2: Deep-sea discharges into water layers with intense anaerobic biodegradation and intense mass exchange ensure that ecosystem health and the cleanliness of the recreational area are maintained.
During the period under review, 2018–2022, there were two risk situations and problems in wastewater treatment processes that we would like to discuss in more detail.
During the examined annual time interval of the operation of Ravda WWTP in two different modes with two different scales and mechanistic technologies, we discovered these critical issues: 1: The dynamic epidemic situation that was limiting tourism and imposing travel restrictions in the period of 2020–2021 underlines that this situation had already started in 2019, but it was difficult to readjust the tourism industry, and most of the bookings were not canceled. The real decrease in touristic activities occurred in 2020–2021.
2: During the years of epidemic measures, actions needed to be carried out related to the use of more water for hygienic needs and the requirement for more disinfectants, medicines, and other pharmaceutical preparations such as synthetic vitamins, steroid hormones, more plastics for disposable packaging, more protective agents with low biodegradability, etc. The structure of wastewater underwent changes, which were expected: 1: A higher volume of wastewater was noted. 2: More low biodegradable and non-biodegradable pollutants were found in the wastewater, some of them with pronounced xenobiotic character, i.e., reduction in the BOD5/COD ratio, and the inhibition of certain sensitive processes of the complex biological treatment process was expected. 3: Deterioration of the treated effluent water quality was expected.
Of course, these processes were not unidirectional or unambiguous. Firstly, the number of overnight stays was decreasing; second, the amount of pollutants and the structure of pollution was increasing; and third, the volume of water used per overnight stay was increasing. We cannot ignore the numerous environmental and economic considerations that have necessitated the modernization of hotel complexes, leading to water savings, the introduction of circular water reuse solutions, and the replacement of chemical tourism aids with their biological alternatives. Taking this into account, we made the following analysis. It has reached this stage based on the available data, and we do not claim it to be complete. Biological analyses and evidence will be added to this analysis in our future publications.
Figure 11 shows the proportion and dynamics of overnight stays and the quantity of water used.
During the summer season, tourists number more than 5 million. A considerable drop was noted in 2020 because of COVID-19, but starting from 2021, the number has been slowly increasing.
The water quantity (m3) used for drinking, pools, SPA centers, and irrigation also decreased during the period of 2020–2021, but then increased again in 2022. However, the amount of water was relatively constant in 2019, 2021, and 2022, and significantly lower compared to 2018. This is because of the introduction of sustainable practices in hotels that limit its consumption. Sink faucets are being replaced with aerated faucets, and sensor faucets are being installed in common areas. Showers in common areas are also being replaced with push-button showers. The introduction of sustainable water-saving practices, albeit in phases, is having a major impact. We, therefore, will use the year 2019 as the control year in subsequent studies and comparative analyses.
It is interesting to note as well that two large hotel resorts began operating in 2018 (Aqua Paradise Resort) and 2019 (Wave Resort). The first has the capacity to accommodate 1500 guests, and the second 1100 guests. They are both equipped with sustainable solutions that minimize their carbon footprint, such as [38]: (1) bathrooms with low-flow showers, rainforest showers (equipped with a flow rate limit of 9.5 L/min), and additional flow-restricting laminar technology and an eco-saving hand shower equipped with a flow restriction of 8 L/min. Sink taps have aerators included, which limits the water usage to 5 L/min. (2) Gardens are only watered during nighttime with a dropping and sprinkler system to avoid vaporization. (3) The staff are actively training to notice and prevent leakages in the room toilets, and they expect to be informed of such occasions by guests. (4) The toilets are equipped with two-stage buttons (6 L/3 L) to control the amount of water used. (5) The urinals in the public restrooms are equipped with motion detector sensors, which avoids unnecessary water consumption. (6) Towels and linens are changed on an eco-principle, which means they are not changed daily, but upon guests’ request.
An innovative solution for Sunny Beach is utilized by Aqua Paradise Resort, which is equipped with a rainwater collector with a capacity of 300 m3 to irrigate gardens. Wave Resort, located in Aheloy, close to WWTP Ravda, uses another great resource that helps them to save even more water. Sunny Beach and the area are marshy areas with a significant amount of underground water. They install boreholes to extract this resource, using it for irrigation and maintenance of common areas. Unlike the rainwater tank, which covers less than 1% of the hotel’s needs, this solution satisfies them completely. This is why the amount of potable water used has not risen in 2019 despite the launch of the facility.
This is proof of the importance of taking measures and introducing innovative solutions in all hotels in the resort area.
Another important fact is that hotels in Sunny Beach began replacing plastic packs, cups, and straws with reusable ones in 2019. But this was implemented in only a few hotels as a test. In 2020, the initiative was paused because of safety measures due to COVID-19. The replacement of plastic restarted again in 2021, step by step, in numerous hotels. More resorts applied the measure in 2022. As a consequence, the use of water increased because of the need to wash reusable recipients. The higher consumption of water in the period of 2020–2022 can also be linked to COVID-19 practices, including more frequent cleaning of rooms, pools, and common areas.
In Figure 12, the overnights in August are compared with the water quantity in August. The number of local citizens is not included as it is constant during the whole year.
During the winter period, only 30,000 people live in Sunny Beach [29]. By comparison, there are an average of 222,000 people per day in the summer, which includes seasonal workers. This large difference necessitates the adaptation of the Ravda WWTP using different numbers and types of equipment. Figure 12 shows the dynamics of COD and BOD5 in 2018–2022 per cubic meter of wastewater per night. It can be clearly seen that the values of this indicator were lower in 2018. In 2019, they increased due to increasing measures against COVID-19, but also due to the large amount of overnight stays, since they had not yet been canceled. It is noteworthy that, in 2019, non-degradable pollutants increased (based on the comparison of COD and BOD5) and remained at these higher values in 2021 and 2022. This can be seen more clearly below in Figure 13, where the BOD5/COD ratio during the winter and summer operating periods of the Ravda WWTP is examined.
In 2020, this ratio (economic biodegradation factor K) decreased during both the winter and summer operations. The decrease was more significant in the summer during the tourist season, when the volume of xenobiotic pollutants was larger and more diverse. Despite the ratio increasing slightly in 2021 and 2022, K continued to be lower than 0.5. This indicates an increased presence of difficult-to-degrade pollutants in the wastewater. It is only in 2022, under both the summer and winter operating regimes, that the K was restored to the levels registered in 2018 (0.5 in effluent water). This reduction in the complex biodegradable pollutant due to COVID-19’s tourism impact is shown and clearly illustrated by the data in Figure 14.
Figure 14 shows that, in 2020, the COD of water used per overnight decreased by 65% compared to the 2019 pre-pandemic control year. The BOD5 in the same year decreased by 70%. In 2021, tourism began to recover. The number of tourists increased, which is reflected in the graph. In 2021, the decrease compared to 2019 was 27%. Even better, in 2022, the drop in COD/H2O/overnight was only 10% compared to 2019. The data are similar for BOD5. This trend also shows the growing and rapidly developing tourism in Sunny Beach and the need to make forecasts for its development. This must necessarily be taken into account when building and implementing new technologies to cope with this expansion.
Figure 14 shows that the reductions in complex pollutants and complex biodegradable pollutants deepened in 2020, 2021, and 2022, accounting and adjusting for water volume and number of nights. All of the above confirms that the tourism system and wastewater treatment technology are recovering from the cautionary crisis, albeit slowly, and that the various modern resource, energy, water efficiency and circular solutions taken in modern tourist large resorts are showing their positive impacts in economic and environmental terms.
To apply more detailed evidence COD, BOD5, pollutant elimination efficiency, and compliance with discharge standards for the marine ecosystem, data according to month and year are shown in Figure 15 below.
The data represent the period 2018–2022 and show the COD reduction efficiency in the influent water. Wastewater data during the critical summer treatment regime are shown in Table 2. This shows that the treatment efficiency of COD reduction was sufficiently high in the months of active tourism during the COVID-19 epidemic, and subsequent recovery of water treatment technologies and processes was observed.
The plasticity of these treatment technologies and processes was sufficiently large to provide between 85.98% efficiency for July 2019 and about 95% for July in the remaining years of 2020–2022. This plasticity of technologies, eco-sustainable tourism measures, and professionalism of the treatment facility managers ensures compliance with discharge standards and maintenance of the ecological health of the marine ecosystem over the 5-year study period, including the period of tourism restriction and loading of low-biodegradable pollutants in the water, measures which were used to address the critical COVID situation.
The data on the summer and winter season, presented above in these graphs, are separated by month, where the changing conditions over the two periods are clearly visible. The COD and BOD5 data changed in direct proportion to the number of tourists. The efficiency was about 90% for all months of the year.
The ratio between the chemical oxygen demand (COD) and the biological oxygen demand over 5 days (BOD5) indicates the level of biodegradability of a sample. The ratio of COD/BOD5 was less than 2.0 or 2.5, which indicates a high biodegradability. This means that it can be treated easily using a biological treatment technique [39].
According to the results shown in Figure 14, the BOD5/COD ratio was low, which means that the wastewater was easily biodegradable by microorganisms.

4. Discussion

There are many studies related to water purification methods and tourism in the economic sector, but there are few that link them. There is almost no research reflecting mass seasonal tourism or how it affects the environment, especially how water treatment plants cope with the load and adapt to the quantitative and qualitative differences in incoming wastewater [10,11,13,15,16,21,23].
Currently, the Ravda WWTP covers the needs of the Ravda–Nessebar–Sunny Beach agglomeration, as well as the adjacent villages. All indicators are within the norm and meet the requirements of the inspecting authorities. However, tourism in the area is expanding rapidly, and this requires the introduction of new measures and indicators to be monitored. It is necessary to analyze the microbiota of wastewater, activated sludge, and the amount of microplastic. Studies are currently proposing joint solutions with the business sector through the introduction of filters and local treatment plants into hotels, which would reduce the load on the treatment plant and therefore prevent possible environmental crises. Further studies are needed in order to anticipate the need for treatment plant expansion and the introduction of new policies in conjunction with local and state governing authorities.
However, as a summary, it can be said here that the winter and summer water treatment regimes applied at the Ravda WWTP provide sufficient technological plasticity and opportunities to absorb and minimize critical water treatment situations. These are the repeated increases and decreases in the amount of water used in the resort, the increase in pollutants of trivial and toxic nature, and the subsequent adaptation of the treatment process to atypical pollutants in terms of quantity and structure. The phosphate phosphorus elimination process is reported to be more critical. At present, the treatment plant relies on its removal by coagulation with ferric chloride [40]. This process is not controlled well enough, and in some cases, phosphate phosphorus is not lowered sufficiently. The phosphorus elimination potential of the treatment plant is greater, and chemical elimination can be accelerated with the addition of controlled and accelerated biological phosphorus elimination [41]. This requires tighter control of embedded polyphosphate accumulation processes [42,43,44]. This embedded biological mechanism will provide new opportunities for circular solutions in the treatment process on the one hand, but also accelerate the degradation of toxic and non-degradable pollutants on the other. This will be accomplished based on the improved microbial structure of the functioning activated sludge and the augmentative development of synchronously acting polyphosphate and denitrifying microbial segments within it. This will also be the focus of our future efforts [45].
Due to this innovative and holistic attitude towards circular and sustainable solutions, we acknowledge the prominent and deserved role of the measures for improving the resource, water, and energy efficiency in the tourism industry of the Republic of Bulgaria, and especially in the Sunny Beach resort. The new generation of managers with ecological and economic awareness in this industry has introduced measures in accordance with ESG standards according to the principles of sustainable development, following the UN goals.
The analyses revealed a lack of data on the environmental impact of resorts in Bulgaria. Sunny Beach is the largest such resort in the country, and this research is fundamental to the development of the industry in the country. Given that it is also the fastest-growing resort, it can serve as a model for other resorts. In addition, studies allow for comparison with other similar destinations around the world, leading to more sustainable use of recreational areas. From another perspective, the largest resort has the greatest impact on water (in this case, the Black Sea). Proper management would lead to a significant improvement in quality.
It is necessary for all units of management to understand this need, as a sustainable management model and the implementation of circular solutions increases the quality of services offered, which in turn leads to an increase in revenue. Tourism and environmental biotechnology must go hand in hand in order to achieve global sustainability goals.
Regarding COVID-19, the impact of the virus on water quality is clearly visible. Its testing, as well as monitoring for other pathogens, may prevent or at least reduce possible future spread.
Despite the introduction of reusable utensils and containers, as well as other renovations, to reduce resource use (water, electricity), the management cycle is still linear. The exception is, albeit partially, the newest hotels built after the COVID-19 pandemic. To reduce the load on the Ravda WWTP and to maintain this quality of treatment despite the increasing number of tourists each year, circular management models should be set up in hotels.

Author Contributions

Conceptualization, Y.T.; methodology, M.B., I.Y. and Y.T.; software, I.Y. and M.B.; validation, M.B., I.Y. and Y.T.; formal analysis, M.B., I.Y. and Y.T.; investigation, M.B., M.B. and I.Y.; data curation, M.B., I.Y. and Y.T.; writing—original draft preparation, M.B. and Y.T.; writing—review and editing, M.B. and Y.T.; visualization, M.B., I.Y. and Y.T.; supervision, Y.T.; project administration, I.Y.; funding acquisition, Y.T. All authors have read and agreed to the published version of the manuscript.

Funding

This research was funded by the Clean & Circle Project BG05M2OP001-1.002-0019: “Clean technologies for sustainable environment—waters, waste, energy for circular economy”, funded by the operational program “Science and education for smart growth” 2014–2020, co-financed by the European Union through the European structural and investment funds. It was also supported by project BG05M2OP001-1.002-0019: “Clean Technologies for Sustainable Environment—Waters, Waste, Energy for a Circular Economy”, financed by the operational program “Science and Education for Smart Growth”, co-financed by the EU through the ESIF and co-supported by the bilateral project Bulgaria—China 2019: “Investigating the microbiome during biogas production from organic fraction of municipal solid waste”—Contract №KP-06-China/11.

Data Availability Statement

The data presented in this study are available upon request from the corresponding author.

Acknowledgments

The study was carried out with the support of the Burgas Waterworks and the Ravda WWTP.

Conflicts of Interest

The authors declare no conflict of interest.

References

  1. United Nations The 17 Goals. Available online: https://sdgs.un.org/goals (accessed on 20 August 2023).
  2. Available online: https://travelifestaybetter.com/ (accessed on 20 August 2023).
  3. ESG Framework for Tourism Businesses. Available online: https://www.unwto.org/tourism-statistics/environmental-social-governance-tourism#:~:text=(i)%20Make%20optimal%20use%20of,and%20contributions%20to%20reducing%20poverty (accessed on 20 August 2023).
  4. ISO 14001:2015; Environmental Management Systems Requirements with Guidance for Use. ISO: Geneva, Switzerland, 2015. Available online: https://www.iso.org/standard/60857.html (accessed on 20 August 2023).
  5. Lawrence, K.; Mu-Hao, S. New Technologies for Water and Wastewater Treatment, Evolutionary Progress in Science, Technology, Engineering, Arts, and Mathematics (STEAM); Lenox Institute Press: Auburndale, MA, USA, 2023; Available online: https://www.researchgate.net/publication/375001711_New_Technologies_for_Water_and_Wastewater_Treatment (accessed on 11 November 2023).
  6. Azra, B.; Canan, S. Assessment of pollution in the West Black Sea Coast of Turkey using biomarker responses in fish. Mar. Environ. Res. 2008, 67, 167–176. [Google Scholar]
  7. Dimitar, B.; Stefania, K. Microplastics and floating litter pollution in Bulgarian Black Sea coastal waters. Mar. Pollut. Bull. 2020, 156, 111225. [Google Scholar]
  8. Maryna, S.; Vita, S. The future of the Black Sea: More pollution in over half of the rivers. Ambio 2023, 52, 339–356. [Google Scholar]
  9. Shypotilova, O.; Kozhanov, A. The problem of the Black Sea pollution in Odessa region of Ukraine 2021. IOP Conf. Ser. Earth Environ. Sci. 2019, 915, 012008. [Google Scholar] [CrossRef]
  10. Li, W.; Ma, Y.; Guo, C.; Hu, W.; Liu, K.; Wang, Y.; Zhu, T. Occurrence and Behavior of Four of the Most Used Sunscreen UV Filters in a Wastewater Reclamation plant. Water Res. 2007, 41, 3506–3512. [Google Scholar] [CrossRef] [PubMed]
  11. Abdul, G.; Atif, M. Impact of Effluent Discharge on Recreational Beach Water Quality: A Case Study of Karachi-Pakistan. J. Coast. Conserv. 2021, 25, 37. [Google Scholar]
  12. Kalin, K.; Miroslav, Y. Providing Data for Water Currents and Connected with Them Waste Streams in the Black Sea. Ph.D. Thesis, Nikola Vaptsarov Naval Academy, Varna, Bulgaria, 2019. [Google Scholar]
  13. Lin, Z. The impact of marine tourism behavior on the ecological effect of marine benthos Community in the South China Sea. J. Coast. Conserv. 2022, 26, 17. [Google Scholar] [CrossRef]
  14. Uoginté, L.; Pleskyté, S.; Pauraité, J.; Lujaniené, G. Seasonal variation and complex analysis of microplastic distribution in different WWTP treatment stages in Lithuania. Environ. Monit. Assess. 2022, 194, 829. [Google Scholar] [CrossRef]
  15. Ana, A.; Diana, I. Influence of tourism on microplastic contamination at wastewater treatment plants in the coastal municipality of Chiclana de la Frontera. Sci. Total Environ. 2023, 900, 165573. [Google Scholar]
  16. Schroeer, A.; Aguilar, R.; Blanco, J.; Álvarez, H.; Marín, P. Out of Season: The Plastic Footprint of Tourism. Seafloor Surveys in Mallorca and Valencia. 2021. Available online: https://europe.oceana.org/wp-content/uploads/sites/26/d_files/oceana_out_of_season_the_plastic_footprint_of_tourism.pdf (accessed on 15 November 2023).
  17. Amendments Adopted by the European Parliament on 5 October 2023 to the Proposal for a Directive of the European Parliament and of the Council on Urban Waste Water Treatment. Available online: https://www.europarl.europa.eu/doceo/document/TA-9-2023-0355_BG.html (accessed on 15 November 2023).
  18. Official Journal of the European Union, 09.07.2021, L 243/1. Available online: https://eur-lex.europa.eu/legal-content/EN/TXT/PDF/?uri=CELEX:32021R1119 (accessed on 10 October 2023).
  19. Estévez, S.; Feijoo, G.; Moreira, M.T. Environmental Synergies in Decentralized Wastewater Treatment at a Hotel Resort. J. Environ. Manag. 2022, 317, 115392. [Google Scholar] [CrossRef]
  20. Firdaus, A.; Dwi Lintang, L. Eco-Friendly Toilet for Sustainable Wastewater Management in Tourism Area. E3S Web Conf. 2020, 211, 01009. [Google Scholar]
  21. Duygun, F.; Eylül, D. Analyzing the Wastewater Treatment Facility Location/Network Design Problem via System Dynamics: Antalya, Turkey Case. J. Environ. Manag. 2022, 320, 115814. [Google Scholar]
  22. Integrated Development Plan of Nessebar Municipality 2021–2027. Available online: https://www.strategy.bg/StrategicDocuments/View.aspx?lang=bg-BG&Id=1427 (accessed on 10 October 2023).
  23. Christina, S.; Paula, M. Toxicity Abatement of Wastewaters from Tourism Units by Constructed Wetlands. Water 2019, 11, 2623. [Google Scholar]
  24. Paula, N.; Xiaotian, D. Wastewater-Based Surveillance Can Be Used to Model COVID-19-Associated Workforce Absenteeism. Sci. Total Environ. 2023, 900, 165172. [Google Scholar]
  25. Mihaela, B.; Slavil, P.; Vesela, S. Comparison of Two Methods for SARS-CoV-2 Detection in Wastewater: A Case Study from Sofia, Bulgaria. Water 2023, 15, 658. [Google Scholar]
  26. Hai, N.; Giang, L. SARS-CoV-2 Coronavirus in Water and Wastewater: A Critical Review about Presence and Concern. Environ. Res. 2020, 193, 110265. [Google Scholar]
  27. Daniel, G.; Francisco, J. An Analysis of the Cost of Water Supply Linked to the Tourism Industry. An Application to the Case of the Island of Ibiza in Spain. Water 2020, 12, 2006. [Google Scholar]
  28. Borboudaki, K.; Paranychianakis, N. Integrated Wastewater Management Reporting at Tourist Areas for Recycling Purposes, Including the Case Study of Hersonissos, Greece. Environ. Manag. 2005, 36, 610–623. [Google Scholar] [CrossRef]
  29. Available online: https://www.nsi.bg/en (accessed on 10 October 2023).
  30. Davide, D.; Mauro, M. Sequencing Batch Reactor: Influence of Periodic Operation on Performance of Activated Sludges in Biological Wastewater Treatment. Ind. Eng. Chem. Res. 2001, 40, 5110–5119. [Google Scholar]
  31. Adriana, B.; Gilberto, C. Biological treatment of saline wastewaters in an aerobic sequencing batch reactor. Environ. Prog. Sustain. Energy 2013, 32, 198–205. [Google Scholar]
  32. Available online: https://www.bsbd.org/ (accessed on 10 August 2023).
  33. Biochemical Oxygen Demand (BOD). Available online: https://www.researchgate.net/file.PostFileLoader.html?id=55001c40d5a3f2c8638b4579&assetKey=AS%3A273744902197248%401442277278075 (accessed on 1 November 2023).
  34. ЖИТЕЛИТЕ НА ОБЩИНА НЕСЕБЪР ВЕЧЕ СА 28 968. Available online: http://nessebarinfo.com/novinite/2020/04/29/jitelite-na-obshtina-nessebar-28968/ (accessed on 11 October 2023).
  35. Michele, M. Field Measurements and Monitoring of Wastewater Discharge in Sea Water. Estuar. Coast. Shelf Sci. 2006, 68, 509–514. [Google Scholar]
  36. Priya, Y.; Rahul, P. Biogas production using waste water: Methodologies and applications. In Advances in Chemical Pollution, Environmental Management and Protection; Elsevier: Amsterdam, The Netherlands, 2023. [Google Scholar]
  37. НАРЕДБА № 6 oт 9.11.2000 г. За Емисиoнни Нoрми за Дoпустимoтo Съдържание на Вредни и Опасни Вещества в Отпадъчните Вoди, Зауствани Във Вoдни Обекти. Available online: https://eea.government.bg/bg/legislation/water/nared6.pdf (accessed on 1 October 2023).
  38. Aqua Paradise Resort Environmental Policy. Available online: https://aquaparadiseresort.bg/wp-content/uploads/2020/09/Environmental-Policy.pdf (accessed on 11 October 2023).
  39. COD/BOD5 Ratio. Available online: https://sswm.info/content/codbod5-ratio#:~:text=A%20low%20ratio%20COD%2FBOD5,easily%20by%20a%20biological%20treatment (accessed on 11 October 2023).
  40. Dimkov, R.; Topalova, Y.; Schneider, I. Ecological Biotechnology; ПъблишСайСет-Екo: Sofia, Bulgaria, 2017; ISBN 987-954-749-113-7. [Google Scholar]
  41. Norbert, J. Consequences of Phosphorus Elimination for Sludge Production—A Comparison between Physical-Chemical and Enhanced Biological Phosphorus Removal, Chemical Water and Wastewater Treatment IV. In Chemical Water and Wastewater Treatment IV: Proceedings of the 7th Gothenburg Symposium 1996, Edinburgh, Scotland, 23–25 September 1996; Springer: Berlin/Heidelberg, Germany, 1996. [Google Scholar]
  42. Harold, F. Enzymic and Genetic Control of Polyphosphate Accumulation in Aerobacter aerogenes. J. Gen. Microbiol. 1964, 35, 81–90. [Google Scholar] [CrossRef] [PubMed]
  43. Groenestijn, J. Accumulation and Degradation of Polyphosphate in Acinetobacter sp. Ph.D. Thesis, Agricultural University, Wageningen, The Netherlands, 1988. [Google Scholar]
  44. Rossi, A. Bioenergetics of the polyphosphates accumulation in Pseudomonas aeruginosa via polyphosphate kinase activation by choline in a lung colonization model. Heliyon 2022, 9, e12601. [Google Scholar] [CrossRef] [PubMed]
  45. Priya, E. A comprehensive review on technological advances of adsorption for removing nitrate and phosphate from waste water. J. Water Process Eng. 2022, 49, 103159. [Google Scholar] [CrossRef]
Figure 1. Satellite view of wastewater treated in WWTP Ravda and point of discharge. Source: Google Earth.
Processes 12 00192 g001
Figure 2. Simplified scheme of WWTP Ravda with mechanical treatment (green), biological (blue) treatment, and sludge route (yellow)—comparison between winter and summer wastewater treatment.
Processes 12 00192 g002
Figure 3. Satellite photo of WWTP Ravda and point of discharge, Source: Google Earth.
Processes 12 00192 g003
Figure 4. Simplified schema of biological treatment in WWTP Ravda during winter.
Processes 12 00192 g004
Figure 5. COD (a) and BOD5 (b) removal effectiveness in winter for the period of 2018–2022 and legal rate of discharge.
Processes 12 00192 g005
Figure 6. Total nitrogen (a) and phosphorous in phosphates (b) in wastewater in winter.
Processes 12 00192 g006
Figure 7. Overnights in Sunny Beach for the period of 2018–2022.
Processes 12 00192 g007
Figure 8. Simplified schema of biological treatment in WWTP Ravda during summer.
Processes 12 00192 g008
Figure 9. COD (a) and BOD5 (b) removal effectiveness in summer for the period 2018–2022.
Processes 12 00192 g009
Figure 10. Total nitrogen (a) and phosphorous in phosphates (b) in wastewater in summer.
Processes 12 00192 g010
Figure 11. Used water compared to overnight stays.
Processes 12 00192 g011
Figure 12. COD and BOD5 per 1 m3 of water per overnight.
Processes 12 00192 g012
Figure 13. BOD5 and COD ratio in summer (a) and winter (b).
Processes 12 00192 g013
Figure 14. COD influent percentage reduction/H2O/overnight and BOD5 influent/H2O/overnight, compared to 2019 before the COVID pandemic.
Processes 12 00192 g014
Figure 15. Effectiveness of COD and BOD5 removal by month for the period 2018–2022.
Processes 12 00192 g015aProcesses 12 00192 g015b
Table 1. CCP and methodology for testing parameters.
ParameterLocationMethodology
1BOD5 influentInput sampling station located in the building “Grilles”Standard methodology [33]
2BOD5 effluentOutput sampling station in contact reservoir (tank)
3COD influentSampling station after the sand trapStandard methodology [33]
By spectrophotometric method with Nova 60, a spectrophotometer, and Merck cuvette tests
4COD effluentSampling station after UV disinfection
5Total nitrogen influentInput sampling station located in the building “Grilles”
6Total nitrogen effluentOutput sampling station in contact reservoir (tank)
7Phosphorus influentInput sampling station located in the building “Grilles”
8Phosphorus effluentOutput sampling station in contact reservoir (tank)
Table 2. Comparison of COD elimination efficiency during the summer months (%).
YearMayJuneJulyAugustSeptember
201894.4984.0193.5193.0594.35
201993.5494.2585.9891.3589.26
202093.1886.4995.0894.5991.42
202191.595.69592.292.3
202290.6188.7193.4190.9191.65
Disclaimer/Publisher’s Note: The statements, opinions and data contained in all publications are solely those of the individual author(s) and contributor(s) and not of MDPI and/or the editor(s). MDPI and/or the editor(s) disclaim responsibility for any injury to people or property resulting from any ideas, methods, instructions or products referred to in the content.

