1. Introduction
The production of natural gas in China has experienced significant growth due to the country’s focus on using cleaner energy sources and reducing reliance on coal. This growth presents opportunities for the recovery of natural gas liquids from natural gas. The presence of valuable components like ethane, propane, butane, and others in the natural gas stream makes their recovery economically attractive. The production of natural gas in China has been growing rapidly in recent years, driven by the country’s efforts to shift towards cleaner energy sources and reduce reliance on coal. In 2022, natural gas production in China increased by 6.4% to reach 217.8 billion cubic meters [
1]. Natural gas is not only composed of methane but also contains trace amounts of valuable components such as ethane, propane, butane, isobutane, and natural gasoline, collectively known as natural gas liquids (NGL). The recovery of NGL from natural gas has become economically profitable due to the high value of these components in the energy market.
To optimize the natural gas condensate recovery process, there has been a growing focus on optimizing operational parameters to reduce energy consumption and enhance energy efficiency [
2,
3,
4]. By effectively recovering and utilizing natural gas condensate, the utilization of energy resources can be maximized, leading to improved resource utilization efficiency.
The process of recovering NGL involves cooling the gas stream step by step through a series of heat exchangers to lower the temperature below the condensation points of the different hydrocarbons present. Each hydrocarbon component has a specific condensation temperature at which it transitions from a gaseous state to a liquid state. Various processing strategies have been proposed for extracting NGL from unprocessed gas streams [
5,
6,
7]. Well-designed and efficient NGL recovery units are crucial for ensuring optimal profitability throughout the lifespan of the facility.
The production of liquefied natural gas (LNG) requires a substantial amount of energy [
8]. Integrating the processes of NGL recovery and LNG production is an efficient method that can reduce the overall refrigeration requirements. Many international natural gas condensate recovery companies have adopted this technology due to its efficiency and cost-effectiveness. This approach has been widely implemented in the industry and is proven to be effective in recovering valuable condensate from natural gas streams.
Barakat-Rezaei et al. [
9] present an economic and technical analysis of producing valuable products from flare gas, namely liquefied natural gas and natural gas liquids. This research highlights the potential for utilizing flare gas as a valuable resource and demonstrates the economic and technical feasibility of producing LNG and NGL from this gas source.
The research conducted by Salas et al. [
10] focuses on determining the optimal operational conditions for NGL recovery unit. They employed a simulation-based multi-objective optimization strategy, combining PRO/II and a Python environment. By utilizing an evolutionary optimization algorithm, they simultaneously optimized multiple decision variables, resulting in the construction of a 2-D/3-D Pareto front. This approach allows for a comprehensive analysis of the trade-offs between different objectives.
In a related study, Baharm et al. [
11] investigate the design and optimization of an integrated process for the recovery of natural gas liquids, natural gas liquefaction, and nitrogen removal units. Their work involves simulation modeling and analysis to obtain and optimize the procedures involved in LNG (liquefied natural gas) production.
Simulation modeling and analysis have proven to be valuable tools in achieving a detailed understanding of LNG processes and optimizing their performance. Commercial process simulators, such as Aspen HYSYS, have been widely adopted in various industries for optimization purposes [
12]. These simulators provide a platform to simulate and optimize complex processes, enabling researchers and engineers to improve the efficiency, cost-effectiveness, and overall performance of LNG production and related operations.
The use of multiple cooling technologies is an effective approach to separate and recover natural gas, and, in particular, improve the recovery of natural gas condensate. One such method is combined refrigeration, which combines expansion refrigeration and refrigerant cycle refrigeration techniques. In this combined refrigeration system, the raw material gas is cooled via step-by-step freezing and condensate separation. This approach reduces the required overall cooling capacity and allows for a greater depth of freezing. As a result, there is a significant improvement in the recovery of natural gas condensate. While condensate separation and recovery are essential for maximizing the amount of valuable condensate obtained, it is important to consider the impact on the quality of the dry gas component, which mainly consists of methane and ethane. Methane and ethane are valuable chemical compounds in their own right, so it is crucial to strike a balance between condensate recovery and the preservation of high-quality dry gas.
Ghorbani et al. [
11] investigated cascade refrigeration systems in an integrated cryogenic natural gas process, encompassing NGL, liquefied natural gas, and nitrogen rejection units. Shamsi et al. [
13] conducted a comparative energy and exergy analysis of the Joule–Thomson and mechanical refrigeration processes to tune the natural gas dew point. Khajehpour et al. [
14] performed exergy analysis and optimization of a recovery unit for natural gas liquids.
This article focuses on the process simulation and optimization of recovering natural gas condensate using a refrigerant mixture of ethane and propane. By studying and optimizing the process parameters, such as temperature, pressure, and composition, the goal is to achieve the optimal recovery of natural gas condensate while maintaining the quality of the dry gas components.
2. Process Description
The flowsheet presented in
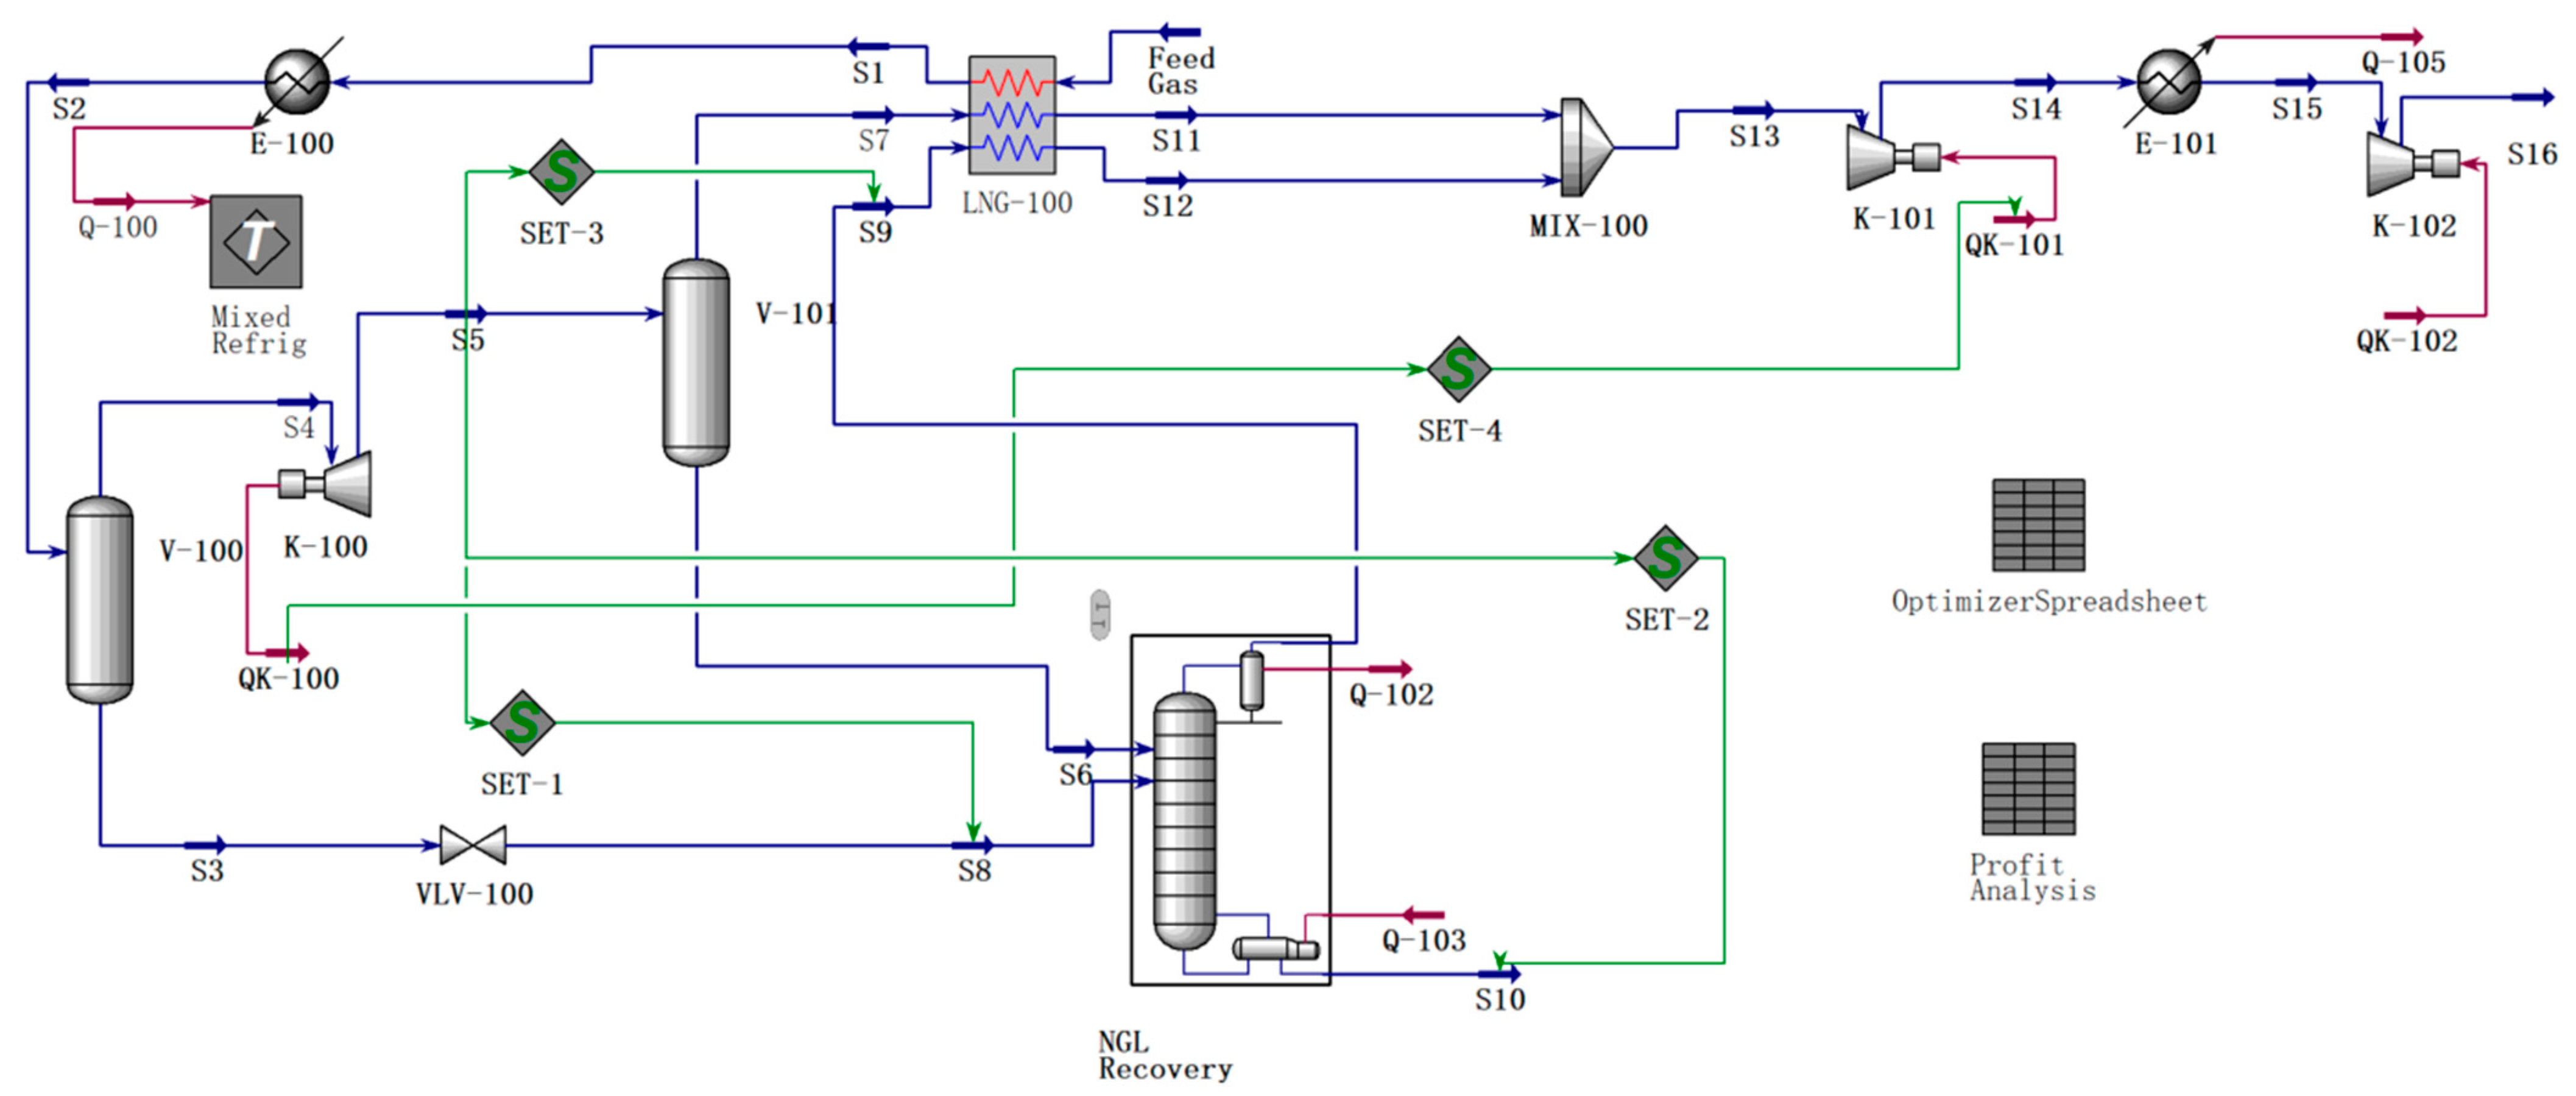
Figure 1 outlines the process for recovering natural gas condensate, encompassing cooling, compressing, and separating operations. In the base case, the natural gas undergoes cooling using an LNG-100 heat exchanger and E-100 cooler, resulting in a temperature reduction to −61 °C. To facilitate this cooling process, a mixed refrigerant comprising 90 mol% ethane and 10 mol% propane is utilized. Consequently, the heavy components within the pre-cooled natural gas are condensed and cooled until they transition into the liquid phase.
The cooled natural gas is then directed to the V-100 separator, where it is divided into two streams: gas stream S4 and liquid stream S3. Stream S3, after undergoing decompression through valve VLV-100, is introduced into the first plate of the NGL recovery tower for subsequent distillation.
On the other hand, gas phase stream S4 experiences expansion via the expander K-100 to reduce its pressure. The resulting expanded gas phase, denoted as stream S5, proceeds to the gas–liquid separator V-101. Moreover, gas phase streams S7 and S9, derived from separator V-101 and the NGL recovery tower, are employed in precooling the feedstock natural gas by passing through the LNG-100 heat exchanger. Subsequently, these streams are compressed by the K-101 compressor. Finally, the compressed gas attains a pressure of 7000 kPa in the K-102 compressor before being exported.
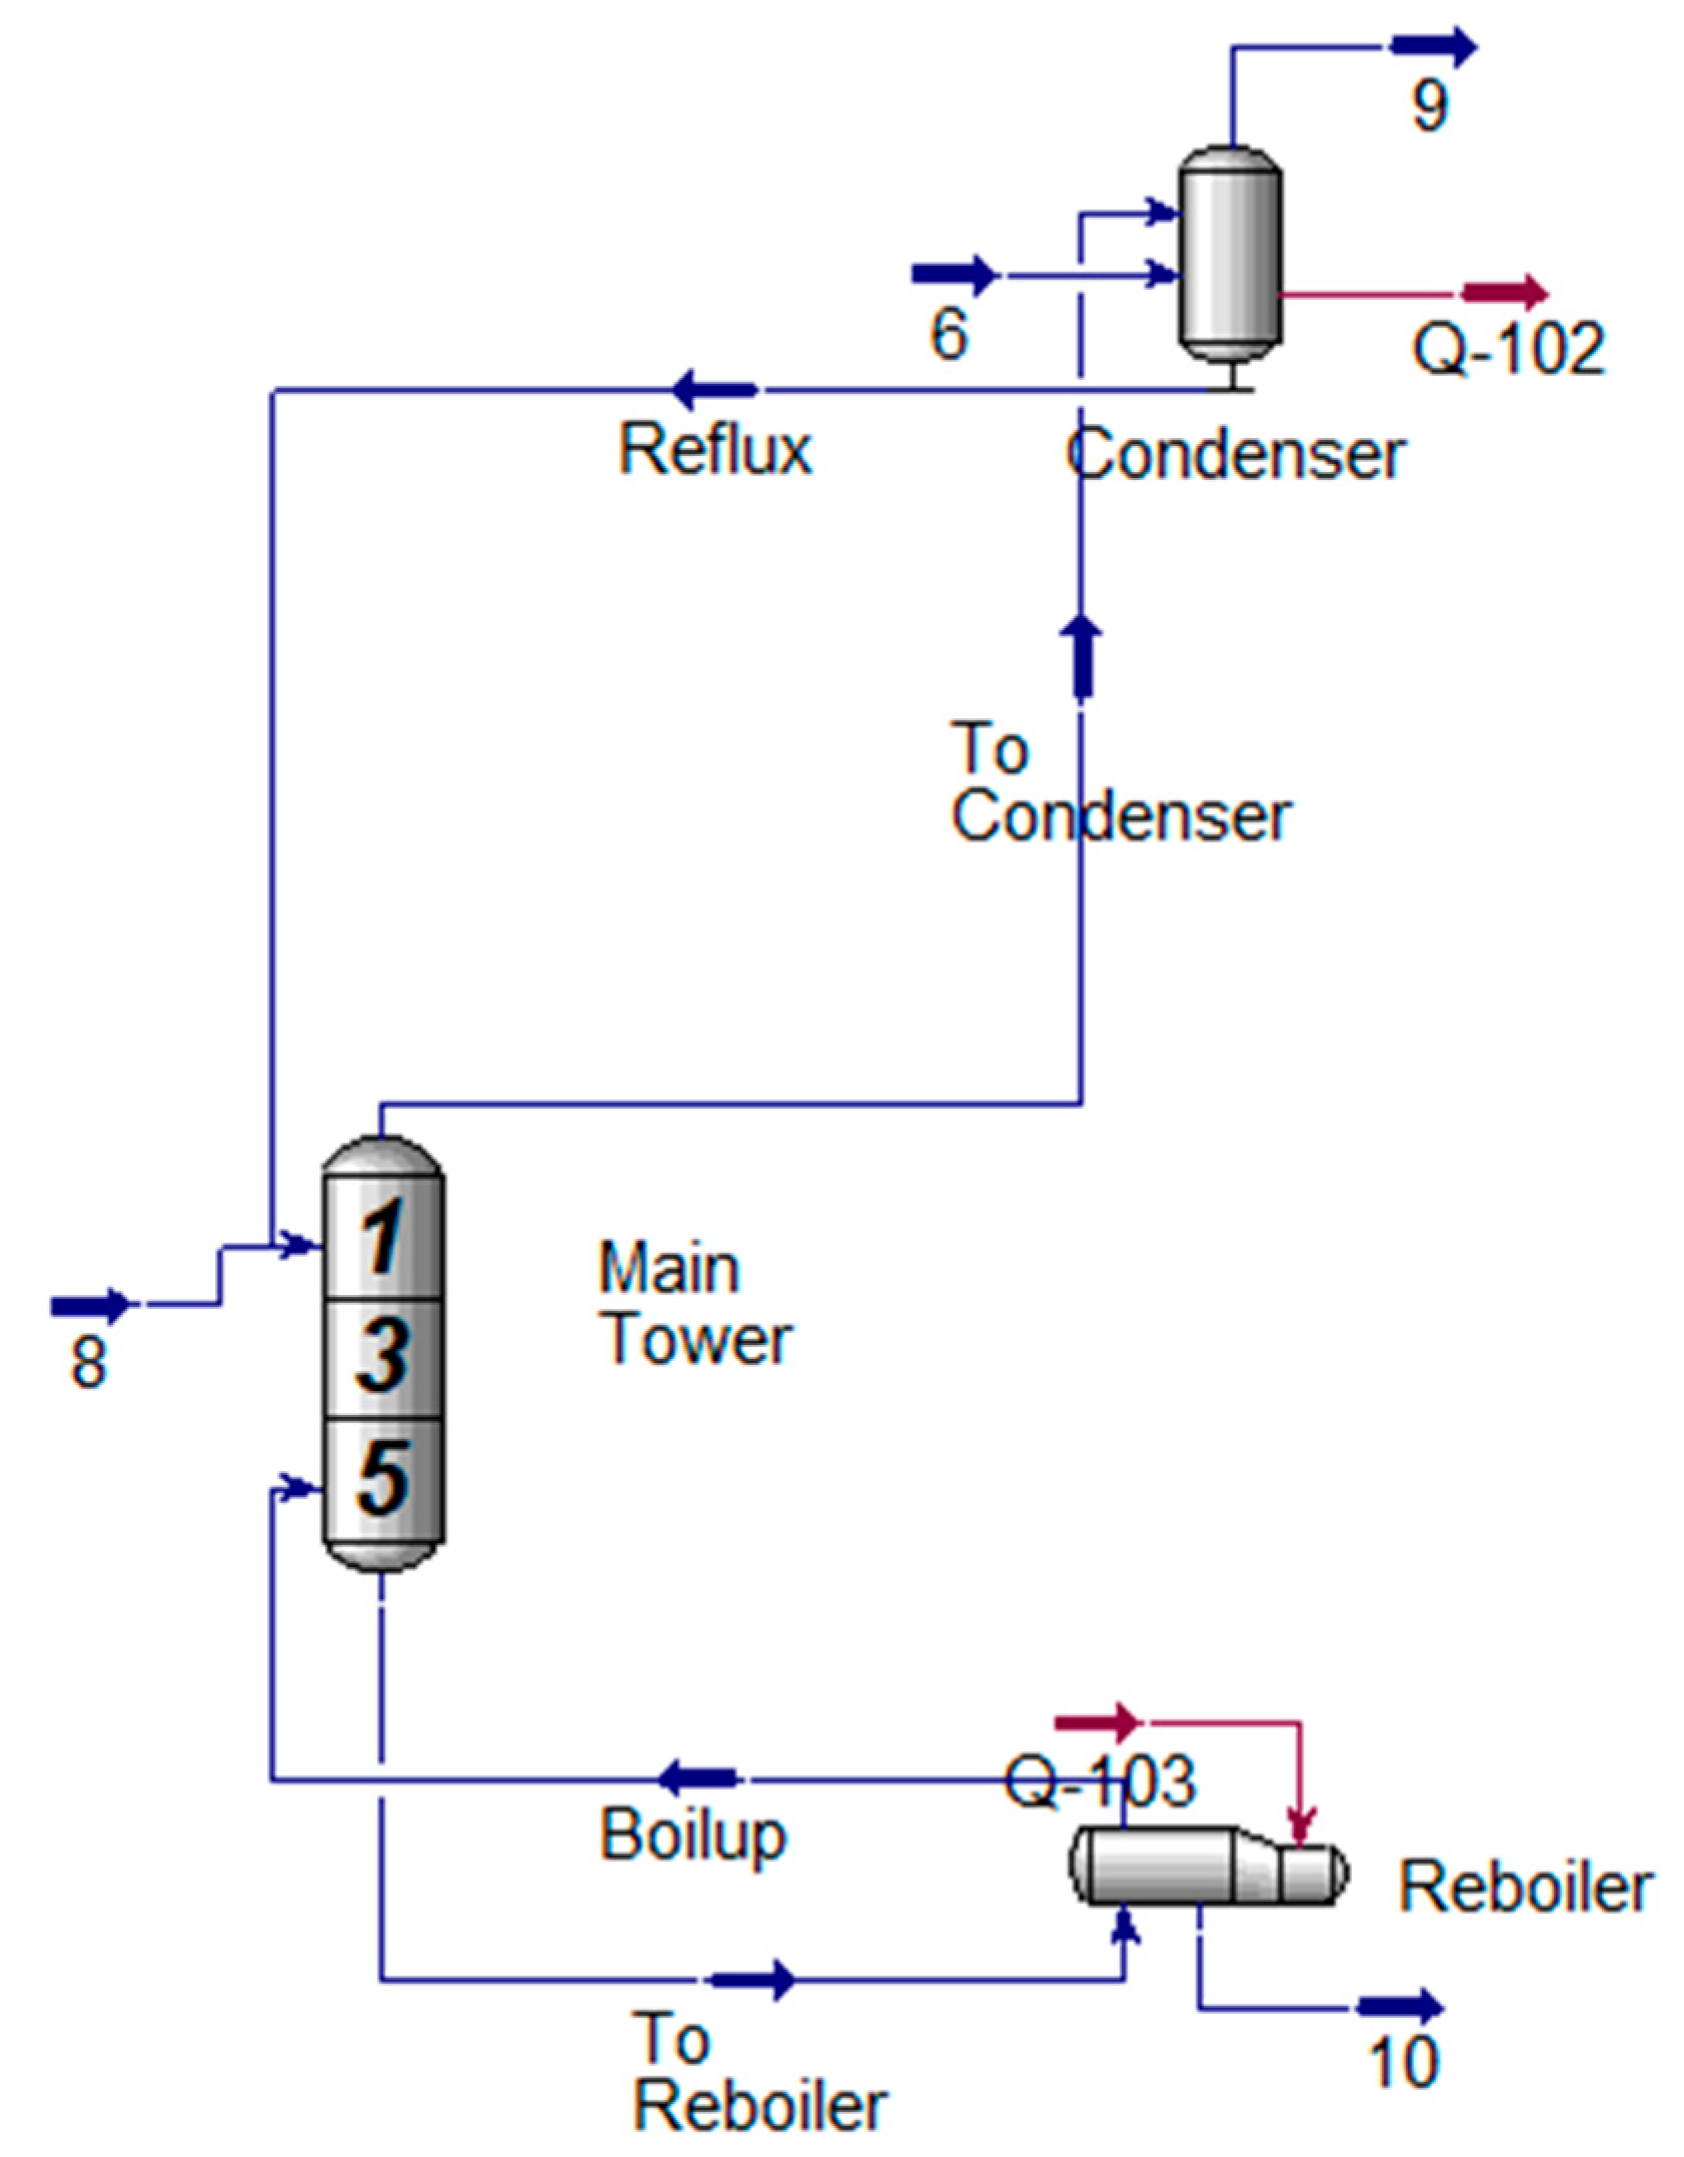
In the described process flow, the liquid stream S3, located at the bottom of the V-100 separator, undergoes a pressure reduction by passing through the throttle valve VLV-100. As a result, stream S8 is obtained from the first tray of the NGL recovery rectification tower, as depicted in
Figure 2.
The frigid liquid stream S6, which is generated through gas expansion, and the gas phase stream present at the top of the tower are directed to the condenser for gas–liquid separation. In this step, the liquid phase serves as the top reflux, while the gas phase functions as the gas product stream S9, located at the top of the tower. It should be noted that the overhead condenser functions solely as an adiabatic flash tank, with zero specified heat burden. Additionally, stream S10 is specified as having a Reid vapor pressure (RVP) of 1379 kPa.
Furthermore, at the base of the NGL recovery tower, the natural gas condensate product, denoted as S10, is obtained through fractional distillation. This process enables the separation of various components within the condensate based on their boiling points, resulting in the desired product composition.
The refrigeration circuit, as depicted in
Figure 3, plays a crucial role in providing the necessary cooling capacity for Cooler E100. In this case, the chosen refrigeration medium is an ethane–propane mixture. The refrigeration circuit comprises three key components: a condenser, an evaporator, and a compressor.
The compressor within the refrigeration circuit functions by compressing and cooling a combination of ethane and propane, resulting in the formation of a high-pressure and cold liquid. This cold liquid subsequently enters the evaporator through an expansion valve. Within the evaporator, heat is absorbed from the input stream S2, causing the partial vaporization of ethane and propane. This process facilitates the absorption of heat, leading to the cooling of the input stream.
To establish a continuous cycle, the vaporized mixture of ethane and propane undergoes compression and cooling once again, restarting the refrigeration process. This cyclic operation ensures the consistent provision of cooling capacity for the Cooler E100 and maintains the efficiency of the refrigeration circuit.
Table 1 illustrates specifications of feed streams, refrigerant and natural gas units. Based on the provided composition of the refrigeration system in the integrated LNG-NGL structure, here is the composition of each component in the different stages (feed gas, Side1, S10, S16).
3. Multi-Objective Optimization Framework
In the multi-objective optimization problem formulated in Equation (1), two objective functions are considered. The first objective function, denoted as
f1(
x), is aimed at maximization, while the second objective function, denoted as
f2(
x), is aimed at minimization. The problem seeks to find the optimal solution x that simultaneously maximizes
f1(
x) and minimizes
f2(
x), taking into account any constraints or limitations imposed by the problem. The formulation of the problem involves finding a trade-off between these two conflicting objectives, as improving one objective may lead to a degradation of the other. The goal is to identify a set of solutions that represents a good compromise or balance between the two objectives, known as the Pareto front or Pareto set.
where
represents the mass flowrate of natural gas condensate (kg/h);
represents the natural gas product price (0.2 USD/kg);
represents the compression power of the compressor i (kW)
represents industrial electricity cost (0.05 USD /kWh)
represents the pressure of stream i (kPa)
represents the pressure of stream i (°C)
This study analyzes the influence of cooler E-100 outlet stream S2 temperature and expander K-100 outlet stream S5 pressure on the shaft power of compressors k-102 and k-103 as well as profit. The objective function represents the net profit for NGL. and represent the values of NGL and cost of power, respectively. Electricity cost () and natural gas condensate price () are 0.05 USD/kWh and 0.2 USD/kg, respectively. These constraints include the operation constraints of temperature and pressure, and cooler E-100 outlet stream S2 temperature and expander K-100 outlet stream S5 pressure are constrained by the lower and upper bounds, x LB and x UB.
In this study, the influence of cooler E-100 outlet stream S2 temperature and expander K-100 outlet stream S5 pressure on the shaft power of compressor K-102 and K-103, as well as on the profit, is analyzed. The objective function, denoted as “Obj”, represents the net profit for NGL. There are two objective functions considered in the analysis:
Objective function f1 represents the value of NGL.
Objective function f2 represents the cost of power.
The net profit for NGL is determined based on the electricity cost (Ce) and the natural gas condensate price (CNGL). The electricity cost is USD 0.05/kWh, and the natural gas condensate price is USD 0.2/kg.
The analysis also includes constraints related to the operation of the system. These constraints involve temperature and pressure considerations. The cooler E-100 outlet stream S2 temperature and expander K-100 outlet stream S5 pressure are subject to lower and upper bounds, denoted as
xLB and
xUB, respectively.
In the proposed formulation, the research focuses on a natural gas condensate recovery project in China, using the feed gas conditions and compositions outlined in
Table 2 and
Table 3. The objective is to develop an ethane recovery process that achieves a high recovery rate of ethane while minimizing energy consumption, considering the specific feed conditions.
Table 4 and
Table 5 provide specific values for the various design specifications of the equipment involved in the natural gas condensate recovery process. Additionally, the decision variables define the lower bound (x
LB) and upper bound (x
UB) values for the E100 outlet temperature and K100 outlet pressure, respectively. These decision variables can be adjusted within the defined ranges during the optimization process to determine the optimal values for the system.
To achieve this, we modified the cooler E-100 outlet stream S2 temperature and the expander K-100 outlet stream S5 pressure. The S2 temperature is influenced by the refrigerant system of ethane and propane, while the S5 pressure determines the amount of power that can be generated and utilized by compressor K-101.
Three improved ethane recovery processes are proposed and investigated:
1. Ethane–propane refrigeration cycle system is utilized for pre-cooling the feed gas.
2. Expansion refrigeration is employed as a cooling source at the top of the NGL recovery tower.
3. The expander (K-100) is integrated with the first-stage compressor (K-101) of the product, with the output power from the expander driving the compressor.
These modifications aim to optimize the ethane recovery process by adjusting the cooler outlet temperature and the expander outlet pressure, taking into account the refrigeration system, power generation, and compressor operation. The objective is to achieve a high recovery rate of ethane while minimizing energy consumption in the overall process.
4. Results and Discussion
Using the case analysis function in Aspen HYSYS software, a detailed analysis of the condensate recovery process in this case can be conducted. In this analysis, the pressure of stream S5 and the temperature of stream S2 are treated as independent variables, meaning they can be adjusted and varied to observe their impact on the process.
The dependent variables in this case analysis are the total cost of power, the value of the NGL product, and overall profit. These variables are influenced by the independent variables, i.e., the pressure of stream S5 and the temperature of stream S2. By manipulating these independent variables within specified ranges, software can calculate and evaluate the corresponding values of the dependent variables for each scenario.
The case analysis function allows us to explore different operating conditions, optimizing the process and identifying the most favorable settings for the pressure of stream S5 and the temperature of stream S2. By analyzing the variations in dependent variables, such as cost, product value, and profit, it becomes possible to make informed decisions and adjustments to improve the overall performance of the condensate recovery process.
Based on the data provided in
Table 6, we present a summary of the cases analyzed for the condensate recovery process, including the S5 pressure, S2 temperature, and the resulting profit. It seems there might be an error in Case25 where the profit is listed as −32,800, which seems unusual.
Based on the case analysis results, it is observed in
Figure 4 that the highest profit is achieved when the pressure of stream S5 is 2500 kPa and the temperature of stream S2 is −61 °C, with a profit of USD 494.7/h.
However, in Case 25, where the pressure of stream S5 is 4000 kPa and the temperature of stream S2 is −65 °C, an unusually low profit of USD −32,800/h was obtained. This result may indicate an anomaly in the data.
The optimizer of Aspen HYSYS software was utilized to optimize the condensate recovery process in this case. The decision variables considered in the optimization process were the same as the independent variables in the previous case analysis, namely the pressure of stream S5 and the temperature of stream S2.
By using the optimizer, the goal was to find the optimal values for these decision variables that maximize the profit of the condensate recovery process. The optimization process takes into account various constraints and objectives defined for the system. By comparing the optimization results with the case analysis, it is observed that when the pressure of stream S5 is 2550 kPa and the temperature of stream S2 is −61.33°C, the highest profit achieved is USD 494.9/h. This profit value is slightly higher than the result obtained from the case analysis.
The optimization method aims to find the optimal solution by considering the interdependencies and interactions between variables, constraints, and objectives. It employs mathematical algorithms and search techniques to iteratively explore the design space and identify the best configuration for the given objectives. Overall, the optimization results provide a refined and more precise solution that maximizes the profit of the condensate recovery process, taking into account the specified decision variables, constraints, and objectives.
Operating Condition after Optimization
Table 7 provides the mole fraction of each component (such as nitrogen, CO
2, methane, ethane, propane, i-butane, n-butane, i-pentane, n-pentane, and n-hexane) in the various streams involved in the natural gas condensate recovery process. The streams include feed gas, S3, S4, S6, S7, S9, S10, S13, and S16.
Table 8 provides the operating conditions of each stream in the natural gas condensate recovery system. The parameters include temperature (T) in degrees Celsius, pressure (P) in kilopascals (kPa), and flowrate in kilomoles per hour (kgmol/h). The streams listed are feed gas, S7, S9, S1, S11, S12, S2, S3, S8, S4, S5, S6, S9, S10, S12, S13, S14, S15, and S16.
5. Conclusions
The study focuses on the recovery of natural gas condensate through the simulation and optimization of a refrigeration process using a mixture of ethane and propane as a refrigerant. The key component of this system is the expander (K-100), which is coupled with the first-stage compressor (K-101) of the product. The output power generated by the expander is harnessed to drive the compressor, creating an energy-efficient process. The objectives of the optimization include maximizing the recovery of ethane and propane, minimizing energy consumption, and achieving desired product quality targets. Through a sensitivity analysis and utilizing Aspen HYSYS software, this study examines the impact of key parameters on process performance, specifically the cooler outlet stream temperature and expander outlet stream pressure. Based on the operating conditions of the case plant with a processing capacity of 2988 kmol/h, it was found that the plant’s profitability is maximized when the cooler’s outlet stream temperature is −61 °C and the expander’s outlet stream pressure is 2500 kPa. Furthermore, after optimization, the refrigeration cycle system can reduce its energy consumption by 1516.4 kW. This optimized process design has the potential to enhance recovery efficiency, decrease energy consumption, and improve profitability in the natural gas industry.
Overall, this comprehensive study on the simulation and optimization of natural gas condensate recovery demonstrates the potential benefits of separating heavy components from natural gas. The findings provide valuable insights for the industry, paving the way for more efficient and economically viable processes in the extraction and transportation of natural gas.

 ,
, 


