1. Introduction
The demand for micro-particles in defined sizes in various industrial applications, including pharmaceuticals and cosmetics, is increasing. For this purpose, efficient particle separation processes are needed. To this end, various particle separation processes have been developed which exploit continuous flow phenomena. A distinction can be made between passive and active fractionation mechanisms: active fractionation mechanisms involve external forces in the fractionation process; whereas, passive fractionation mechanisms do not require external forces and rely solely on the interactions between particles, flow and channel geometry, allowing for a more compact design and simpler operation [
1,
2]. Active microfluidic particle/cell sorting and manipulation methods include acoustophoresis, magnetophoresis, optical sorting and electrical separation techniques such as electrophoresis, electroosmosis and dielectrophoresis [
3,
4,
5]. More recent innovations include self-driven particle-transporting microbots and artificial cilia [
6]. Examples of passive fractionation methods include microfiltration techniques like cross-flow filtration, hydrodynamic filtration, deterministic lateral displacement, pinched flow fractionation, bifurcation and inertial microfluidic separation methods such as serpentine channels, spiral channels, multi-orifice channels and contraction-expansion channels [
4,
5]. The deterministic lateral displacement (DLD) method was introduced by Huang et al. in 2004 and is considered to be faster and have a higher resolution compared to conventional fluidic methods [
7]. DLD is a passive continuous microfluidic process in which laminar flow in a channel is directed around a pattern of regularly spaced periodic post rows. The post rows are laterally shifted by a defined distance (
δ) with each row (
Figure 1a). At a certain particle size, the particle interacts with the post as it passes the streamline flowing directly next to the post. If the particle size exceeds the critical particle diameter (
dc), its center of mass is pushed out of the streamline by the post. This forces the particle to leave the streamline and enter the next one, thus shifting perpendicular to the direction of flow. This event is repeated several times along the length of the channel. As a result, the lateral displacements accumulate, resulting in an overall lateral displacement. Particles larger than
dc are following a path that can be described by the angle
θ = arctan
δ/
Rd in relation to the main flow direction (
Rd = center-to-center distance between each post row), a state called bump or displacement mode. At the end of the channel, the smaller particles can be collected separately from the coarser particles in different outlets; the smaller particles unaffected by the posts follow the so-called zigzag mode [
8].
Generally, the post rows are arranged periodically, such that the row offset
δ is a fraction of the center-to-center distance
Pd between two posts within a post row. After one period
N, that is, after
N post rows, the posts have shifted laterally by one post distance
Pd, resulting in
Pd =
N ×
δ. The number of different flow paths within a period, i.e., the number of streamlines between the posts, is equal to
N. The larger the period, the shallower the angle
θ and the greater the number of and narrower the streamlines between the posts. The critical particle diameter
dc can thus be influenced geometrically since it also decreases with increasing
N [
9].
Other factors besides the row shift influence the separation, e.g., the shape of the posts, the distance from the sidewalls, the Reynolds number, the particle concentration, shape and deformability [
10]. The influence of increased flow rates and particle concentration is of particular interest for industrial applications, despite the fact that DLD was developed on the basis of creeping flows and relatively dilute suspensions [
11,
12].
There have been quite a few studies on increased flow rates in DLD microsystems [
8,
11,
13,
14,
15,
16,
17,
18,
19,
20]. The Reynolds number (
Re), as a measure of flow resemblance, is a function of the flow rate and can be defined for the DLD as follows:
where the characteristic length is represented by the length of the lateral gap between the posts (
G) and the characteristic velocity is the average fluid velocity in this gap (
UG) [
19].
Increasing the Reynolds number to 15–20 and above leads to a stall in the flow wake of the posts and to the formation of static vortices [
17]. In addition, the velocity profile between the posts changes its shape, thereby leading to a reduction in the critical particle diameter
dc [
8]. Based on numerous simulations, Aghilinejad et al. [
14] developed an equation that determines the critical particle diameter as a function of the row offset, gap size and Reynolds number [
14].
Few studies have addressed the effects of fractionation of highly concentrated particle suspensions in DLD microsystems [
12,
15,
21,
22,
23]. Vernekar and Krüger [
12] performed 3D simulations of DLD fractionation of red blood cells at different hematocrits (8.0, 16.1, 32.2, 40.2, and 45.6%). The elastic red blood cell (RBC) membrane was modeled using the finite element method (FEM) and coupled to the Lattice-Boltzmann method (LBM) using the immersed boundary method (IBM). The researchers found that increasing the concentration lowers the lateral deflection of erythrocytes in the system, thus reducing the displacement mode (for volume fractions of 10–20%). The zigzag mode, in contrast, is less affected by concentration. This behavior is explained by the non-deterministic nature of particle–particle collisions which cause disturbances of the theoretically deterministic particle trajectories. In the zigzag mode, these disturbances are more equally distributed in both directions perpendicular to the main flow direction, while in the displacement mode the disturbances are only opposite to the deflection direction. When aggregating the individual error events, the zigzag mode tends to cancel out the errors, while the displacement mode collapses completely. The overall result is a greater lateral dispersion of the trajectory and thus reduced efficiency and predictability of fractionation [
12].
Similarly, Holm et al. [
23] investigated the fractionation of different concentrations of RBCs (hematocrits up to 45%). They performed experiments and 2D simulations using the dissipative particle dynamics (DPD) method. The behavior of a defined polystyrene particle stream was analyzed under the influence of erythrocytes of different hematocrit concentrations introduced simultaneously on the entire cross-section. They found that with increased hematocrits, the lateral displacement of the particles decreased and the width of the distribution of the particles across the outlets increased. The influence of the different volume fractions on the particle trajectories was strongest for particles close to
dc. The authors describe this phenomenon in a mixed-mode context due to asymmetric flow or anisotropic permeability, although manufacturing inaccuracies and particle size variations may also have an influence. Particles slightly smaller than
dc behaved contrary to the general trend, showing an increase in the bump mode with increasing hematocrits. The authors describe three mechanisms that occur at higher solid particle concentrations. First, with increasing hematocrits, the distribution of the particles becomes more homogeneous due to local gradients which lead to frequent particle collisions. Second, the particles layer up on the post surfaces as a result of the shear-induced pressure. The particles in the displacement mode collide with this particle layer and are thus repelled. Third, the particles often collide with the erythrocytes and are thus guided along similar paths [
23].
Lubbersen et al. [
15] performed experiments with a design scaled up by a factor of 70 compared to conventional DLD microsystems to investigate the efficiency of fractionation of polystyrene particles at moderate Reynolds numbers (6 <
Re < 34), and input volume fractions up to 10%. They found that volume fractions in the outlets up to 9% did not result in blocking. The particles spread over several outlets, resulting in reduced separation efficiency. Input concentrations of about 5% resulted in efficient fractionation at a higher Reynolds number with a volume concentration of 12% at both upper outlets. In addition, input concentrations of 10% resulted in significantly reduced separation efficiencies [
15].
In another study, Lubbersen et al. [
21] performed CFD simulations and experiments with so-called sparse DLD arrays in which the post geometry is reduced to a single row or a few rows of posts, tilted with respect to the flow direction. Their tests involved varying the Reynolds number (4 ≤
Re ≤ 56) and the post shape, as well as the volume concentration (up to 14%). The authors found the system design to be well-suited for higher particle concentrations due to reduced clogging and flow resistance. However, a disadvantage of the design is non-uniform pressure distribution at the outlets due to a lack of symmetry, which makes it difficult to determine
dc. In addition, the particles become more concentrated along the few rows of posts, meaning that at volume fractions above 0.1% a single row of posts is insufficient for efficient separation because the particles are pushed out of the critical streamline into the gaps between the posts due to particle–particle interactions [
21].
Ström et al. [
24] studied length-based fractionation of deoxyribonucleic acid (DNA) in DLD arrays at increased flow rates and DNA concentrations. At low shear rates, DNA appears in a blob-like shape; therefore, the hydrodynamic separation size is a measure of length. When the shear rate increases, the DNA is stretched to varying degrees and hydrodynamic fragmentation may occur. Therefore, DNA fractionation by DLD is limited to comparatively low flow rates. High DNA concentrations may lead to viscoelastic effects and the entanglement of DNA molecules characterized by an enlarged effective size due to increased molecule-molecule interactions, which can offer improvements but may also increase the uncertainty in the separation [
24].
In general, the interaction between the particles and the fluid, in addition to the interactions between the particles, must also be considered. With increasing particle concentration, the disturbance of the flow field increases, as well as the width of the streamlines and the critical particle sizes. Even a single disturbance further affects the critical particle size of several rows of posts; this also applies to clogging caused by particles that are too large or adhesion of the particles to the post surface. In addition to influencing the separation size and separation efficiency, clogging can lead to increased resistance or even complete system failure. The problem of adhesion can be mitigated by surface coating. Nevertheless, rigid particles are of particular concern compared to, for example, blood particles, which can deform in the flow and thus move through the system even in undiluted concentrations. In contrast, the maximum concentration of rigid particles may be limited to less than 1% of volume due to the risk of clogging, especially if the particles are large relative to the gaps. To minimize these issues, the hard particle concentration is typically maintained as low as possible and the post gap to particle size ratio is maximized [
25].
When increasing the volumetric and material throughput in a DLD array, challenges arise in the characterization of the separation efficiency in the experiments. The data require time-consuming evaluation; in addition, there is high potential for evaluation error. Automated, intelligent counting mechanisms, as presented by Gioe et al., could be employed to facilitate the evaluation [
26]. However, fractionation of multi-disperse particles of varying sizes additionally requires precise particle size measurement of the mixture. In addition, the measurement technique should allow different particle concentrations and, as an online process, also varying flow rates.
The characterization of fractionation from numerical calculations can be automated easily. However, to obtain realistic results, several factors must be considered. Models for determining the critical particle diameter typically underestimate the separation sizes determined experimentally because they are based on single-phase flow, which does not consider particle–fluid interactions. Hydrodynamic short-range interactions (lubrication forces) between particles and posts were found to have a strong influence on the separation size. Rapid saturation of hydrodynamic short-range forces due to the increased surface roughness leads to a decreased critical particle diameter compared to low surface roughness, for which short-range forces become stronger. This also explains the variance between observed separation sizes in experiments [
27]. Because the influence of particles on the fluid increases with increasing particle concentration, and particle–particle interactions also have a strong influence, mothese effects cannot be neglected in simulations. Therefore, to adequately simulate dense particle flows in a DLD system, it is necessary to use friction and lubrication models to characterize the solid–solid interaction and to calculate fluid–solid interaction in both directions [
22].
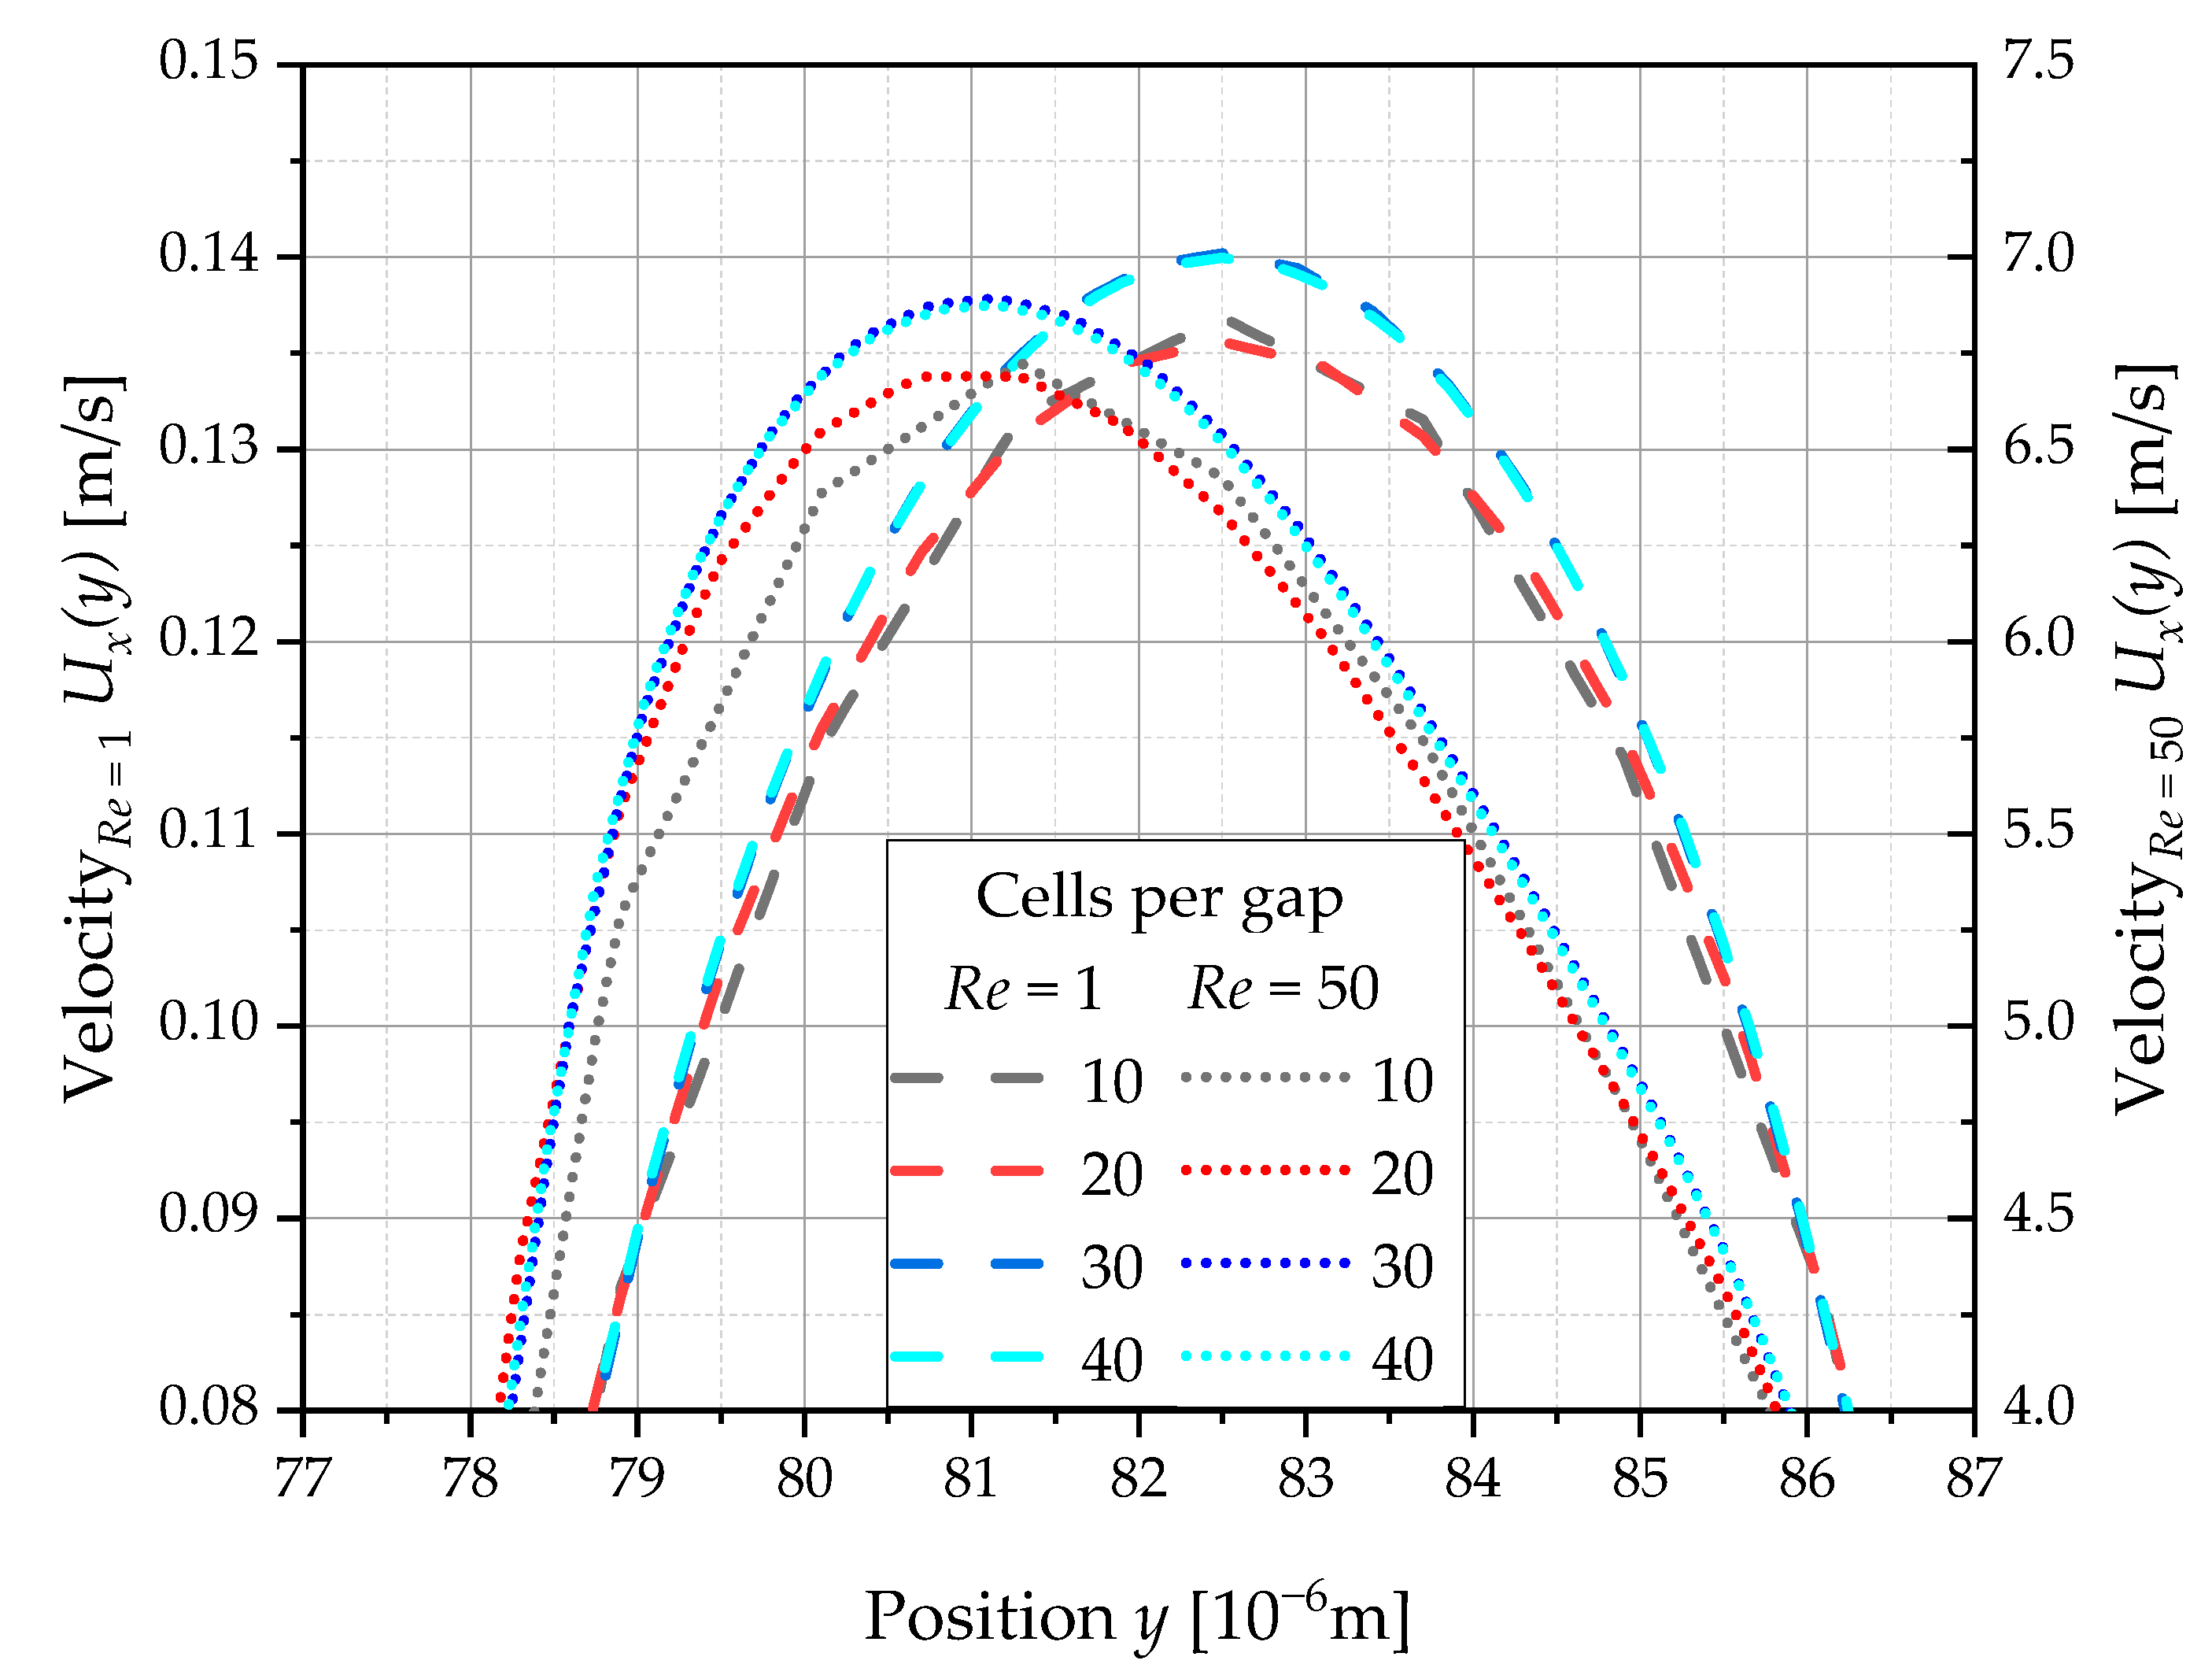
In general, there is a lack of research addressing the behavior of rigid particles at elevated particle concentrations and throughputs in conventional DLD microsystems. Therefore, we extended previous research by performing coupled computational fluid dynamics/discrete element method (CFD-DEM) simulations of particles in DLD microsystems at increased particle concentrations and varying Reynolds numbers (corresponding to variations in the flow rate). This was accomplished by coupling CFD and DEM using IBM. A two-way process with six degrees of freedom (6-DOF) and lubrication correction was used to model solid–solid and solid–fluid interactions. For this purpose, a mixture of different particle sizes was generated in the microsystem and the effects of particle size, Reynolds number and volume fraction on the particle trajectories of the individual particles were evaluated. Regarding the potential industrial applications, the results should provide limitations and insights into the dependence of the separation efficiency on the particle concentration and Reynolds number.
3. Results and Discussion
In this section, the behavior of the particles as a function of size, Reynolds number and volume fraction in the DLD microsystem are presented and discussed. The bar charts in
Figure 5 show, for different Reynolds numbers and volume fractions, which part of the inserted particles per particle size has traveled according to the five different transport modes. For comparison,
Figure 6 shows the transport modes in single particle simulations. In addition, in comparison with previous studies, the higher estimated
dc values of this study compared to Aghilinejad et al. [
14] are likely related to the multidirectional CFD-DEM coupling and lubrication correction in our simulations, as previously discussed in detail in [
8].
Partition curves were also generated from the simulation results (
Figure 7). These show the proportion of particles from the feed material for each particle diameter moving in displacement mode as a function of the Reynolds number and volume fraction. Furthermore, the displacement indices
Id for ascending Reynolds numbers are presented in
Figure 8. The
Id plots show the mean displacement of the particles (including the standard deviation) compared to the ideal displacement over the particle size for varying particle concentrations.
Based on the results, several observations can be made. Only one particle was observed to be deflected by more than angle
θ, which means that the number of hyper-displaced particles can be neglected. This is consistent with the observations of Vernekar and Krüger, who reported that disruptions in the displacement mode resulted exclusively in cells dropped to a lower lane, but never jumped up an entire lane [
12].
The results were evaluated to determine why the disruptions are predominantly aligned against the direction of deflection. It must be considered that all particles would follow the flow, corresponding to a deflection of 0°, but the bump mode itself results from a disturbance that inhibits this behavior. The particles interact with other particles that either experience the same disturbance simultaneously or are moving freely along with the flow. Thus, the direction of motion of the other particles that collide with or carry the particle has a smaller deflection angle than θ on average. Furthermore, it should be considered that a particle moves in the gap directly lateral to the post during the bump movement. Depending on the particle concentration, it is pushed by the post on one side and by the other particles on the other side. An increased number of particles could therefore result in the bump mode being prevented by a counterforce exerted by the other particles.
It should be noted that the distributions at
Re = 1 must be considered separately from the higher Reynolds numbers because the size range of the simulated particle suspension is below the critical diameter for
Re = 1 (see single particle simulations in
Figure 6). Larger particles were not used because they would have incorporated too much space and it would have been too computationally intensive to generate a sufficiently large sample of all particle sizes. As suspected, when the volume fraction varies, there is no shift in the critical particle diameter to lower values. This is illustrated in
Figure 8a, as the average displacement index remains in the range near
Id = 0 for all particle sizes and volume fractions. In addition, the partition curves remain at 0 for
Re = 1 for all particle sizes (
Figure 7); accordingly, no separation occurs within this particle size range. As shown in
Figure 5, for
Re = 1 the main part of the particles between
d = 2–5 µm moves in the non-displaced mode, while the other particles move mainly in the negatively displaced mode or in the mixed mode. These latter two modes occurring alongside the expected zigzag mode is feasible, as they are the closest to this main transport mode. As previously described, disturbances of the zigzag mode occur in both directions [
12]. The ratio of these three modes distributes more evenly across the different particle sizes at high particle concentrations. It can be considered that individual disturbances are dampened to a larger extent by the presence of a higher particle concentration and the individual particles are swept along with the particle flow.
3.1. Effects of Increased Particle Concentration
First, we compare the critical particle diameters (
dc) determined in single particle simulations with the results from the simulations of polydisperse particle mixtures. It can be observed in
Figure 7 that the results coincide well at
Re = 1, 30 and 50, since no particle operates in the displacement mode below the determined
dc. The results at
Re = 10, however, do not follow this trend, because particles with diameters of 3.5 µm are already in displacement mode—although the determined critical particle diameter is
dc = 4.6 µm. However, it must be noted in this context that the single particle simulations all use the same starting particle position. Wall effects may occur which do not apply in simulations with higher particle concentrations due to the different starting positions of the particles. Comparisons of the single particle simulations to the simulations with multiple particles, therefore, have limitations. The non-uniform behavior when the Reynolds number is increased is further discussed in
Section 3.2.
Independent of the Reynolds number, two effects are generally observed as the particle concentration is increased. First, a shift occurs that reduces the fraction of displaced particles. As can be seen in
Figure 5, at a volume fraction of
φi = 0.7%, particles of 3.5 µm and larger are displaced at the Reynolds numbers between 10 and 50, meaning 95–100% of the
d = 5 µm particles are displaced. As the volume fraction increases, the displaced fraction decreases significantly. At the maximum volume concentration of
φi = 10.8%, the displaced particles at
d = 5 µm reduce to around 60–70% at
Re = 10, 50 and to approximately 40% at
Re = 30. Meanwhile, the other transport modes increasingly affect larger particles. The maximum of the particle fraction moving in mixed mode shifts to larger particle sizes as the volume fraction increases. The non-displaced particles have a maximum diameter of 3.5 µm (
Re = 10) and 4.0 µm (
Re = 30, 50) at a volume fraction of
φi = 0.7%. At
φi = 10.8%, particles with diameters up to 5 µm exist among the non-displaced particles. Likewise, the proportion of negatively displaced particles expands to larger particle diameters.
The second observed effect is that the different transport modes extend to larger particle sizes. This means that the expansion of transport modes to larger particle sizes is not accompanied by the reduction in its ratio at smaller particle sizes. This coincides with the more even distribution of transport modes across all particle sizes previously described for
Re = 1, which results from an increase in particle concentration. The displacement index (
Id) curves show a flattening behavior for increasing particle concentration (
Figure 8b–d). This behavior demonstrates that the critical diameter shifts to higher values and there is an overall higher variability in the particle trajectories. In addition, the curves illustrate that the real critical diameter is not a single value but extends over a size range with the position and width depending on various factors, including location in the microsystem, the Reynolds number and presence of other particles. The partition curves in
Figure 7 further demonstrates this behavior. While at the lowest volume fraction, the transition from the partition coefficient
T(
d) = 0 to
T(
d) = 1 occurs over a range of ~1 µm, the range grows with increasing volume fraction, so that full separation is no longer achieved in the tested particle size range.
These observations are consistent with those of previous works related to higher particle concentrations in DLD. Both Vernekar and Krüger [
12] and Holm et al. [
23] describe a reduction in the displacement mode. They also report, similar to Lubbersen et al. [
15], an increased lateral dispersion of the particle paths and thus a reduced separation efficiency. One reason given for the reduction in the displacement mode is the random collisions of the particles with each other, which lead to disturbances of the deterministic particle paths. These disturbances tend to offset each other in the zigzag mode, in contrast to the displacement mode [
12]. Also, changing the predefined transport path is explained as a result of the influence of the particles on other particles [
23]. Local gradients also cause the particles to collide with each other more often and consequently distribute more uniformly in space and over the outlets [
23].
The increasing number of collisions influences the occurrence of disruptions and the dispersion of the particles. Guiding by other particles is, as discussed previously, a possible reason for the fewer particles following the displacement mode. It should be noted that the particles moving in displacement mode most often follow the fluid like all other particles; they only deviate from this behavior when they contact the post. Therefore, most of the particles generally move along with the fluid flow, while the bump movement is a much rarer event. Thus, guidance of the particles occurs on average in the direction of flow rather than in the direction of deflection. In addition, during the bump motion, the particle is located in the gap and in contact with the post that deflects it. It can be considered that, in this constellation, the other particles located on the other side of the particle prevent it from bumping rather than assisting it in doing so. In addition to the particle–particle interactions, the influence of the particles on the flow likely also has an impact. The more particles present in the flow in the gaps, the more the streamlines are influenced, and consequently the larger the deviation of the critical particle diameters. This leads to spatial and time-dependent fluctuations in the separation sizes which might also enhance the lateral dispersions of the particle trajectories.
3.2. Effects of Increased Volumetric Flow Rate
The changes in particle transport modes demonstrate the varying particle concentrations non-uniform behavior when the Reynolds number (as a result of an increase in the volumetric flow rate) is increased; as the Reynolds number increases from
Re = 10 to 30, both the fractions of negatively displaced particles and non-displaced particles increase in total, thereby expanding to larger particle sizes (
Figure 5). However, as the Reynolds number further increases from
Re = 30 to 50, the proportions and distributions remain similar with a slight shift back to smaller particle sizes. The total portion of particles moving in the mixed mode tends to decrease as the Reynolds number increases. It should be noted that when the Reynolds number increases from
Re = 10 to 30, the maxima of the mixed-mode distributions shift significantly to larger particle sizes, but when increased further to
Re = 50, the maxima (with the exception of
φi = 10.8%) shift back to the same position as at
Re = 10. The proportion of particles moving in the displacement mode (
d ≥ 3.5 µm) decreases significantly with an increase from
Re = 10 to 30. For a further increase to
Re = 50, the proportion increases again and even exceeds the values at
Re = 10 for volume fractions up to
φi = 3.6%. For volume fractions of
φi ≥ 7.2%, however, the separation efficiency at
Re = 50 slightly decreases again with respect to
Re = 10. This behavior can be more clearly observed in the partition curves (
Figure 7). The smaller two volume fractions of
φi = 0.7% and
φi = 3.6% have a slightly steeper slope at
Re = 50 than at
Re = 10. However, the result is the opposite for the two larger volume fractions, such that the slopes of the curves become slightly steeper at
Re = 10.
From these results, it can be concluded that fractionation is improved significantly by increasing the Reynolds number (up to Re = 50) and thus the volumetric flow rate. The separation efficiency increases for volume fractions up to 3.6% when the Reynolds number is maximized. Further increasing the volume fraction slightly decreases the separation efficiency compared to Re = 10. However, for volume fractions of 7.2% and above, a clear degradation of the separation efficiency can be observed everywhere, indicating that smaller volume fractions should be used if possible.
The described non-uniform transition from
Re = 10 via
Re = 30 to
Re = 50 is surprising.
Re = 10 performs significantly better compared to the single particle simulations, such that a decreased separation efficiency at
Re = 30 can be observed. A conclusive explanation for this would likely only be provided by further simulations at intermediate Reynolds numbers such as
Re = 20 and
Re = 40. The causes of the uneven course can therefore only be speculated. As the Reynolds number increases, various effects combine to influence the movement of the particles. Previous research has shown that static vortices form behind the posts above
Re = 10 and grow with increasing Reynolds number [
8]. Depending on their size, these vortices change the shape and course of the streamlines, which could affect the separation [
8]. In addition, the shear flow in the vortex could cause the particles to rotate, resulting in a lift force acting on the particles [
37]. Other inertial effects can also create an effect. The tendency of a particle to follow the flow is described by the Stokes number (
Stk). At
Stk << 1 the particles follow the streamlines of the fluid, whereas at
Stk >> 1 they are dominated by inertial effects and follow their original trajectory [
38]. The Stokes number is a function of the particle Reynolds number
Rep according to the equation,
[
39]. Considering the maximum flow velocities, the Stokes number is at 0.033 ≤
Stk ≤ 4.167, reaching
Stk = 1 and above starting from
Re = 30. Thus, with increasing Reynolds number and particle size, the particle may not follow the flow curve around the post and vortex. It was found that more space occupied by the vortex between successive posts results in a sharper curve of the streamlines, which could serve as a ramp for particles at
Stk > 1 [
8]. Furthermore, the change in the velocity profile in the gap when the Reynolds number increases is noteworthy and has an effect on
dc [
13]. In addition to these effects, all of which promote particle displacement in the DLD, momentum in particle–particle interactions also increases with increasing volumetric flow rate and, as a result, presumably also the number of collisions. As previously discussed, particle–particle collisions reduce particle deflection rather than enhance it. Therefore, as the Reynolds number increases, all these effects may compete with each other, and at
Re = 30, the effect of particle–particle interactions dominates, resulting in a significant shift of the
dc to larger particle sizes. A further increase in the Reynolds number to
Re = 50 may cause the effects that promote displacement to be dominant; this may explain the non-uniformity of the separation behavior as the Reynolds number increases.
This result may also align with the observation that at Re = 50 and low particle concentrations, a sharper separation of particles is achieved than at all other Reynolds numbers tested. However, this changes when the volume fraction increases; consequently, at the highest particle concentration, the separation performance is worse compared to Re = 10. The numerous and intense collisions of the particles may outweigh the benefit of separation at Re = 50. More insight could be gained by evaluating the particle–particle contact counts as well as their contact momentum or contact energies at different Reynolds numbers and volume fractions.
Nevertheless, even at maximum volume fraction at
Re = 50, the overall mixed-mode fraction remains slightly smaller than at
Re = 10. There is a tendency for the mixed mode to decrease and the negatively displaced mode to increase for small particles as the Reynolds number increases. The increased negative deflection at increased Reynolds numbers can be explained by the higher variability of the critical diameters as the Reynolds number increases, since the wall effect becomes stronger. Furthermore, as the shear rates increase, the shear-induced diffusion is enhanced, pushing the particles away from areas of higher concentration. Collisions between larger and smaller particles transfer momentum, resulting in faster movement of the smaller particles. Due to lateral displacement, the larger particles tend to collect on one side of the system, which might push the smaller particles towards the opposite direction. In addition, a pressure drop in the DLD was observed due to the side walls against the direction of deflection of the particles [
8]. The negative pressure acting against the direction of deflection may affect small particles such that their real periodicity is shortened. The observation of increasing pressure drop across the flow direction as the flow rate increases is consistent with the increasing number of negatively deflected particles [
8].
3.3. General Remarks
Other factors may become critical at higher particle concentrations, such as the attachment of particles to post surfaces, which can lead to clogging and thus affect the pressure distribution and particle trajectories in the microsystem or lead to its complete failure. The roughness and irregularities of the posts must be considered. Furthermore, the inlet area design must be optimized, since particularly high particle concentrations occur in this area, which can rapidly lead to clogging of the microsystems. All these factors can further limit the maximum particle concentration.
For example, cohesion can be included in the simulations as well as specifically simulating flow in inlets and outlets to identify dead zones. Furthermore, it should be noted that wall effects are significant in our simulations, since the number of posts in a row is relatively small. The results may not be directly transferable to microsystems with a significantly larger number of posts per row. To be independent of wall effects, either a significantly larger number of posts should be included in the simulation or periodic boundary conditions should be used that consider the pressure drop perpendicular to the main flow direction.
It should also be noted that although the grid resolution should be sufficient for resolving the post structure according to grid studies, this may not be true for the IBM. The smaller particles specifically were only coarsely resolved due to the limited grid fineness, which may result in inaccuracies in the hydrodynamic interaction between the fluid and particles. This was considered to be acceptable due to the already high computational demand.
The digital twin of the DLD microsystem should be experimentally validated in the future. This requires procedural investigations on the fractionation of suspensions with polydisperse particles, for which the volume flow and particle concentration are both varied. To this end, a suitable particle size measurement technique is crucial.

 ,
, 


