Article

Improving Biomethanol Synthesis via the Addition of Extra Hydrogen to Biohydrogen Using a Reverse Water–Gas Shift Reaction Compared with Direct Methanol Synthesis

by
Kuntima Krekkeitsakul
1,
Rujira Jitrwung
2,
Weerawat Patthaveekongka
3 and
Teerasak Hudakorn
1,*
1
Department of Mechanical Engineering, Faculty of Engineering and Industrial Technology, Silpakorn University, Nakorn Pathom 73000, Thailand
2
Expert Center of Innovative Clean Energy and Environment, Research and Development Group for Sustainable Development, Thailand Institute of Scientific and Technological Research (TISTR), Khlong Luang, Pathum Thani 12120, Thailand
3
Department of Chemical Engineering, Faculty of Engineering and Industrial Technology, Silpakorn University, Nakorn Pathom 73000, Thailand
*
Author to whom correspondence should be addressed.
Processes 2023, 11(8), 2425; https://doi.org/10.3390/pr11082425
Submission received: 12 June 2023 / Revised: 8 August 2023 / Accepted: 9 August 2023 / Published: 11 August 2023
(This article belongs to the Topic Chemical and Biochemical Processes for Energy Sources)

Abstract

:
Conventionally, methanol is derived from a petroleum base and natural gas, but biomethanol is obtained from biobased sources, which can provide a good alternative for commercial methanol synthesis. The fermentation of molasses to produce biomethanol via the production of biohydrogen (H2 and CO2) was studied. Molasses concentrations of 20, 30, or 40 g/L with the addition of 0, 0.01, or 0.1 g/L of trace elements (TEs) (NiCl2 and FeSO4·7H2O) were investigated, and the proper conditions were a 30 g/L molasses solution combined with 0.01 g/L of TEs. H2/CO2 ratios of 50/50% (v/v), 60/40% (v/v), and 70/30% (v/v) with a constant feed rate of 60 g/h for CO2 conversion via methanol synthesis (MS) and the reverse water–gas shift (RWGS) reaction were studied. MS at temperatures of 170, 200, and 230 °C with a Cu/ZnO/Al2O3 catalyst and pressure of 40 barg was studied. Increasing the H2/CO2 ratio increased the maximum methanol product rate, and the maximum H2/CO2 ratio of 70/30% (v/v) resulted in methanol production rates of 13.15, 17.81, and 14.15 g/h, respectively. The optimum temperature and methanol purity were 200 °C and 62.9% (wt). The RWGS was studied at temperatures ranging from 150 to 550 °C at atm pressure with the same catalyst and feed. Increasing the temperature supported CO generation, which remained unchanged at 21 to 23% at 500 to 550 °C. For direct methanol synthesis (DMS), there was an initial methanol synthesis (MS) reaction followed by a second methanol synthesis (MS) reaction, and for indirect methanol synthesis (IMS), there was a reverse water–gas shift (RWGS) reaction followed by methanol synthesis (MS). For pathway 1, DMS (1st MS + 2nd MS), and pathway 2, IMS (1st RWGS + 2nd MS), the same optimal H2/CO2 ratio at 60/40% (v/v) or 1.49/1 (mole ratio) was determined, and methanol production rates of 1.04 (0.033) and 1.0111 (0.032) g/min (mol/min), methanol purities of 75.91% (wt) and 97.98% (wt), and CO2 consumptions of 27.32% and 57.25%, respectively, were achieved.

1. Introduction

Biofuels have begun to replace fossil fuels due to their potential to reduce greenhouse gas emissions by replacing fossil fuels. Biofuels thereby have the potential to both decrease CO2 emissions and increase energy security [1]. The first example is biodiesel (derived from the transesterification/esterification of vegetable oil), which is mixed with diesel fuel. The second example is biogas (derived from the decomposition of organic/agricultural waste), which generates methane (CH4), which has been used as a replacement for natural gas in the generation of heat and electricity and in vehicles. Bioethanol (produced via the fermentation of sugar and starch feedstocks) has been used for over three decades because it can be blended with gasoline. It is more prevalent than biomethanol due to the compatibility of bioethanol/gasoline blends with current internal combustion engines. However, biomethanol is methanol which is obtained from bio-sources such as biogas and biohydrogen, and it can also be produced from CO2. Therefore, it may be more desirable in the future and replace bioethanol due to the CO2 utilization potential [2]; higher specific energy yield, which can be explained by the fact that oxygenated fuels have a better combustion efficiency and more enrichment of oxygen than ethanol, owing to methanol [3]; and high volumetric energy density [4]. Accordingly, biomethanol is easy to store and transport and can be readily used as a raw material for synthesizing a variety of useful organic compounds of industrial importance. Methanol is a valued chemical, and it can be used in various sectors as a solvent and in biodiesel, biofuels, and additives [5]. Regarding its direct usage, methanol is used as a solvent and raw material by reacting it with vegetable oil to produce biodiesel. Regarding its indirect usage, methanol is transformed into other chemicals such as formaldehyde, methyl tertiary butyl ether (MTBE)/TAME (a blending component of gasoline), dimethyl ether (DME), MTO (methanol–olefin), and MTP (methanol–paraffin). Biogas and biohydrogen derived from molasses play important roles as raw gases for biomethanol production. Biogas normally contains methane (CH4), carbon dioxide (CO2), and varied amounts of hydrogen sulfide (H2S) depending on the variety of raw materials. Therefore, when using biogas as a raw material for biomethanol, it is necessary to remove H2S via a H2S separation process [6], whereas biohydrogen comprises only hydrogen (H2) and CO2. For this reason, when using biohydrogen as a raw material for biomethanol production, a H2S separation unit is not needed (saving costs), and the method is attractive due to not only reducing the CO2 problem by using biohydrogen but also increasing the use of molasses to produce biohydrogen. Furthermore, this will provide another option for the sugar industry to extract value from the by-product of molasses by making biohydrogen, representing an alternative source of raw materials for biomethanol production. The idustrial-scale production of methanol via thermo-chemical processes has been achieved using petroleum sources, but there is awareness that this releases CO2 into the environment. On the other hand, the implementation of the biological conversion process at the laboratory scale is still being investigated and lacks sufficient information. The biochemical production of methanol requires the microbes and metabolic pathways and enzymes that are involved to be studied to properly understand the bioconversion process and determine the essential parameters for scaling up the laboratory process to full-size production units. Integrating these biological and thermo-chemical processes could provide an opportunity to make the production of biomethanol feasible.
Agricultural/organic wastes, such as manure, feed, fruit, cassava, bagasse, and molasses, are abundant resources that can be turned into biofuels. Molasses is a plentiful resource obtained from sugar production and is used to produce fermented ethanol, which has been promoted for blending with gasoline [7]. Electric vehicles are becoming a substitute for vehicles that require the use of fossil fuels for power, especially gasoline vehicles, which normally use ethanol-blended gasoline. As a result, increased electric vehicle usage will lead to a reduction in ethanol production. Ethanol production will be disrupted and decreased due to decreasing demand, which means that the demand for molasses as a raw material will be reduced, affecting the income of sugarcane farmers. To compensate for this situation, transforming molasses into hydrogen via the fermentation process is desirable as it only generates H2, i.e., biohydrogen, and CO2 [8,9]. Hydrogen can be used in hydrogen fuel cells, for the hydrogen treatment of biodiesel/vegetable oil to produce bio-oleochemicals, and to transform carbon dioxide into an important precursor to petrochemicals, such as methane or methanol [10,11].
Conventionally, methanol production requires a mixture of synthesis gases (H2, CO, and CO2) that is obtained from the steam reforming of natural gas (CH4 and CO2). In the case of using a biohydrogen source (H2 and CO2) for producing biomethanol, direct methanol synthesis (DMS) can be performed, which is the reaction of CO2 and H2 using an appropriate catalyst, specific temperature, and pressure, resulting in methanol and water as the products, following Equation (1). However, CO2 and H2 can be reacted through a reverse water–gas shift (RWGS) reaction, obtaining CO and H2O, following Equation (3). An advantage of RWGS is that it can be applied for transforming CO2 and H2 into CO and H2O as products, meaning that the H2O liquid can be easily separated, and then CO will react with the excess H2, following Equation (2), which is called indirect methanol synthesis (IMS), resulting in methanol as a product; this methanol is purer than that obtained from the reaction shown in Equation (1). However, there is a side reaction called a water–gas shift (WGS), shown in Equation (4), which is the reverse reaction of RWGS [3,12,13,14]. Biohydrogen sources (H2 and CO2) can be used as raw materials for producing methanol.
Methanol synthesis (MS)
CO2 + 3H2 ⇋ CH3OH + H2O      ΔH = −49.43 kJ/mol
CO + 2H2 ⇋ CH3OH      ΔH = −90.55 kJ/mol
Reverse water–gas shift (RWGS)
CO2 + H2 ⇋ CO + H2O      ΔH = 41.12 kJ/mol
Water–gas shift (WGS)
CO + H2O ⇋ CO2 + H2      ΔH = −41.12 kJ/mol
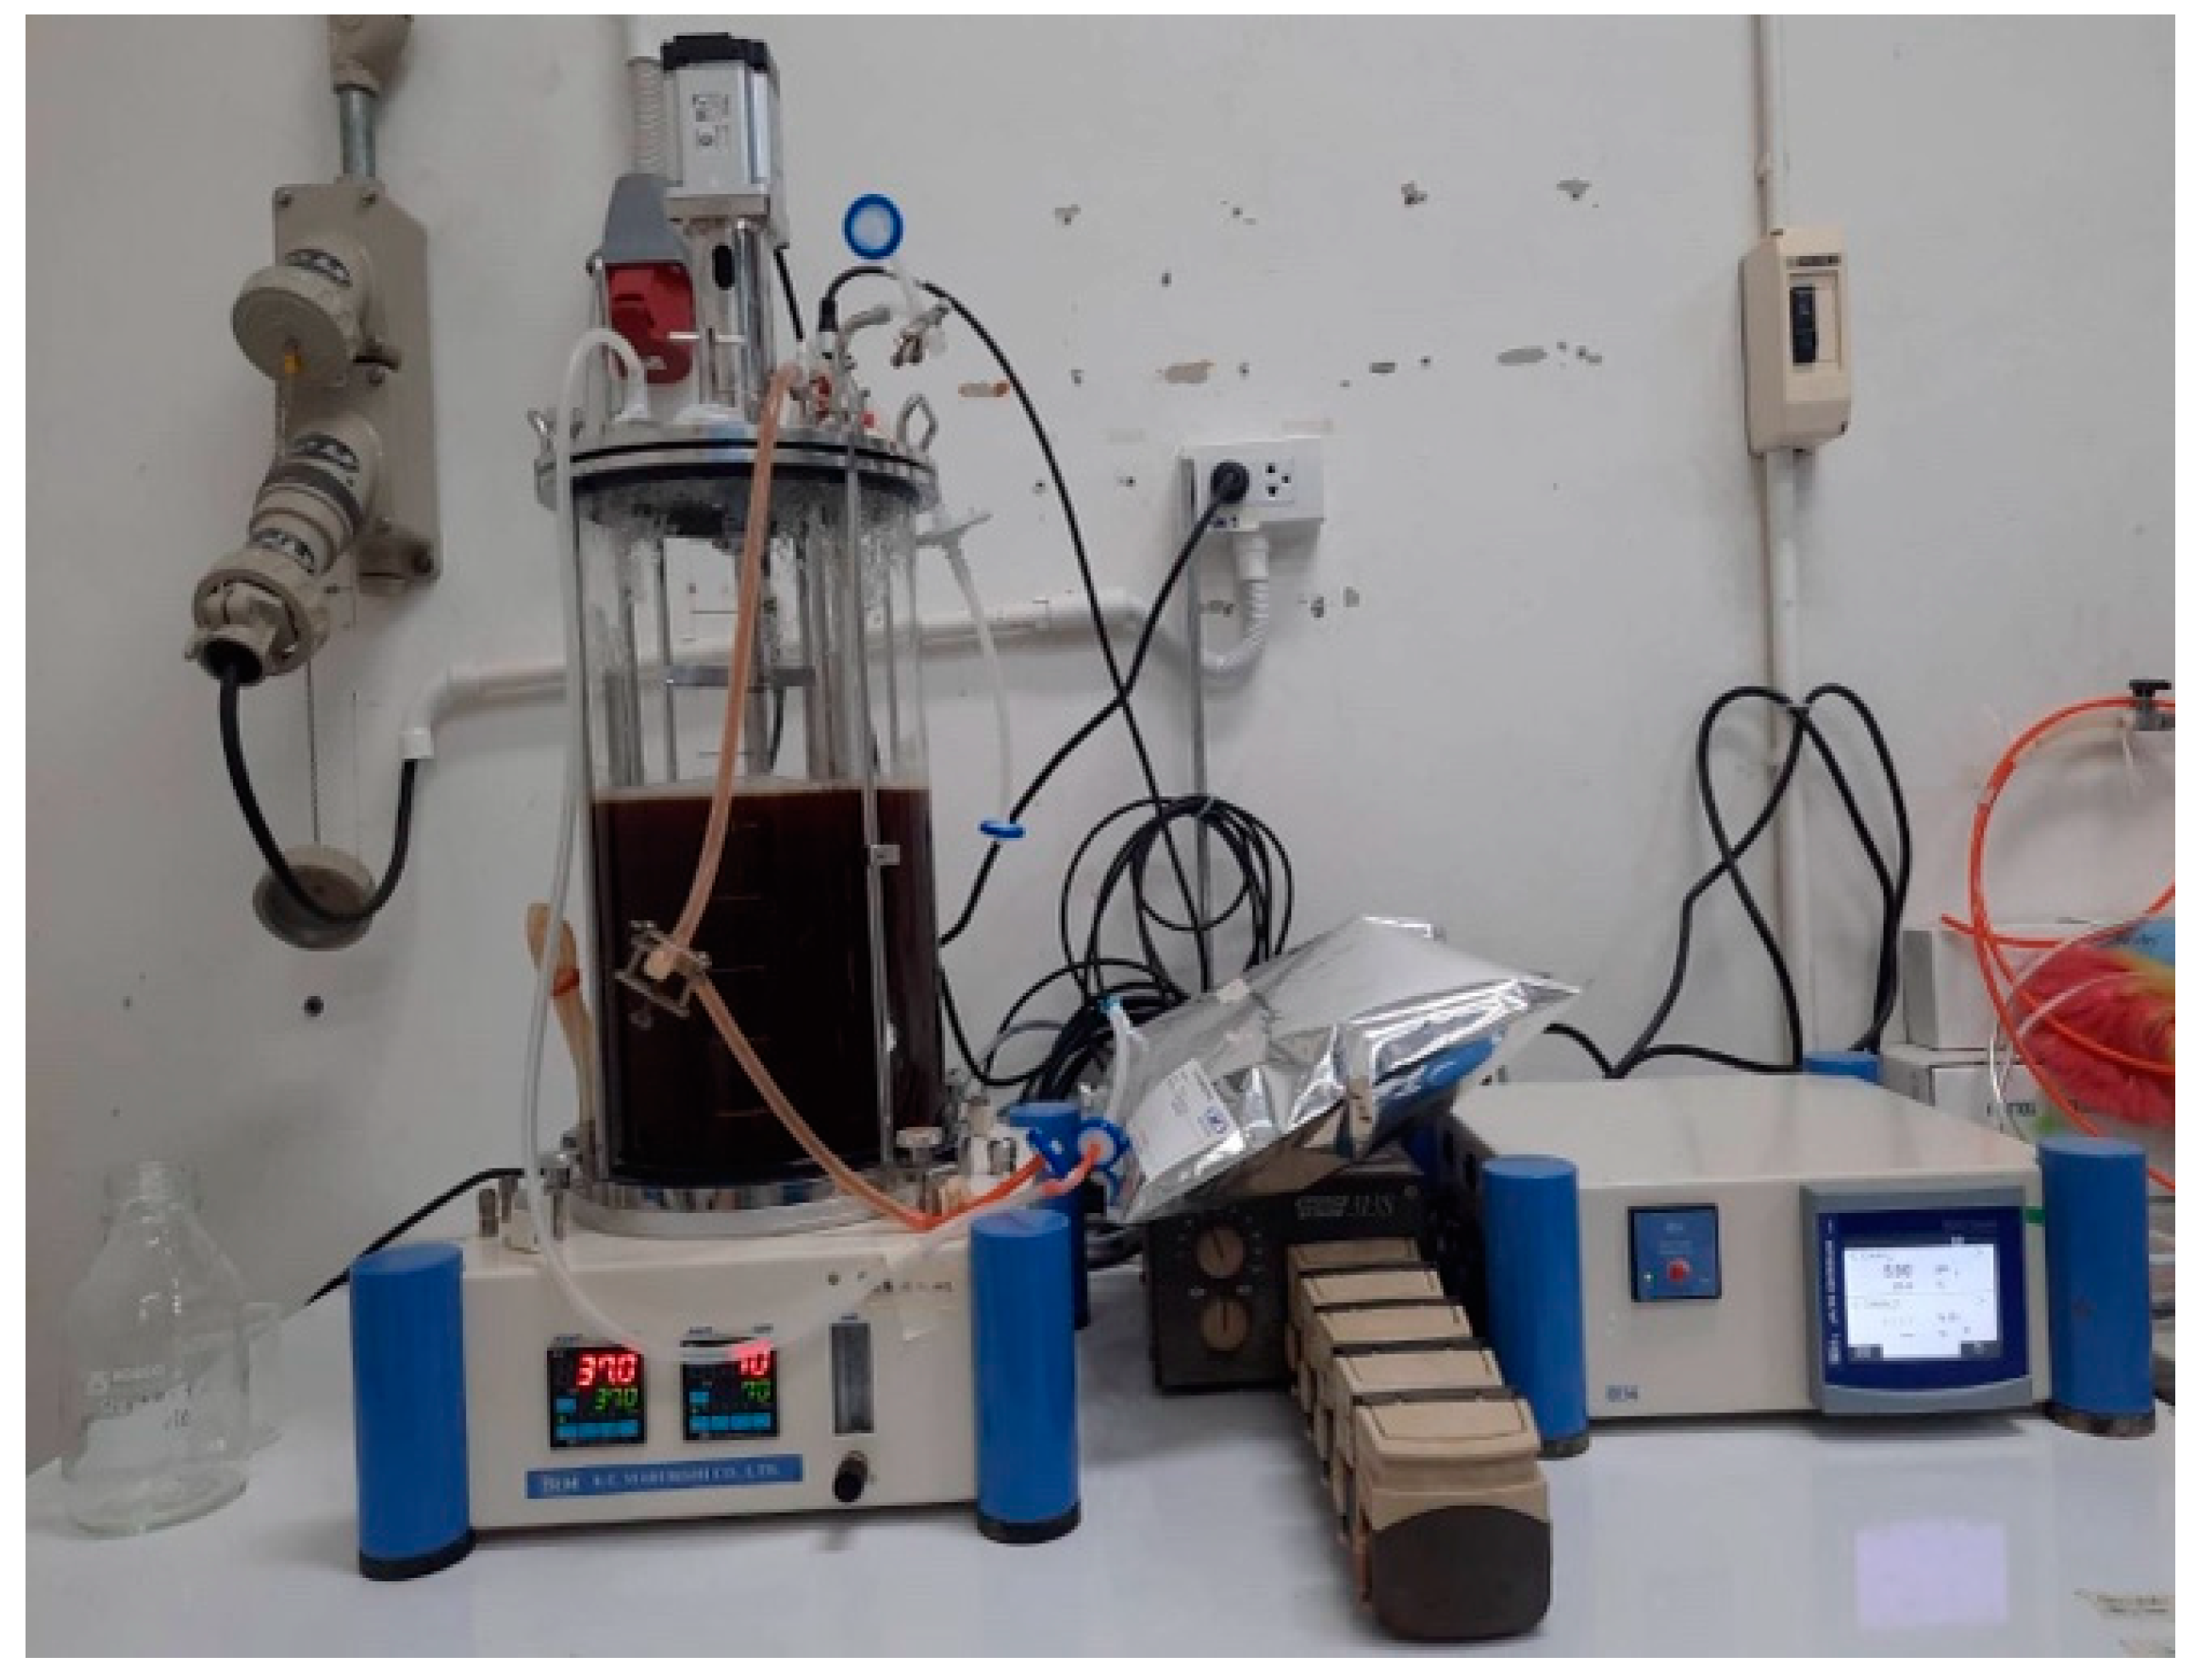
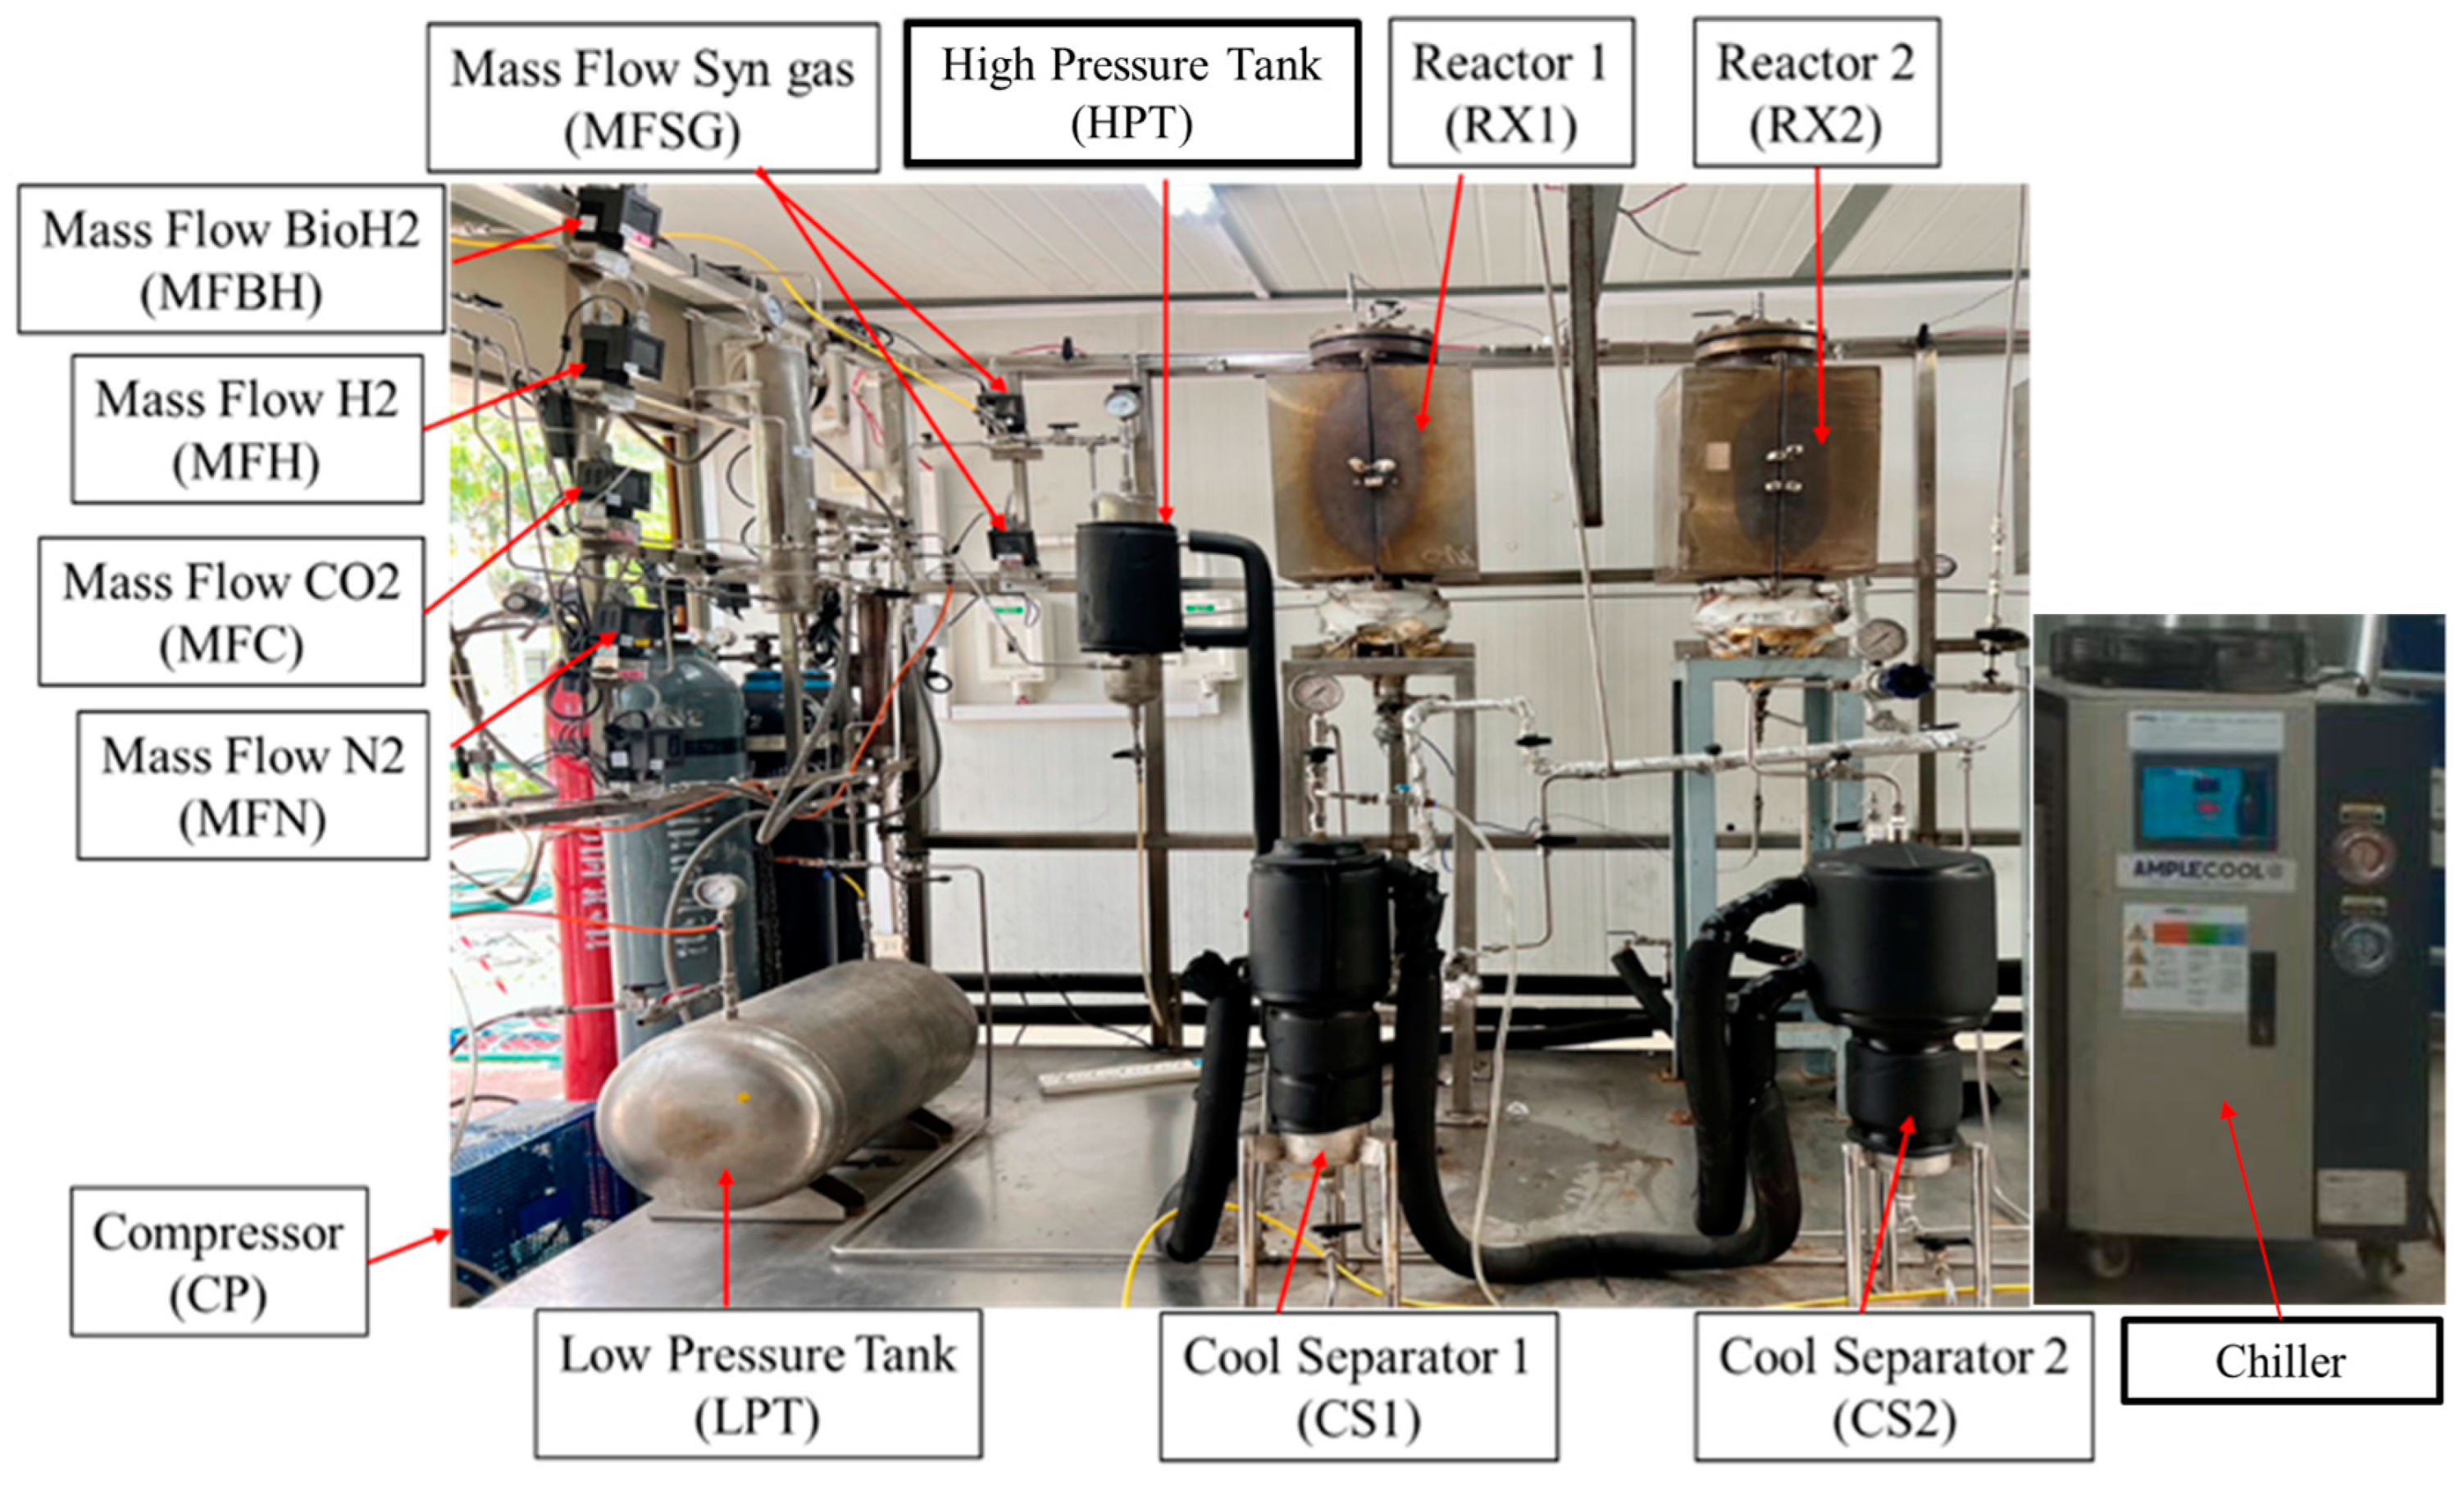
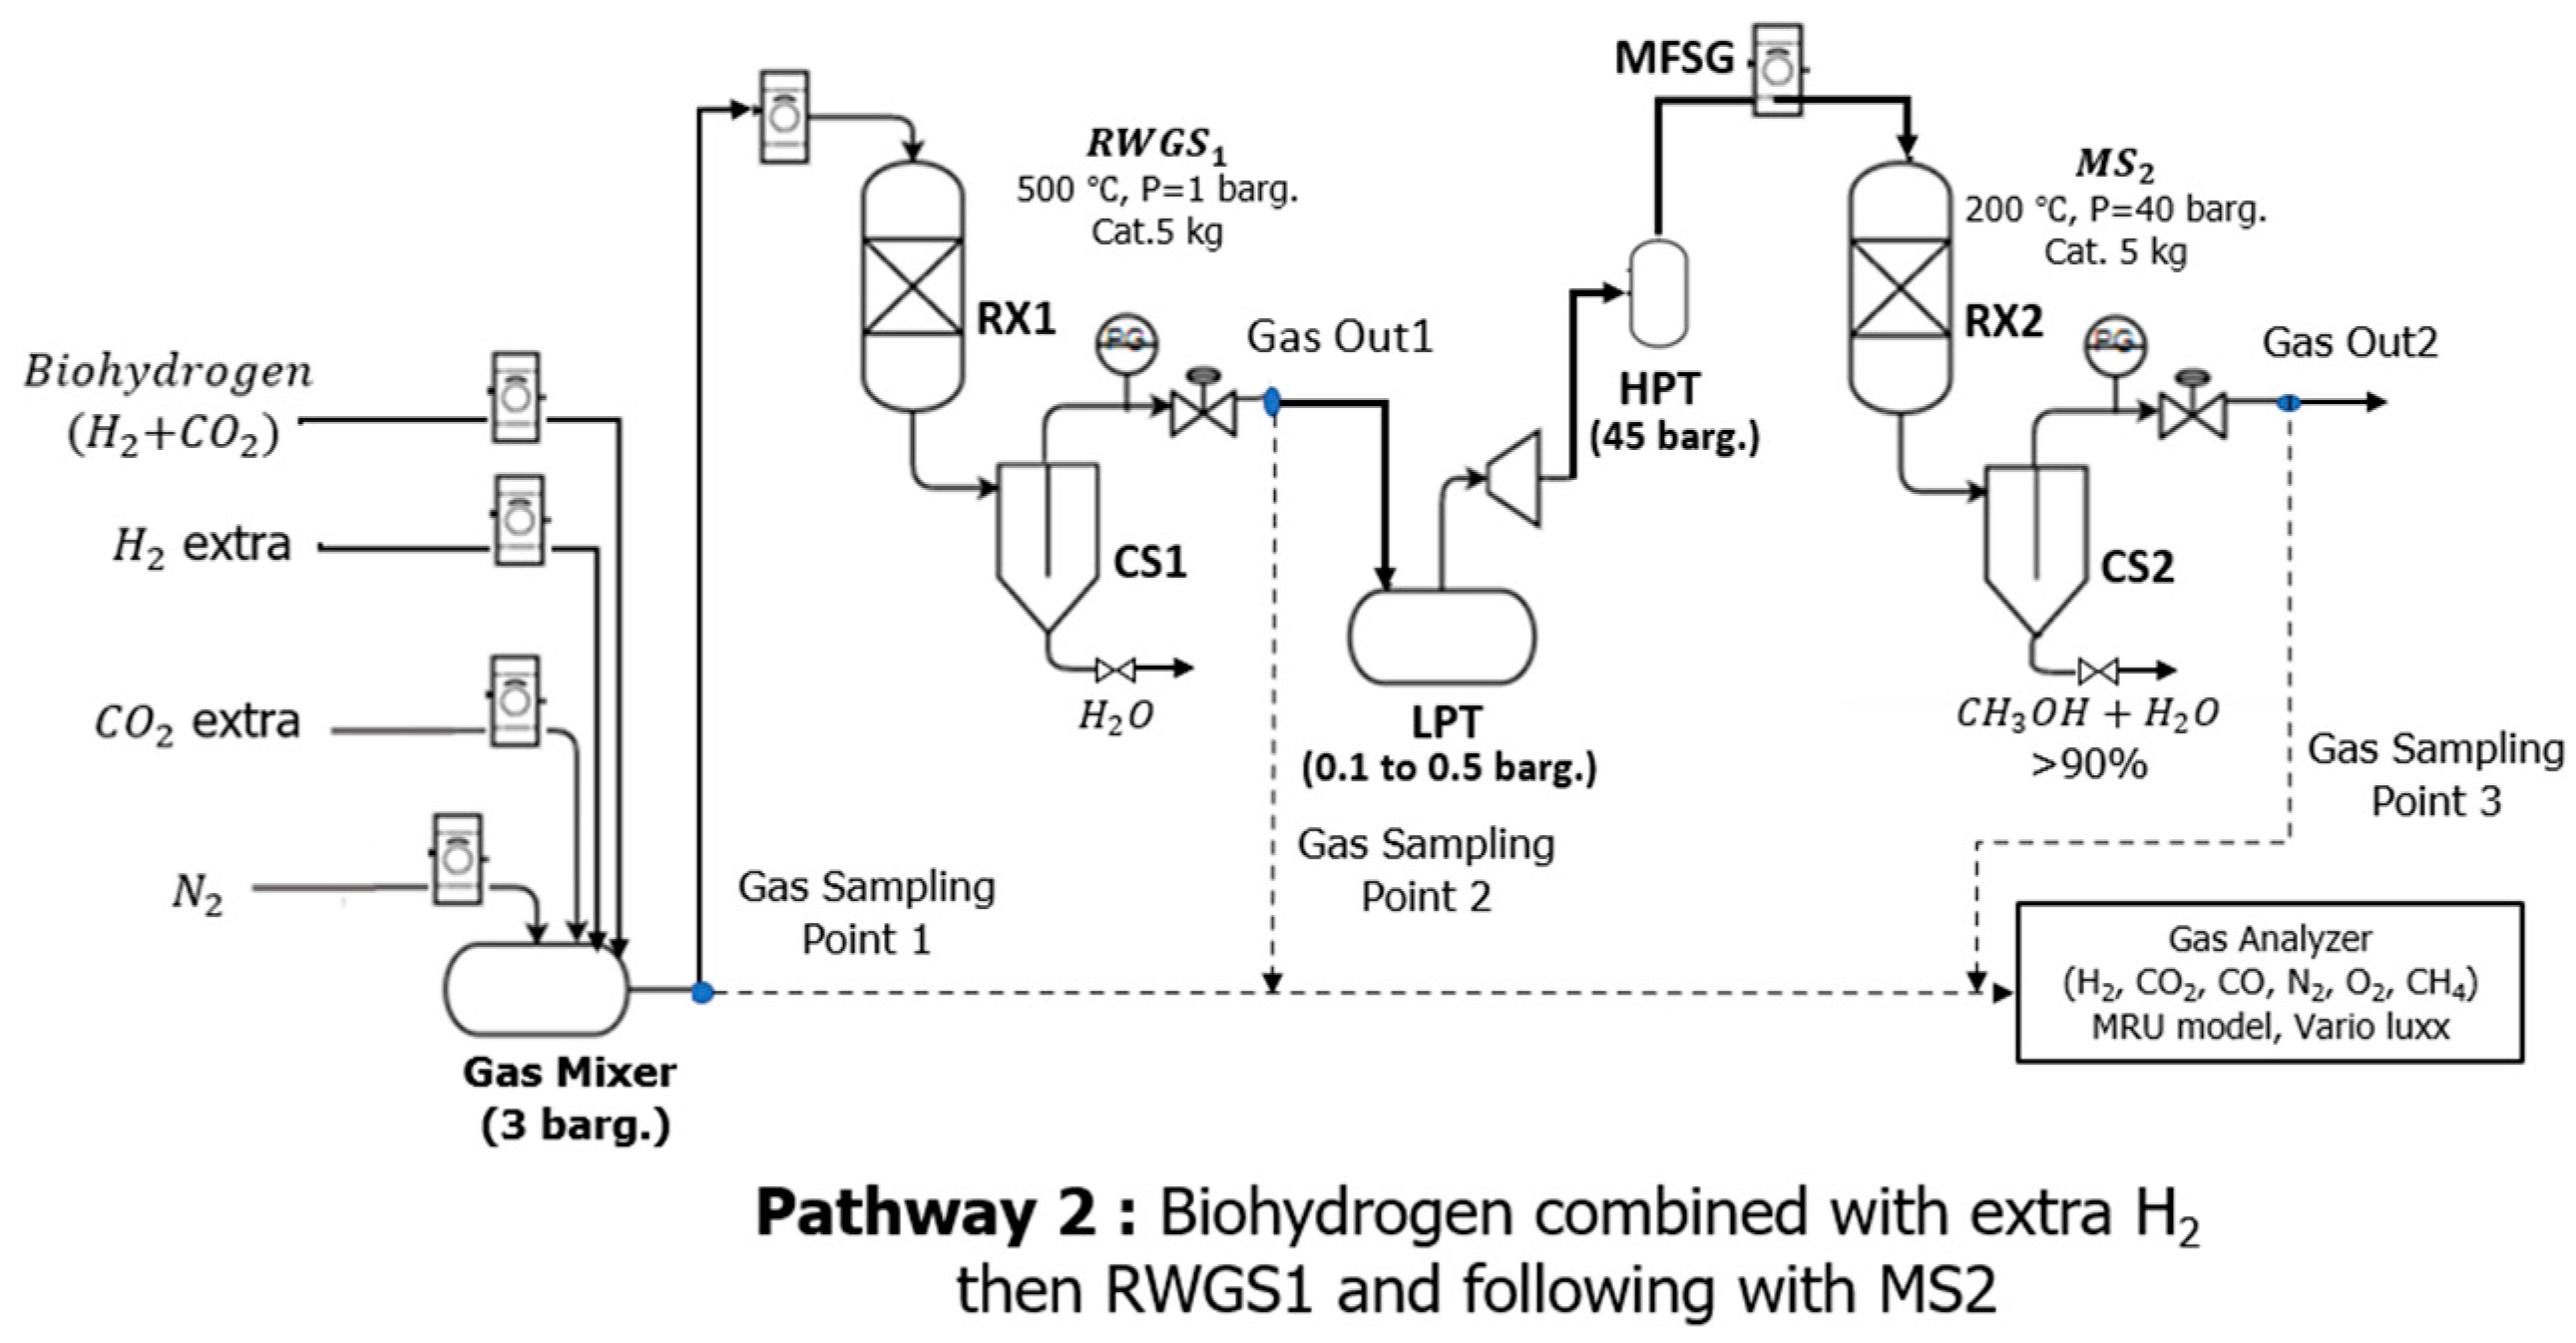
The purpose of this article is to guide the optimization of biohydrogen in terms of the molasses concentration and the concentration of trace elements. The transformation of biohydrogen into biomethanol was studied. The effect of the H2/CO2 ratio on CO2 hydrogenation and the RWGS was investigated. Two pathways for transforming biohydrogen and CO2 were investigated, and both pathways involved a two-step reaction: pathway 1 included two-step methanol synthesis involving direct CO2 hydrogenation (Equation (1)) comprising a first methanol synthesis (1st MS) and second methanol synthesis (2nd MS), with both steps connected in a series fixed-bed reactor operated using the same catalyst and controlled temperature, as shown in the Materials and Methods section; pathway 2 was an innovative route comprising a reverse water–gas shift (RWGS) as shown in Equation (3) and then methanol synthesis (MS) as shown in Equation (2). The same catalyst was used for each step, but each step had a different temperature and pressure, as described in the Materials and Methods section. The methanol production rate, methanol purity, and CO2 consumption were obtained for both pathways.

2. Materials and Methods

2.1. Biohydrogen Experiment

2.1.1. Microorganism, Culture Conditions, and Raw Materials

  • The bacterial strain Enterobacter aerogenes (E.A.) (TISTR 1540) was obtained from the Biodiversity Research Center of the Thailand Institute of Scientific and Technological Research (TISTR), maintained at 0 °C with 15% purified glycerol, and used for H2 production from molasses.
  • Molasses obtained from the Konkaen sugar company was dissolved in deionized water at concentrations of 20, 30, and 40 g/L.
  • The following nutrient medium was prepared: beef extract (1.0 g/L), yeast extract (2.0 g/L), peptone (5.0 g/L), and NaCl (5.0 g/L). This was then placed in deionized water and sterilized in an autoclave for 15 min at 121 °C. After that, the bacteria were incubated in the nutrient medium for 18 h.
  • The synthetic medium contained the following components: (NH4)2SO4 (4.0 g/L), KH2PO4 (5.5 g/L), tryptone (5 g/L), yeast extract (5 g/L), (NH4)2SO4 (1g/L), MgSO4·7H2O (0.25g/L), CaCl2·2H2O (0.020g/L), and Na2MoO4.2H2O (0.12g/L). The trace elements were NiCl2 (0.01 and 0.1 g/L) and FeSO4·7H2O (0.01 and 0.1 g/L).
  • N2 gas and gas mixtures of CO2 and H2 were supplied by the Thai Special Gas Company.

2.1.2. Apparatus and Operation

  • A 10 L bioreactor with a 5 L working volume was used in the biohydrogen experiment and obtained from Marubishi (model: MDFT-10 L), as shown in Figure 1.
  • The fermentation conditions were a 37 °C temperature, agitation by rotation at 70 rpm, and a pH of 6.0–7.0.
  • Molasses solutions (20, 30, and 40 g/L) were prepared and dissolved in solutions of a medium with a volume of 5L containing different quantities of trace elements (0, 0.01, and 0.1 g); the pHs were adjusted to 7.0 and then the solutions were sterilized (for 15 min at 121 °C) in an autoclave.
  • After removal from the autoclave, the solutions were cooled and then 10% of each seed culture was inoculated into the bioreactor.
  • To prepare the limited aerobic conditions, nitrogen (N2) was used to purge the bioreactor until the oxygen (O2) was detected to be below 1%, the temperature was set at 37 °C, and the contents were agitated at 70 rpm. The gas product was collected using an aluminum gas bag and a sample was taken every 6 h. The fermentation time was 72 h, continually, per batch.

2.2. Biomethanol Experiment

2.2.1. Raw Materials

  • The commercial catalyst Cu/ZnO/Al2O3 was supplied by Xi’an Sunward Aeromat Co., Ltd., Xi’an, China. An amount of 5 kg of the catalyst was placed in reactor 1 (RX1) and in reactor 2 (RX2). The activation conditions for the catalyst were feeding 15% H2 mixed with N2 at a temperature of 230 °C and pressure of 3 barg for 18 h.
  • The raw gas composition (H2 and CO2) obtained using the biohydrogen reactor was measured using an Agilent gas chromatograph (model: 7890 B).
  • The gas compositions in the feeds and products of the biomethanol synthesis and reverse water–gas shift experiments were measured using a gas analyzer (MRU model, Vario luxx), as shown in Figure 2, which measured the gas compositions (H2, CO, CO2, O2, N2, and CH4) in % by volume, and the sum of the gases was 100% by volume.

2.2.2. Apparatus and Operation

  • Reactor 1 (RX1) and reactor 2 (RX2) were identical fixed-bed reactors used for the biomethanol synthesis experiments. The fixed-bed reactors had an inside diameter of 16 cm and a length of 30 cm, were made from 304 stainless steel, and were filled with 5 kg of Cu/ZnO/Al2O3. Each heater was used to supply heat to each reactor with a program controlling the temperature from 30 to 600 °C.
  • Mass flow controllers were used to control all the gases feeding the reactors: mass flow of biohydrogen (MFBH), mass flow of hydrogen (MFH), mass flow of carbon dioxide (MFC), mass flow of nitrogen (MFN), and mass flow of syngas (MFSG).
  • Other equipment: cool separator 1 (CS1) was used to separate the liquid product from the gas product from RX1. Cool separator 2 (CS2) was used to separate the liquid product from the gas product from RX2. A low-pressure tank (LPT) was used to collect the gas product from CS1. A compressor was used to build up and compress the low-pressure gas to obtain high-pressure gas and then it was stored in a high-pressure tank (HPT). Cool water from a chiller was supplied to CS1 and CS2 for liquid–gas separation.
The two-step biomethanol synthesis (TSBS) process was set up with two identical fixed-bed reactors (RX1 and RX2) connected in series and linked with all the apparatus, as shown in Figure 3. It was used for the biomethanol synthesis experiments described in Section 3.2, Section 3.3 and Section 3.4 (note that Section 3.1 describes the biohydrogen experiment).
Section 3.2: In this experiment, direct CO2 hydrogenation using RX2 only was studied.
Section 3.3: In this experiment, the transformation of CO2 into CO via the RWGS reaction using RX1 only was studied.
Section 3.4: In this experiment, the transformation of biohydrogen into biomethanol via pathway 1—direct methanol synthesis (DMS) + direct methanol synthesis (DMS) (1st MS + 2nd MS)—and pathway 2—indirect methanol synthesis (IMS) comprised of RWGS + direct methanol synthesis (DMS) (1st RWGS + 2nd MS)—was studied.
Pathway 1: The process diagram for DMS+DMS, methanol synthesis reaction step 1 (1st MS), and methanol synthesis reaction step 2 (2nd MS) is shown in Figure 4. The experiment was started by feeding a gas comprising biohydrogen (H2 + CO2) using MFBH and the gas composition was adjusted with CO2 or H2 using MFC or MFH; then, all the gases were blended in a gas mixer until the following volume ratios of H2/CO2 were obtained: 50/50% (v/v), 60/40% (v/v), and 70/30% (v/v). The gas was transferred by MFSG to reactor 1 (RX1), in which the temperature was controlled at 200 °C and the pressure was controlled at 40 barg. After the reaction, hot fluid flowed out of the first reactor and cooled down in CS1 and then the liquid was removed by opening the bottom valve connected to CS1. Gas flowed out from the top of CS1 and was fed continuously into reactor 2 (RX2), in which the temperature was controlled at 200 °C and the pressure was controlled at 40 barg for methanol synthesis. After the reaction in RX2, the fluid was cooled in CS2. The liquid was removed from the bottom of CS2 and the gas was extracted. The compositions of the gases were measured using a gas analyzer, MRU, which was connected in three positions, as shown in Figure 4.
Pathway 2: The process diagram of IMS + DMS, the reverse water–gas shift reaction (RWGS), and methanol synthesis reaction (MS) were carried out as shown in Figure 5. The experiment was started using a set-up pressure of 3 barg for all the feeding gases, which comprised biohydrogen (H2 + CO2), which was fed by MFBH, and the gas composition was adjusted using CO2 or H2 by MFC or MFH; then, all the gases were blended in a gas mixer until the following volume ratios of H2/CO2 were obtained: 50/50% (v/v), 60/40% (v/v), and 70/30% (v/v). The gas was sent by MFSG to reactor 1 (RX1), in which the temperature was controlled at 500 °C and the pressure was controlled at atmospheric pressure. After the reaction, hot fluid flowed out of the first reactor and cooled down in CS1 and then the liquid was removed by opening the bottom valve connected to CS1. Gas flowed out from the top of CS1 and was collected in LPT, and the minimum and maximum pressures were controlled at 0.1 and 0.5 barg, respectively. The compressor (CP) started to compress the gas into HPT when the gas pressure in the LPT reached the maximum pressure and stopped when the minimum pressure was reached. The gas was collected in the HPT until the pressure reached over 45 barg and was prepared to be fed continuously with MFSG into reactor 2 (RX2), the pressure in which was controlled at 40 barg by a gas back-pressure regulator. After the reaction in RX2, the fluid was cooled in CS2. The liquid was removed from the bottom of CS2 and the gas was drawn out. The compositions of the gases were measured using a gas analyzer, MRU, which was connected in three positions, as shown in Figure 5.

3. Results

3.1. Optimization of Biohydrogen with Varying Molasses Concentrations versus Trace Element (TE) Concentrations with Enterobacter Aerogenes

The production of biohydrogen was studied by investigating two parameters: the molasses concentration (MC) and the trace element (TE) concentration. The experiments were performed by comparing molasses concentrations of 20, 30, and 40 g/L corresponding to low, medium, and high levels, respectively, and then combining them with the two metal sources of NiCl2 and FeSO4·7H2O (TEs) at varying concentrations of 0, 0.01, 0.05, and 0.1 g/L, as shown in Table 1.
The results show that the molasses concentration affected biohydrogen generation. It was found that using 30 g/L of molasses resulted in the best biohydrogen generation, better than molasses concentrations of 20 and 40 g/L, for every concentration of TEs added. Increasing the TE concentration in the system from 0, 0.01, 0.05, and 0.1 g/L demonstrated that 0.01 g/L of TEs enhanced both the maximum biohydrogen and the H2/CO2 ratio. As shown in Table 1, the optimal combination was a 30 g/L molasses concentration and 0.01 g/L TE concentration, which produced 31.36 L of biohydrogen and a 0.97 H2/CO2 mole ratio. Implementing a TE concentration above this did not increase biohydrogen production at any molasses concentration because TE concentrations above this inhibited hydrogenase activities, resulting in both lower hydrogen production and H2/CO2 ratios. In addition, the results show that adding an appropriate amount of TEs not only enhanced biohydrogen development but also increased the ratio of H2/CO2 up to 1. In Alshiyab et al.’s study, they reported that metal ions, such as Fe2+/Fe3+ and Ni2+, facilitated an increase in hydrogen production during dark fermentation [15].

3.2. Effect of H2/CO2 Ratio on Direct CO2 Hydrogenation upon Adding Extra H2 in Methanol Synthesis

This biohydrogen experiment obtained a gas composition with a maximum H2/CO2 ratio of approximately 1 (50/50% (v/v) H2/CO2). Following Equation (1), direct methanol synthesis normally requires a mole ratio for H2/CO2 of approximately 3. Extra hydrogen was added to the system. After that, the effects of three different H2/CO2 ratios, 50/50, 60/40, and 70/30% (v/v), were studied. Direct CO2 hydrogenation was carried out at temperatures of 170, 200, and 230 °C with the TISTR optimum conditions (the pressure was fixed at 40 barg with under 5 kg of CuZnO/Al2O3 at a total gas feed flow rate of 1 g/min (60 g/h)). As can be seen in Figure 6, the results showed that increasing the H2/CO2 ratio resulted in an increase in the methanol production rate at every temperature applied: at 170 °C, the methanol production rates were 9.91, 12.01, and 13.15 g/h; at 200 °C, the production rates were 16.24, 17.00, and 17.81 g/h; and at 230 °C, the production rates were 10.91, 13.01, and 14.15 g/h. The optimum temperature was 200 °C, resulting in the maximum methanol amount. However, there is no evidence that a difference in the purity of the methanol product, which ranged from 61 to 63%, was related to CO2 hydrogenation, as was also reported by Sarp S. in 2021 [16]. The methanol percentage obtained via the experiment showed that direct CO2 hydrogenation followed Equation (3). The methanol percentage was over 50% because, during CO2 hydrogenation, a side reaction involving the transformation of CO2 into CO via RWGS appeared in parallel, as shown in Equation (4), which is related to the findings discussed in [17]. The gas mixture containing an amount of CO in the reaction resulted in some CO hydrogenation, which had a positive effect on the methanol yield of over 50%.

3.3. Effect of H2/CO2 Ratio on CO Generation in RWGS with Varying Temperatures

Direct methanol synthesis via CO2 hydrogenation gave a low methanol production rate, and the product was contaminated with a large amount of water, as shown in Figure 6. Therefore, indirect methanol synthesis via the transformation of CO2 into CO followed by CO hydrogenation may be a method for increasing methanol purity. The desired method was to apply the RWGS reaction (Equation (3)) to transform CO2 into CO before feeding it into the methanol synthesis process following Equation (2) for CO hydrogenation. This was expected to produce a higher methanol production rate than direct methanol synthesis. Therefore, the optimum ratio of H2/CO2 would be the best for CO conversion via the RWGS. As in the previous section, the biohydrogen yielded a H2/CO2 ratio of approximately 1. Therefore, the relationship between the H2/CO2 feed ratio and the mixed gas product composed of H2, CO2, and CO generated via the RWGS was studied. The results in the previous section demonstrated that adding H2 to the biohydrogen increased the normal H2/CO2 % v/v or (mole ratio) of 50/50 (1/1) to 60/40 (1.49/1) and 70/30 (2.33/1). Three H2/CO2 ratios for the RWGS with Cu/ZnO/Al2O3 at temperatures ranging from 150 to 550 °C were studied. The results in Figure 7 show that the change in the % by vol. of H2 and CO2 (raw material gases) for all ratios decreased with an increase in the temperature from 150 to 500 °C and then CO2 and H2 slowly declined when a temperature between 500 and 550 °C was applied. The generation of CO increased from 150 to 500 °C and then slightly stabilized from 500 to 550 °C. This phenomenon follows Le Châtelier’s principle as the reaction was endothermic; it was thermodynamically favored at higher temperatures until the CO and CO2 contents were balanced in equilibrium in the RWGS and WGS following the reverse reactions in Equations (3) and (4). In addition, increasing the H2/CO2 ratio increased CO2 conversion and favored the RWGS reaction, as discussed by Chinchen [18]. The results showed that the RWGS equilibrium in Equation (3) dominated over the WGS in Equation (4), showing a % by vol. (mol) CO generation of approximately 21.20, 21.71, and 23.31 at 550 °C. Under all conditions, CO generation increased according to the increasing temperature, but the final amounts of CO conversion differed in terms of minimum numbers. This result can be explained by the moles of CO and CO2 being balanced in the RWGS and WGS conditions relating to Equations (3) and (4) [19,20,21,22]. In addition, the Cu/ZnO/Al2O3 catalyst had a maximum temperature of approximately 550 °C, which followed the specification of the catalyst company. Therefore, the optimum temperature for CO2/H2 in the RWGS was 500 °C, which was used in the RWGS reaction for safety reasons and generated the maximum CO and minimum CO2 contents.

3.4. The Comparison of H2/CO2 Ratios for Methanol Synthesis via Two Pathways: (1) MS and MS and (2) RWGS and MS

Pathway 1 (DMS + DMS) was conducted as follows: two-step direct methanol synthesis was set up with two methanol synthesis reactors with a feed flow rate of 5 g/min, temperature of 200 °C, and pressure of 40 barg, as shown in Table 2, Table 3 and Table 4. The H2/CO2 feed in unit % v/v (mol ratios) of 50/50 (1.00), 60/40 (1.50), and 70/30 (2.33) added to the first MS reactor resulted in methanol production rates of 0.43, 0.49, and 0.49 g/min. The feed contained only CO2 and H2 and then the reactions were followed by direct CO2 hydrogenation via Equation (1), which produced a mixture of methanol and water around 61.43% (wt), 62.03% (wt), and 63.64% (wt), respectively. The off gas that came out of the first reactor contained mixed H2/CO2/CO % v/v/v (mol/min) of 44.17/45.45/10.38 (0.085/0.083/0.018), 53.52/36.80/9.67 (0.120/0.078/0.020), and 64.93/24.71/10.36 (0.195/0.070/0.028), respectively. There was clear evidence that an increase in the H2/CO2 feed increased the % (wt) methanol purity and methanol production rate but generated almost no difference in CO generation, which was obtained from the side reaction following Equation (3). The mixed gas that was released from the first MS reactor turned into the feed in the second MS reactor in series. The results showed that the series of continual H2/CO2 feed ratios of 50/50, 60/40, and 70/30 (%v) generated a percentage of CO in the mixed gas and resulted in higher mole ratios for H2/CO (4.70, 6.11, and 6.92) than for H2/CO2 (1.03, 1.54, and 2.78), which supported the methanol synthesis via CO hydrogenation following Equation (2). As a result, the methanol concentration in the second step showed a higher yield compared with that in the first step, in which the methanol purity was 93.29% (wt), 94.16% (wt), and 80.39% (wt) and the methanol production rates were 0.50, 0.55, and 0.60 g/min. The mixed H2/CO2/CO % v/v/v (mol/min) values derived from the second reactor were 35.59/62.43/1.98 (0.050/0.082/0.003), 49.02/49.35/1.63 (0.080/0.077/0.003), and 63.94/31.64/4.41 (0.140/0.065/0.009), respectively. There was evidence that the mixed feed gas contained CO, which affected the selectivity of CO hydrogenation (Equation (2)) or CO2 hydrogenation (Equation (1)). The first effect was that a lower percentage of CO2 in the feed gas increased both the methanol production rates and the methanol purity (%), and the second effect was that a higher H2/CO ratio in the feed gas composition resulted in the reaction of Equation (2) competing with that of Equation (1). However, whilst the H2/CO2 ratio was close to 3, the H2/CO ratio was over 2 following stoichiometry, and the methanol synthesis favored the reaction in Equation (1) over that in Equation (2), as shown in the 70/30% (v/v) H2/CO2 feed case in the second reactor.
Pathway 2 (IMS + DMS) was conducted as follows: the RWGS followed by methanol synthesis was set up. The first reaction with the RWGS reactor was operated at a feed flow rate of 5 g/min, a temperature of 500 °C, and atm pressure with H2/CO2 feed ratios of 50/50 (1.00), 60/40 (1.50), and 70/30 (2.33). Then, it was connected with the second methanol synthesis reactor in series at 200 °C and 40 barg, and the results are shown in Table 5, Table 6 and Table 7. The result was clear: feeding a higher ratio of H2/CO2 into the RWGS resulted in higher conversion following Equation (3), which resulted in a methanol concentration of 0%; water yields of 0.82, 1.79, and 2.54 g/min; and mixed H2/CO2/CO gas containing % (v/v/v) or (mol/min) 37.08/39.26/23.66 (0.065/0.067/0.039), 51.23/26.73/22.05 (0.095/0.046/0.036), and 62.68/17.70/19.62 (0.115/0.030/0.032), respectively. The RWGS converted CO2 into CO following Equation (3), equating with the WGS following Equation (4), which resulted in the balancing of the ratio of CO2 to CO. The equilibrium of RWGS and WGS resulted in the % CO (mol) generation being slightly reduced to 23.66 (0.039), 22.05 (0.036), and 19.62 (0.032), whereas it boosted the H2/CO ratios to 1.73, 2.56, and 3.53, respectively, which supported methanol synthesis via CO hydrogenation following Equation (2). The mixed gas that was released from the first RWGS reactor was collected in the LPT tank and the pressure was increased using the CP and then fed into the second MS reactor in series. The methanol concentration in the second step showed higher purity percentages of 95.81% (wt), 97.98% (wt), and 92.93% (wt) and methanol yields of 0.69, 1.01, and 1.05 g/min. The mixed H2/CO2/CO gas derived from the second reactor contained % v/v/v or (mol/min) 18.24/64.12/17.64 (0.020/0.067/0.018), 32.01/61.15/6.84 (0.025/0.045/0.005), and 57.54/40.10/2.36 (0.045/0.029/0.002), respectively. The results are the same as those for pathway 1, wherein the mixed feed gas containing CO then influenced the selectivity of CO hydrogenation (Equation (2)) or CO2 hydrogenation (Equation (1)). The main effect was that a lower percentage of CO2 in the feed gas increased both the methanol yield and the methanol purity %, and a higher H2/CO in the feed gas composition promoted the dominance of Equation (2) over Equation (1). However, the H2/CO2 mole ratio was close to or over 3, and the reaction preferred CO2 hydrogenation following Equation (1), resulting in a reduction in the methanol purity, as shown by the H2/CO2 ratio for the 70/30 feed case in the second reactor.

4. Discussion

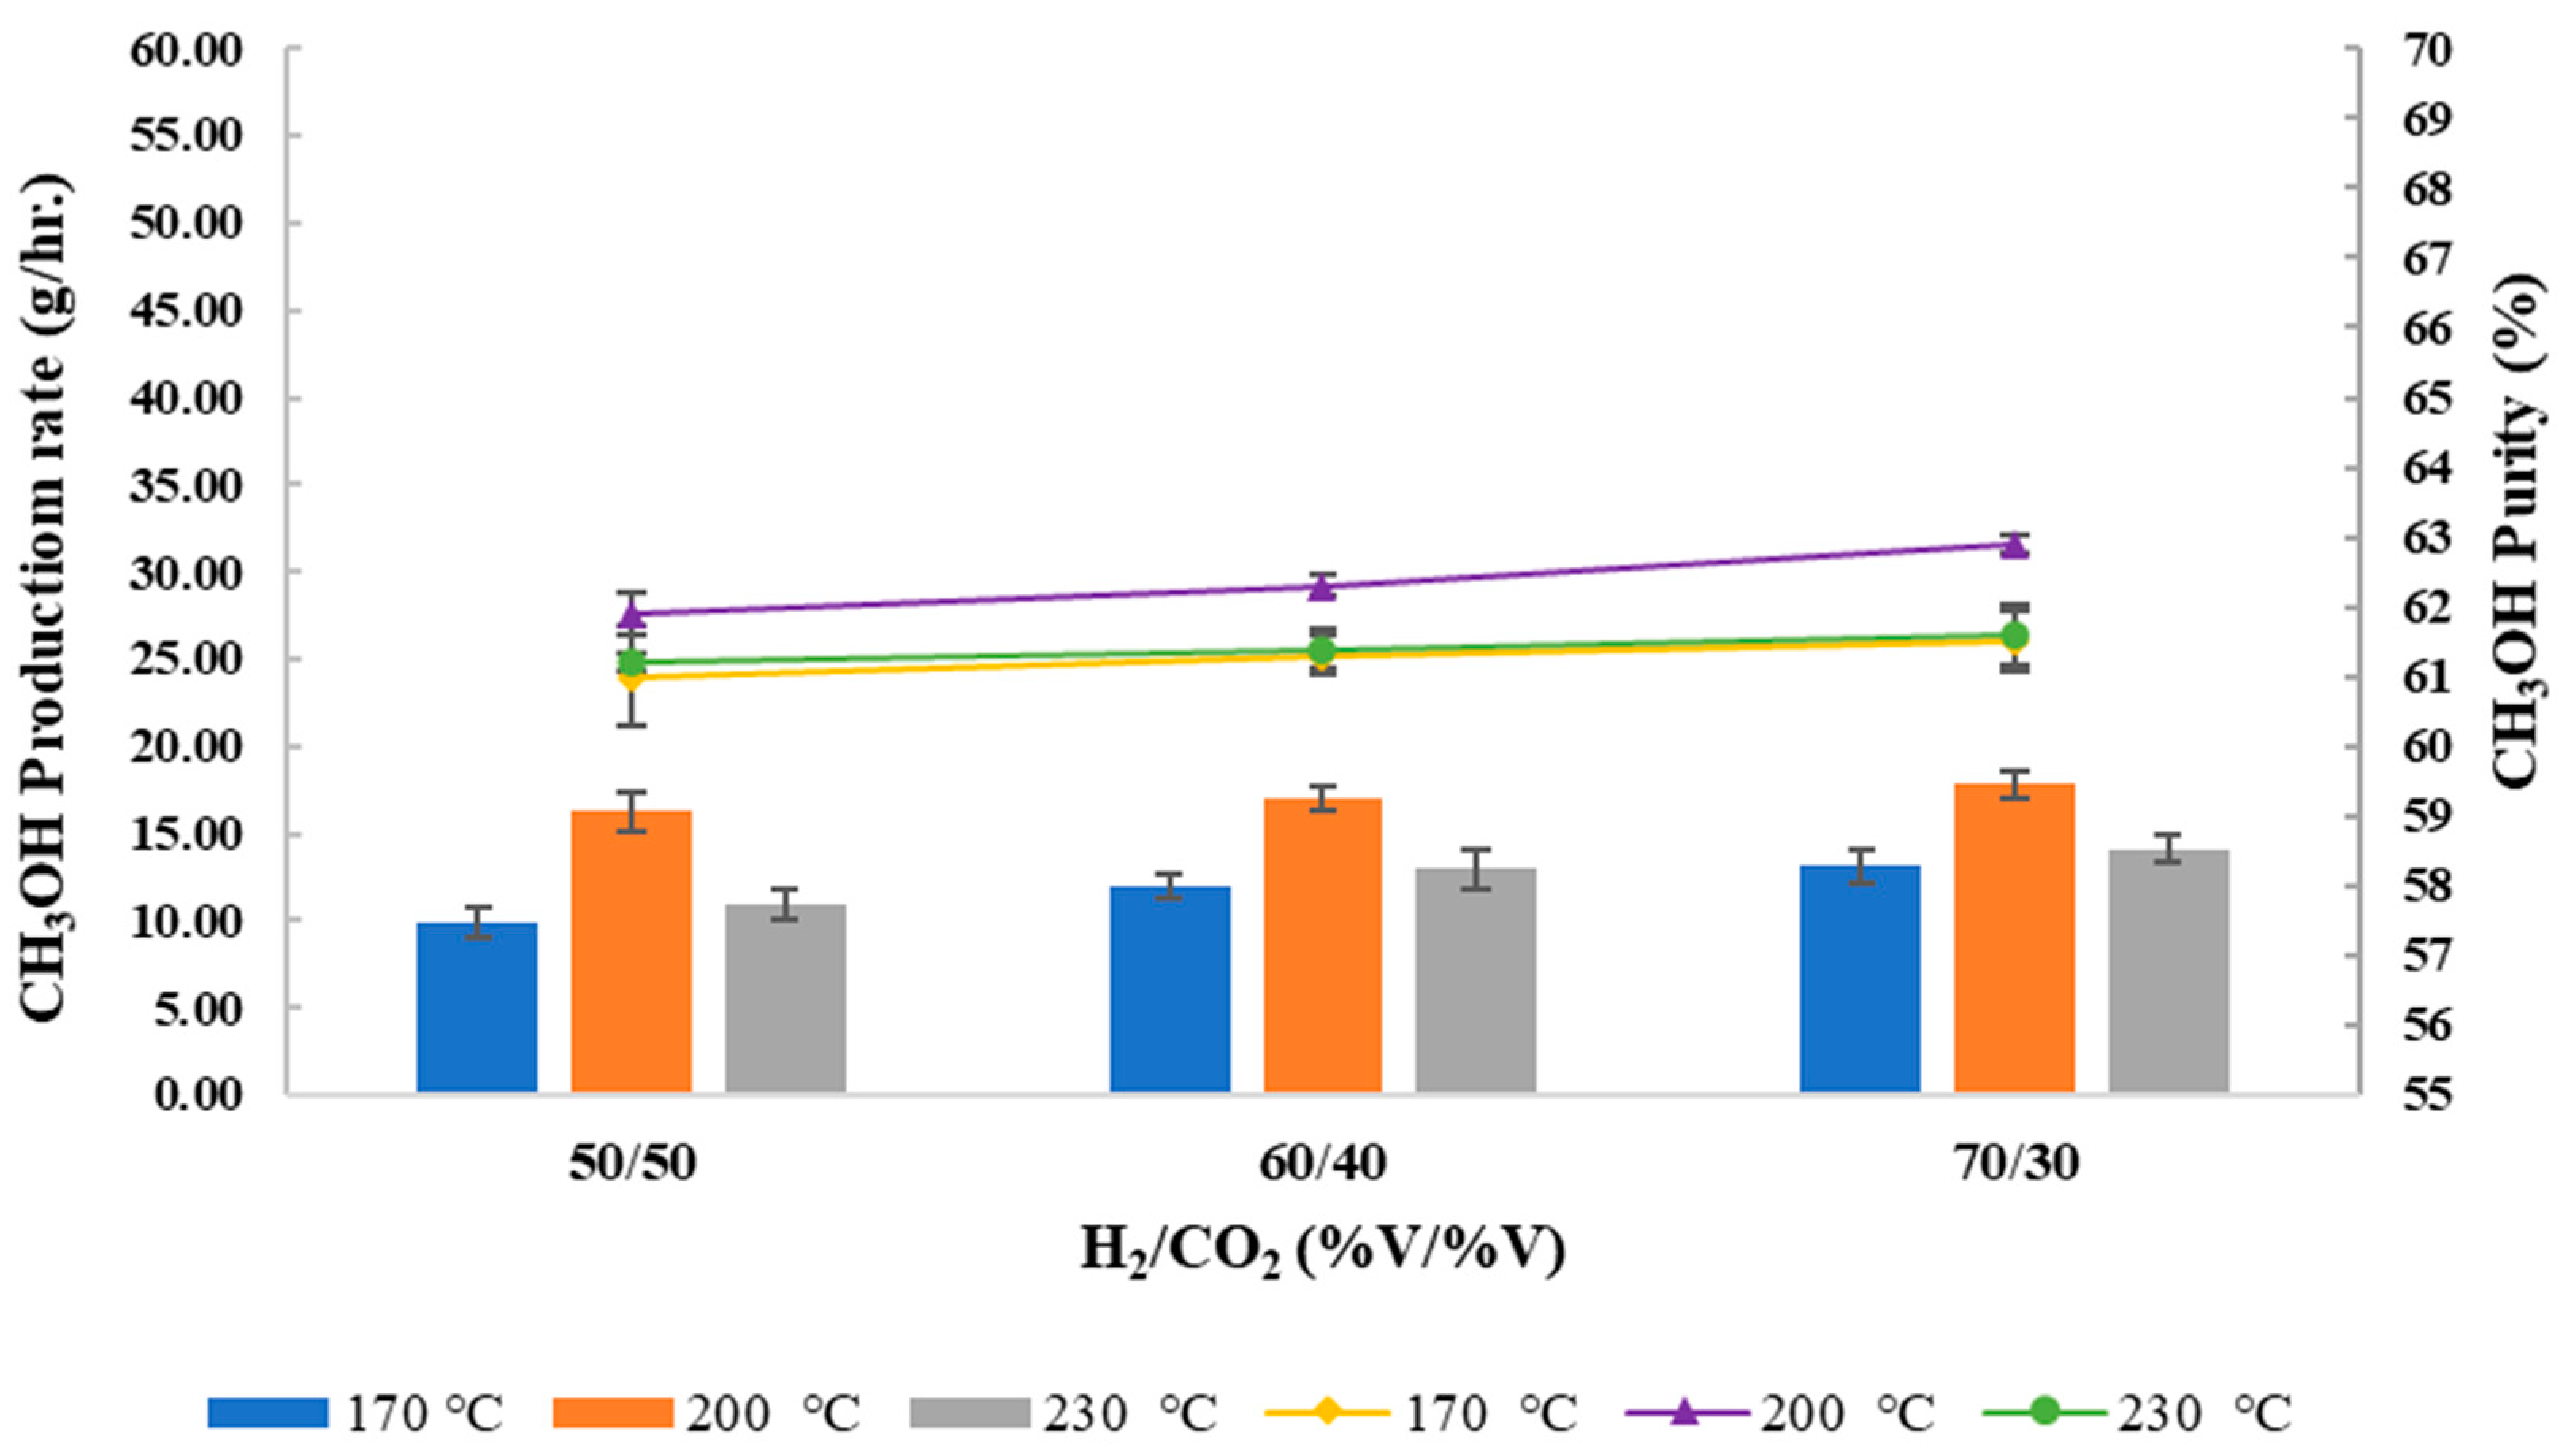
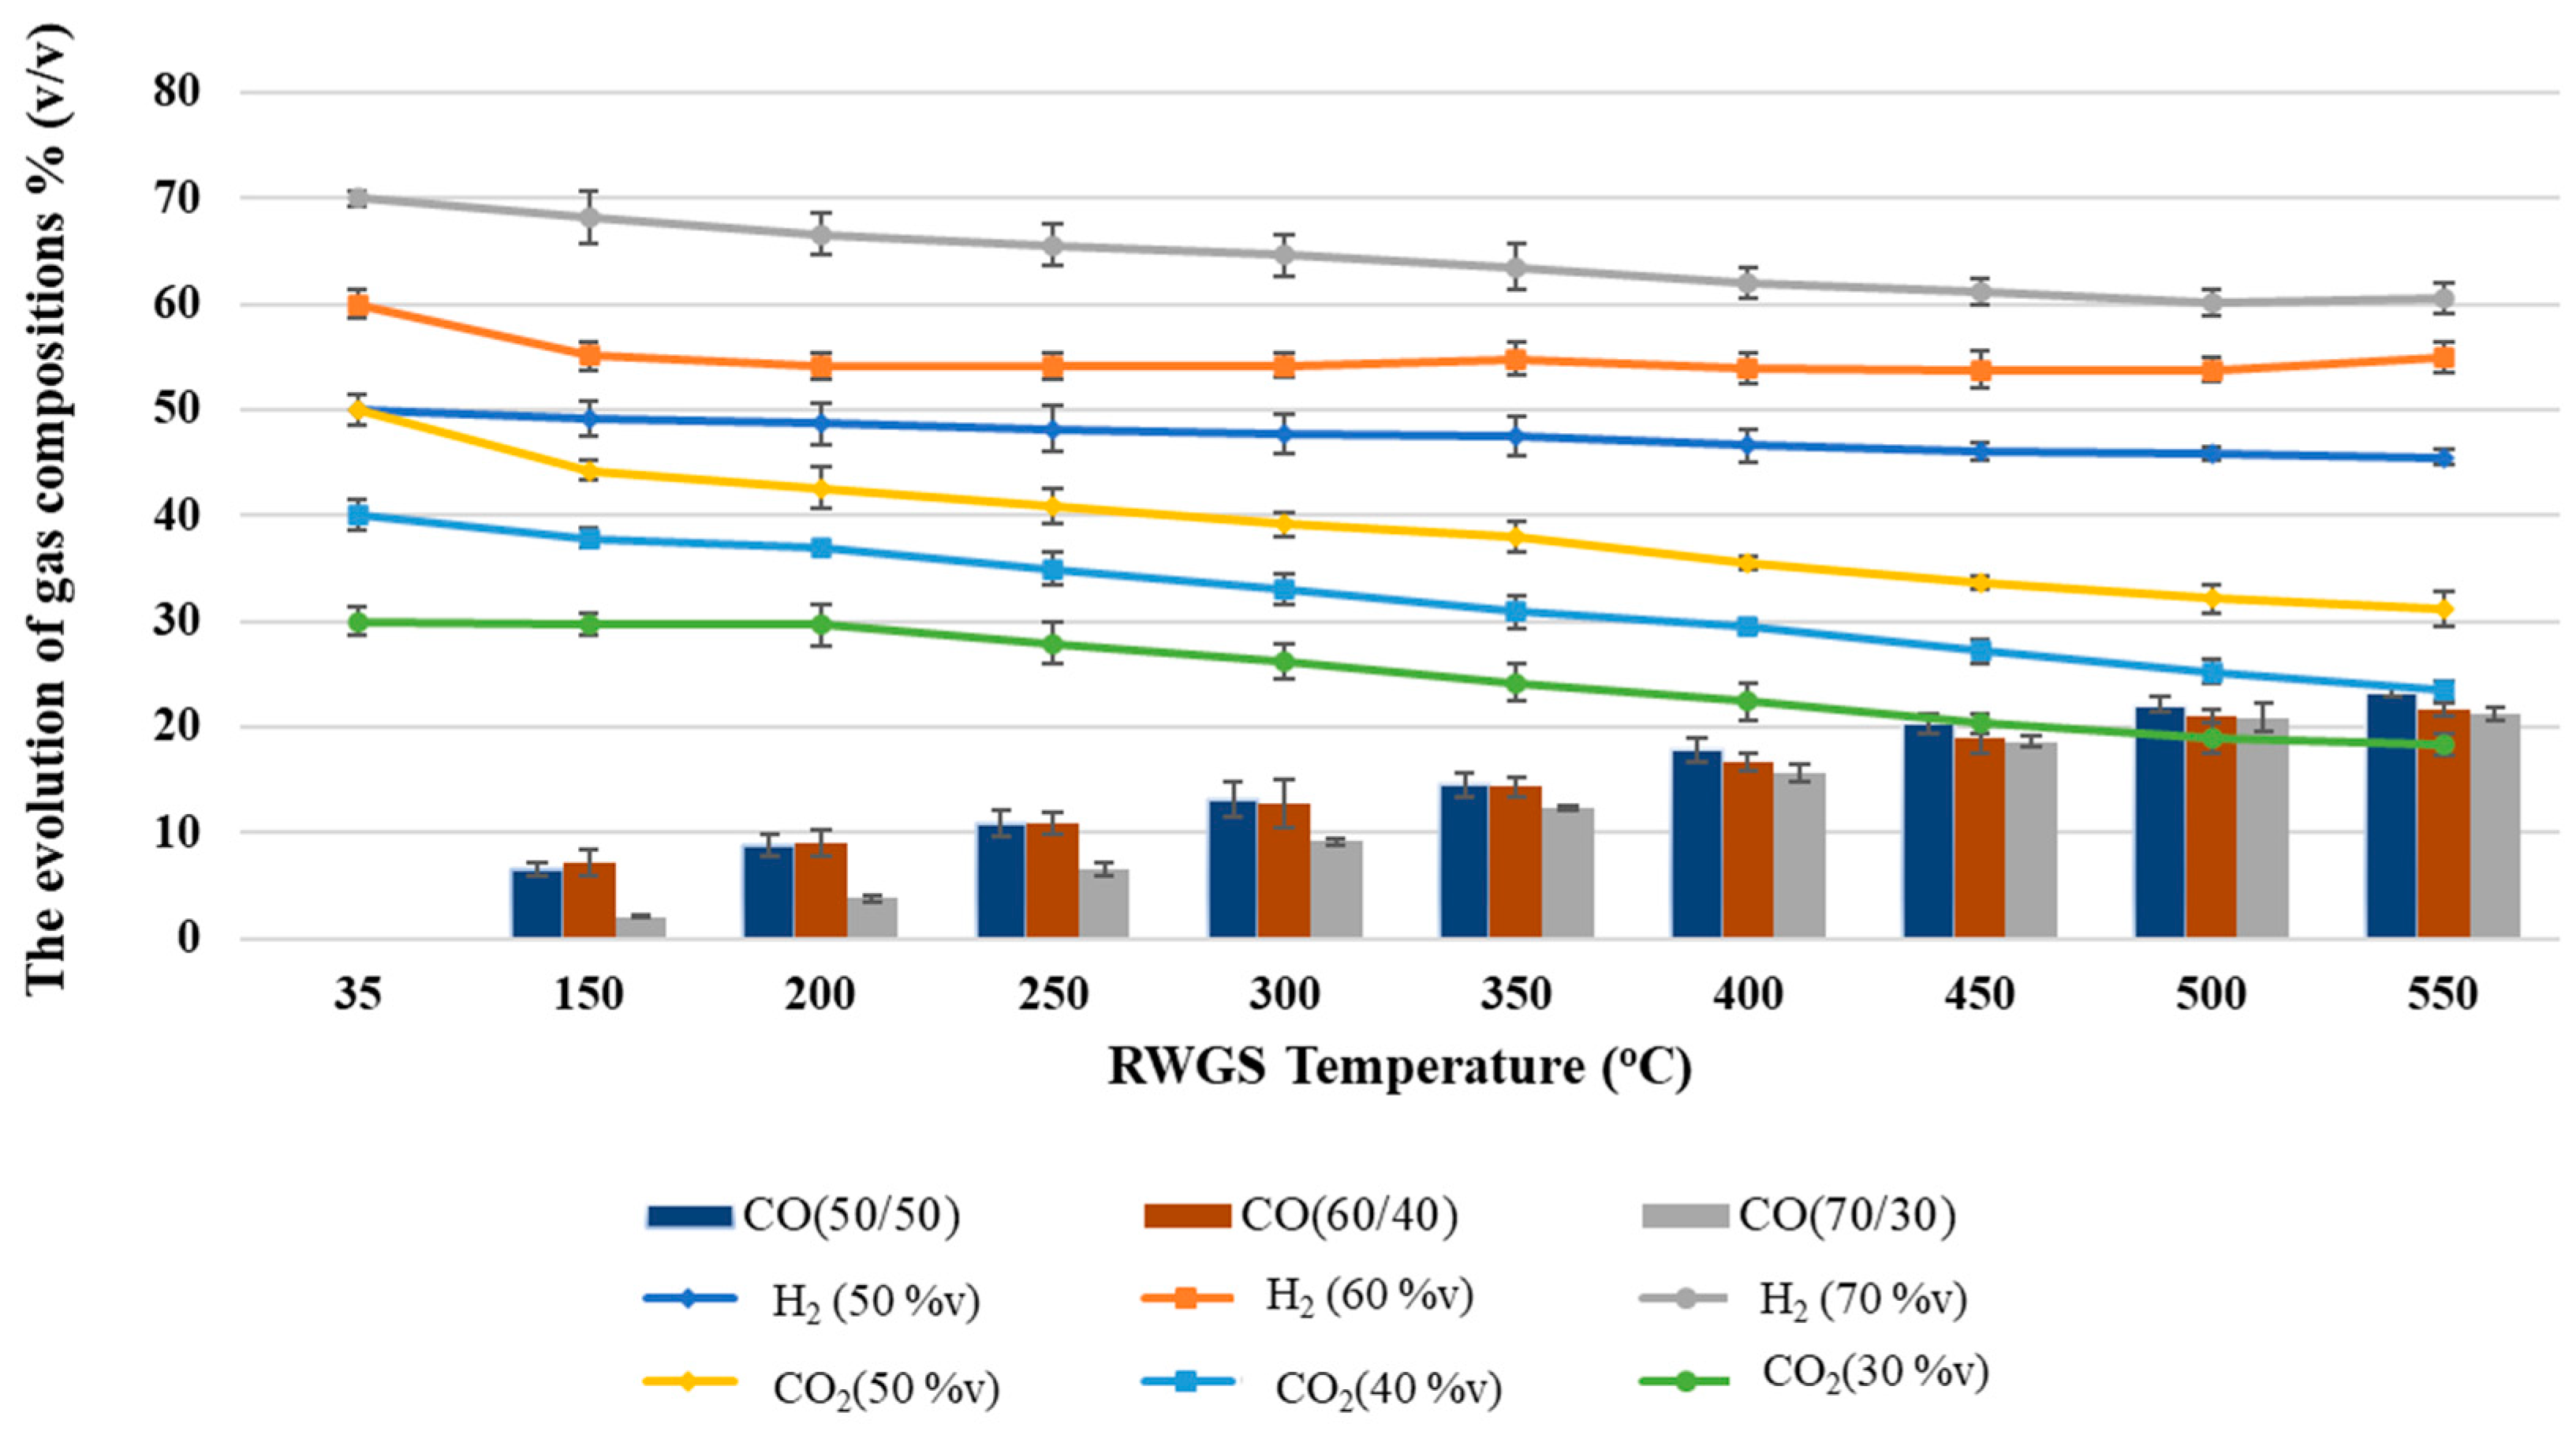
A comparison of the two-step methanol synthesis between pathway 1, DMS (MS + MS), and pathway 2, IMS (RWGS + MS), showed that pathway 2 resulted in lower methanol production rates (g/h) of 0.69, 1.01, and 1.05 than the 0.93, 1.04, and 1.09 obtained via pathway 1, but it resulted in higher average methanol purities % (wt) of 95.81, 97.98, and 92.93 than the purities obtained via pathway 1 (78.69, 79.10, and 72.71). It is apparent that the IMS pathway (adding RWGS before MS) for biohydrogen (H2 and CO2) could improve the purity of the methanol more effectively than the DMS pathway because CO2 was transformed into CO by the RWGS reaction following Equation (3) and limited by the WGS reaction, as in Equation (4). The evolution of CO2 into CO depended on the conditions (CO/CO2 mole ratio, temperature, and pressure). The CO2 was transformed by reacting it with H2, and CO was generated, obtaining the optimum H2/CO ratio of around 2 as the stoichiometry followed Equation (2). These were the optimum conditions for generating high-purity biomethanol (97.98%), as obtained in the experiment with H2/CO2 at 60/40% (v/v). Otherwise, the mole ratio of H2 to CO over 2 was partly caused by the higher ratio of H2/CO2 in the raw gas feed, at 70/30% (v/v), or 2.33/1 (mol/mol); in this case, there was a higher ratio, over 3, for both H2/CO2 (3.74) and H2/CO (3.53). As a result, CO2 hydrogenation (Equation (1)) competed with CO hydrogenation (Equation (2)), and water was generated and mixed with methanol, resulting in the methanol purity being reduced to 92.93%. Therefore, the IMS would be expected to produce a higher methanol yield than DMS.
Although the IMS was beneficial in terms of both methanol purity and CO2 consumption, the RWGS step in IMS was an endothermic reaction that required a higher temperature (500 °C) than that required for the MS step (200 °C); hence, it consumed more energy in methanol production. Last but not least, the overall energy consumption should be studied in greater depth for overall processes, including methanol synthesis and methanol refinery.

5. Conclusions

The focus of this work was on the added value of turning molasses into biohydrogen over biogas for biomethanol synthesis. It was clear that CO2 utilization achieved by adding a small amount of H2 for methanol synthesis would create an opportunity to use molasses to produce biomethanol. Our results reveal that RWGS performed before DMS supported CO hydrogenation, and the transformation of biohydrogen into biomethanol (1) provided higher methanol concentrations, approaching the concentration of commercial methanol (99.9%), (2) necessitated a small refinery, and (3) increased CO2 consumption, which creates an opportunity to apply this knowledge for the management of CO2, called CO2 utilization. Taken together, this novel frontier of the implementation of the RWGS process will better support commercial methanol synthesis.

Author Contributions

Conceptualization, T.H.; Methodology, R.J.; Formal analysis, K.K. and W.P.; Investigation, K.K.; Resources, R.J.; Writing—original draft, K.K.; Writing—review & editing, R.J., W.P. and T.H.; Project administration, T.H. All authors have read and agreed to the published version of the manuscript.

Funding

This research was supported by Silpakorn University Research, Innovation and Creative Fund, and the Department of Mechanical Engineering, Faculty of Engineering and Industrial Technology, Silpakorn University, Thailand.

Data Availability Statement

Not applicable.

Acknowledgments

This research was supported by Silpakorn University Research, Innovation and Creative Fund, and the Department of Mechanical Engineering, Faculty of Engineering and Industrial Technology, Silpakorn University, Thailand. The author also gives special thanks to the Thailand Institute of Scientific and Technological Research (TISTR) for all the support provided.

Conflicts of Interest

The authors declare no conflict of interest.

Nomenclature

%Percent
% (v/v)Percent by volume
% (wt).Percent by weight
°CCelsius
1st MS First methanol synthesis
2nd MSSecond methanol synthesis
Ave. Average
bargBar (guage pressures)
cmCentimeter
CS1Cool separator 1
CS2Cool separator 2
DMEDimethyl ether
DMSDirect methanol synthesis
E.A.Enterobacter aerogenes
gGram
g/LGrams per liter
H2Hydrogen
H2OWater
HPTHigh pressure tank
hHour
IMSIndirect methanol synthesis
kgKilogram
kJ/molKilojoules per mole
LPTLow-pressure tank
MCMolasses concentration
MFBHMass flow of biohydrogen
MFCMass flow of carbon dioxide
MFHMass flow of hydrogen
MFNMass flow of nitrogen
MFSGMass flow of syngas
minMinute
Mol.Molasses
MSMethanol synthesis
MTBEMethyl tertiary butyl ether
MTOMethanol to olefin
MTPMethanol to paraffin
RWGSReverse water–gas shift
RX1Reactor 1
RX2Reactor 2
TAMETert-amyl methyl ether
TETrace elements
Try. Tryptone
TSBSTwo-step biomethanol synthesis
WGSWater–gas shift

References

  1. Kazamia, E.; Smith, A.G. Assessing the environmental sustainability of biofuels. Trends Plant Sci. 2014, 19, 615–618. [Google Scholar]
  2. Hasegawa, F.; Yokoyama, S.; Imou, K. Methanol or ethanol produced from woody biomass: Which is more advantageous? Bioresour. Technol. 2010, 101, S109–S111. [Google Scholar] [CrossRef] [PubMed]
  3. Demirbas, A. Biomethanol Production from Organic Waste Materials. Energy Sources Part A Recovery Util. Environ. Eff. 2008, 30, 565–572. [Google Scholar] [CrossRef]
  4. Verhelst, S.; Turner, J.W.G.; Sileghem, L.; Vancoillie, J. Methanol as a fuel for internal combustion engines. Prog. Energy Combust. Sci. 2019, 70, 43–88. [Google Scholar] [CrossRef]
  5. Dalena, F.; Senatore, A.; Marino, A.; Gordano, A.; Basile, M.; Basile, A. Methanol Production and Applications: An Overview. Methanol 2018, 1980, 3–28. [Google Scholar]
  6. Rashed Al Mamun, M.; Torii, S. Removal of Hydrogen Sulfide (H2S) from Biogas Using Zero-Valent Iron. J. Clean Energy Technol. 2015, 3, 428–432. [Google Scholar] [CrossRef]
  7. Goldemberg, J.; Coelho, S.T.; Guardabassi, P. The sustainability of ethanol production from sugarcane. Energy Policy 2008, 36, 2086–2097. [Google Scholar] [CrossRef]
  8. Ozgur, E.; Mars, A.E.; Peksel, B.; Louwerse, A.; Yucel, M.; Gunduz, U.; Claassen, P.A.M.; Eroglu, I. Biohydrogen production from beet molasses by sequential dark and photofermentation. Int. J. Hydrog. Energy 2010, 35, 511–517. [Google Scholar] [CrossRef]
  9. Rohani, R.; Chung, Y.T.; Mohamad, I.N. Purification of Biohydrogen Produced from Palm Oil Mill Effluent Fermentation for Fuel Cell Application. Korean Chem. Eng. Res. J. 2019, 57, 469–474. [Google Scholar]
  10. Ghimire, A.; Frunzo, L.; Pirozzi, F.; Trably, E.; Escudie, R.; Lens, P.N.L.; Esposito, G. A review on dark fermentative biohydrogen production from organic biomass: Process parameters and use of by-products. Appl. Energy 2015, 144, 73–95. [Google Scholar]
  11. Bakonyi, P.; Nemestothy, N.; Belafi-Bako, K. Biohydrogen purification by membranes: An overview on the operational conditions affecting the performance of non-porous, polymeric and ionic liquid based gas separation membranes. Int. J. Hydrogen Energy 2013, 38, 9673–9687. [Google Scholar] [CrossRef]
  12. Gaikwa, R.; Reymond, H.; Phongprueksathat, N.; Rohr, P.R.V.; Urakawa, A. From CO or CO2?: Space-resolved insights into high-pressure CO2 hydrogenation to methanol over Cu/ZnO/Al2O3. Catal. Sci. Technol 2020, 10, 2763–2768. [Google Scholar] [CrossRef]
  13. Leonzio, G.; Zondervan, E.; Foscolo, P.U. Methanol production by CO2 hydrogenation: Analysis and simulation of reactor performance. Int. J. Hydrogen Energy 2019, 44, 7915–7933. [Google Scholar] [CrossRef]
  14. Ren, M.; Zhang, Y.; Wang, X.; Qiu, H. Catalytic Hydrogenation of CO2 to Methanol: A Review. Catalysts 2022, 12, 403. [Google Scholar]
  15. Alshiyab, H.; Kalil, M.S.; Hamid, A.A.; Yusoff, W.M.W. Trace Metal Effect on Hydrogen Production Using C. acetobutylicum. J. Biol. Sci. 2008, 8, 1–9. [Google Scholar] [CrossRef]
  16. Sarp, S.; Hernandez, S.G.; Chen, C.; Sheehan, S.W. Alcohol Production from Carbon Dioxide: Methanol as a Fuel and Chemical Feedstock. Joule 2021, 5, 59–76. [Google Scholar]
  17. Slotbooma, Y.; Bosa, M.J.; Piepera, J.; Vrieswijka, V.; Likozarb, B.; Kerstena, S.R.A.; Brilman, D.W.F. Critical assessment of steady-state kinetic models for the synthesis of methanol over an industrial Cu/ZnO/Al2O3 catalyst. Chem. Eng. J. 2020, 389, 124181. [Google Scholar] [CrossRef]
  18. Chinchen, G.C.; Denny, P.J.; Parker, D.G.; Spencer, M.S.; Nhan, D.A. Mechanism of methanol synthesis from CO2/CO/H2 mixtures over copper/zinc oxide/alumina catalyst: Use of 14C-labelled reactants. Appl. Catal. 1987, 30, 333–338. [Google Scholar] [CrossRef]
  19. Takagawa, M.; Ohsugi, M. Study on Reaction Rates for Methanol Synthesis from Carbon Monoxide, Carbon Dioxide, and Hydrogen. J. Catal. 1987, 107, 161–172. [Google Scholar] [CrossRef]
  20. Rafiee, A. Modelling and optimization of methanol synthesis from hydrogen and CO2. J. Environ. Chem. Eng. 2020, 8, 104314. [Google Scholar] [CrossRef]
  21. Mcneil, M.A.; Schack, C.J.; Rinker, R.G. Methanol Synthesis from Hydrogen, Carbon Monoxide and Carbon Dioxide over a CuO/ZnO/A12O3 Catalyst. Appl. Catal. 1989, 50, 265–285. [Google Scholar] [CrossRef]
  22. Klier, K.; Chatikavanij, V.; Herman, R.G.; Simmons, G.W. Catalytic Synthesis of Methanol from CO/H, IV. The Effects of Carbon Dioxide. J. Catal. 1982, 74, 343–360. [Google Scholar] [CrossRef]
Figure 1. Ten-liter bioreactor for biohydrogen production.
Processes 11 02425 g001
Figure 2. Gas analyzer (MRU model, Vario luxx).
Processes 11 02425 g002
Figure 3. Two-step methanol synthesis process.
Processes 11 02425 g003
Figure 4. Process flow diagram of the H2/CO2 experiment via pathway 1: MS1 and MS2 in fixed-bed reactor.
Processes 11 02425 g004
Figure 5. Process flow diagram of the H2/CO2 experiment via pathway 2: RWGS1 and MS2 in fixed-bed reactor.
Processes 11 02425 g005
Figure 6. Direct methanol synthesis via CO2 hydrogenation with varying H2/CO2 ratios at a feed flow rate of 1 g/min. The bars represent methanol production (g/h), and the curves represent methanol purity in % by weight.
Processes 11 02425 g006
Figure 7. Changes in gas compositions with varying H2/CO2 ratios, and CO generation when applying different RWGS temperatures at a feed flow rate of 5 g/min.
Processes 11 02425 g007
Table 1. Biohydrogen experimental conditions.
No.ConditionsTotal Gas (L)H2/CO2
1st Batch2nd BatchAve.1st Batch2nd BatchAve.
1.20 g/L Mol. 2, 5 g/L Try 3, TE 1 not added10.509.5010.000.370.330.35
2.20 g/L Mol., 5 g/L Try, 0.01 g/L TE10.0011.0010.501.011.051.03
3.20 g/L Mol., 5 g/L Try, 0.05 g/L TE9.8710.5910.230.360.320.34
4.20 g/L Mol., 5 g/L Try, 0.10 g/L TE9.209.829.510.290.250.27
5.30 g/L Mol., 5 g/L Try, TE not added14.0114.6714.340.430.410.42
6.30 g/L Mol., 5 g/L Try, 0.01 g/L TE31.0031.7231.360.990.950.97
7.30 g/L Mol., 5 g/L Try, 0.05 g/L TE20.4821.3220.900.350.410.38
8.30 g/L Mol., 5 g/L Try, 0.10 g/L TE11.509.3810.440.320.30.31
9.40 g/L Mol., 5 g/L Try, TE not added11.6013.7012.650.530.490.51
10.40 g/L Mol., 5 g/L Try, 0.01 g/L TE26.7027.1426.920.510.490.50
11.40 g/L Mol., 5 g/L Try, 0.05 g/L TE17.1216.6816.900.500.50.50
12.40 g/L Mol., 5 g/L Try, 0.10 g/L TE6.307.466.880.520.480.50
1 TE = trace element, 2 Mol. = molasses, 3 Try = tryptone.
Table 2. Pathway 1: combining 1st MS and 2nd MS at a constant feed flow rate of 5 g/min and H2/CO2 ratio of 50/50 (% v/v).
MS1_MS2 IN1Out1Out2IN1Out1Out2Total
%v (mol/min)%v (mol/min)%v (mol/min)g/ming/ming/ming/min (mol/min)
H250 (0.11)44.17 (0.085)35.59 (0.050)0.230.170.10
CO250 (0.11)45.45 (0.083)62.43 (0.082)4.773.633.590
CO010.38 (0.018)1.98 (0.003)00.510.070
Total gas100 (0.22)100 (0.186)100 (0.134)54.33.770
CH3OH061.7 (0.013)93.29 (0.016)00.430.50.93 (0.029)
H2O038.3 (0.015)6.71 (0.002)00.270.040.31 (0.017)
Total liquid0100 (0.028)100 (0.018)00.70.541.24 (0.046)
CO2 conversion (g/min) 1.18
CO2 consumption (%) 24.71
CH3OH concentration (%) 61.4392.5978.69
H2/CO2 (mol/mol)11.03
H2/CO (mol/mol) 4.7
Table 3. Pathway 1: combining 1st MS and 2nd MS at a constant feed flow rate of 5 g/min and H2/CO2 ratio of 60/40 (% v/v).
MS1_MS2IN1Out1Out2IN1Out1Out2Total
%v (mol/min)%v (mol/min)%v (mol/min)g/ming/ming/ming/min (mol/min)
H260 (0.170)53.52 (0.120)49.02 (0.080)0.340.240.160
CO240 (0.106)36.8 (0.078)49.35 (0.077)4.663.423.390
CO09.67 (0.020)1.63 (0.003)00.550.070
Total gas100 (0.276)100 (0.217)100 (0.160)54.213.630
CH3OH062.2 (0.015)94.16 (0.017)00.490.551.04 (0.033)
H2O037.8 (0.017)5.84 (0.002)00.30.030.33 (0.018)
Total liquid0100 (0.032)100 (0.019)00.790.581.37 (0.051)
CO2 conversion (g/min) 1.27
CO2 consumption (%) 27.32
CH3OH concentration (%) 62.0394.8375.91
H2/CO2 (mol/mol)1.51.54
H2/CO (mol/mol) 6.11
Table 4. Pathway 1: combining 1st MS and 2nd MS at a constant feed flow rate of 5 g/min and H2/CO2 ratio of 70/30 (% v/v).
MS1_MS2IN1Out1Out2IN1Out1Out2Total
%v (mol/min)%v (mol/min)%v (mol/min)g/ming/ming/ming/min (mol/min)
H270 (0.250)64.93 (0.195)63.94 (0.140)0.50.390.280
CO230 (0.102)24.71 (0.070)31.64 (0.065)4.53.062.880
CO010.36 (0.028)4.41 (0.009)00.780.250
Total gas100 (0.352)100 (0.292)100 (0.214)54.233.480
CH3OH063.3 (0.015)80.39 (0.019)00.490.61.09 (0.034)
H2O036.7 (0.016)19.61 (0.008)00.280.150.43 (0.024)
Total liquid0100 (0.031)100 (0.027)00.770.751.52 (0.058)
CO2 conversion (g/min) 1.62
CO2 consumption (%) 36.00
CH3OH concentration (%) 63.6480.0071.71
H2/CO2 (mol/mol)2.332.78
H2/CO (mol/mol) 6.92
Table 5. Pathway 2: combining 1st RWGS + 2nd MS at a constant feed flow rate of 5 g/min and H2/CO2 ratio of 50/50 (% v/v).
RWGS1_MS2IN1Out1Out2IN1Out1Out2Total
%v (mol/min)%v (mol/min)%v (mol/min)g/ming/ming/ming/min (mol/min)
H250 (0.11)37.08 (0.065)18.24 (0.020)0.230.130.040
CO250 (0.11)39.26 (0.067)64.12 (0.067)4.772.962.930
CO023.66 (0.039)17.64 (0.018)01.090.490
Total gas100 (0.22)100 (0.171)100 (0.104)54.183.460
CH3OH0095.81 (0.022)000.690.69 (0.022)
H2O0100 (0.046)4.19 (0.002)00.820.030.85 (0.047)
Total liquid0100 (0.046)100 (0.024)00.820.721.54 (0.069)
CO2 conversion (g/min) 1.84
CO2 consumption (%) 38.61
CH3OH concentration (%) 095.8195.81
H2/CO2 (mol/mol)11
H2/CO (mol/mol) 1.73
Table 6. Pathway 2: combining 1st RWGS + 2nd MS at a constant feed flow rate of 5 g/min and H2/CO2 ratio of 60/40 (% v/v).
RWGS1_MS2 IN1Out1Out2IN1Out1Out2Total
%v (mol/min)%v (mol/min)%v (mol/min)g/ming/ming/ming/min (mol/min)
H260 (0.170)51.23 (0.095)32.01 (0.025)0.340.190.050
CO240 (0.106)26.73 (0.046)61.15 (0.045)4.662.011.990
CO022.05 (0.036)6.84 (0.005)01.010.140
Total gas100 (0.276)100 (0.177)100 (0.075)53.212.180
CH3OH0097.98 (0.032)001.011.01 (0.032)
H2O0100 (0.099)2.02 (0.001)01.790.021.81 (0.001)
Total liquid0100 (0.099)100 (0.033)01.791.031.54 (0.069)
CO2 conversion (g/min) 2.67
CO2 consumption (%) 57.25
CH3OH concentration (%) 097.9897.98
H2/CO2 (mol/mol)1.492.03
H2/CO (mol/mol) 2.56
Table 7. Pathway 2: combining 1st RWGS + 2nd MS at a constant feed flow rate of 5 g/min and H2/CO2 ratio of 70/30 (% v/v).
RWGS1_MS2IN1Out1Out2IN1Out1Out2Total
%v (mol/min)%v (mol/min)%v (mol/min)g/ming/ming/ming/min (mol/min)
H270 (0.250)62.68 (0.115)57.54 (0.045)0.50.230.090
CO230 (0.102)17.7 (0.030)40.1 (0.029)4.51.331.260
CO019.62 (0.032)2.36 (0.002)00.90.050
Total gas100 (0.352)100 (0.177)100 (0.075)52.461.330
CH3OH0092.93 (0.033)001.051.05 (0.033)
H2O0100 (0.141)7.07 (0.004)02.540.082.62 (0.146)
Total liquid0100 (0.141)100 (0.037)02.541.133.67 (0.178)
CO2 conversion (g/min) 3.24
CO2 consumption (%) 72.02
CH3OH concentration (%) 092.9392.93
H2/CO2 (mol/mol)2.333.74
H2/CO (mol/mol) 3.53
Disclaimer/Publisher’s Note: The statements, opinions and data contained in all publications are solely those of the individual author(s) and contributor(s) and not of MDPI and/or the editor(s). MDPI and/or the editor(s) disclaim responsibility for any injury to people or property resulting from any ideas, methods, instructions or products referred to in the content.

