1. Introduction
Using natural, renewable, and environmentally friendly materials is becoming an increasingly important aspect of activity in every area of life, especially in science. Examples of such materials are natural polymers such as chitin, cellulose, or soy protein, which are of interest to engineers and bioengineers, not only because of their origin but also due to their unique properties. They are biodegradable, relatively easy to obtain, exhibit bacteriostatic properties, are biocompatible as biomaterials, and have a high water content and good mechanical strength. Due to their chain structure, they are also subject to the process of defibrating, including nanofibers, which means that their application possibilities are numerous. Due to their size, high ratio of surface area to volume, and the ability to penetrate cell membranes, nanofibers are often used in bioengineering, catalytic processes, separation processes, and many other industrial areas. If the nanofiber surface is additionally modified, e.g., by immobilizing drug particles, sorbents, enzymes, etc., the application potential of nanomaterials will be even greater.
Natural polymers, particularly proteins, seem to be suitable objects for surface modification due to the numerous and diverse chemical groups, with different properties, present in the chain. Therefore, there is a question of producing nanofibers from them and giving them the appropriate, desired properties, either at the stage of defibering (in situ) or after. Electrospinning is the most common and best-known method of producing nanofibers from natural polymers. For example, ref. [
1] obtained nanofibers with an average diameter ranging from 88 nm to 131 nm from chitosan solved in acetic acid, while [
2] produced zein fibers with an average diameter of 700 nm from an 80% ethanol solution. It is possible to produce fibers from corn, soybean, gluten, casein, silk, gelatin, albumin, and many other natural polymers with the use of a high voltage, properly selected solvent, and process parameters [
3]. Other methods that allow the production of fibers, but not always nanofibers, from natural polymers are wet spinning, dry spinning, centrifugal spinning, and, the least known, blow spinning [
4].
Blow spinning creates nanofibers by blowing the polymer in the solution through a thin nozzle in an airflow axis under pressure. Due to the lack of the need to apply high voltage, it is safer than electrospinning but is more sensitive to the process, environmental, and polymer solution parameters. There is also little data on producing natural polymer fibers using this method. However, it has been successfully used to make fibers/membranes from polyvinyl chloride, nylon-6, poly (lactic acid), poly (d, l-lactic acid), as well as from poly (ethylene oxide), soy protein/nylon-6, and soy protein/poly (ethylene oxide) [
5,
6,
7]. The most common solvents are formic acid, ethanol, chloroform, and acetone mixed in appropriate proportions and, occasionally, (for poly (ethylene oxide)) water.
Moreover, blow spinning allows for obtaining fibers from natural polymers, including proteins, without losing their properties. The blow spinning method is sensitive to the process, environment, and prepared polymer solution parameters, which, on the one hand, makes it difficult to use, and on the other hand, gives the possibility of producing fibers from natural polymers, provided that the optimal set of parameters is selected.
The main parameters influencing the SBS fiber manufacturing process are:
- -
Feed rate: When the feed rate increases, the fiber diameter and its distribution also increase; high feed rates may lead to nozzle blocking, while a low feed rate may cause jet instability;
- -
Gas flow pressure: When the air pressure increases, the fiber diameter decreases because the solvent evaporation rate increases;
- -
Distance from the nozzle to the collector: When the distance from the nozzle to the collector decreases, the time to solvent evaporation decreases; thus, the fibers reach the collector in the wet state. In addition, the distance of the nozzle from the collector affects the porosity of the obtained fibrous structure, which significantly affects the properties of the material received;
- -
Polymer concentration and solution characterization: When the polymer concentration decreases (the viscosity also decreases), the fiber diameter decreases due to the higher mobility of the polymer chains in the jet during the blowing process [
8].
Other critical parameters that influence the solution blow method are temperature and humidity. However, there is no systematic work showing their clear impact. It can be expected that with increasing temperature and humidity, the ability to make fibers will decrease because of the slower evaporation of the solvent.
The influence of the parameters on the polymer solution-blowing process shows a similar tendency for most of the tested polymers used in this method: polyvinylidene fluoride {PVDF}, poly (ethylene oxide) {PEO}, and poly (ethylene-co-vinyl acetate) {EVA} [
9].
Natural polymers are used relatively rarely in the solution blow method. Although, in the work [
10,
11,
12], monolithic fibers were blown from blends of soy protein and nylon-6 in formic acid, and [
6] created nanofibers 0.52 ± 0.16 μm in diameter using a solution of soy protein and PEO in water.
However, one of the most significant disadvantages of the solution blow method is the high amount of organic solvent used, which must be evaporated during blow spinning. The lower the concentration of the polymer solution (the higher the amount of organic solvent), the thinner the diameter of the fibers is. If, under the appropriate conditions, a water solution can be used in the solution blow method, it becomes possible to elaborate on the “environmentally friendly” aspect of the procedure for the production of natural/protein for various applications. The solution blow method is also more “flexible” for various modifications as it is more compatible with different solvents (compared to, for example, electrospinning), which is very important because it eliminates the need to use high voltages.
Natural/protein nanofibers are widely used in the biomedical and engineering fields. As a result of the enzymatic decomposition of organisms, they decompose into non-toxic and harmless compounds that the body can reabsorb. They can be used as drug carriers without losing their activity, and their mixing with other polymers enables the production of materials with appropriate properties and controlled biodegradation [
13,
14]. Moreover, in separation applications, the presence of nanofibers plays a crucial role in improving filtration efficiency.
Therefore, this study aimed to produce fibers from an aqueous, and hence environmentally friendly, solution containing as much soy protein as possible through the safe method of polymer solution blowing.
3. Results and Discussion
Obtaining fibers from blowing polymer in an aqueous solution is not practical due to water’s much lower volatility than the organic solvents typically used in blowing a polymer solution. PEO is a well-known water-soluble polymer that can be made into fibers by solution blowing. That is why the aqueous solution of PEO was treated as a reference solution.
3.1. PEO Fibers
The water solution of PEO with different concentrations was first subjected to rheological analysis. Flow curves and loss and storage modulus were also determined.
In the polymer solution-blowing process, there is a smooth transition from simple shear in the nozzle channel to uniaxial stretching of the polymer stream. The formation of a polymer stream is associated with the appearance of forces stretching the fluid. Thus, the extensional viscosity (which differs from the dynamic viscosity in the fluid flow mechanism) plays an essential role in the process. The extensional viscosity is a function of the stretching rate, while the dynamic viscosity is a function of the shear rate. The extensional viscosity increases as the longitudinal velocity gradient increases, facilitating spinnability.
While for Newtonian fluids, the extensional viscosity is about 3 times higher than the dynamic viscosity, for non-Newtonian fluids, particularly for polymer solutions, the extensional viscosity can be up to 1000 times higher than the dynamic viscosity. Additionally, the same fluid in a specific range of the deformation rate can be thinned by stretching, and in another range of the deformation rate, it can be thickened by stretching.
However, extensional viscosity measurements are difficult due to problems with maintaining a constant value of the sample’s tensile rate or tensile stress. Therefore, in this study, we decided to base the apparent viscosity of the polymer solution on the initial value just before the process of forming the polymer stream at the exit of the nozzle.
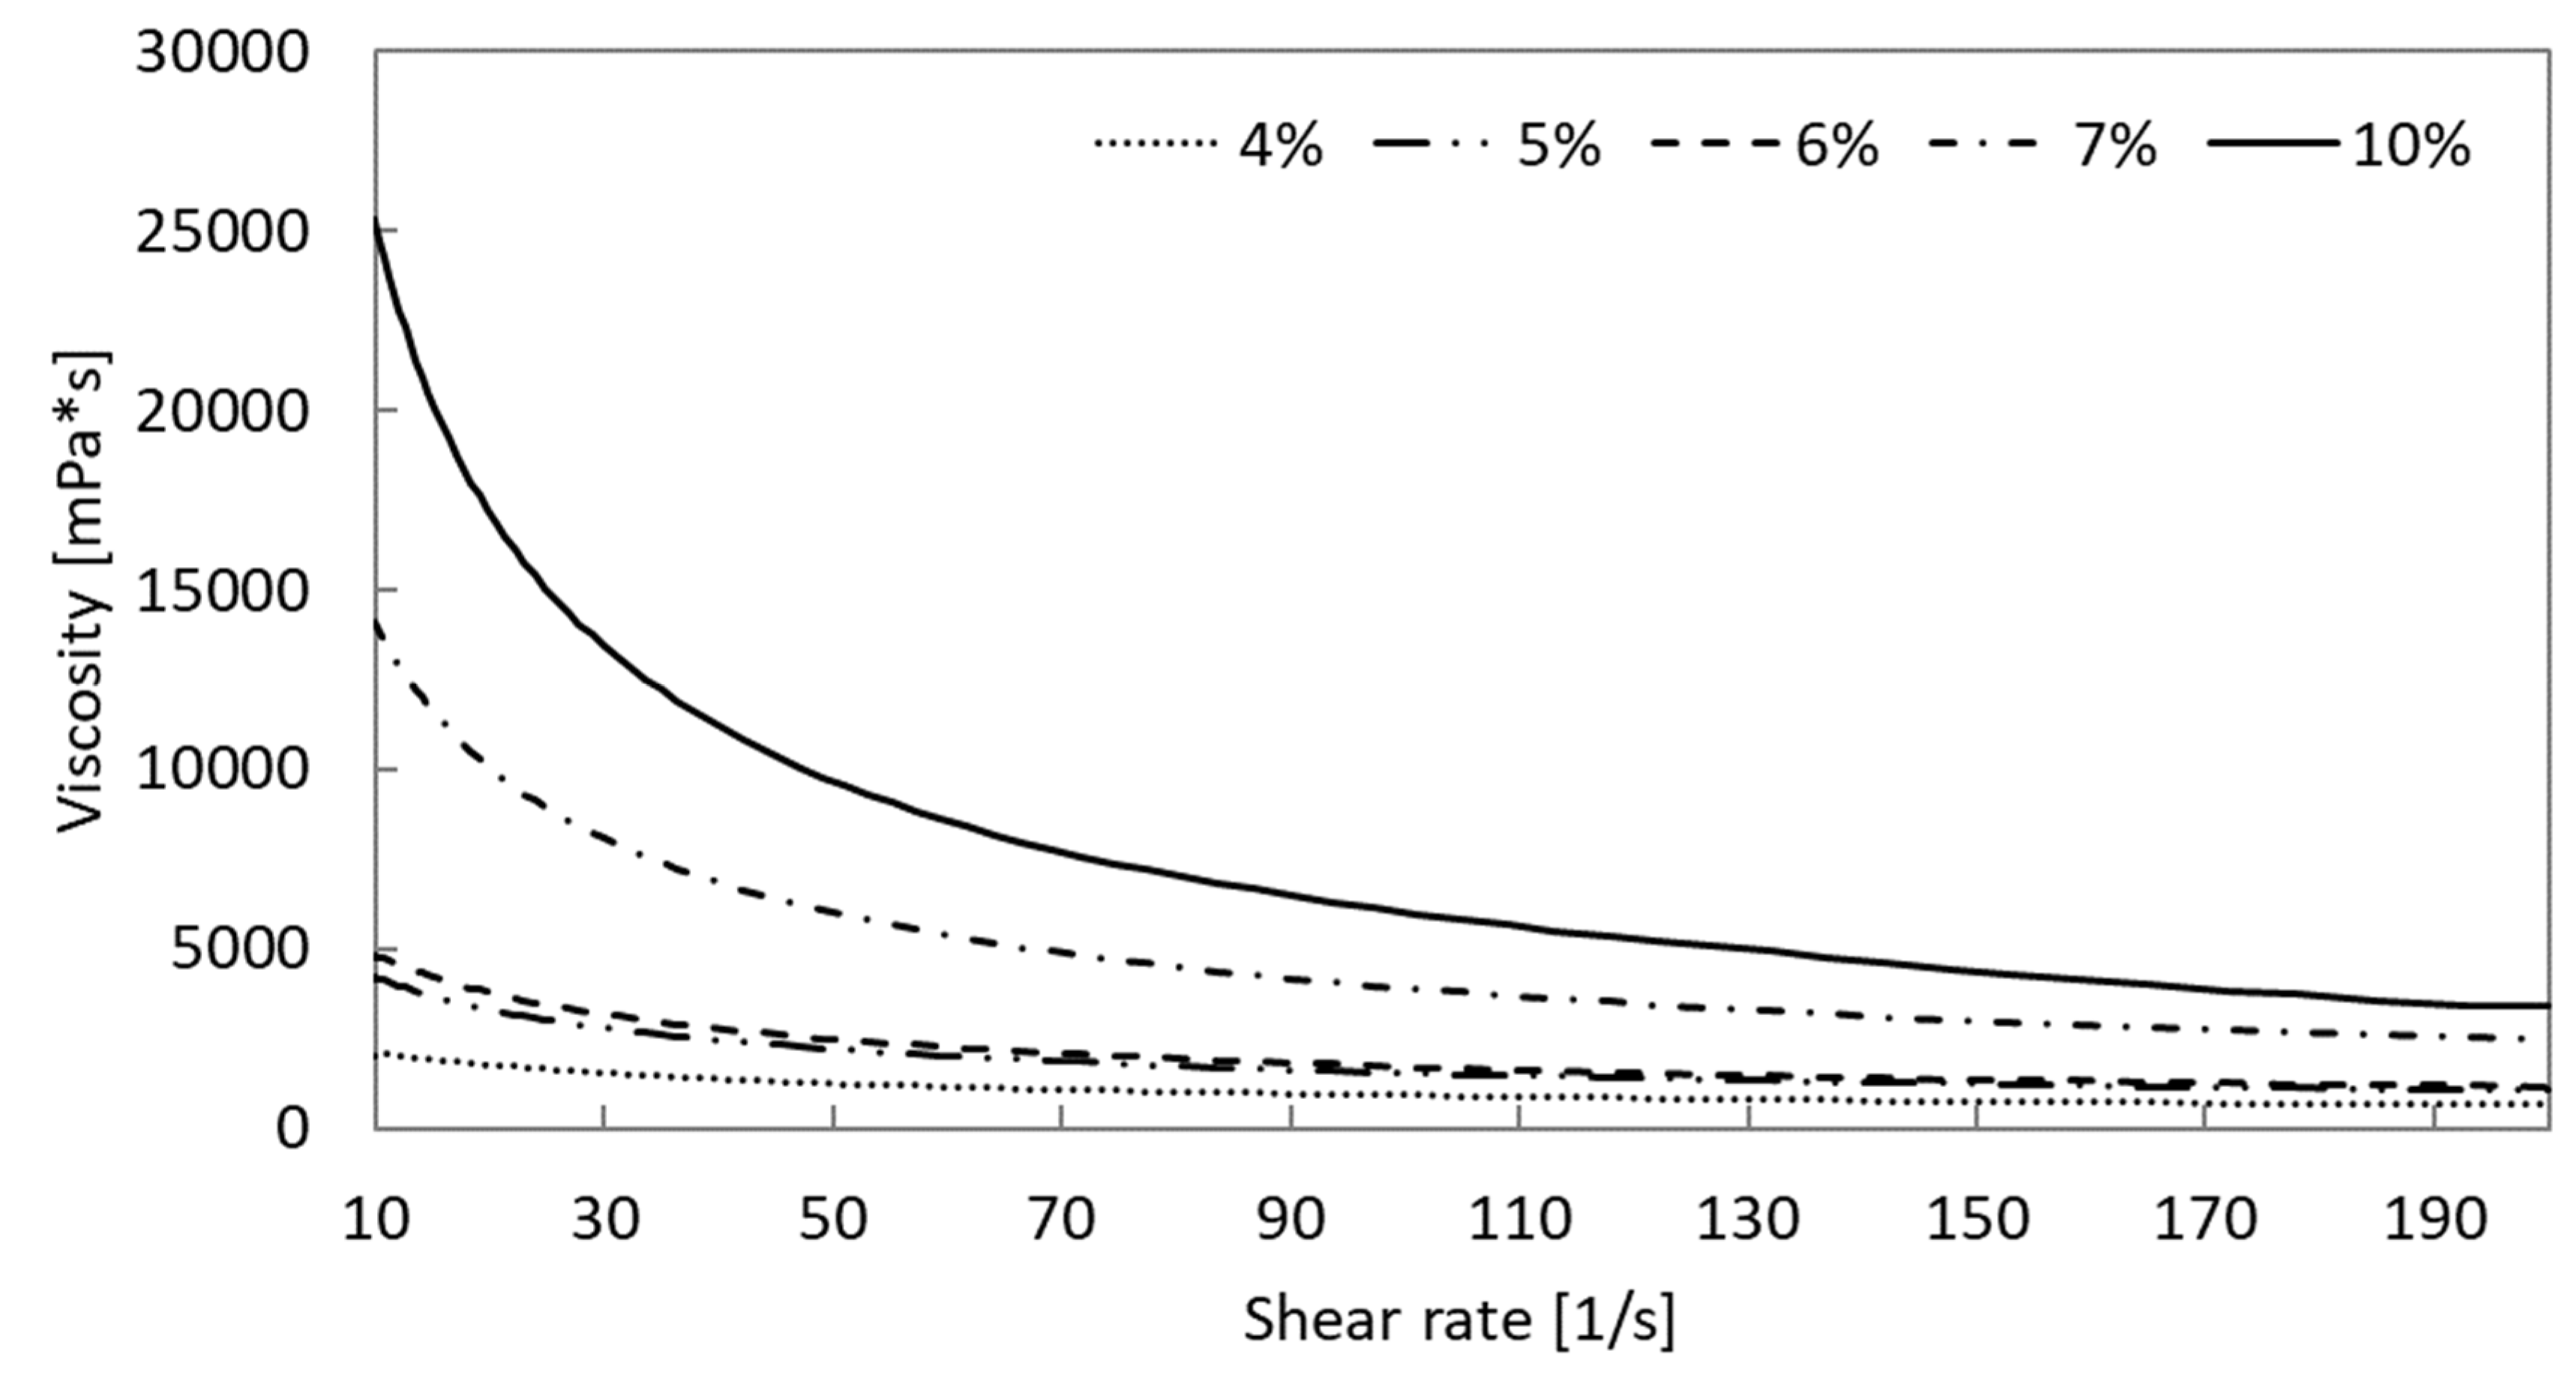
A wide range of concentrations of the aqueous PEO solution from 4% to 10% was tested. Our earlier experiments showed that PEO fibers can be obtained by the blow spinning of a PEO solution in a range of concentrations from 5% to 10%. The obtained values of apparent viscosity as a function of the shear rate are shown in
Figure 1. The aqueous solution of PEO is a shear-thinning fluid and its apparent viscosity increases with increasing polymer concentration.
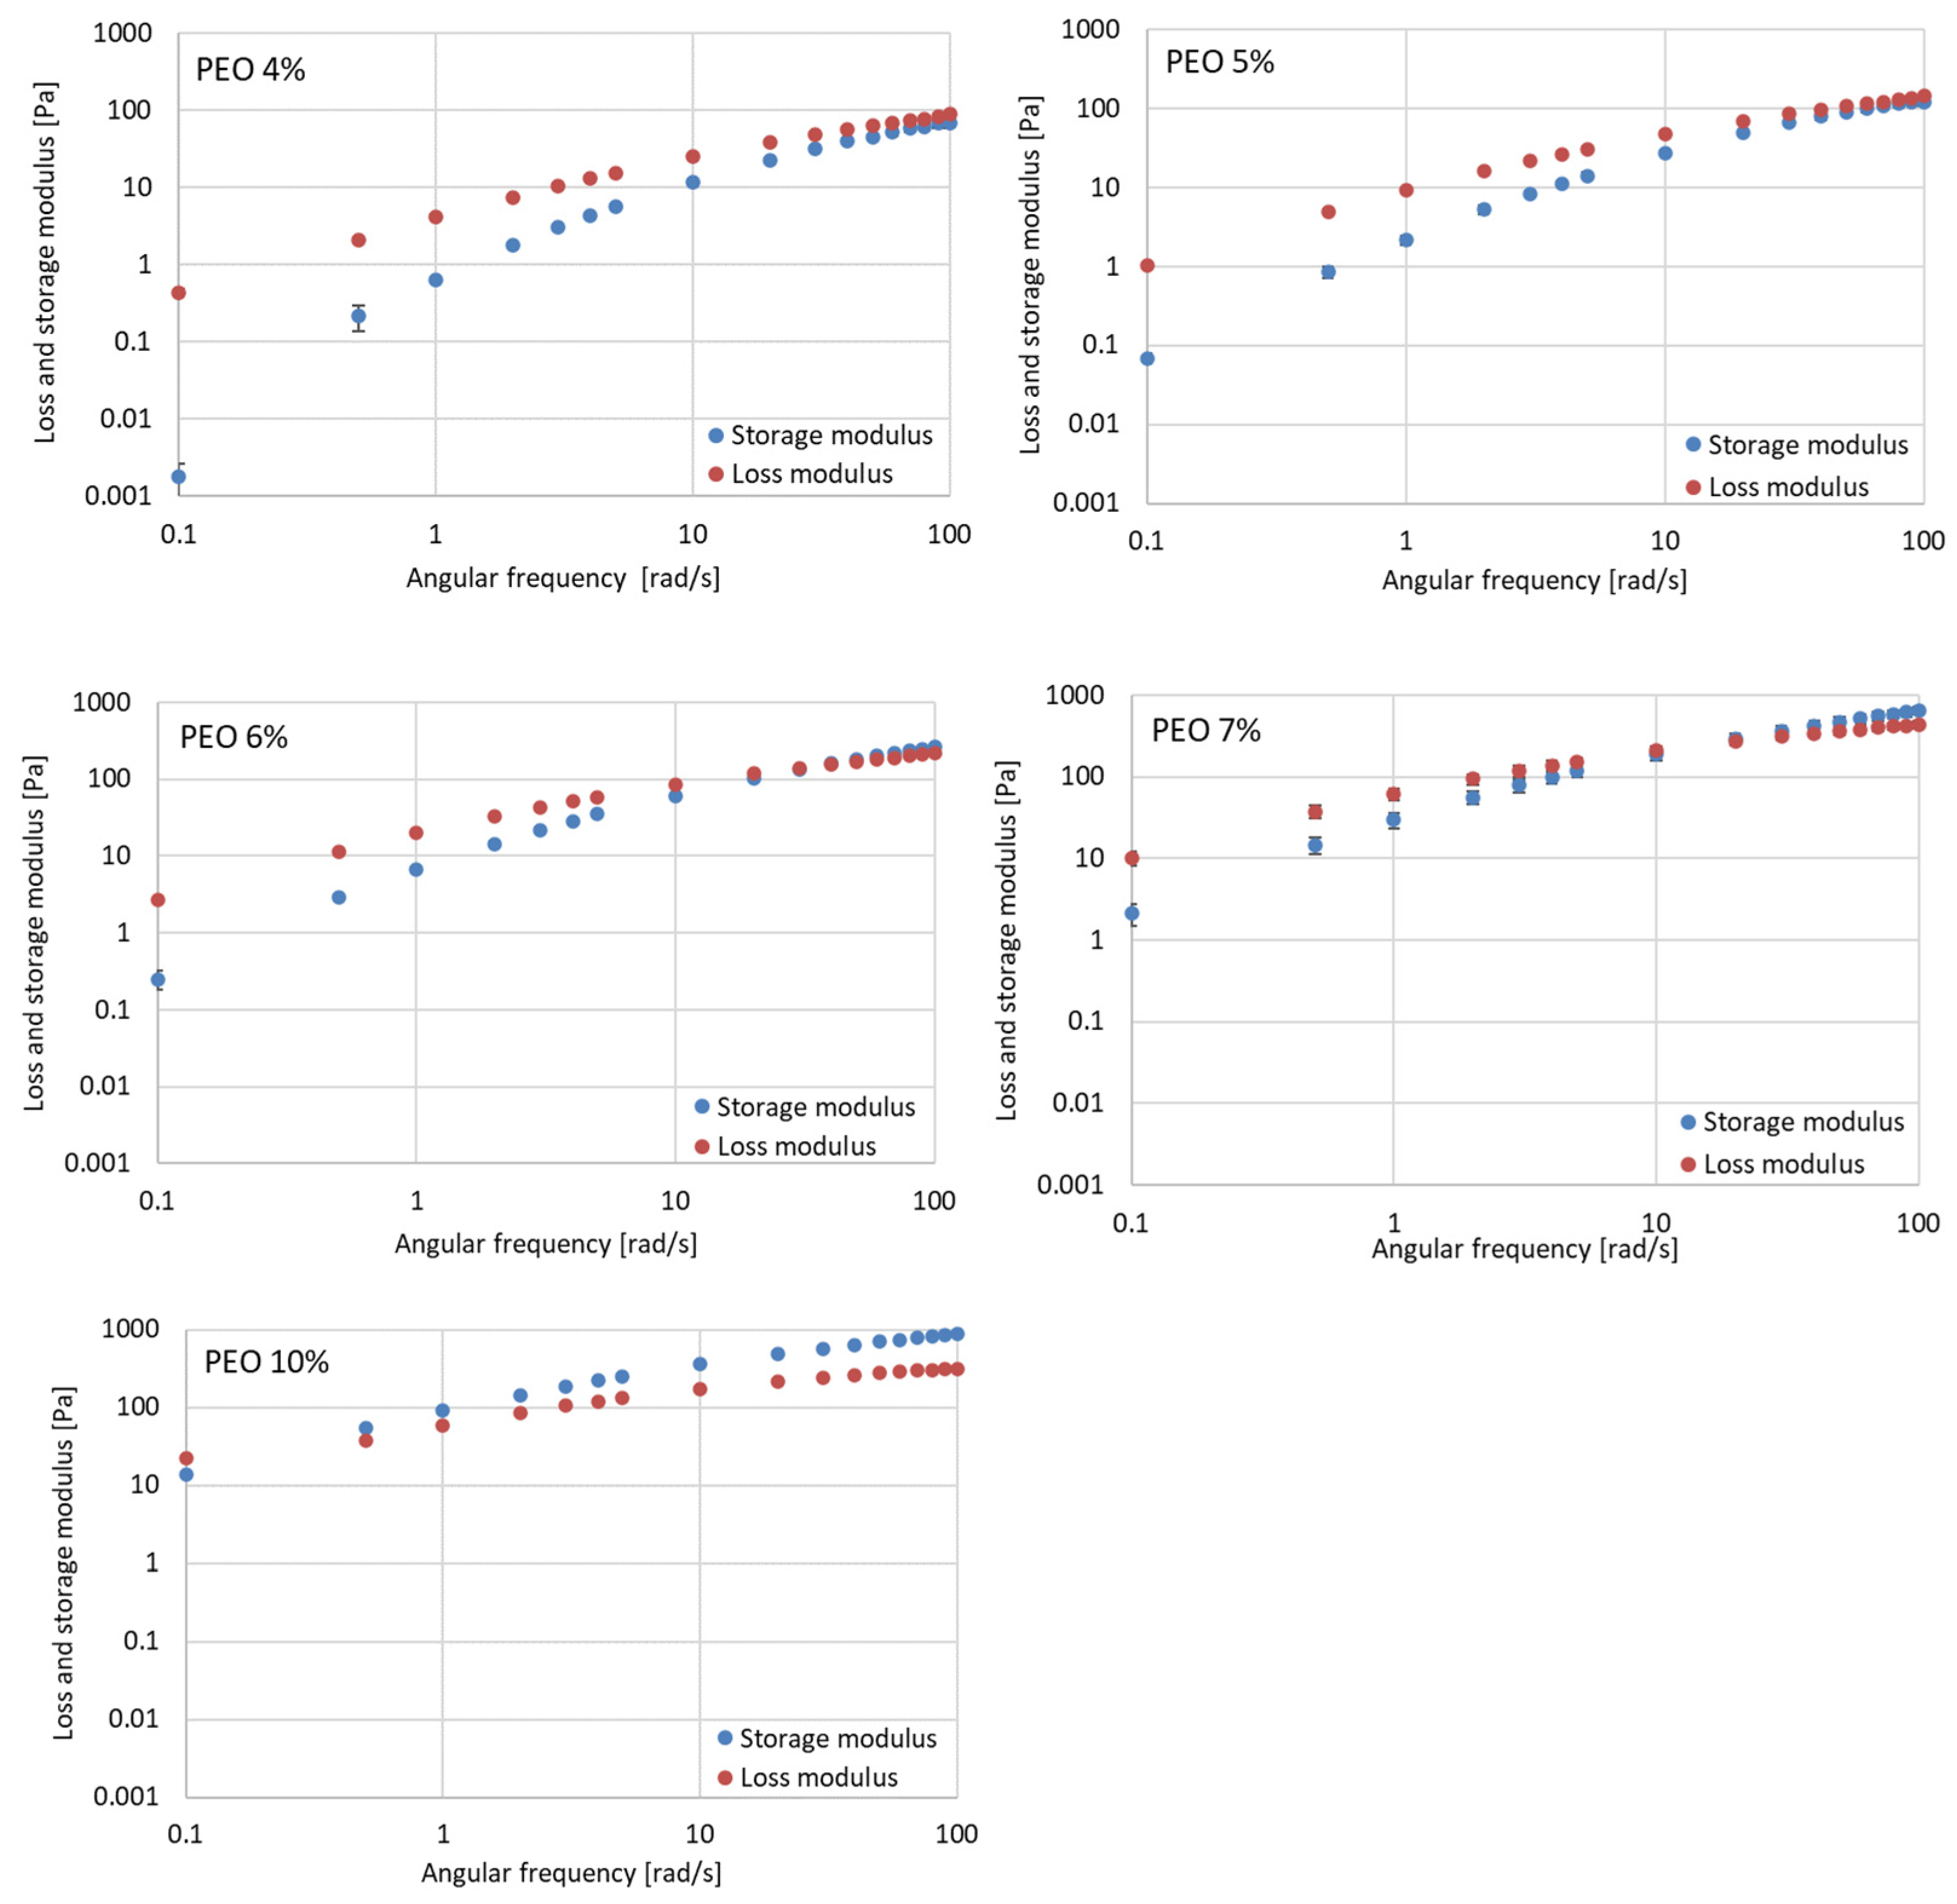
The obtained values of the loss modulus and the storage modulus for the analyzed PEO concentrations are shown in
Figure 2.
An increase in the polymer concentration increases the loss modulus and storage modulus, which is as expected. The loss modulus exceeds the storage modulus for the 4% and 5% PEO concentrations. This means that the PEO solutions behave like viscous fluids in which the polymer’s chains are not tangled. The distance between the modulus values decreases for higher angular frequencies, which may indicate the beginning of the transition from a viscous material to an elastic material. Increasing the polymer concentration causes a gradual change in the properties of the polymer solution from a viscous fluid to an elastic fluid. This change is visible through the appearance of the intersection of the values of the loss modulus and the storage modulus for PEO concentrations at levels of 6% and 7%. The higher the concentration, the lower the angular frequency values at which the intersection appears. For the highest concentrations of PEO (10%), the storage module dominates, which means that the material exhibits elastic properties.
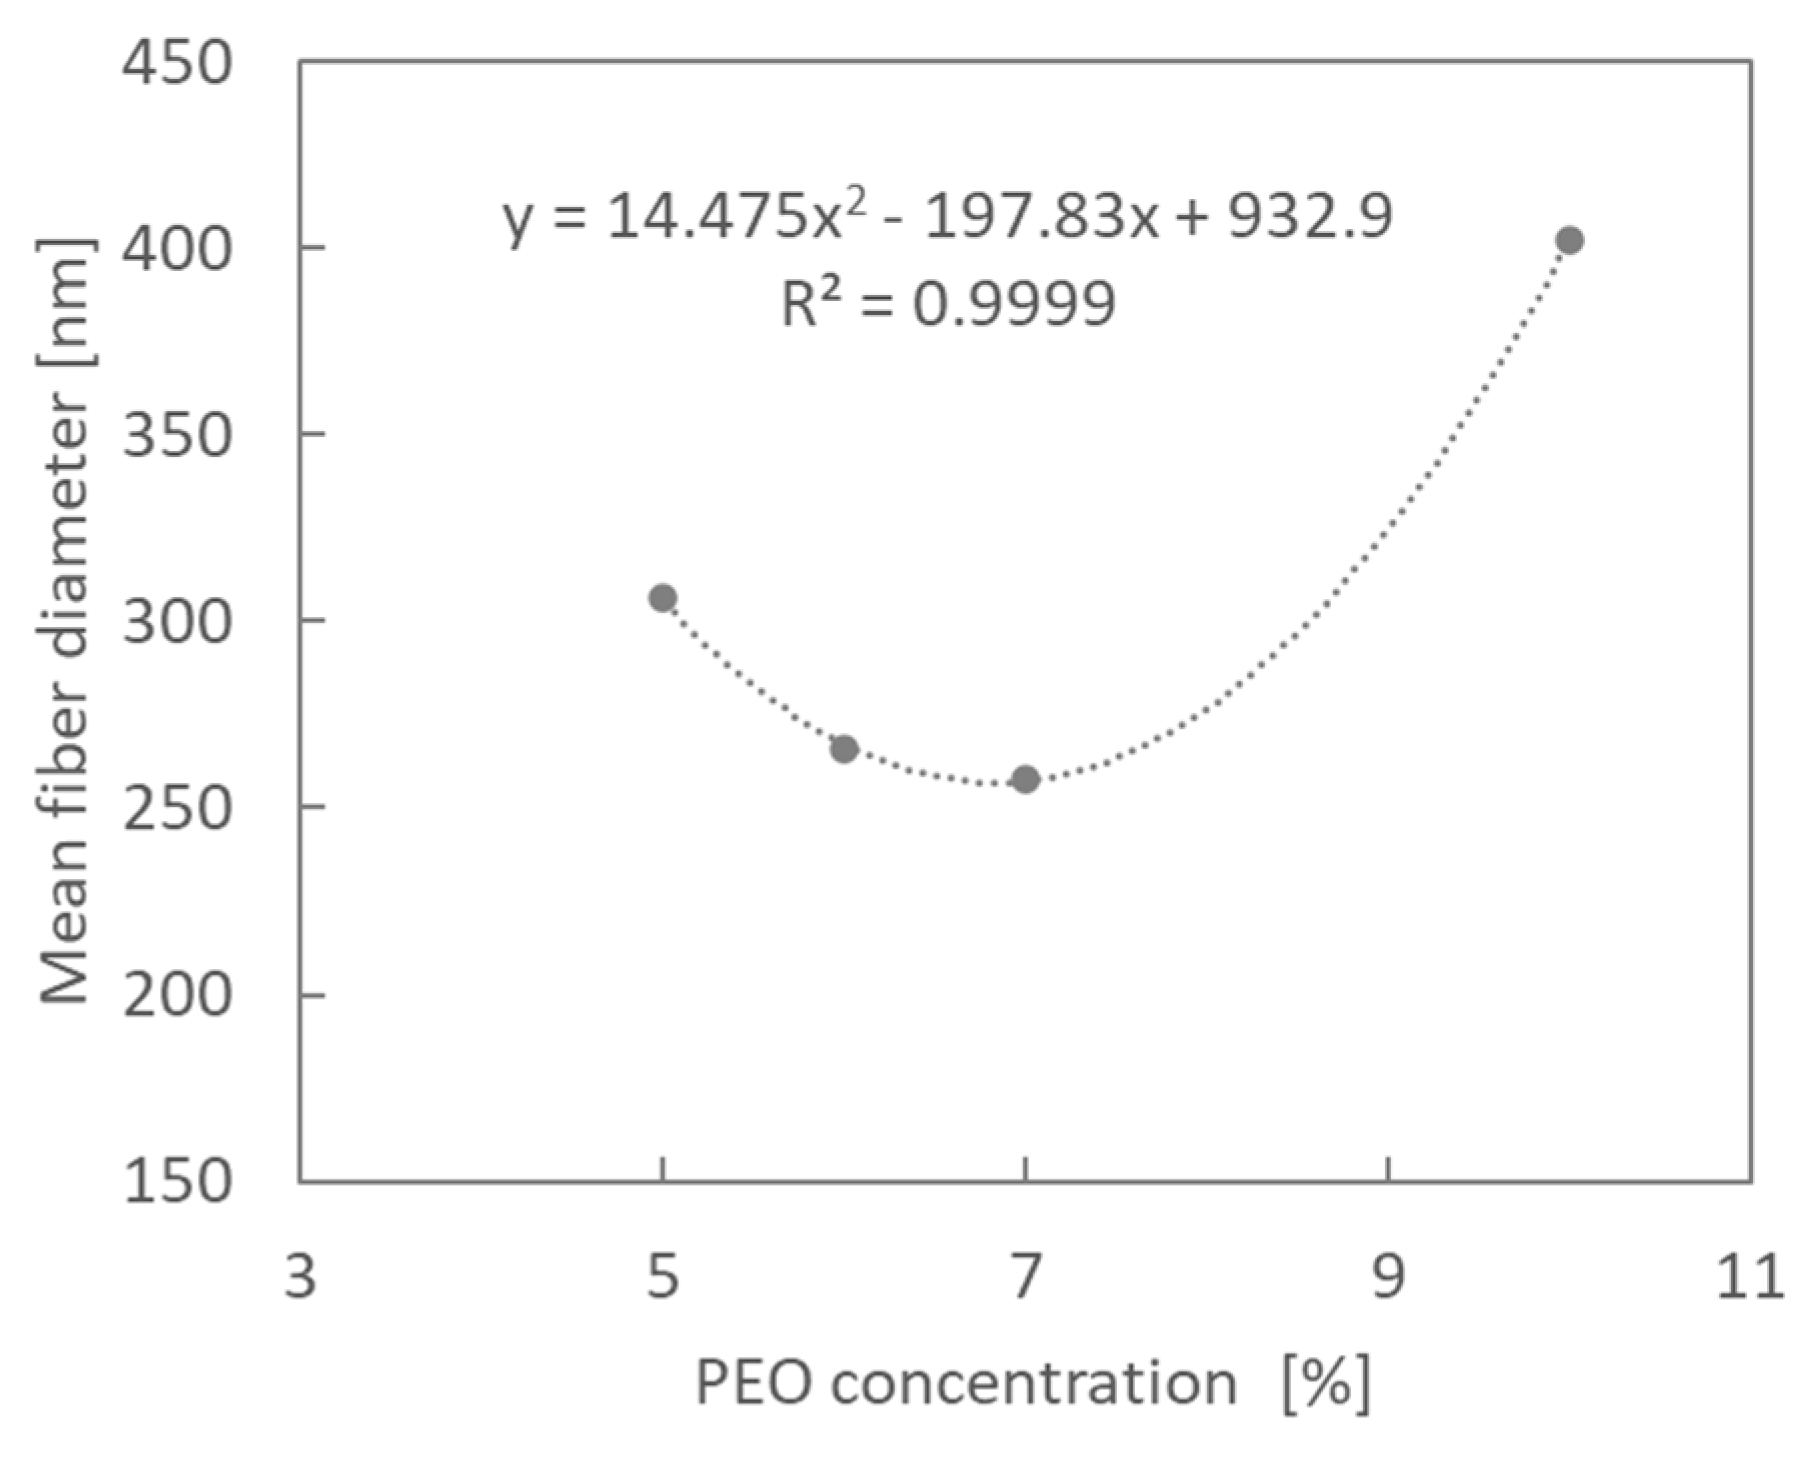
Regarding the process of polymer solution blowing, at a polymer flow rate of 0.008 mL/min, compressed air pressure of 0.5 bar, and after 15 min of blowing, fibers were obtained from the 5, 6, 7, and 10% PEO solutions. No fibers were obtained from the 4% PEO solution. The average fiber diameters obtained as a function of polymer concentration are shown in
Figure 3.
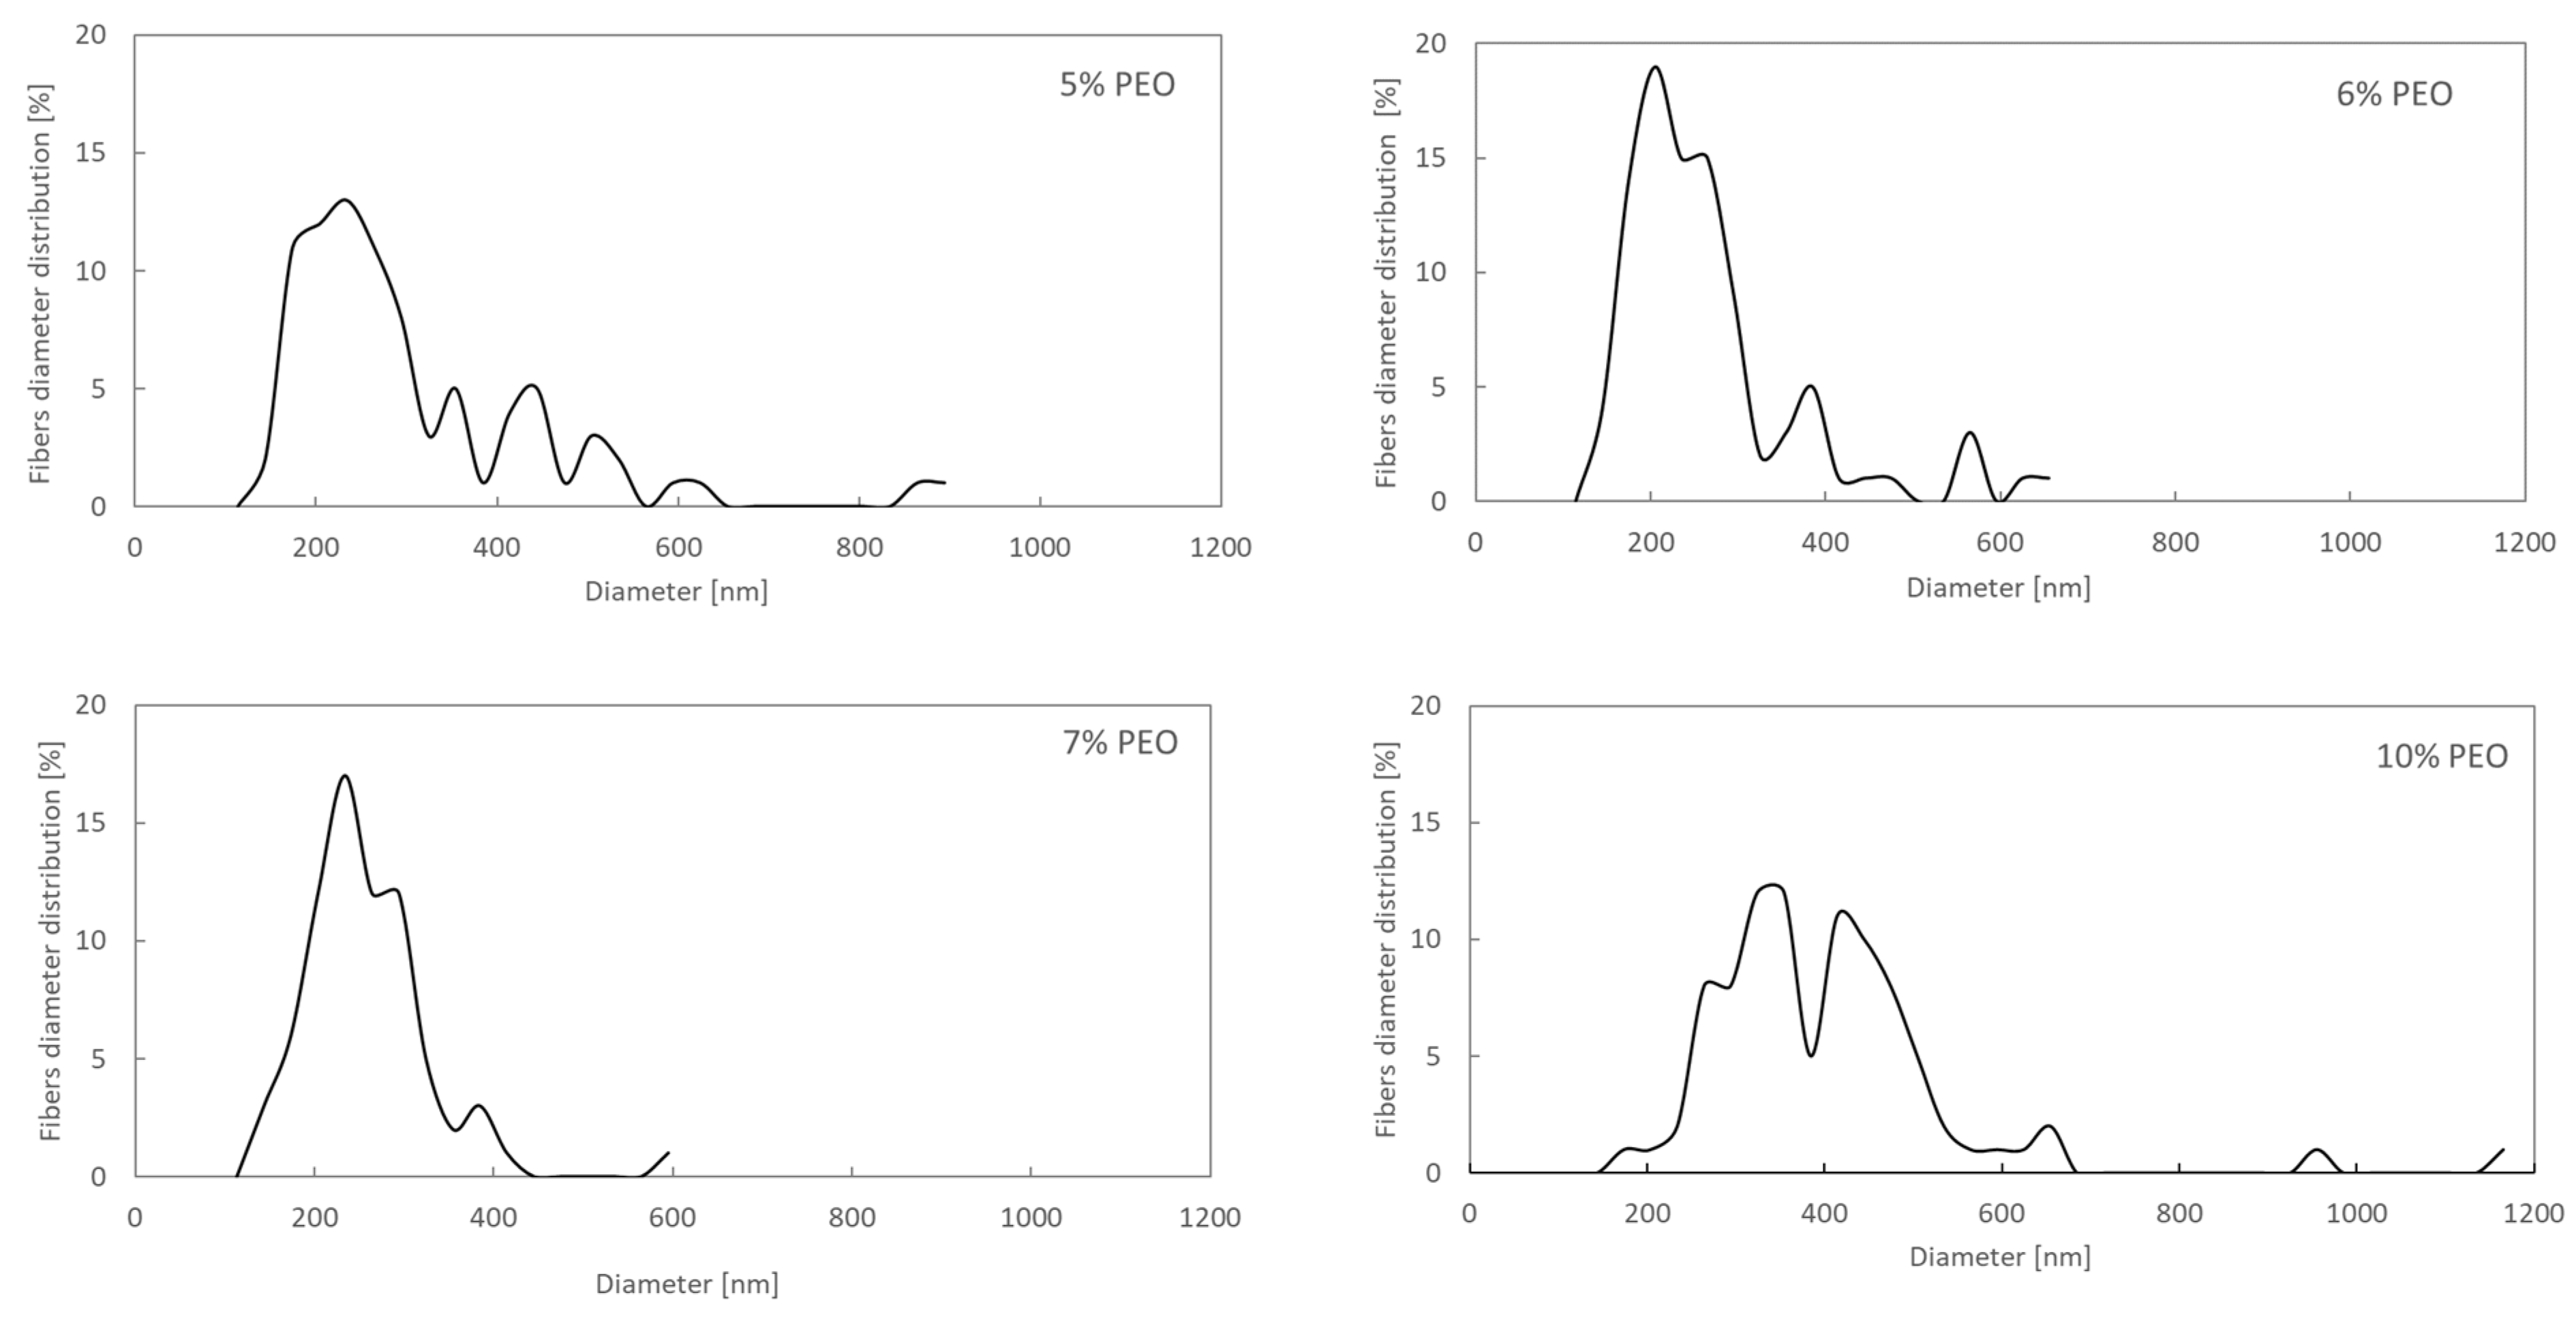
Figure 4 shows the fiber diameter distributions.
The increase in the concentration of the polymer in the solution, due to the greater entanglement of the polymer chains, leads to an increase in the apparent viscosity and an increase in the values of the loss and storage modulus. Increasing viscoelastic forces suppress the shear and tensile forces generated during fiber formation. Therefore, an increase in the average fiber diameter should be observed with increasing polymer concentration [
17]. This effect can be observed by comparing the average fiber diameters of a solution with a concentration of 5% PEO and 10% PEO. These solutions exhibit either viscous (5% PEO) or elastic (10% PEO) properties. For solutions of 6% PEO and 7% PEO, for which a transition from a viscous to elastic character is observed, the average diameter of the fiber is lower than for the 5% PEO solution. However, explaining the nature of this phenomenon requires further analysis, which is beyond the scope of this study. Nevertheless, the average fiber diameters are comparable to those obtained by [
18], although the researchers used more volatile liquids (chloroform, acetone, and dichloromethane) as solvents, however, they are much smaller than the diameters obtained from aqueous PEO solutions [
17].
3.2. SPI Solution
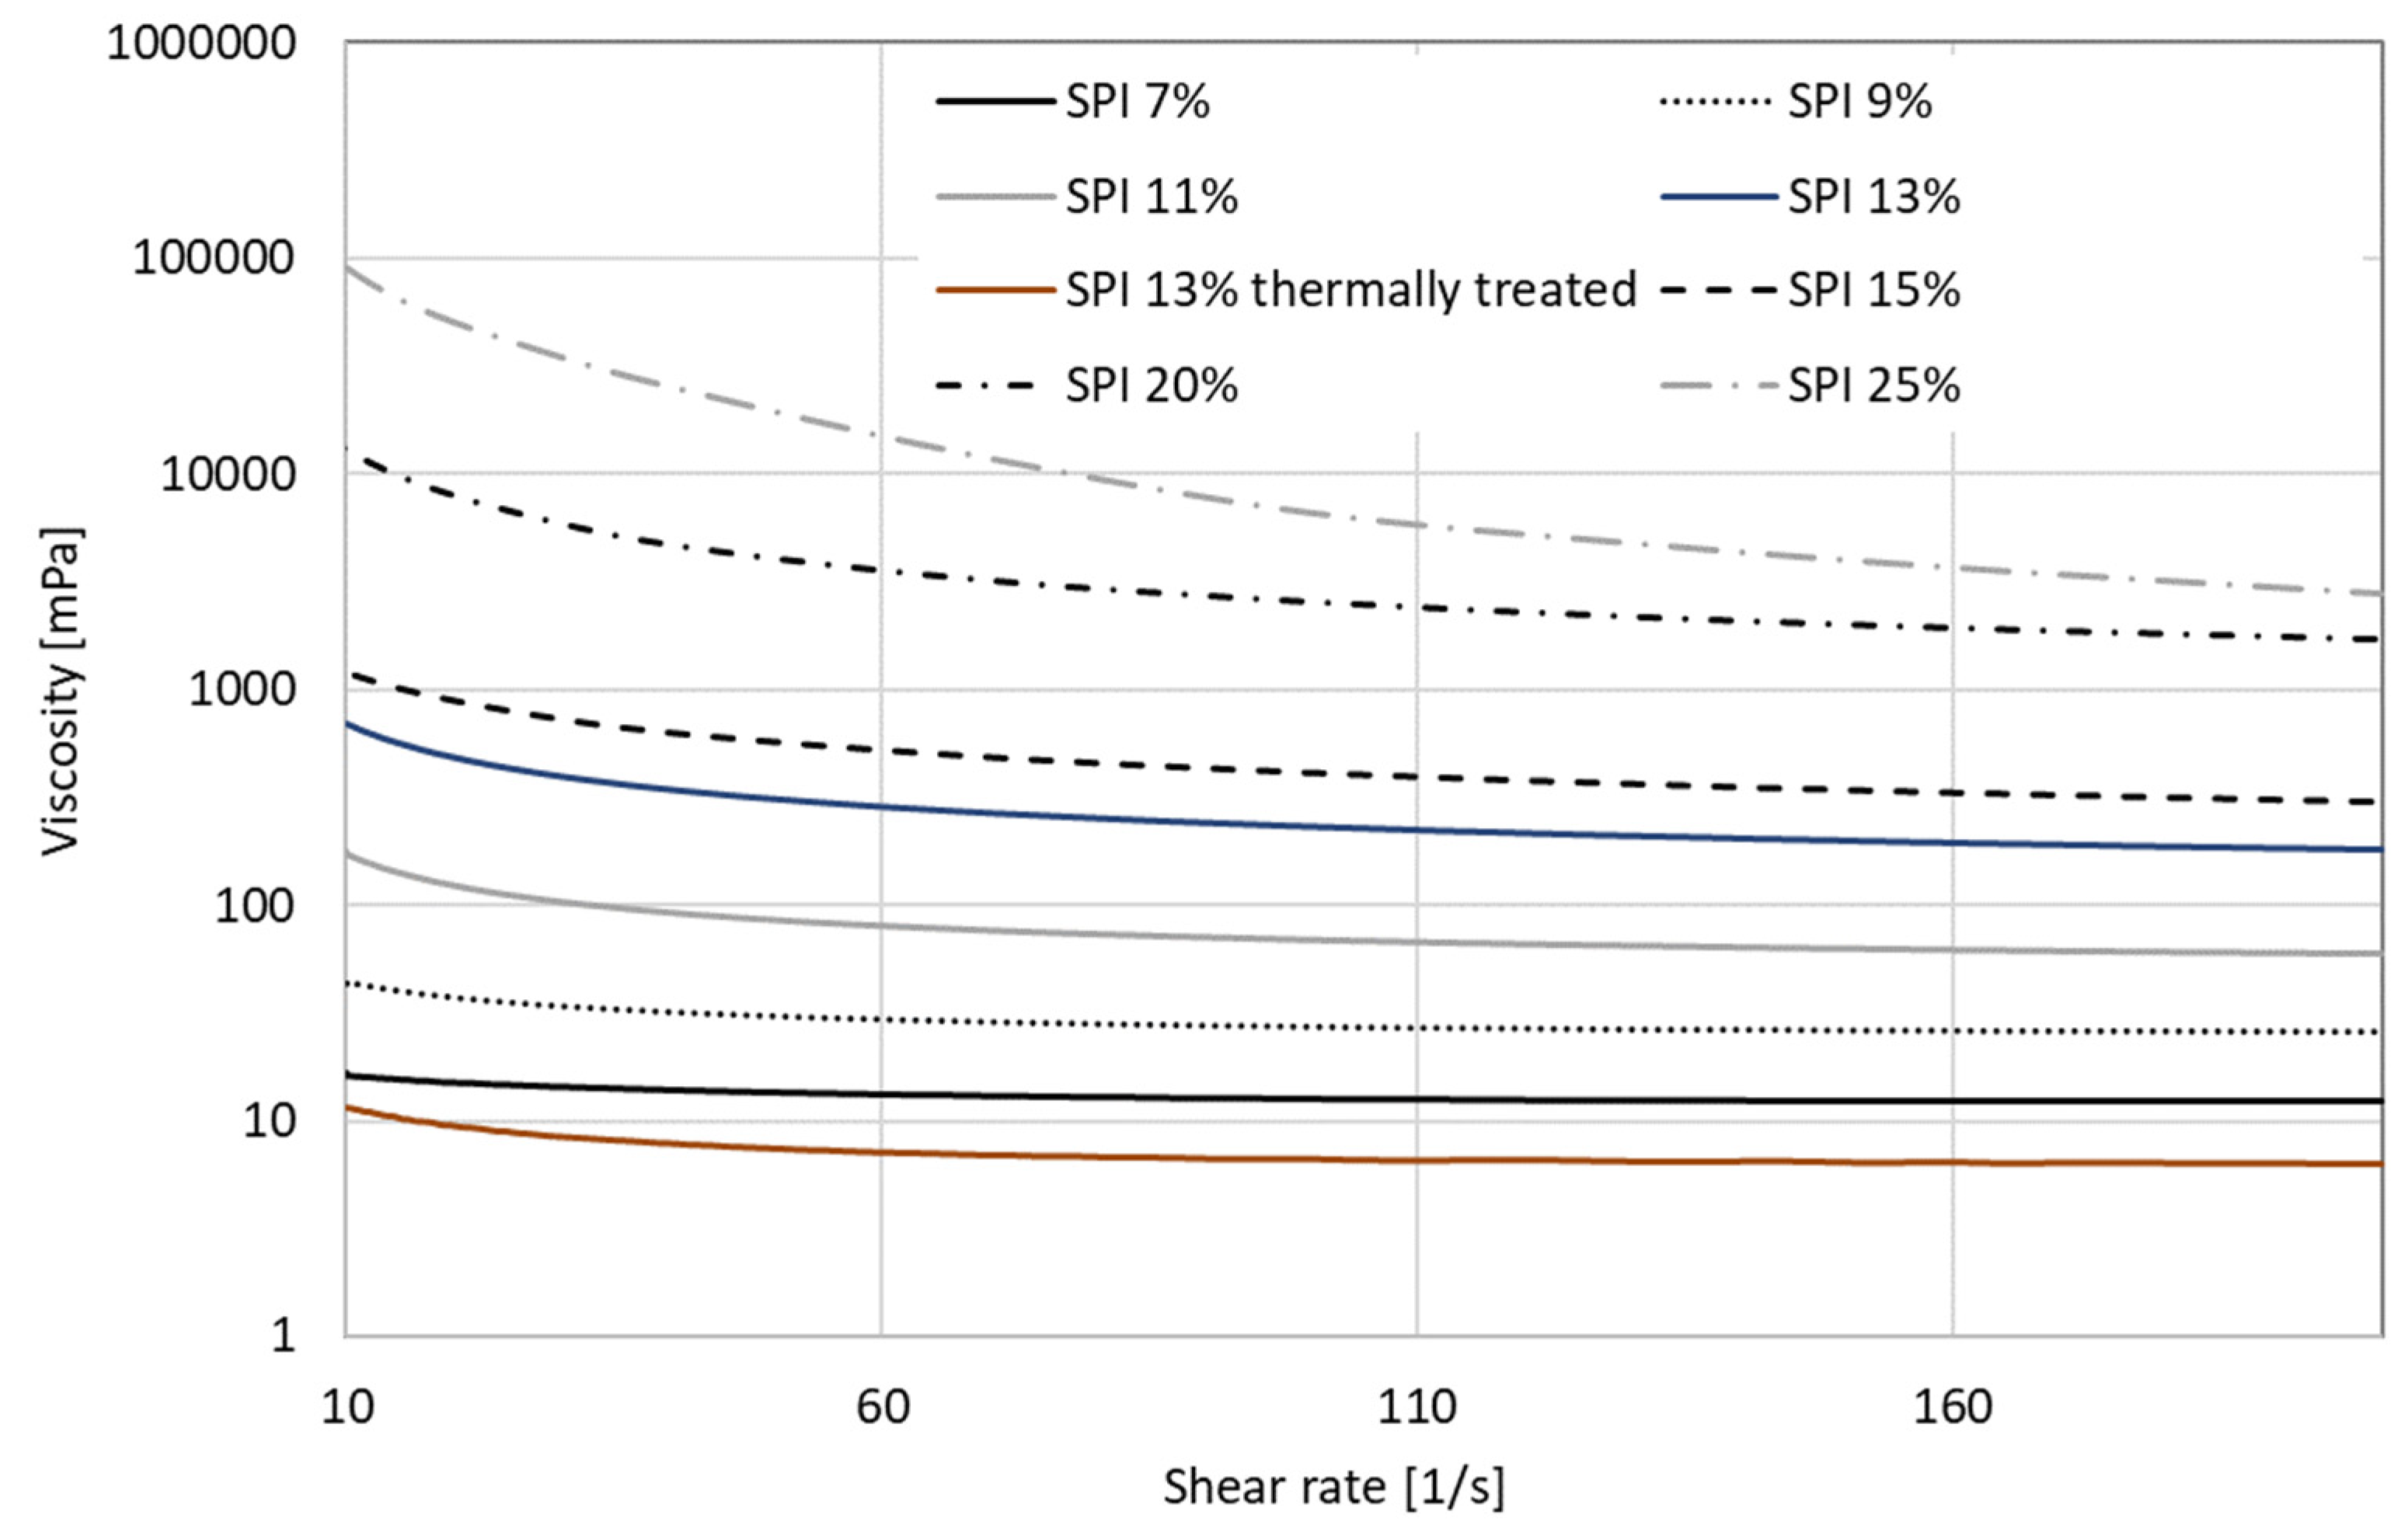
Figure 5 shows the dependencies of apparent viscosity as a function of the shear rate for selected concentrations of an aqueous solution of SPI that was not thermally treated and thermally treated with a pH correction.
As expected, the thermal treatment led to the straightening of protein chains, observed by the apparent decrease in viscosity. However, the apparent viscosity obtained for all SPI solutions with a concentration below 15% is much lower than that obtained for a 5% PEO solution. Nevertheless, attempts were made to find a fiber-forming window.
Each of the aqueous solutions of SPI with concentrations of 7, 9, 11, 13, 15, 20, and 25% were subjected to a defibration test at a polymer flow rate of 0.005, 0.008, 0.01, and 0.5 mL/min and compressed air pressures of 0.5, 1.0, 3.0, 4.0, and 5.0 bar. No fibers were obtained in any of the experimental variants.
3.3. PEO/SPI Blends
PEO was used as a fiber-forming additive since pure SPI solutions do not have fiber-forming potential. Based on [
6], a 9% SPI solution was chosen, but unlike [
6], the solution was not stirred for 10 h at 50 °C (fearing too much decrease in apparent viscosity) but was shaken intensively for 5 min. The SPI solution was then mixed with the appropriate volume of the aqueous PEO solution according to the data in
Table 1.
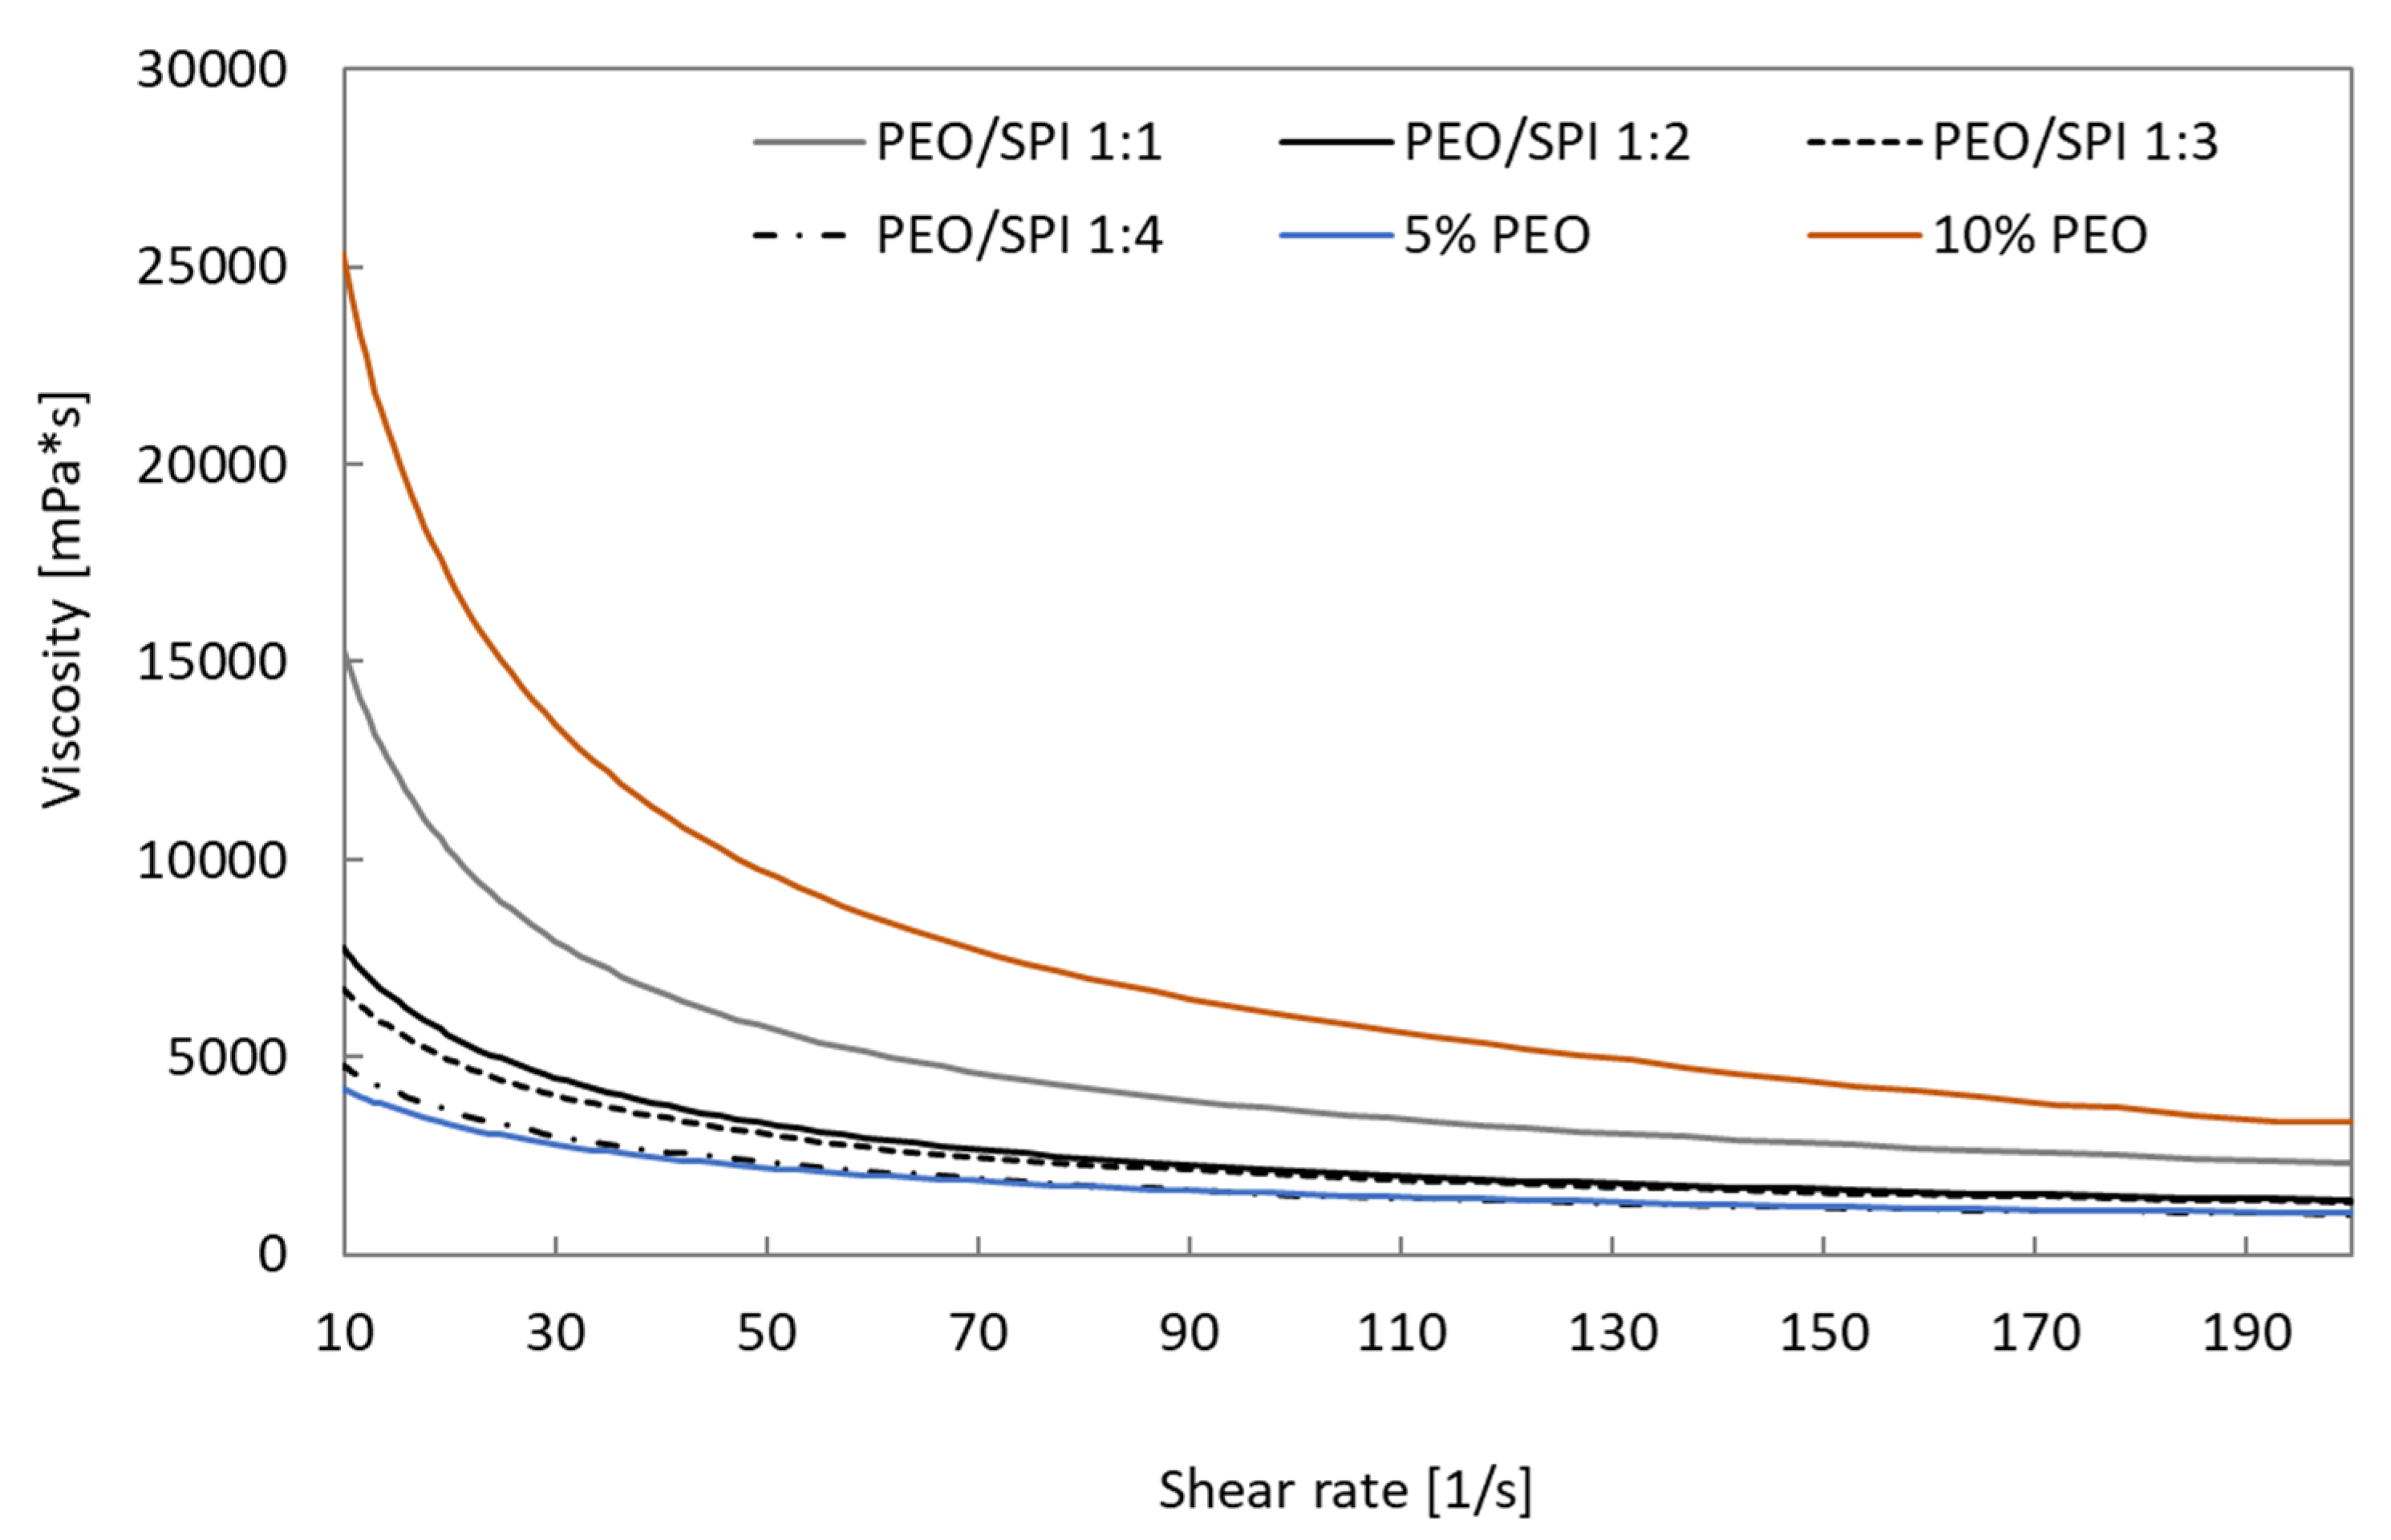
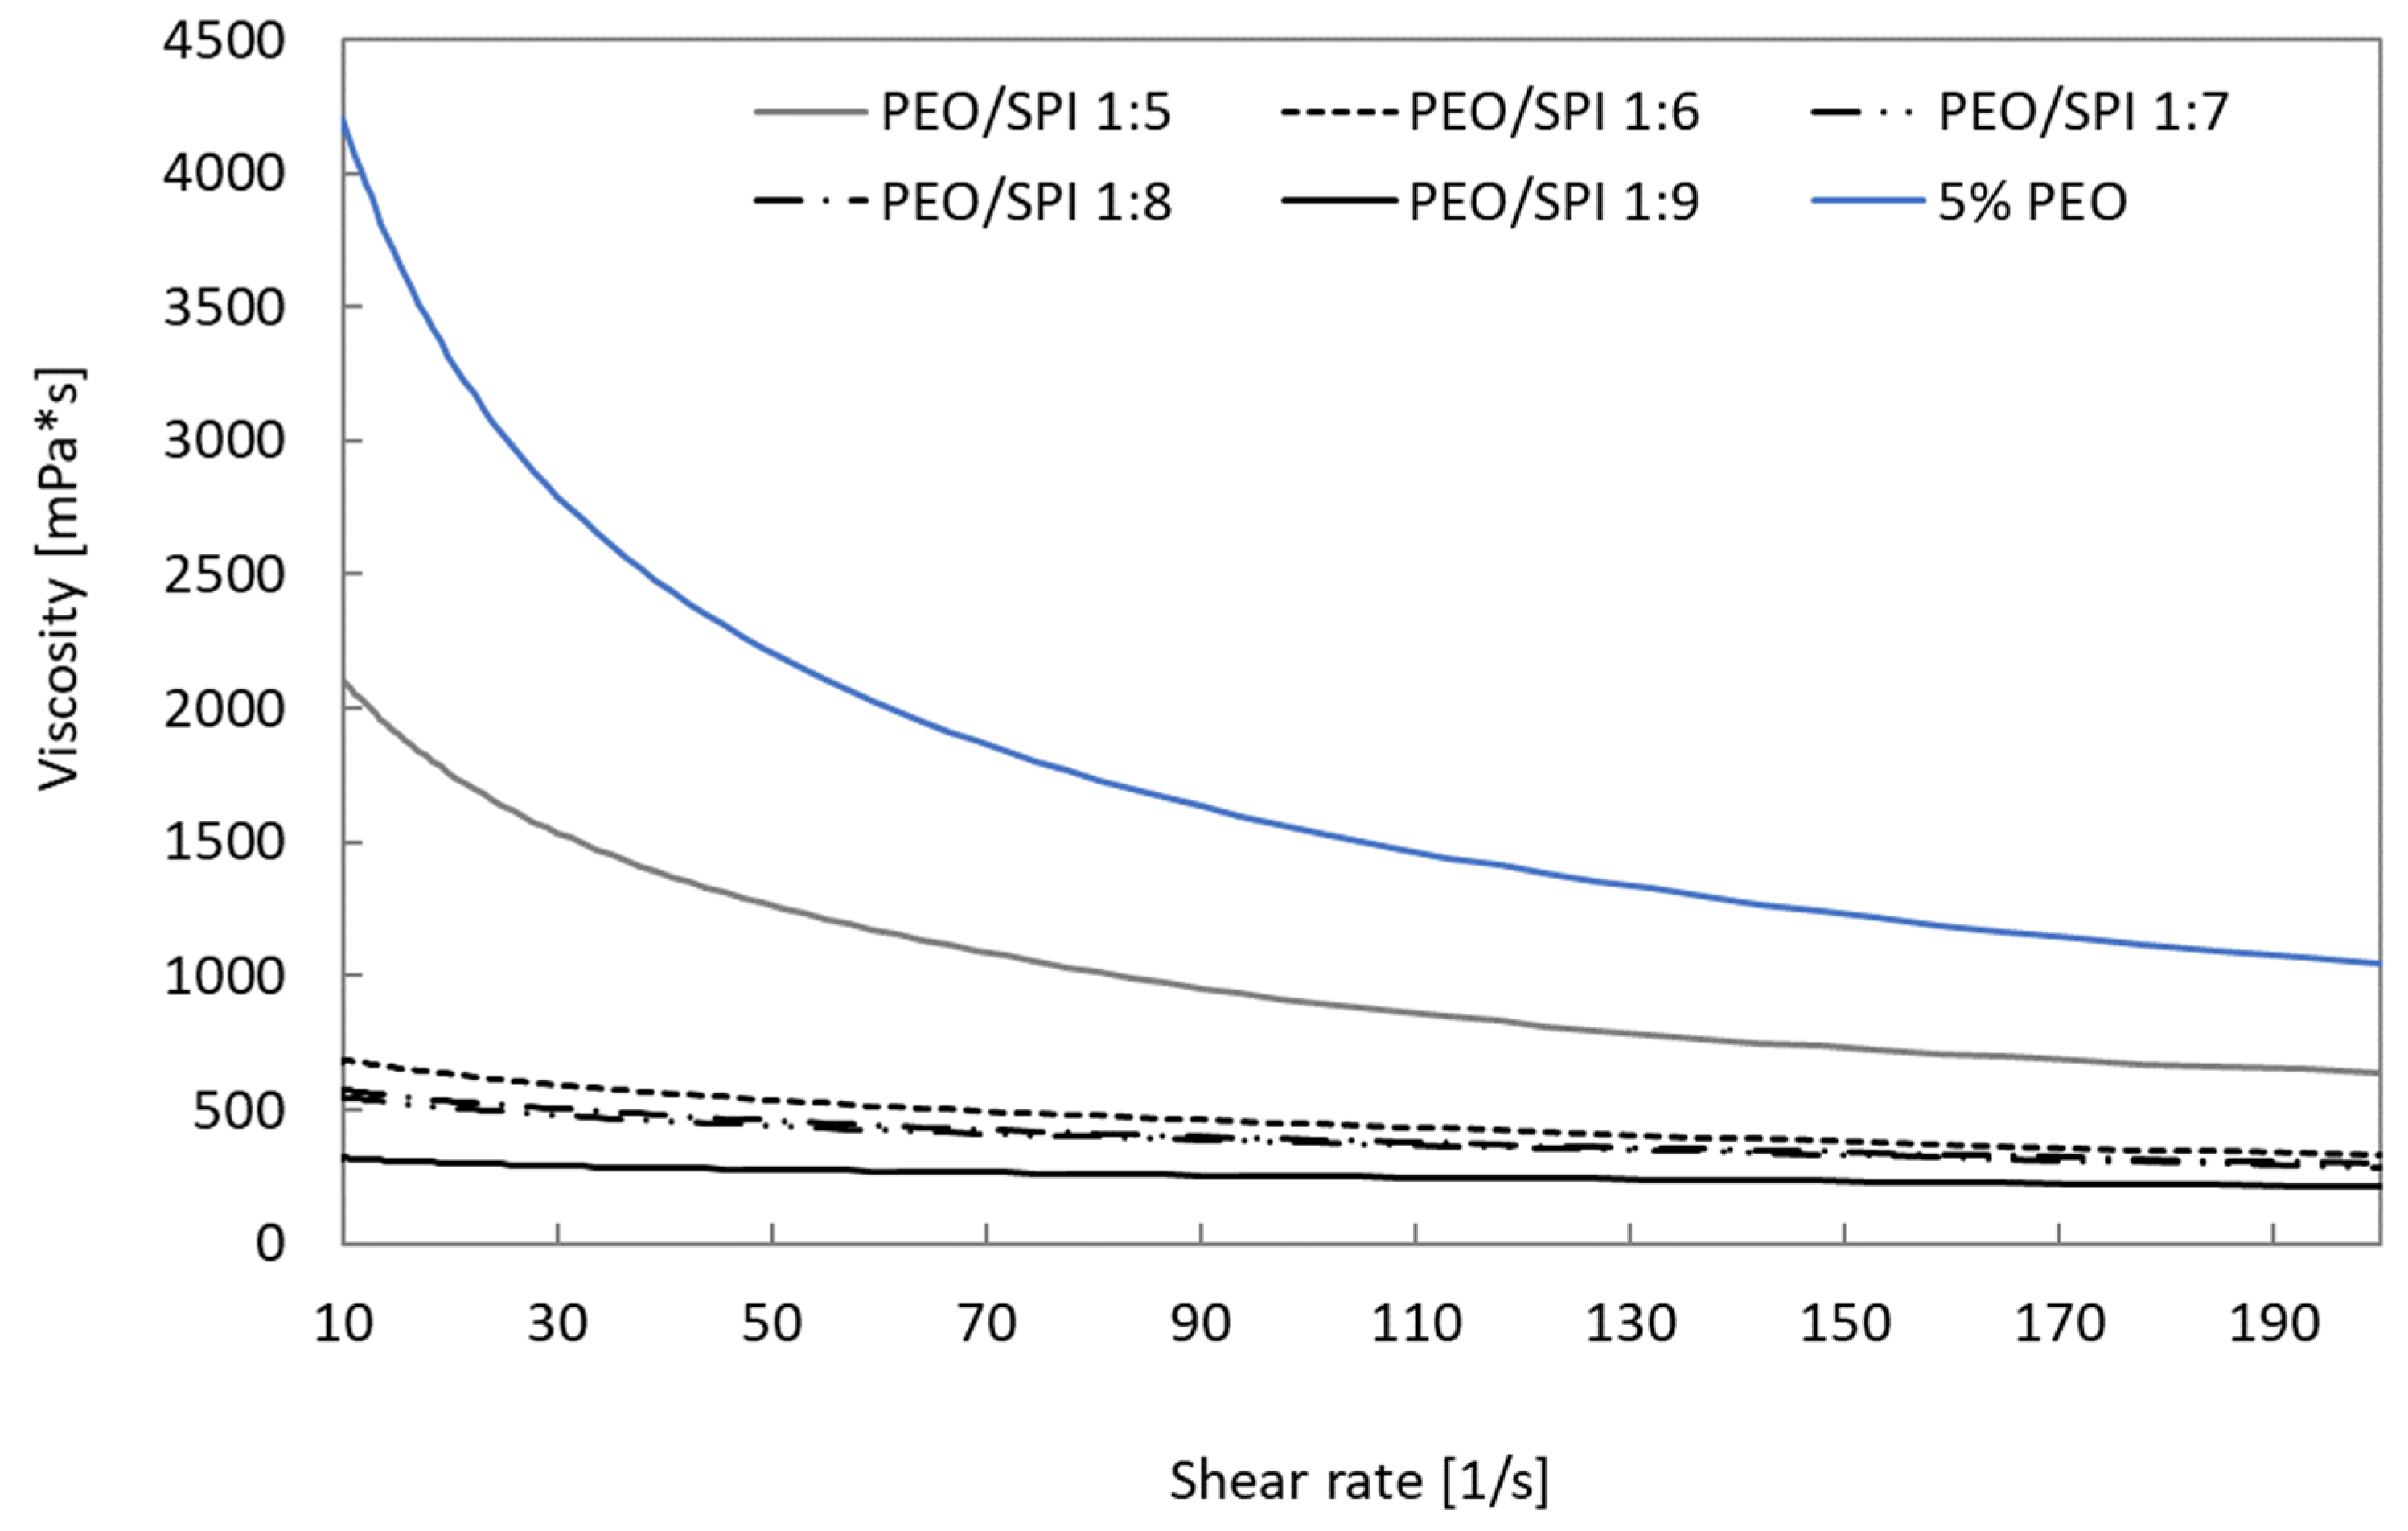
Figure 6 and
Figure 7 present the results of the measurement of apparent viscosity as a function of the shear rate for the prepared PEO/SPI blends.
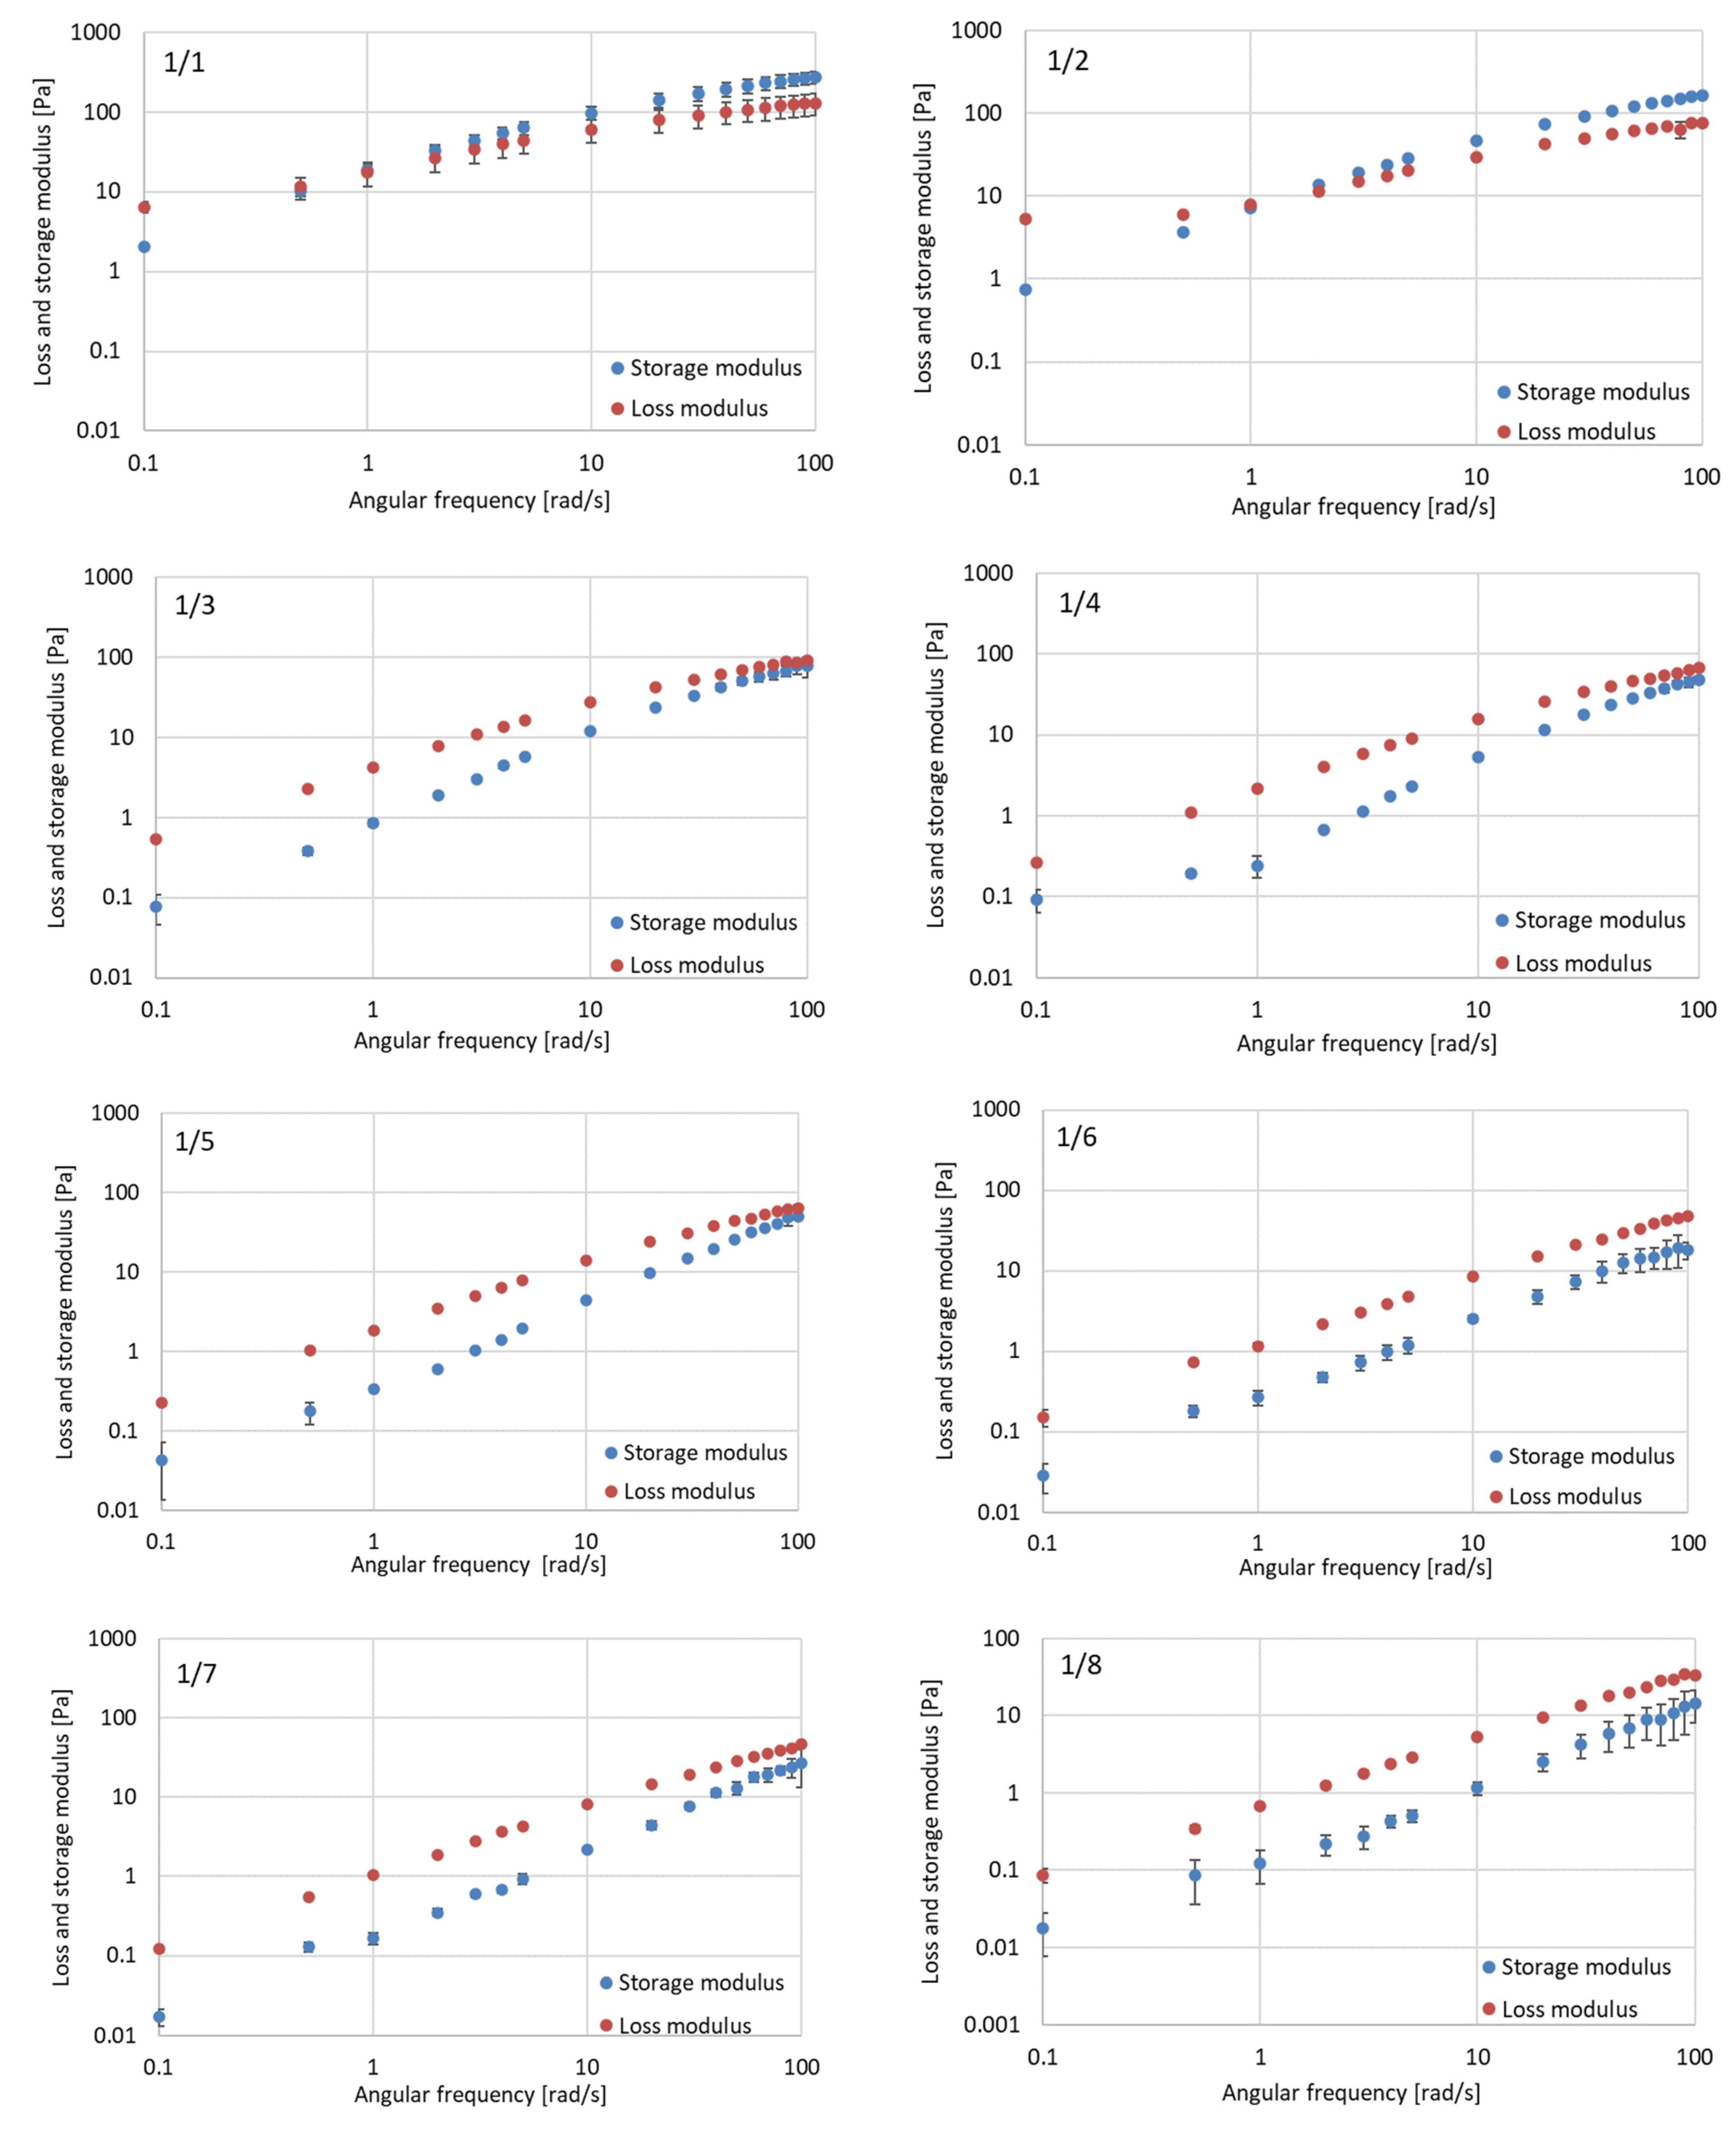
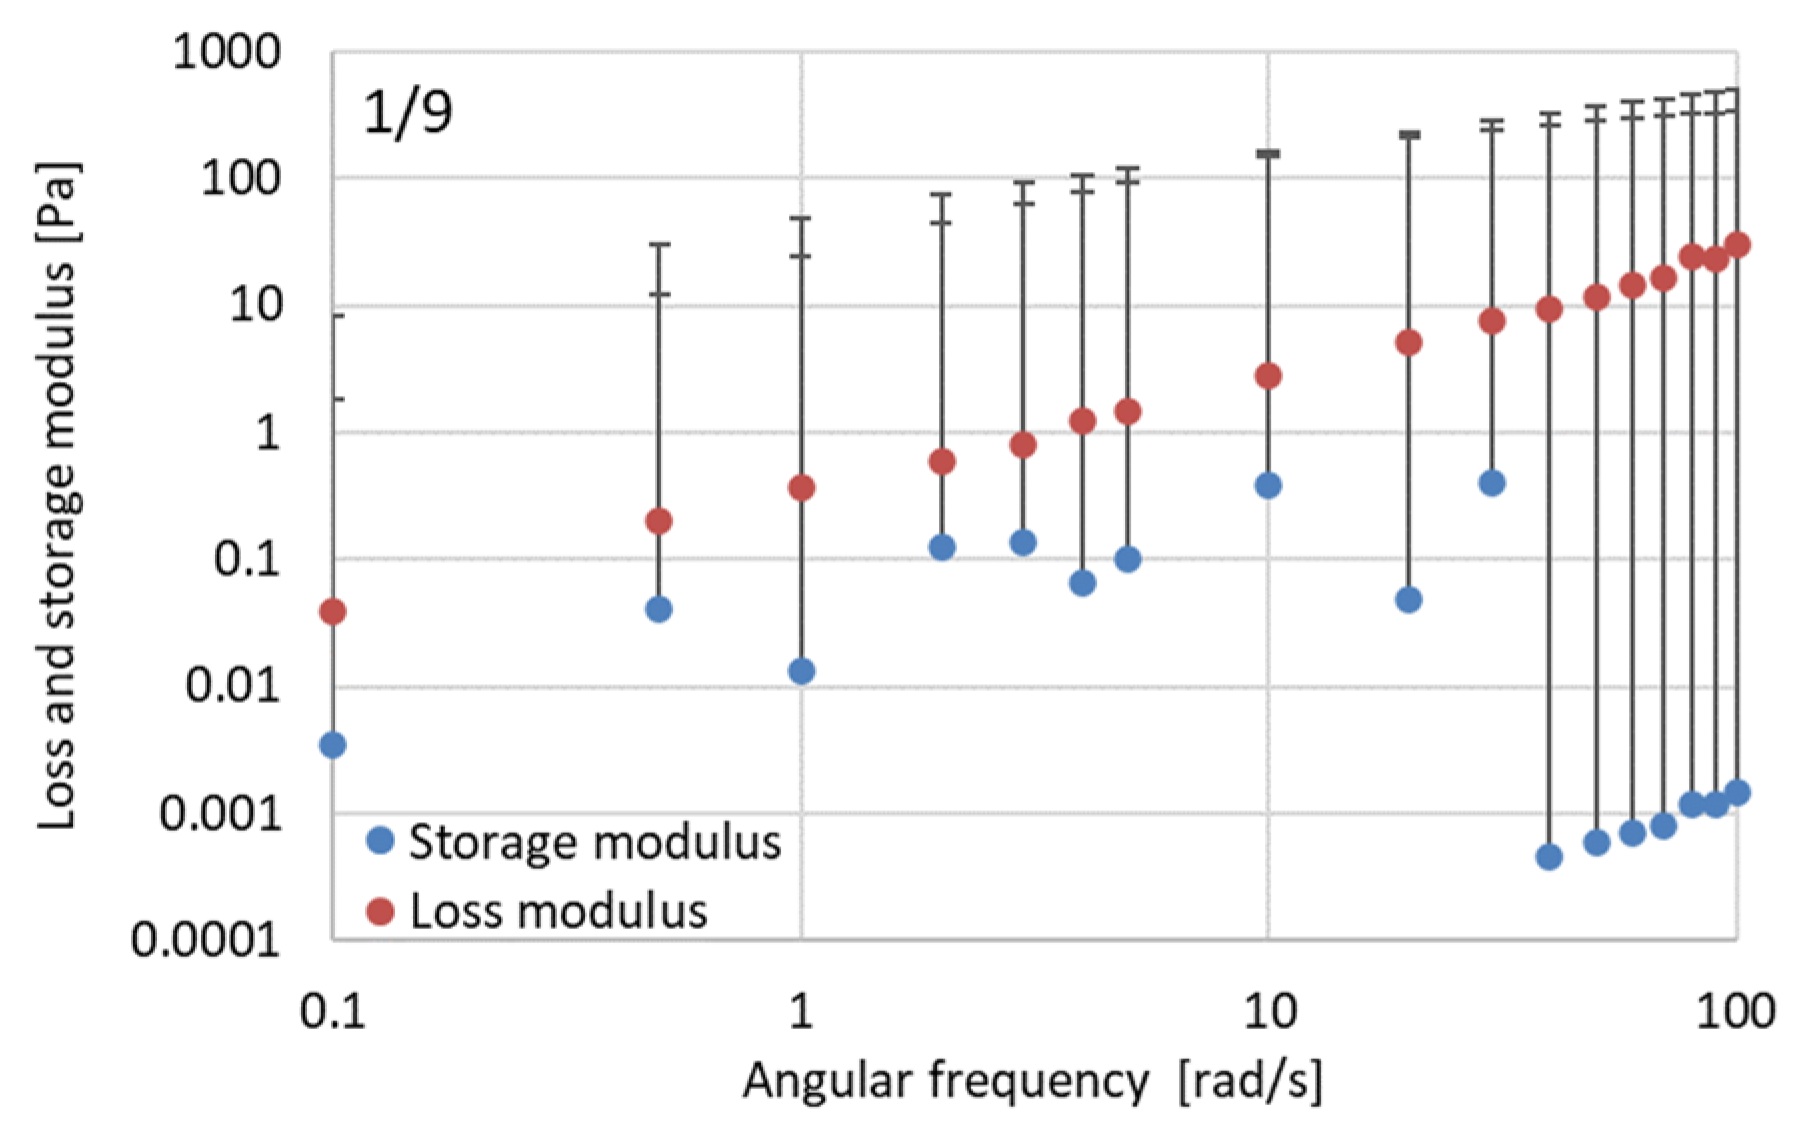
The apparent viscosities of the PEO/SPI blends for the proportions from 1:1 to 1:4 are within the limit determined by the apparent viscosities of 5% PEO and 10% PEO, so there is a chance of obtaining fibers from such solutions during solution blowing. The apparent viscosities of PEO/SPI blends with ratios from 1:5 to 1:9 are lower than those for 5% PEO, so the probability of obtaining fibers from such solutions is much lower. Also, loss modulus and storage modulus values were determined for each of the nine PEO/SPI blends (
Figure 8).
PEO/SPI blends with a ratio of 1:1 and 1:2 showed the properties of viscous fluids at low angular frequencies and the properties of elastic fluids at higher frequencies. Similar behavior was observed for 6% and 7% PEO solutions, but the transition from a viscous to elastic material occurred at lower angular frequencies. For the remaining PEO/SPI blends with a proportion of components from 1:3 to 1:9, the loss modulus exceeded the value of the storage modulus, so these blends behaved more like viscous fluids—like PEO solutions with concentrations of 4% and 5%. The storage modulus measurement points for the mixture with the highest protein content (PEO/SPI 1:9) did not follow the curve as in the other plots, moreover, the reproducibility of the results is very low, probably due to the lack of a straight line for this solution in the amplitude sweep test. The decrease in the PEO concentration and the increase in the SPI concentration in the PEO/SPI blends also resulted in a noticeable decrease in the values of the loss and storage modulus.
3.4. PEO/SPI Fibers
PEO/SPI blends were blown in the same conditions as PEO solutions. Fibers were obtained at the given process parameters for seven proposed PEO/SPI blend ratios (from 1:1 to 1:7).
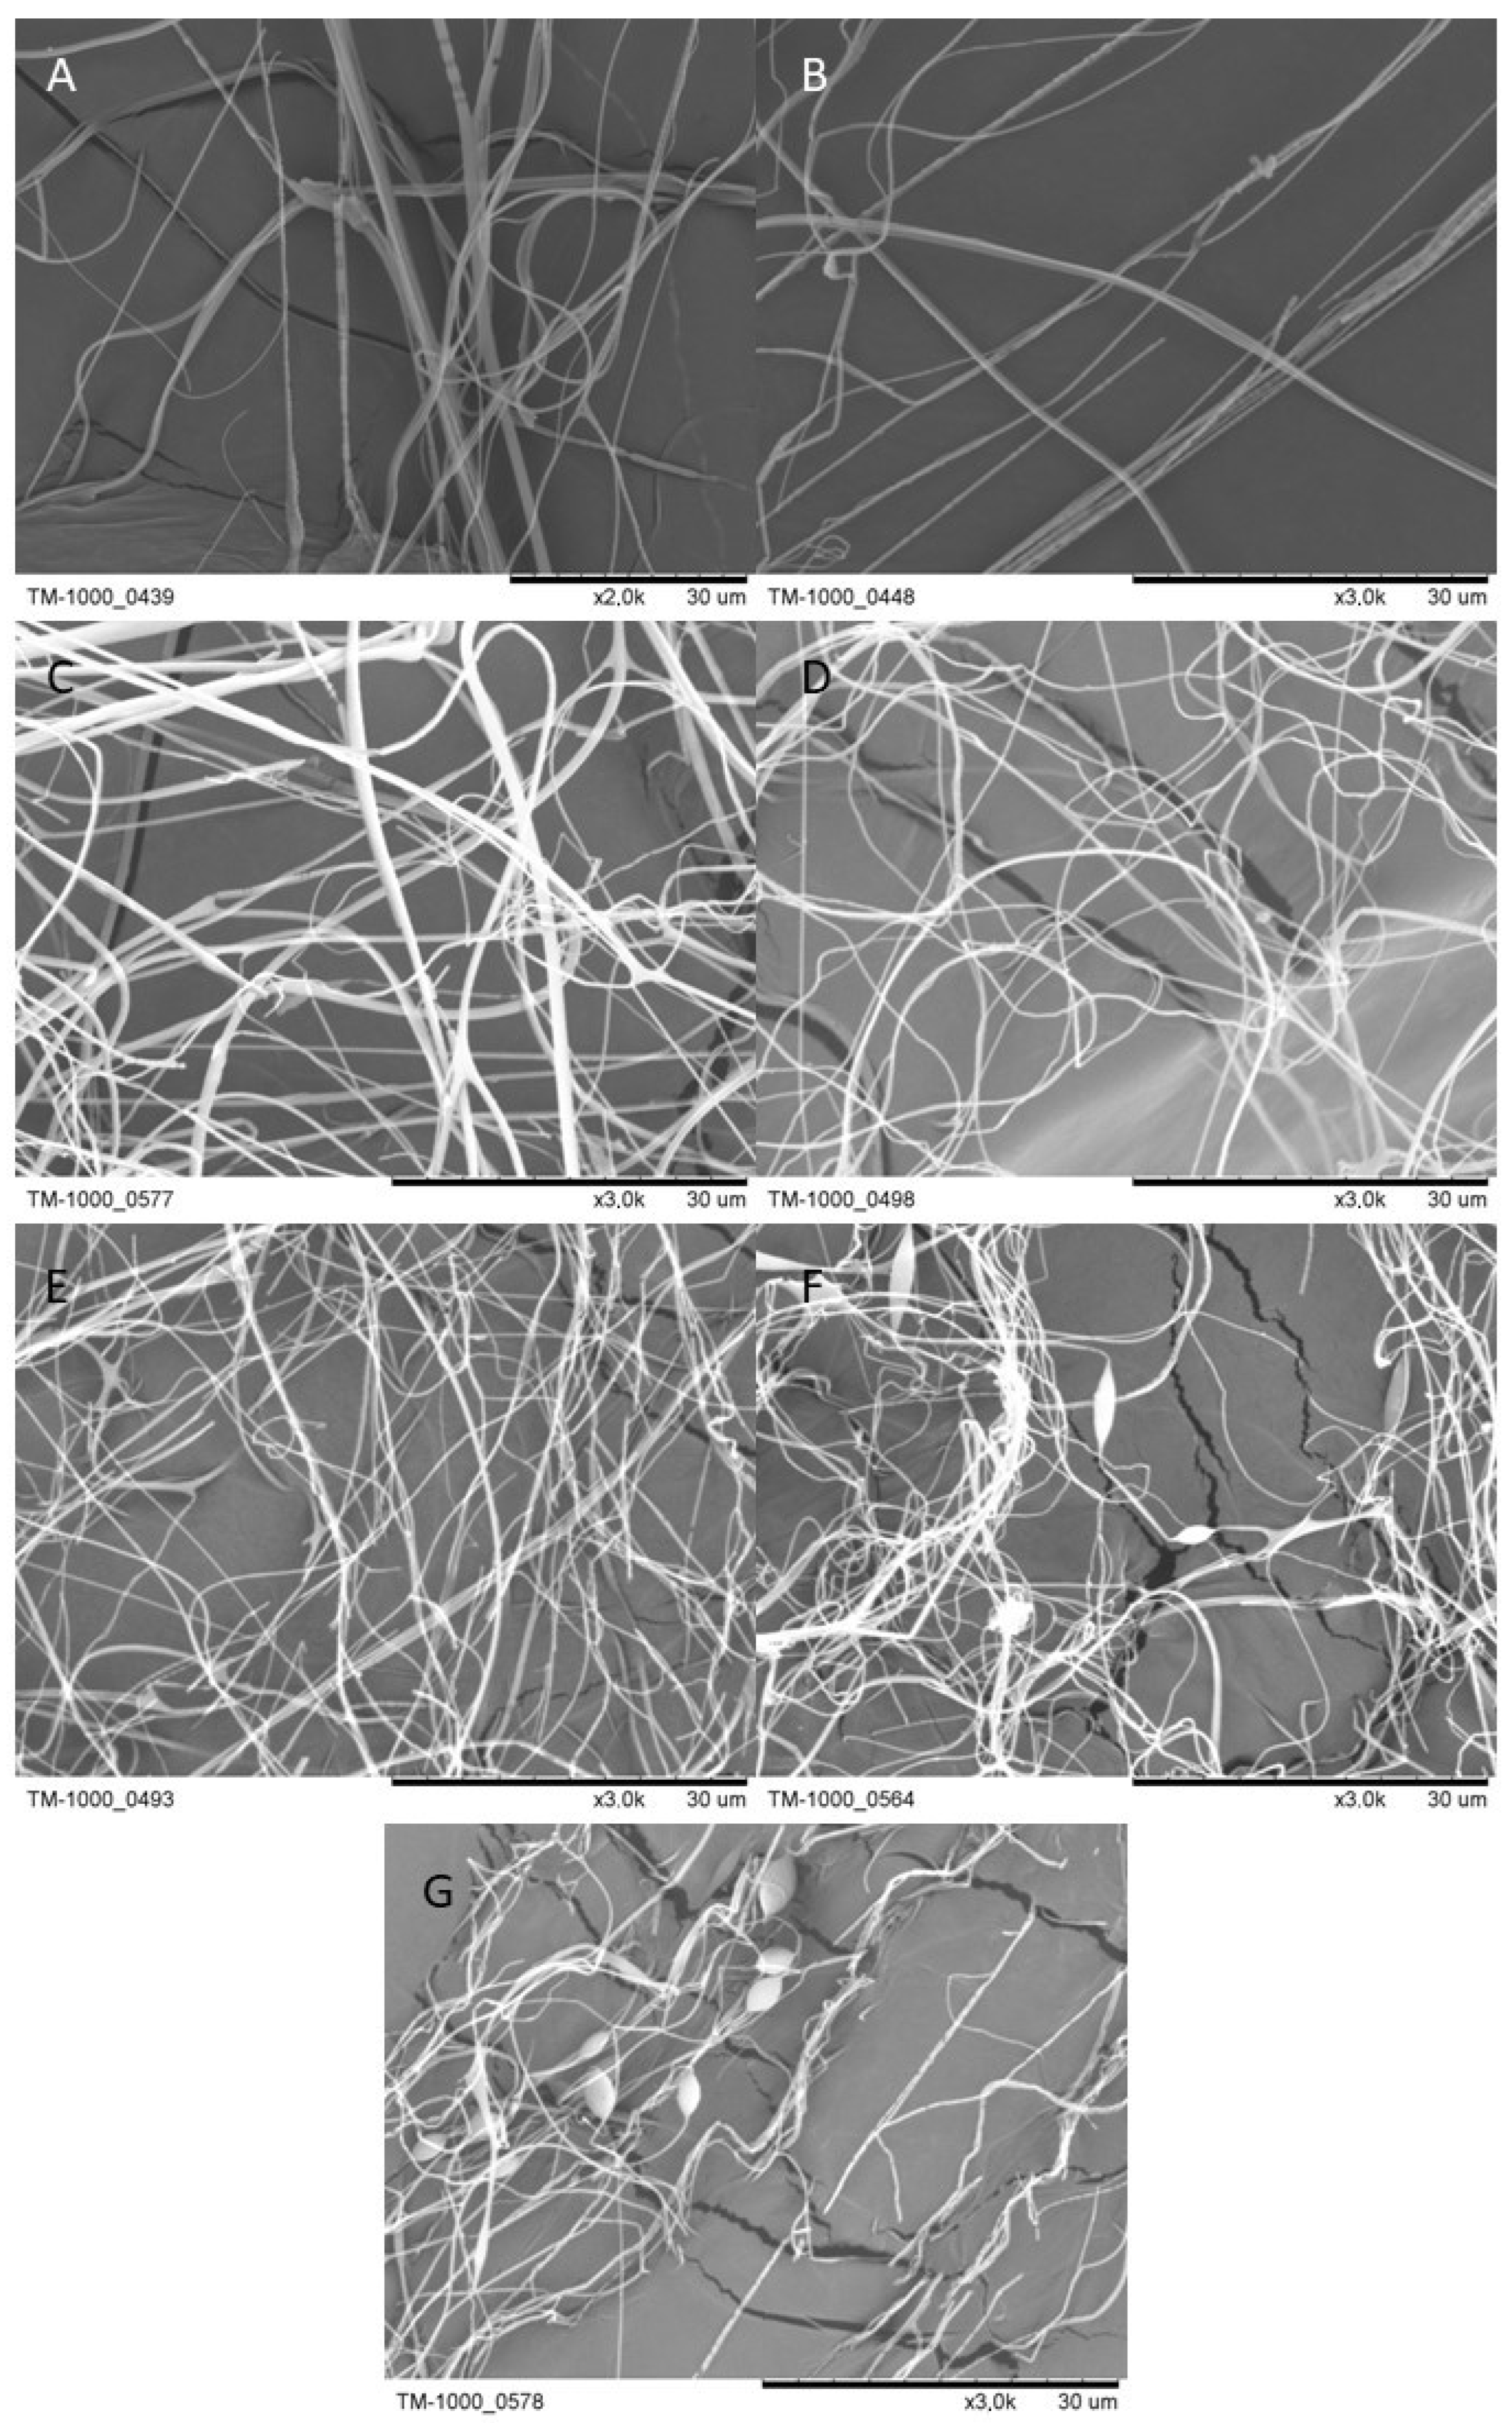
Figure 9 shows selected SEM images of the fibers obtained from the PEO/SPI blends.
For PEO/SPI blends with a high protein content (1:6 and 1:7), thickening is visible on the fibers (
Figure 9F,G). Such thickening is caused by the droplet’s entrainment from the nozzle’s tip instead of stretching it into a stream of polymer. The small stabilizing effect of the solution’s elastic forces may explain this phenomenon [
6]. Similar effects on fibers containing soy protein were also observed by, e.g., [
10].
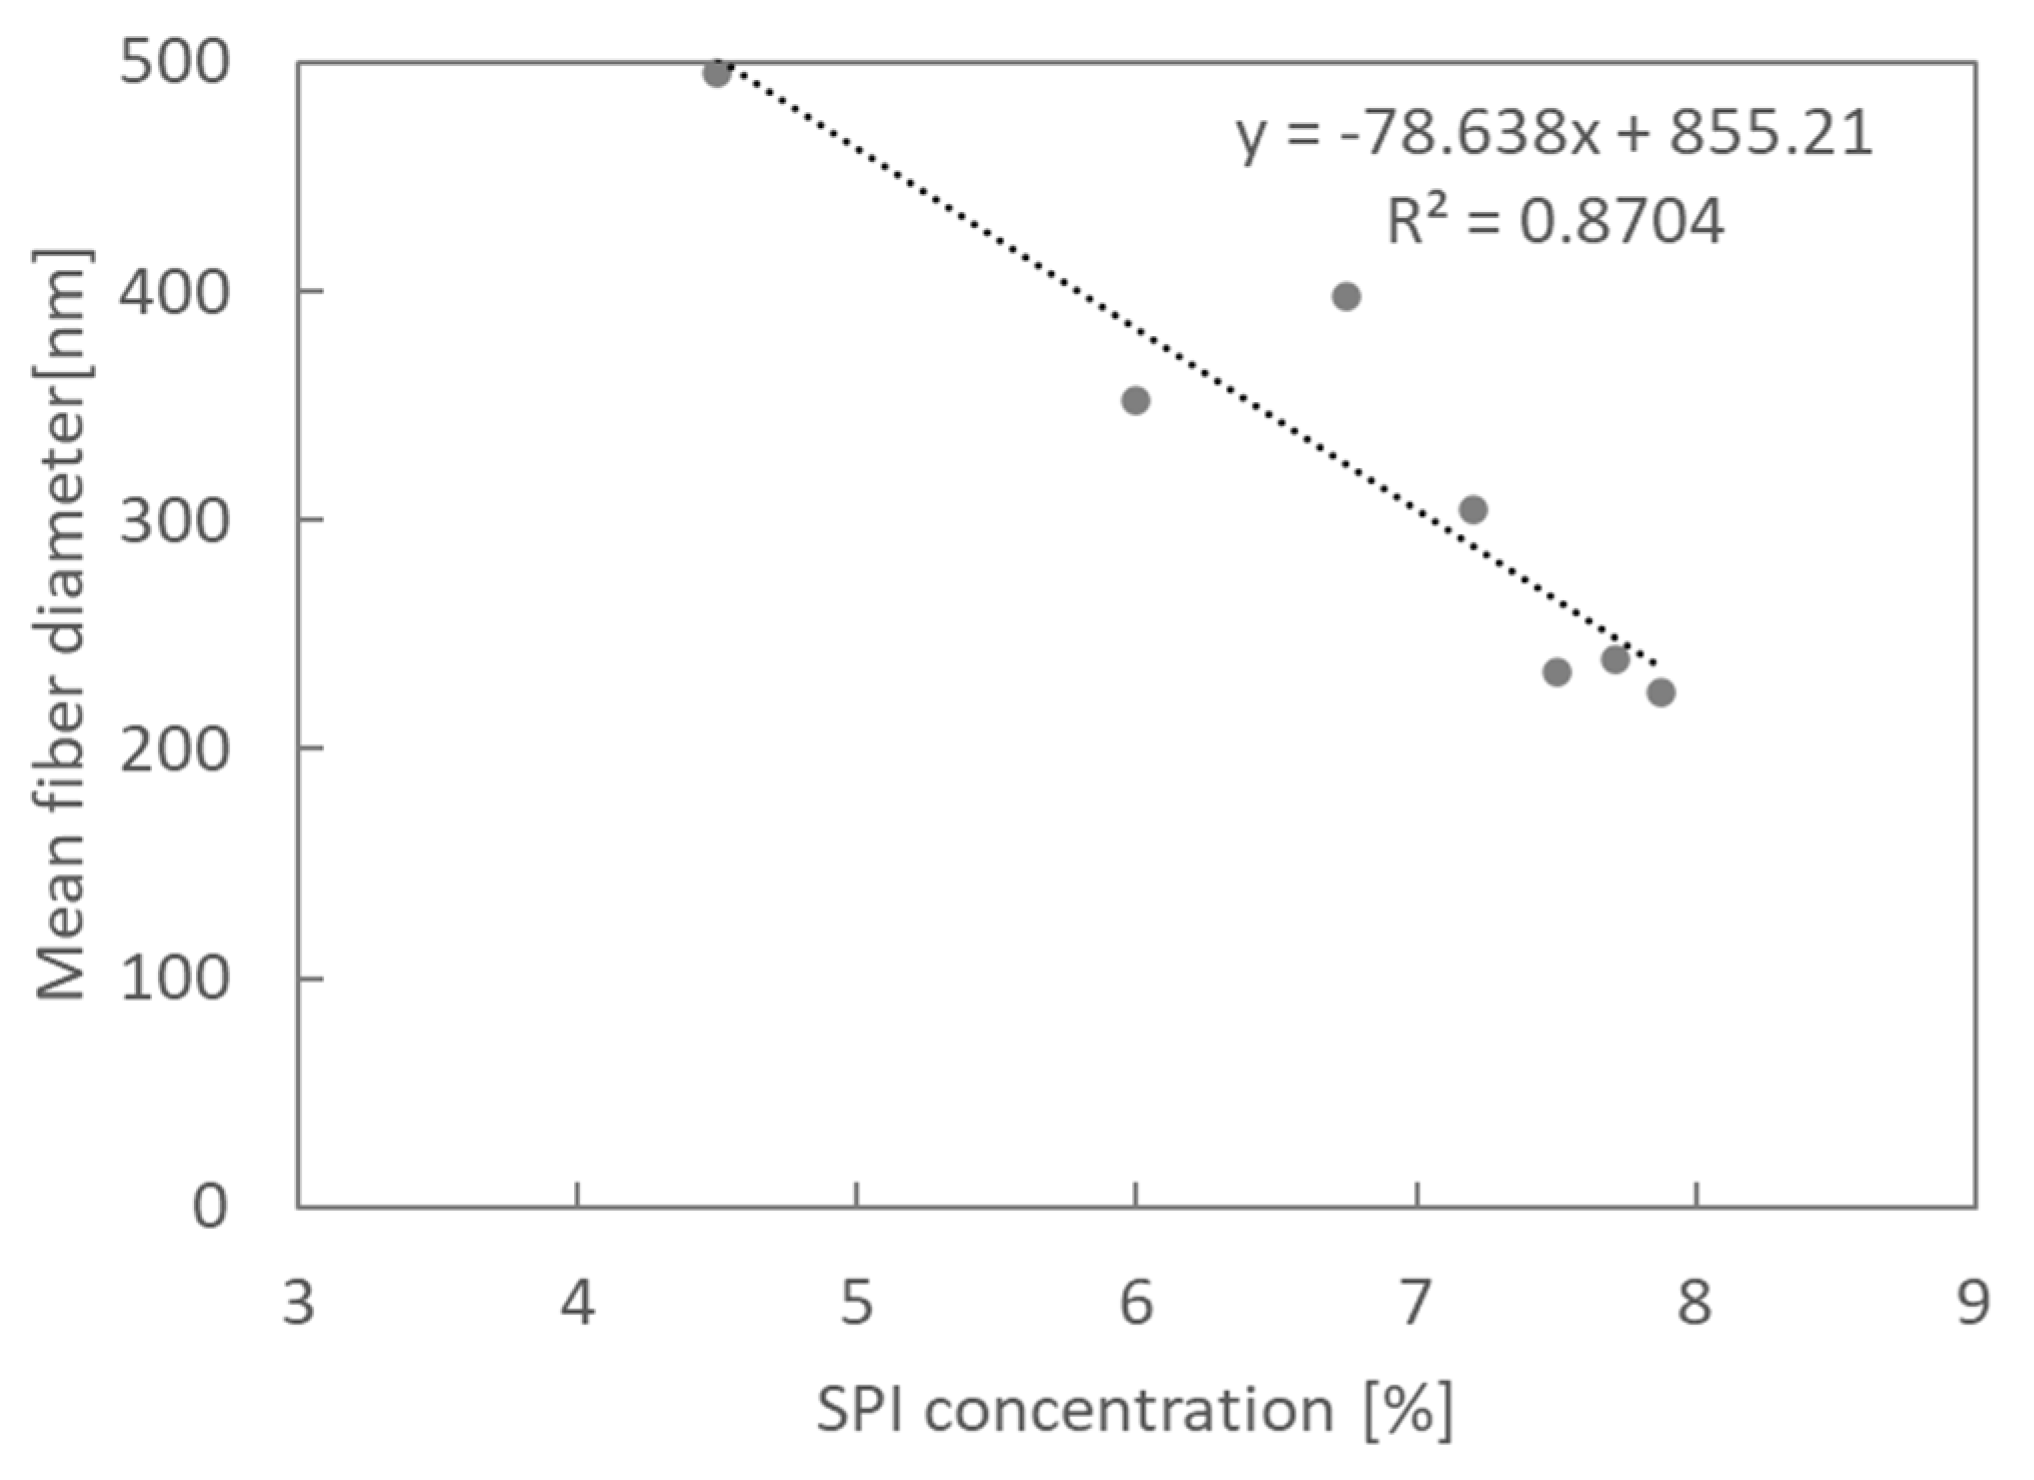
The obtained average fiber diameters as a function of SPI concentration are shown in
Figure 10.
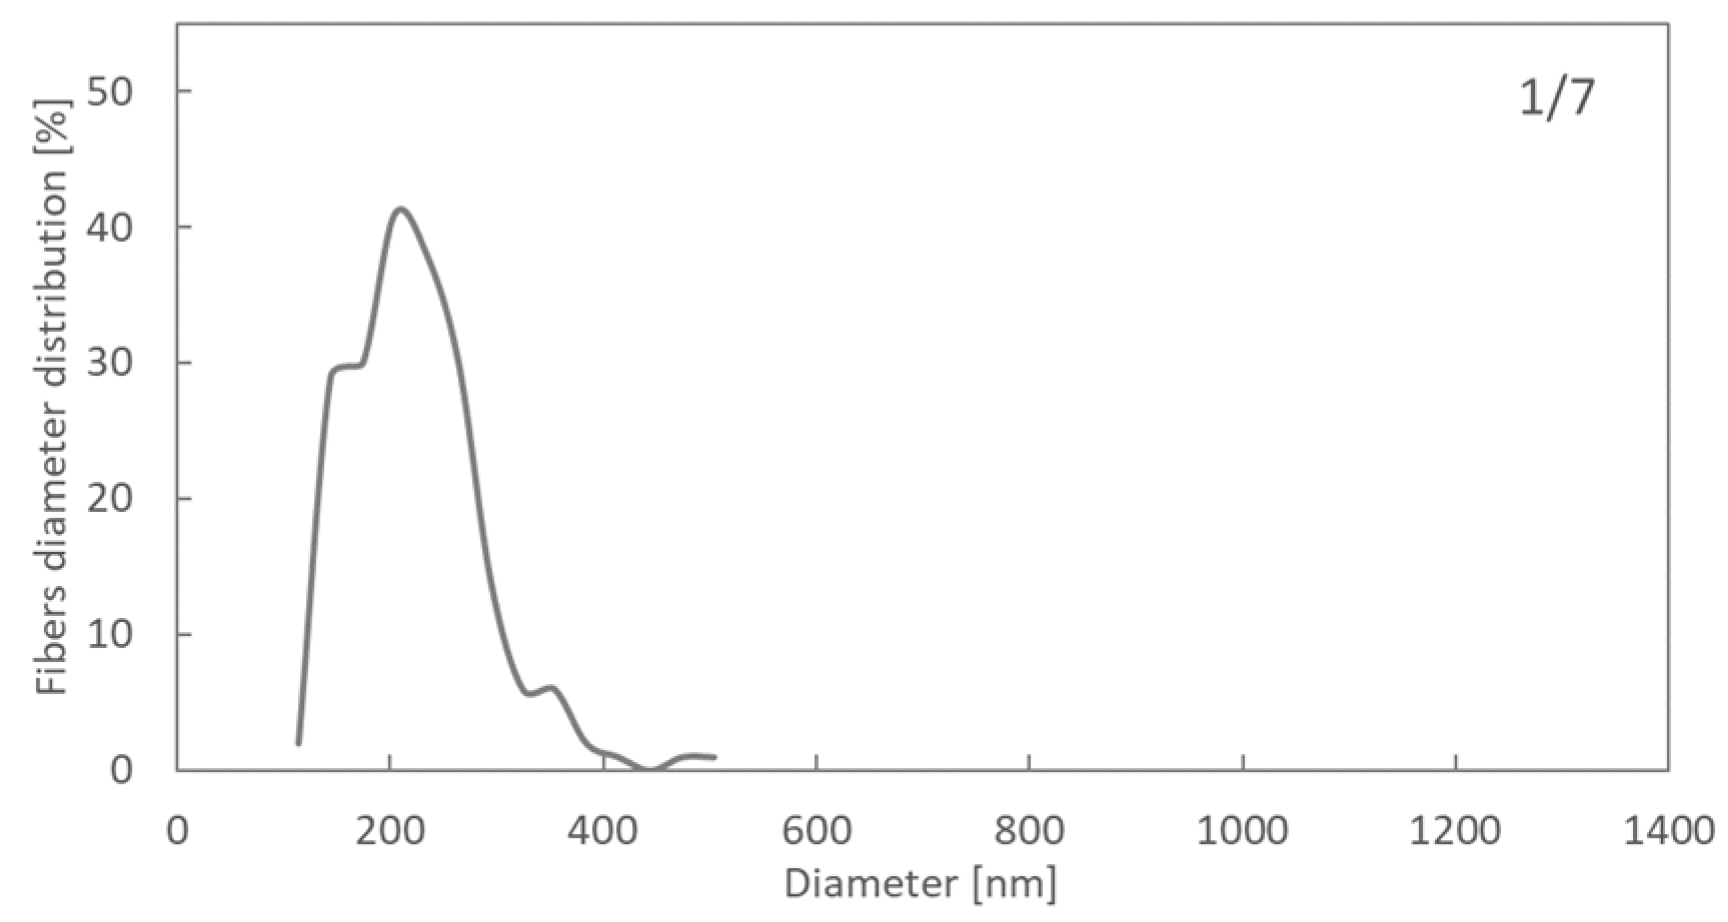
Figure 11 shows the fiber diameter distributions.
The increase in the protein concentration in the PEO/SPI blend leads to a decrease in the average diameter of the fibers and a narrowing of their size distribution. With the increase in the protein concentration in the PEO/SPI blend, the apparent viscosity, surface tension, and the values of the loss modulus and the storage modulus decrease, which translates into a lower flow resistance through the nozzle and lower viscoelastic force of the fluid. The lower force suppresses the shear and tensile effects less, and thus, it is possible to produce fibers with smaller diameters [
19]. As a result of the work carried out, it was possible to produce fibers with a nanometer diameter from a solution containing 7.88% SPI and only 1.25% PEO (PEO/SPI 1:7). It is worth noting that pure SPI and pure PEO solutions with such concentrations do not have fiber-forming potential.
3.5. The Influence of the SPI Addition on the Parameter of Solution Blowing
The influence of the SPI addition on the process was investigated using three samples:
Pure 5% PEO;
A blend of PEO/SPI in a 1:1 ratio (PEO concentration in blend 5%, SPI 4.5%);
A blend of PEO/SPI 1:7 (PEO concentration in blend 1.25%, SPI 7.88%).
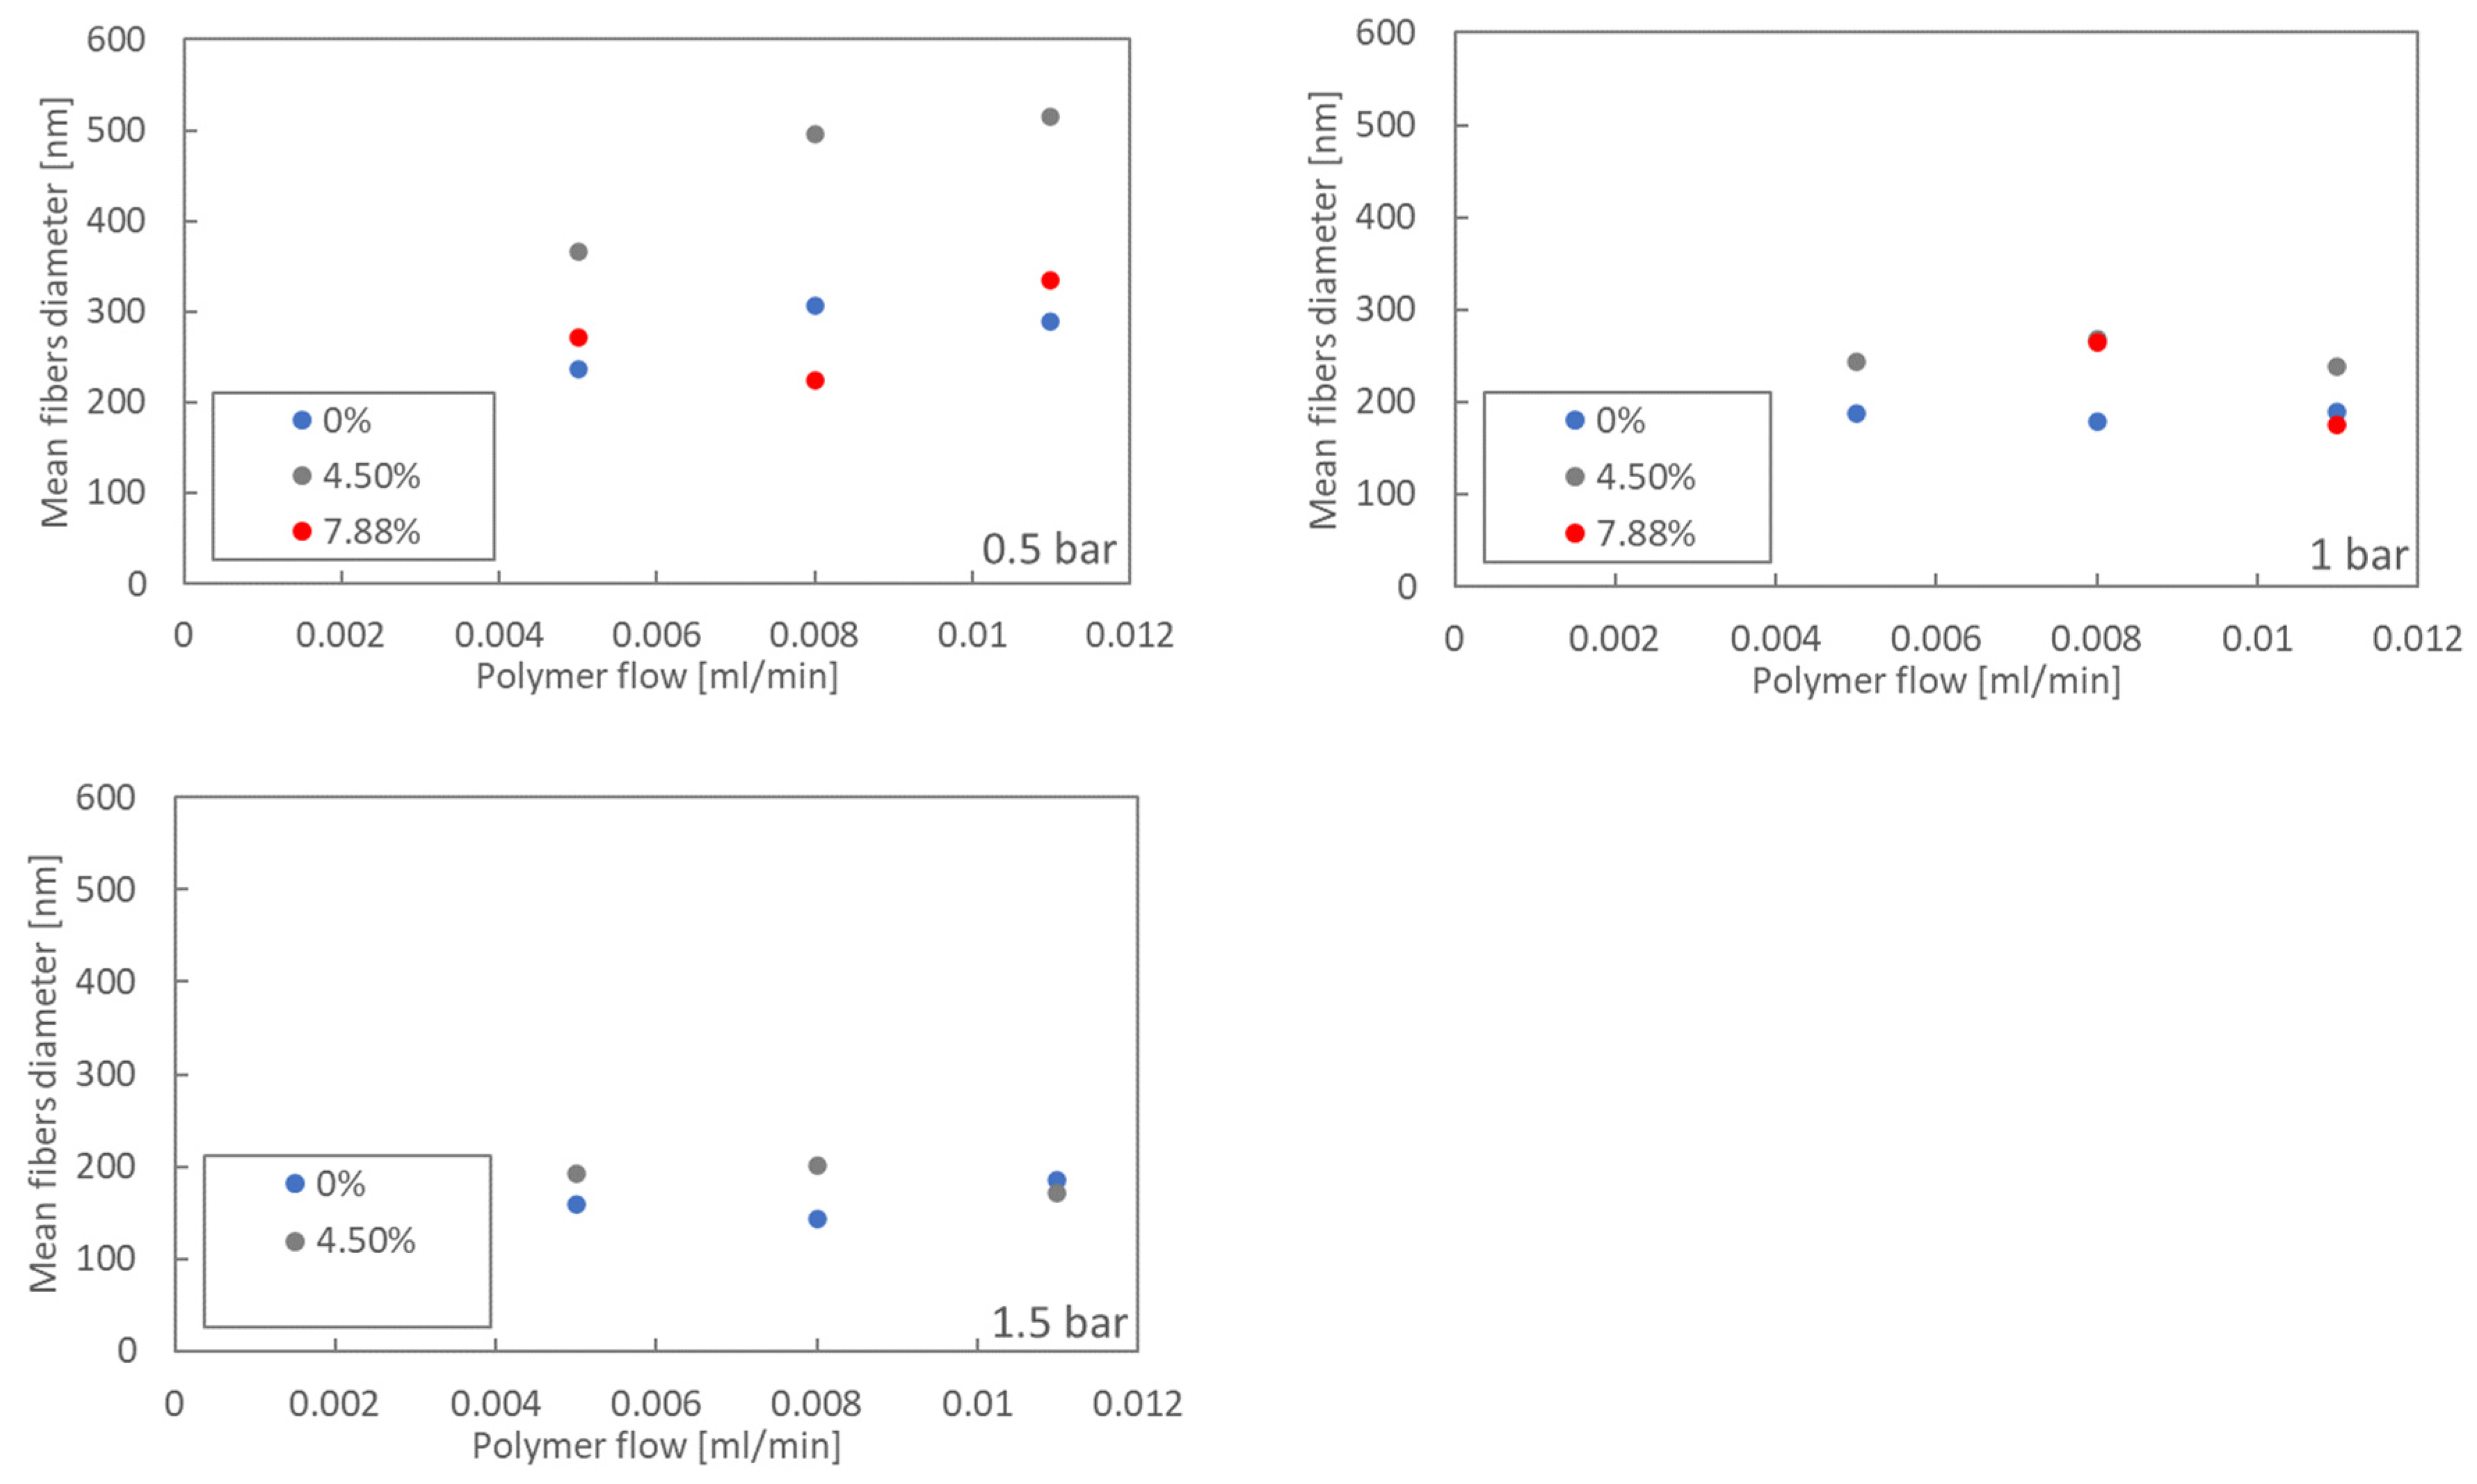
The blowing time was 1 h, and the nozzle diameter was 1 mm. The process was carried out for pressures of 0.5 bar, 1 bar, and 1.5 bar, and for each pressure, blowing was repeated at the rate of polymer outflow from the nozzle of 0.005 mL/min, 0.008 mL/min, and 0.011 mL/min.
For samples of 5% PEO and the blend PEO/SPI 1:1, fibers were obtained in all analyzed variants of process parameters. For sample PEO/SPI 1:7, fibers were obtained in five experiment variants, but we did not achieve fibers from a polymer flow rate of 0.005 mL/min and pressure of 1 bar, or for any polymer flow at 1.5 bar pressure. The obtained mean fiber diameters are shown in
Figure 12.
The average fiber diameter decreased with increasing compressed gas pressure, which aligns with expectations. The gas in the solution-blowing process supports the solvent’s evaporation and the fiber’s drawing and formation. The higher the gas pressure, the greater the shear force acting on the interface, and this results in the formation of fibers with a smaller diameter [
19]. In addition, a high gas pressure facilitates solvent evaporation by reducing the boundary layer at the interface [
8]. Moreover, as the flow rate of the polymer from the nozzle increases, the shear force acting per unit area of the droplet suspended at the nozzle tip decreases, so the fibers should have a larger diameter at higher solution feed rates [
19]. However, in our study, increasing the polymer flow rate had no apparent effect on the increase in the average fiber diameter. The change in the average fiber diameter was observed, and it was more pronounced for the process carried out at 0.5 bar than at 1 bar and 1.5 bar, but for the polymer flow of 0.008 mL/min, the obtained values deviated from the trend.
However, the influence of the SPI addition on both the defibering process and the obtained effects represented by the average diameter of the fiber was visible. The addition of 4.5% SPI caused an increase in the average fiber diameter for each value of the analyzed polymer flow from the nozzle and for each analyzed gas pressure, except for one variant of the experiment (0.011 mL/min, 1.5 bar) in which the average fiber diameters were identical for pure 5% PEO (0% SPI) and the blend of PEO/SPI 1:1 (4.5% SPI). The increase in the average fiber diameter could be explained by the significantly higher apparent viscosity of the PEO/SPI 1:1 blend (SPI content 4.5%, PEO 5%) compared to that of pure 5% PEO, even though the PEO concentration in both samples was 5%. Greater apparent viscosity causes greater flow resistance and damping of tensile and shear forces, which leads to an increase in fiber diameter. The increase in the polymer flow rate from the nozzle did not affect the change in the average fiber diameter for the pure 5% PEO and PEO/SPI 1:1 blend, but the effect of pressure was visible. The increase in compressed gas pressure, which causes better stretching and formation of fibers and faster evaporation of the solvent, eliminates the impact of the higher viscosity of the PEO/SPI 1:1, hence, the difference in the obtained average diameter values for the pure 5% PEO and the PEO/SPI 1:1 blend decreased with increasing pressure. At the same time, too high of pressure (1.5 bar) prevented the production of fibers from the PEO/SPI 1:7 blend, whose apparent viscosity for all shear rate values did not exceed 600 mPas and was much lower than that of the pure 5% PEO. It is possible to produce fibers in the blowing process from solutions with low apparent viscosity with appropriate gas pressure. At a pressure of 0.5 bar, fibers from a PEO/SPI 1:7 blend were obtained, and their average diameter for the two polymer flow rates from the nozzle (0.005 mL/min and 0.011 mL/min) was more significant than the average diameter of fibers made of pure 5% PEO. A higher value of the average fiber diameter for the PEO/SPI 1:7 blend than for pure 5% PEO was also obtained for a pressure of 1 bar and a flow of 0.008 mL/min.
4. Conclusions
An increase in the apparent viscosity of PEO/SPI blends with a ratio of 1:1 to 1:4 above the viscosity of pure 5% PEO may suggest additional entanglement of polymer chains with protein chains and the appearance of bonds that affect the behavior of PEO/SPI blends. These bonds may play an essential role in blends with a high SPI content, where the apparent viscosity is lower than the viscosity of pure 5% PEO, and fibers are still formed in the blowing process. PEO/SPI blends with a high SPI content do not behave as predictably in the solution-blowing process as pure 5% PEO or even a PEO/SPI blend containing only 4.5% protein. This may be due to strong interactions between the polymer and protein chains. A rheological analysis carried out on an oscillatory rheometer made it possible to determine the behavior of the sample during flow in the nozzle. Still, only the study of extensional viscosity describing what is happening at the nozzle outlet—during fiber formation—would give a complete picture of the sample’s behavior and molecular structure.
PEO can be successfully used as a matrix to produce fibers containing materials that in their pure form do not have fiber-forming potential through polymer solution blowing. In this study, fibers were produced from an aqueous solution containing 7.88% SPI and only 1.25% PEO by solution blowing. This is, to the best of the authors’ knowledge, the first such achievement described in the literature.
Unlike electrospinning, the method of blowing from a polymer solution does not use high voltage—therefore, it is safer for the operator. At the same time, because it uses only aqueous solvents, it is also safer for the environment. A high protein content, with many different functional groups, with a simultaneous nanometric average diameter of the fibers, i.e., a large surface area, gives these fibers the potential for numerous applications, especially where there is a need to attach various functional compounds.


