Article

Technoeconomic Analysis for Green Hydrogen in Terms of Production, Compression, Transportation and Storage Considering the Australian Perspective

1
Victorian Hydrogen Hub (VH2), Swinburne University of Technology, Hawthorn, VIC 3122, Australia
2
FPD (Fluid and Process Dynamics) Group, Department of Mechanical and Product Design Engineering, Swinburne University of Technology, Hawthorn, VIC 3122, Australia
*
Author to whom correspondence should be addressed.
Processes 2023, 11(7), 2196; https://doi.org/10.3390/pr11072196
Submission received: 30 May 2023 / Revised: 17 July 2023 / Accepted: 18 July 2023 / Published: 21 July 2023

Abstract

:
This current article discusses the technoeconomics (TE) of hydrogen generation, transportation, compression and storage in the Australian context. The TE analysis is important and a prerequisite for investment decisions. This study selected the Australian context due to its huge potential in green hydrogen, but the modelling is applicable to other parts of the world, adjusting the price of electricity and other utilities. The hydrogen generation using the most mature alkaline electrolysis (AEL) technique was selected in the current study. The results show that increasing temperature from 50 to 90 °C and decreasing pressure from 13 to 5 bar help improve electrolyser performance, though pressure has a minor effect. The selected range for performance parameters was based on the fundamental behaviour of water electrolysers supported with literature. The levelised cost of hydrogen (LCH2) was calculated for generation, compression, transportation and storage. However, the majority of the LCH2 was for generation, which was calculated based on CAPEX, OPEX, capital recovery factor, hydrogen production rate and capacity factor. The LCH2 in 2023 was calculated to be 9.6 USD/kgH2 using a base-case solar electricity price of 65–38 USD/MWh. This LCH2 is expected to decrease to 6.5 and 3.4 USD/kgH2 by 2030 and 2040, respectively. The current LCH2 using wind energy was calculated to be 1.9 USD/kgH2 lower than that of solar-based electricity. The LCH2 using standalone wind electricity was calculated to be USD 5.3 and USD 2.9 in 2030 and 2040, respectively. The LCH2 predicted using a solar and wind mix (SWM) was estimated to be USD 3.2 compared to USD 9.6 and USD 7.7 using standalone solar and wind. The LCH2 under the best case was predicted to be USD 3.9 and USD 2.1 compared to USD 6.5 and USD 3.4 under base-case solar PV in 2030 and 2040, respectively. The best case SWM offers 33% lower LCH2 in 2023, which leads to 37%, 39% and 42% lower LCH2 in 2030, 2040 and 2050, respectively. The current results are overpredicted, especially compared with CSIRO, Australia, due to the higher assumption of the renewable electricity price. Currently, over two-thirds of the cost for the LCH2 is due to the price of electricity (i.e., wind and solar). Modelling suggests an overall reduction in the capital cost of AEL plants by about 50% in the 2030s. Due to the lower capacity factor (effective energy generation over maximum output) of renewable energy, especially for solar plants, a combined wind- and solar-based electrolysis plant was recommended, which can increase the capacity factor by at least 33%. Results also suggest that besides generation, at least an additional 1.5 USD/kgH2 for compression, transportation and storage is required.

1. Introduction

Hydrogen is vital in various industrial applications, including enhancing and purifying crude oil and as a precursor for chemicals such as methanol, ammonia and dimethyl ether. Hydrogen has recently been used as carbon-free fuels and reductants in mobility and green steel manufacturing. Currently, 90 million tonnes (Mt) of hydrogen is produced [1], out of which 59.7% is produced using steam methane reforming, 19% is from coal gasification, 0.6% is from oil reforming and the remaining 20.7% is from the crude by-product of naphtha reforming [1]. A minor amount of hydrogen is produced from renewable electrolysis technology. The worldwide consumption of hydrogen is rising at a rate of approximately 3–4% every year, primarily due to the increased demand for transportation fuels [2] and greater use in steel industries [3]. The major demand for hydrogen includes ammonia production (65%), methanol production (25%), direct reduced iron production (10%) and less than 1% for other purposes [1].
According to the IEA net zero emission target, hydrogen demand is forecasted to increase 6-fold to 530 Mt by 2050 [1]. However, hydrogen production contributes to a large amount of CO2 emission (900 MtCO2 per year), i.e., about 2.5% of the global emission from the energy and industry sector due to the current dominant hydro-carbon-based hydrogen production [1]. For example, steam methane reforming emits about 9–11 kgCO2 per kg of hydrogen [4,5]. Hence, a recent push worldwide is to produce green hydrogen from water electrolysis using green electricity such as solar and PV, especially from excess renewable electricity [6]. However, the widespread adoption of renewable energy sources (RESs) has the potential to negatively impact grid stability due to their fluctuating and uncertain nature [7]. To address this issue, hydrogen has been proposed as a significant energy storage solution on a large scale, utilising the process of water electrolysis [8].
There are four main technologies used for the electrolysis of water, including alkaline electrolysis, anion exchange membrane (AEM) electrolysis, proton exchange membrane (PEM) electrolysis and solid oxide electrolysis (SOE) [9]. Of those, alkaline electrolysis is the most mature and available for large-scale hydrogen production [10]. The cost of the alkaline electrolyser varies over 1000–5000 USD/kW with a production capacity of 1 to 760 Nm3/h [11]. An ordinary alkaline electrolysis cell comprises two Ni-based electrodes placed in a liquid electrolyte, typically a water solution of 30–35 wt.% KOH and separated by a porous diaphragm. The cell operates between 60 and 90 °C, and the pressure is usually below 30 bar. The hydrogen produced by this process has a purity level between 99.5% and 99.9%, which can be further enhanced up to 99.999% by catalytic gas purification systems [12].
Despite the availability and lower specific cost, alkaline electrolysis suffers from low current density (A/cm2) and lower efficiency and durability [8,10,12,13] as a result of electrode overvoltage [14,15], higher oghamic loss [16] and corrosive electrolyte [16,17]. The objective of this study is two-fold. In the first part of the study, we developed mathematical modelling to understand the fundamental physics of the electrolysis system. Secondly, we conducted a technoeconomic study of the alkaline electrolysis-based hydrogen generation, transportation, compression and storage system.
Salkuyeh et al., 2018 [4] studied the technoeconomics of hydrogen production from different biomass gasification. Their results showed that the cost of hydrogen ranges over 3–3.5 USD/kgH2 using a biomass-based system and is about 1.0 USD/kgH2 using steam methane reforming (SMR) without carbon capture and storage (CCS). Zghaibeh et al., 2022 [18] conducted technoeconomic modelling for a PV solar-based hydrogen generation system. The results showed that the levelised cost of hydrogen (LCH2) using a 5 MWp plant is 6.2 EUR/kg with a break-even period of 8 years. Benalcazar and Komorowska, 2022 [19] performed a technoeconomic analysis for a PEM hydrogen energy system and showed that the LCH2 in Poland ranges from 6.37 to 13.48 EUR/kg in 2020 and might decrease to 2.33 to 4.30 EUR/kg in 2030 and 1.23 to 2.03 EUR/kg in 2050. Considering the Italian scenario, Minutillo et al., 2021 [20] studied the LCH2 in refuelling stations with onsite hydrogen production via water electrolysis. The LCH2 was reported to be EUR 9.29 to EUR 12.48 per kg. Another study by Fragiacomo and Genovese [21] reported that the LCH2 ranges from EUR 6.90 to EUR 9.85 per kg, considering the Italian context. Lee et al., 2023 [22] reported an optimum LCH2 of 12.86 USD/kgH2 using a concentrated solar-powered hydrogen production system. Babarit et al., 2018 [23] studied the technoeconomic modelling of offshore wind-based hydrogen production systems, including transportation and distribution. In the shorter term, the cost of hydrogen was reported to be 7.1–9.4 EUR/kgH2 using the electricity price of 0.08 EUR/kWh, which in the long run would be 3.5 to 5.7 EUR/kg with the cost of electricity of 0.04 EUR/kWh. Ibagon et al., 2023 [24] reported a much lower LCH2 ranging from 3.5 USD/kgH2 in 2022 to 2.3 USD/kgH2 in 2030.
Recently, Jang et al., 2022 [25] studied the LCH2 for four different water electrolysis systems, including alkaline water electrolysis (AWE), proton exchange membrane electrolysis (PEMEC), solid oxide electrolysis with electric heaters (SOEC-EH) and solid oxide electrolysis combined with a waste heat source (SOEC-WH). The results showed that the LCH2 values for AWE, PEMEC, SOEC-EH and SOEC-WH are 7.60, 8.55, 10.16 and 7.16 USD/kgH2, respectively. The levelised cost of hydrogen generation, transportation and storage depends on various factors, including electricity price, travel distance, transportation mode and technology choice [24]. Table 1 summarises the technoeconomic modelling available in the literature.
Numerous studies in the literature discussed the technoeconomics of green hydrogen, particularly considering the European context [19,20]. However, limited studies are available in the open literature for detailed technoeconomics of green hydrogen for the Australian context. Furthermore, the levelised cost of hydrogen for transportation, compression and storage is rare in the literature besides generation. Moreover, Sanchez et al., 2020 [10] recently studied the alkaline electrolysis (AEL) system for hydrogen production using Aspen Plus and mathematical modelling with experimental validation. The results revealed that increasing stack temperature but decreasing pressure helped improve the stack performance and suggested that technoeconomic modelling is necessary to elucidate the system viability fully.
Although the fundamental study of AEL and technoeconomic modelling are not directly co-related, some overview of AEL performance parameters may help the reader understand factors affecting its performance. Hence, in this study, in addition to briefly discussing the fundamental aspect of AEL electrolysis-based hydrogen production, we endeavour to highlight technoeconomic analysis for hydrogen generation, compression, transportation and storage, especially considering the Australian context.

2. Methodology

2.1. Fundamental Equations in Producing Hydrogen Using Alkaline Electrolysis

Equations listed in Table 2 were employed to carry out the mathematical modelling. A detailed explanation of those equations can be found in Sanchez et al., 2020 [10]. Hence, this section only explains the key parameters briefly.
The cell voltage is a crucial parameter for analysing the performance of AEL and is calculated using Equation (2), originally developed by Ulleberg, 2003 [26]. The hydrogen production rate depends on the electrochemical performance of the cell, which is calculated using Equations (6)–(9). The total energy demand for the production of hydrogen is shown in Equation (10).

2.2. Technoeconomic Analysis for Hydrogen Generation, Compression and Storage

Considering the Australian context, this study conducted a technoeconomic analysis of hydrogen generation, compression and storage. Some of the key aspects and assumptions made for the technoeconomic analysis include the following and are also shown in Table 3:
  • The capital cost of the current electrolyser is collected from Refs. [27,28], while the future price is based on the CSIRO report in Ref. [29].
  • The levelised cost of hydrogen (LCH2) production was evaluated/predicted for 2023, 2030, 2040 and 2050.
  • The LCH2 was predicted considering different electricity sources such as grid, standalone solar photovoltaic (PV), standalone wind, and a mix of solar PV and wind. The capacity factors for solar PV and wind were based on the AEMO estimates/projections [28].
  • Tube trailer/truck was considered to be the mode of compressed hydrogen delivery.
  • For technoeconomic modelling, a 10 MW AEL electrolyser was chosen for hydrogen production. Analysis was carried out under different electricity prices, capacity factors and efficiencies to assess the economics of hydrogen production.
  • Unless otherwise stated, all costs reported in the report are in 2023 US dollars (2023 USD).
Table 3. Key assumptions for electrolyser capital and operating cost [27,30,31,32].
InputUnits/Note2023203020402050
Electrolyser Parameters
Efficiency%61.73%70%73%76%
Electricity Consumption (kWh)kWh/kg54.0052.0050.0048.00
Water ConsumptionL/kgH210999
Capacity Factor%0–1000–1000–1000–100
Lifetime Stack Highhours80,00080,000100,000120,000
Degradation rate%1.01.01.01.0
Electrolyser CAPEX
CapacityMW10101010
Equipment costUSD/kW1400850 [33]700 [33]300 [29]
Total Direct Cost 18,000,000 7,000,000 5,130,000 4,410,000
Construction and Site19% of direct cost3,410,000 1,330,000 975,000 838,000
Engineering Service1%180,000 70,000 51,300 44,100
Project Contingency10–15%1,800,000 700,000 513,000 441,000
Total Indirect Cost 5,390,000 2,100,000 1,540,000 1,320,000
Total CAPEX 23,300,0009,100,0006,670,0005,730,000
Electrolyser OPEX
Electricity SourceOptional listWind powerWind powerWind powerWind power
Electricity price
Water TypeOptional listDesalinated waterDesalinated waterDesalinated waterDesalinated water
Water CostUSD/L0.00500.00500.00500.0050
O&M Cost (%) of CAPEX2.52.52.52.5
Stack Substitution(%) of CAPEX20202020
This study analysed the cost of hydrogen generation, transportation and storage under different scenarios and timelines. For example, hydrogen production cost in Australia was determined based on the variability of wind, solar and grid electricity prices. Moreover, we evaluated the cost of hydrogen production in Australia for 2023, 2030, 2040 and 2050. The following sections describe various costs associated with the levelised cost of hydrogen.

2.2.1. Evaluation of Levelised Cost of Hydrogen under Different Scenarios

This study modelled current and future hydrogen costs using an AEL electrolyser considering the base and best cases for the grid and renewable electricity price. The grid electricity price for 2022, 2030, 2040 and 2050 was sourced from the projection presented in the CSIRO report [34]. However, for the cash flow (upfront CAPEX, fixed operation and maintenance (FO&M) and ongoing CAPEX and water cost) and levelised cost analysis, the electricity price in the intermediate years was determined by linear interpolation. The solar and wind electricity prices were collected from the CSIRO projection for 2022, 2030, 2040 and 2050, reported in Ref. [29]. The same approach as that for grid electricity was applied to determine the electricity price for the intermediate years.
The levelised cost of hydrogen (LCH2) is a useful indicator for the economic viability of hydrogen production and was determined using the following formula [31]:
L C H 2   $ k g H 2 = C A P E X × C r   × O P E X P r × 8760 × C f
where
CAPEX = Capital expenditure;
Cr = Capital recovery factor;
OPEX = Operating expenditure;
Pr = Hydrogen production rate (kg/y);
Cf = Capacity factor.

2.2.2. Technoeconomic Analysis for the Compression of Hydrogen

The levelised cost of hydrogen for compression is capital cost plus energy- and non-energy-related operating cost. The following formula was used to determine the simplified levelised cost of hydrogen compression [31].
L C H 2 c o m $ K g H 2 = C A P E X c o m $ K g H 2 + E n e r g y   O P E X c o m p $ K g H 2 + N o n e n e r g y   O P E X c o m p $ U S D K g H 2
The assumption for the modelling of L C H 2 c o m is reported in Table 4. The capital cost for the compression was calculated based on Equation (22). Here, the design capacity determines the amount of hydrogen that can be compressed throughout the year. The capacity factor or availability of a compressor is generally assumed to be 90%, meaning an outage of 10% of the time in a year.
C A P E X H 2 c o m $ K g H 2 = A n n u a l i e s   T C I $ y r D e s i g n   c a p a c i t y k g H 2 d a y × 365 × C a p a c i t y   f a c t o r ( % )
where
A n n u a l i s e d   T C I $ y r = T C I × C R F
where TCI = total capital investment (USD), calculated based on
T C I = T I C × i n d i r e c t   c o s t
where TIC is the total installation cost, calculated based on the following equation:
T I C = C o m p r e s s o r   c o s t × I n s t a l l a t i o n   f a c t o r   ( I F )
CRF is the capital recovery rate which is calculated based on the following equation.
C R F = i ( 1 + i ) n ( 1 + i ) n 1 ( i = discount   rate ,   % ,   and   n   =   compressor   lifetime )
In this modelling, the indirect cost was assumed to be 40% of the total installation cost, which considered the following parameters: site preparation = 5% of TIC, engineering and design = 10% of TIC, project contingency = 10% of TIC, permitting = 3% of TIC and owner’s costs = 12% of TIC [35]. The operating cost is composed of energy- and non-energy-related costs.
Energy-related operating cost was calculated based on the following equation:
E n e r g y   O P E X c o m p $ K g H 2 = E l e c t r i c i t y   c o s t $ y r D e s i g n   c a p a c i t y k g H 2 d a y × 365 × C a p a c i t y   f a c t o r   ( % )
On the other hand, non-energy-related operating cost was calculated based on the following equation:
N o n e n e r g y   O P E X c o m p $ K g H 2 = N o n e n e r g y   O P E X $ y r D e s i g n   c a p a c i t y k g H 2 d a y × 365 × C a p a c i t y   f a c t o r ( % )
N o n e n e r g y   O P E X = T o t a l   l a b o u r   c o s t $ y r + F i x e d   O & M $ y r
Hence,
T o t a l   l a b o u r   c o s t $ y r = D i r e c t   l a b o u r $ y r + I n d i r e c t   l a b o u r $ y r
D i r e c t   l a b o u r $ y r = A n n u a l   h o u r h / y r × L a b o u r   r a t e $ / h
A n n u a l   l a b o u r   h o u r h y r = 288 × C o m p r e s s o r   f l o w   r a t e ( k g H 2 / d a y ) 100,000 0.25
I n d i r e c t   l a b o u r $ y r = D i r e c t   l a b o u r $ y r × I n d i r e c t   l a b o u r   f a c t o r   ( % )
Finally, fixed operations and maintenance (O&M) costs were calculated considering operating, maintenance and repairs = 4% of TIC; insurance = 1% of TCI; property tax = 1% of TCI; and licensing and permitting = 0.1% of TCI.
Table 4. Detailed economic assumptions for the calculation of LCH2 for compression.
FactorValueComment and Ref.
Inflation rate2–4%[36,37]
Discount rate 8% Discount rate = weighted average cost of capital (WACC)
Project lifetime25 years Assumed [35]
Electricity cost0.8 USD/kWh[34,38]
Capacity factor 95%Assumed [35]
Scaling factor 0.83Assumed [35]
Installation factor 2Assumed [35]
Compressor costCC [2022 USD] = 3083.3 × (Prated)SF, where scale factor (SF) = 0.8335The data were retrieved from [35] and converted into 2023 USD using the inflation rate provided in Ref. [36]
Labour rate 75.5 USD/hRef. [39]
Indirect labour factor50%Ref. [35]

3. Results and Discussion

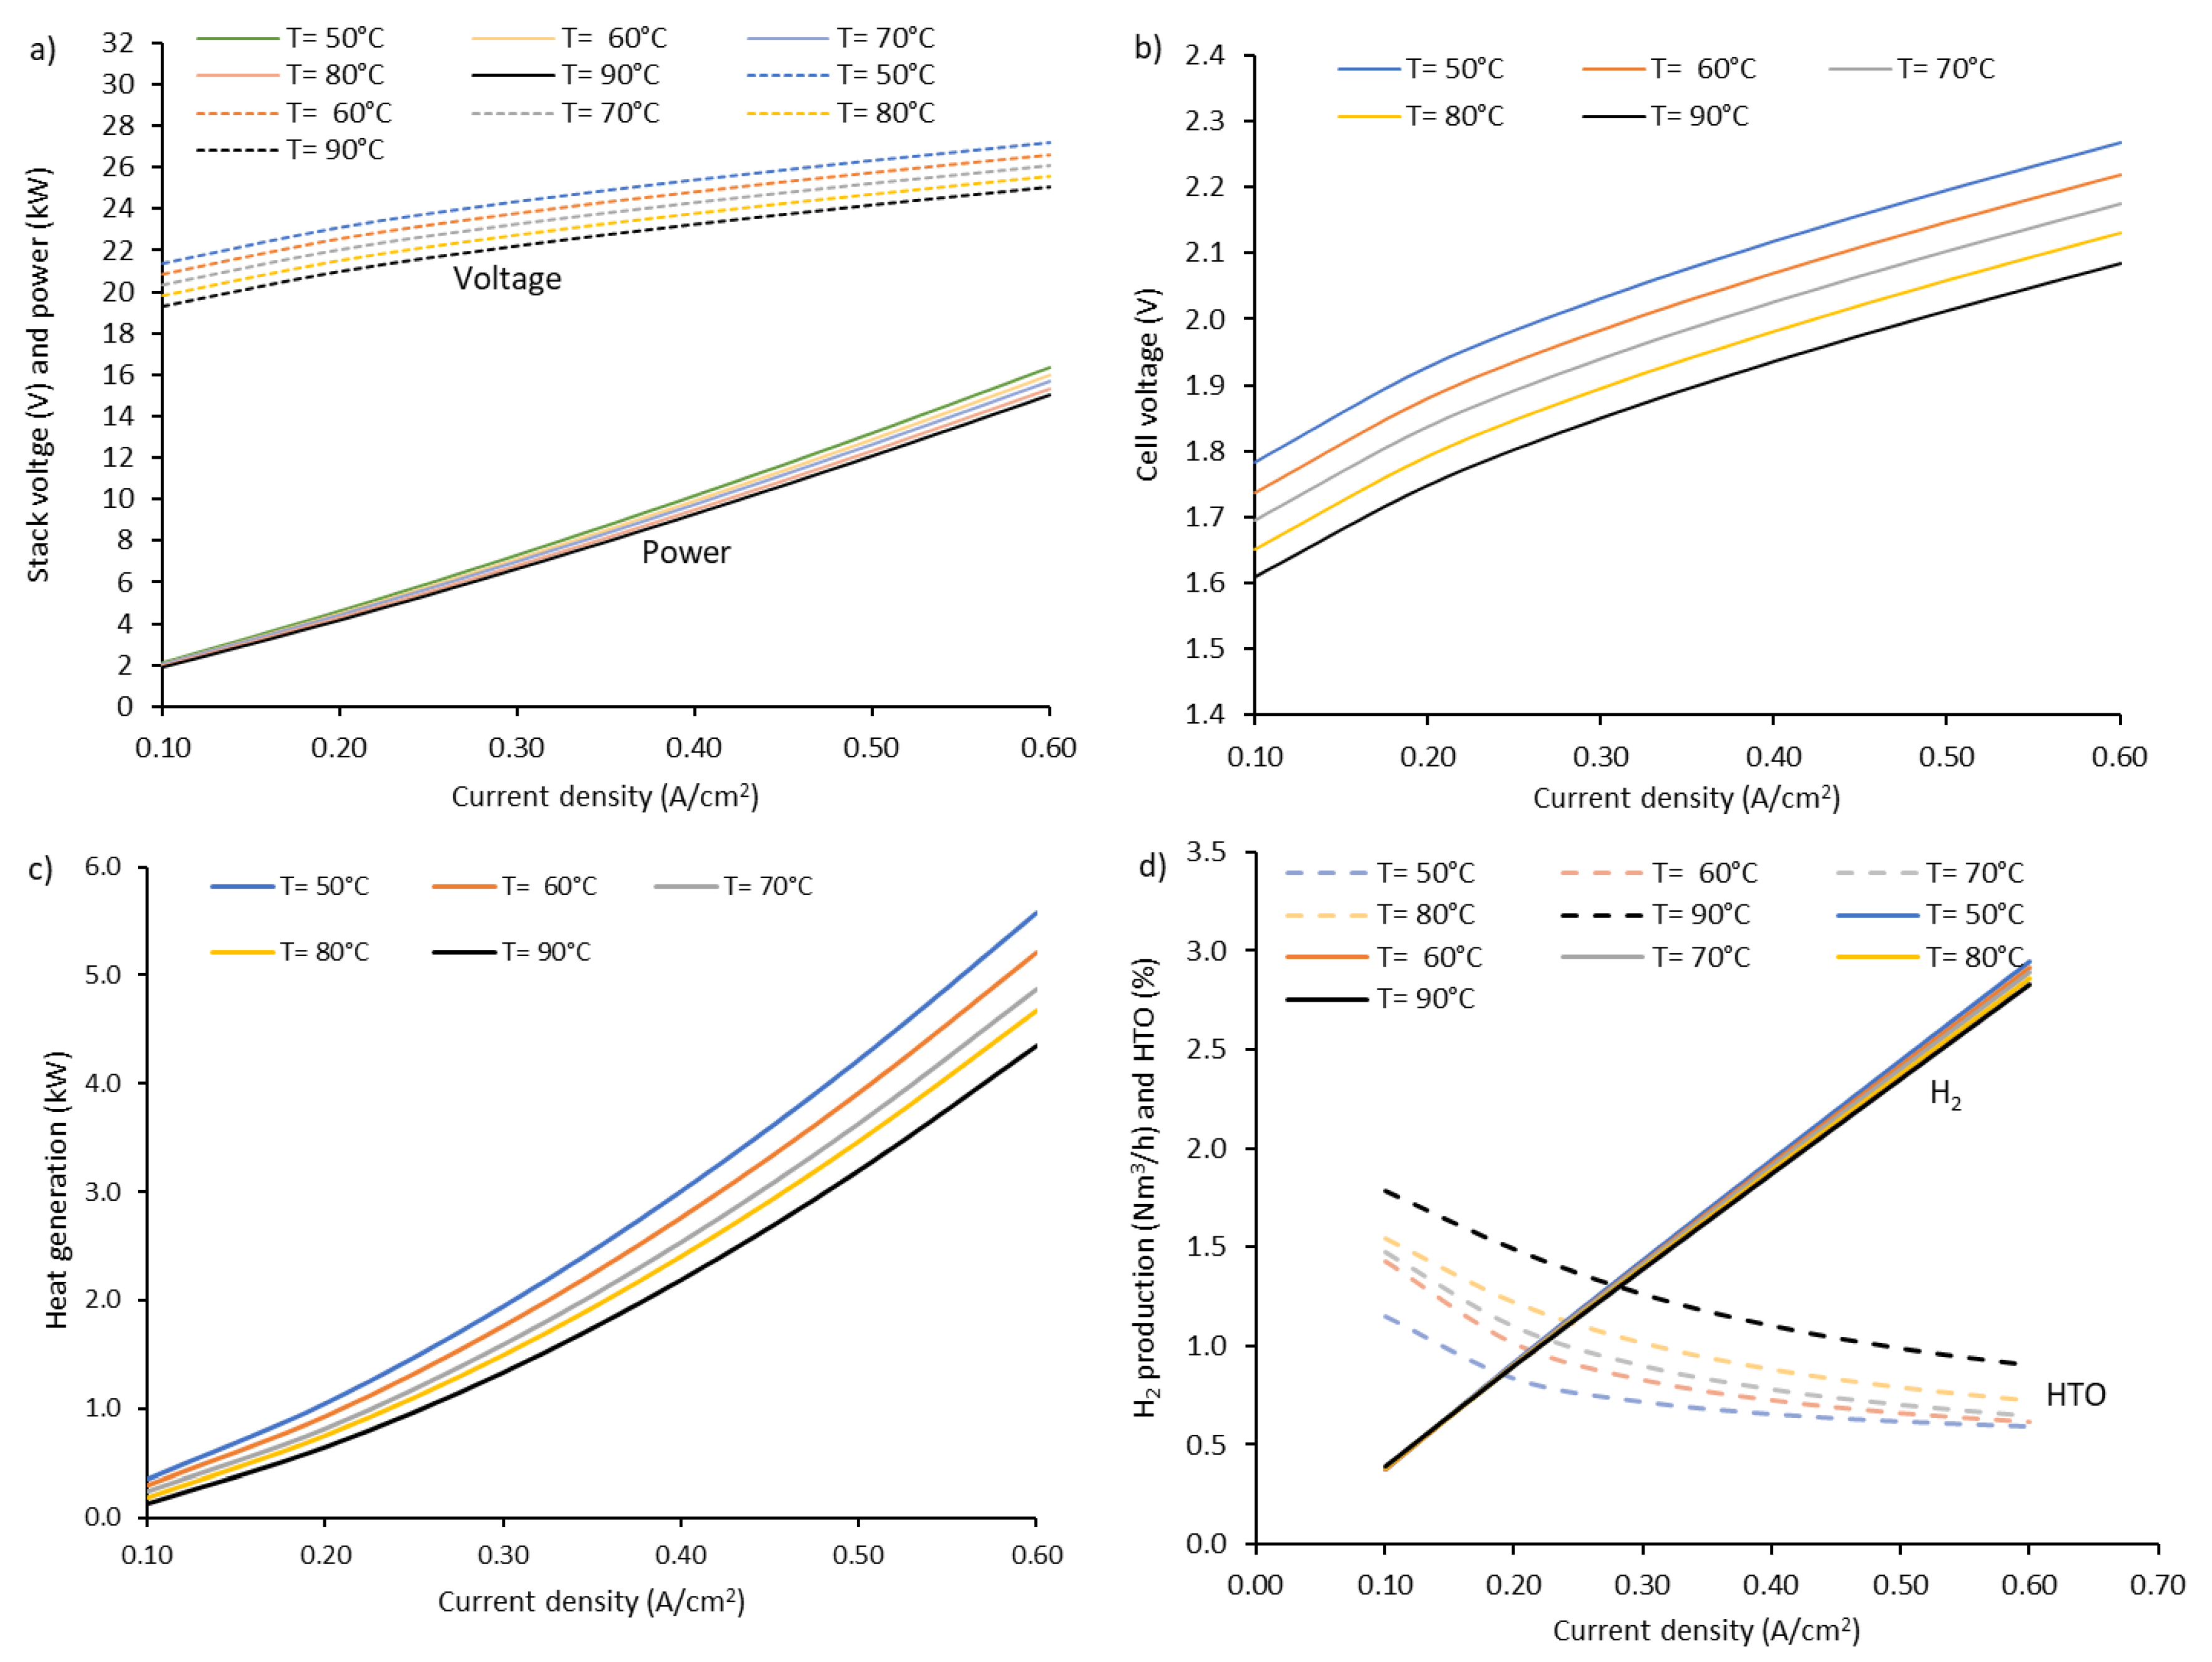
3.1. Mathematical Modelling of AEL

The performance parameters of the electrolyser, such as stack power, cell voltage, heat generation, hydrogen production and the diffusion of hydrogen to oxygen (HTO), are shown in Figure 1a concerning current density and stack temperature. Increasing the current density increases stack voltage and corresponding power progressively. The stack voltage is recorded as 21.4 to 27.20 V at a temperature of 50 °C using the current density of 0.1 to 0.6 A/cm2. However, increasing temperature decreases the stack voltage steadily. For instance, using the current density of 0.1 A/cm2, the stack voltage decreases from 21.4 to 19.3 V when the temperature is increased from 50 to 90 °C. As a result, with increasing temperature, the stack power demand in the electrolyser decreases [10]. At 50 °C, stack power is found to be 2.14 to 16.32 W over the current densities. Over the temperature range (50 to 90 °C), the stack power decreases by 0.21 to 1.3 W for the current density of 0.1 to 0.6 A/cm2.
The effect of current density on cell voltage is shown in Figure 1b. Increasing the current density increases the cell voltage [10]. However, an opposite trend with increasing temperature is observed. The cell voltage is found to be 1.78 to 2.27 at 50 °C and decreases to 1.61 to 2.09 at 90 °C. The heat generated in the stack increases exponentially with increasing current density [10]. Similar to cell voltage and stack power, increasing temperature decreases the heat generation primarily due to activation overpotential, as shown in Figure 1c. Heat generation is recorded to be 0.29 to 5.22 kW over the current density at 50 °C and decreases to 0.12 to 4.35 kW at 90 °C.
The effect of temperature on hydrogen production and the content of H2 in oxygen (HTO) is shown in Figure 1d. As can be seen, increasing current density increases hydrogen production. However, overall, increasing the temperature decreases hydrogen production [10]. This result is attributed to the fact that increasing temperature decreases the resistance, resulting in increasing parasitic loss and thus lowering Faradic efficiency [26]. The maximum H2 production at 0.6 A/cm2 is recorded to be 2.94 Nm3/h at 50 °C and decreases to 2.83 Nm3/h at 90 °C. Increasing current density exponentially decreases the quantity of hydrogen in the oxygen, but increasing temperature increases the HTO, producing more impurities at higher temperatures [11]. With increasing temperature, impurities increase due to diffusion phenomena and gas migration [10]. At 50 °C, An HTO of 1.15 to 0.6 was recorded over the current densities, and the HTO increased by 0.64 to 0.31%-point when the temperature was increased to 90 °C over the current densities. Noticeably, the content of hydrogen in oxygen is higher at lower current density due to the lower gas production [11,40]. Hence, an electrolysis system needs to maintain an optimum current density balancing with heat loss and purity to ensure safety standards [40].
The effect of pressure (bar) on the performance of the alkaline electrolyser at a constant temperature of 75 °C is shown in Figure 2. Pressure is found to have minimal effect on all performance parameters. For example, the cell voltage is recorded to be 1.67 to 2.15 V at 5 bar, increasing slightly to 1.67 to 2.17 when the pressure is increased to 13 bar (Figure 2a). The trend is found to be opposite to that of temperature. Stack voltage increases with increasing pressure negligibly with an average voltage of 20–26 V over the current density of 0.1 to 0.6 A/cm2. However, the stack power is recorded to be 2.0 to 15.55 kW on average—increasing pressure increases the power insignificantly (Figure 2b). The average heat generation concerning current density is 0.2 to 4.75 kW (Figure 2c). Production of hydrogen concerning pressure has no effect with 0.38 to 2.87 Nm3/h over the current density (Figure 2d). An exponential decay for HTO concerning current density is found with significantly higher impurities or HTO using pressure over 11 bar, because increasing pressure increases the solubility of gas in the electrolyte and diffusion of gases between the electrolytic cells [10].

3.2. Technoeconomic Analysis Results

Levelised Cost of Hydrogen

The current LCH2 using grid electricity was calculated to be USD 5.0, which increases to just over USD 6.0 and USD 7.0 in 2030 and 2040, respectively, assuming a capacity factor of 95%, as shown in Figure 3a. As expected, the major contributor in LCH2 is electricity (70.8%), followed by upfront CAPEX (20.8%), fixed operation and maintenance (FO&M) (5.8%), ongoing CAPEX (1.7%) and water (0.9%). The upfront CAPEX and electricity cost can be summed to 92%. The cost of grid electricity is forecasted to increase in the coming years, with a prediction of about 43% and 75% in 2030 and 2040, respectively, because of the cheaper renewables and government policies [41]. However, the cost of other aspects will decrease, especially upfront CAPEX and FO&M.
The LCH2 using electricity from standalone solar PV is shown in Figure 3b. The LCH2 in 2023 is calculated to be USD 9.6 using a base-case solar electricity price of 65–38 USD/MWh in contrast to grid electricity price of 67–155 USD/MWh over the cash flow period of 2023–2053. Noticeably, the higher LCH2 using electricity from standalone solar PV is primarily due to the lower capacity factor of about 0.30. Thus, using solar AEL, the total hydrogen production over the period is predicted to be 68% lower than that for grid-based AEL, which leads to an increase in all other costs in cash flow. The contribution of solar electricity (65%) in current LCH2 is 6.0%-point lower than that of grid electricity (71%). However, the upfront CAPEX, FO&M and ongoing CAPEX using solar electricity are 6%, 1.5% and 0.4%-point higher than grid electricity. A sharp decline in upfront CAPEX, solar electricity and overall LCH2 is expected by 2030. As seen, the LCH2 is expected to be USD 6.5 and USD 3.4 by 2030 and 2040. The LCH2 using solar power varies significantly depending on the geographical location. For example, considering the European context, Lee et al., 2023 [22] reported an optimum LCH2 of 12.86 USD/kgH2 using concentrated solar power, while Ibagon et al., 2023 [24] reported a much lower LCH2 with 3.5 USD/kgH2 considering the South American country Uruguay because the cost of solar electricity and the capacity factor vary significantly with respect to geographical location [24].
Moreover, cost reduction (LCH2) using wind is more promising. The predicted LCH2 using electricity from standalone wind energy is shown in Figure 3c. The current LCH2 using wind is determined to be about USD 7.7 using a base-case electricity price of 57–52 USD/MWh over the cash flow period of 2023–2053 compared to the forecasted solar electricity price of 65–38 USD/MWh. The current LCH2 using wind is USD 1.9 lower than that for solar-based electricity.
Despite higher electricity prices, the lower LCH2 using standalone wind is primarily due to the higher capacity factor of about 0.40–0.46 over the cash flow period of 2023 to 2053. Thus, using wind-based standalone AEL, the total hydrogen production over the period is calculated to be 20% higher than that for solar-based AEL, leading to a decrease in the LCH2. Despite the lower cost, the cost contribution in CAPEX, FO&M and ongoing CAPEX from current wind-based LCH2 is roughly similar to that of standalone solar. As in the case of standalone solar, a sharp decline in upfront CAPEX, electricity and overall LCH2 is expected using wind-based electricity in the coming decades. Babarit et al., 2018 [23] reported an LCH2 of about 10–14 USD/kgH2 using the current offshore wind-based electricity price of USD 0.12/kWh. The LCH2 using standalone wind electricity is calculated to be USD 5.3 and USD 2.9 in 2030 and 2040, as shown in Figure 3c.
A remarkable decrease in cash flow parameters and overall LCH2 is predicted using a solar and wind mix (SWM), as shown in Figure 3d. Currently, the LCH2 using SWM is estimated to be USD 3.2 compared to USD 9.6 and USD 7.7 using standalone solar and wind. This cost is expected to decrease further in the coming decades, with an estimated LCH2 at USD 2.7, USD 2.5 and USD 2.4 in 2030, 2040 and 2050, respectively. This decrease in LCH2 using SWM is primarily due to the increase in the capacity factor by at least 33%.
In contrast, considering the best-case renewable electricity price, the scenario changes substantially regarding current and future cash flow parameters and LCH2. The best-case solar and wind electricity price is projected to be 44 to 18 USD/MWh and 45 to 30 USD/MWh, compared to 65 to 38 USD/MWh and 57 to 52 USD/MWh under the base case over the cash flow period of 2023 to 2053. Under the best-case scenario, the current LCH2 using standalone solar is calculated to be USD 5.7, which is USD 3.9 lower than that under the base case, as shown in Figure 4a. Likewise, in the base case, the cash flow parameters and LCH2 under the best case are forecasted to decrease sharply in the coming decades. For instance, LCH2 under the best case is predicted to be USD 3.9 and USD 2.1 compared to USD 6.5 and USD 3.4 under base-case solar PV in 2030 and 2040, respectively.
Furthermore, according to Figure 4b, the current and future LCH2 values using standalone wind are predicted to be about 7–8% lower than those using standalone solar. Moreover, considering best-case SWM, a drastic decrease in current and future LCH2 is determined. As shown in Figure 4c, using the best-case SWM, the current LCH2 is ~USD 2.1, decreasing to USD 1.7, USD 1.5 and USD 1.4 in 2030, 2040 and 2050. Hence, using SWM, compared to the base case, the best case offers 33% lower LCH2 in 2023, which leads to 37, 39 and 42% in 2030, 2040 and 2050, respectively.
The following section describes the cost of hydrogen compression, transportation and storage. These studies are particularly important if industries want to source hydrogen from a hydrogen generation plant instead of onsite generation. Hence, knowing the entire cost breakdown associated with hydrogen and its implications is important.

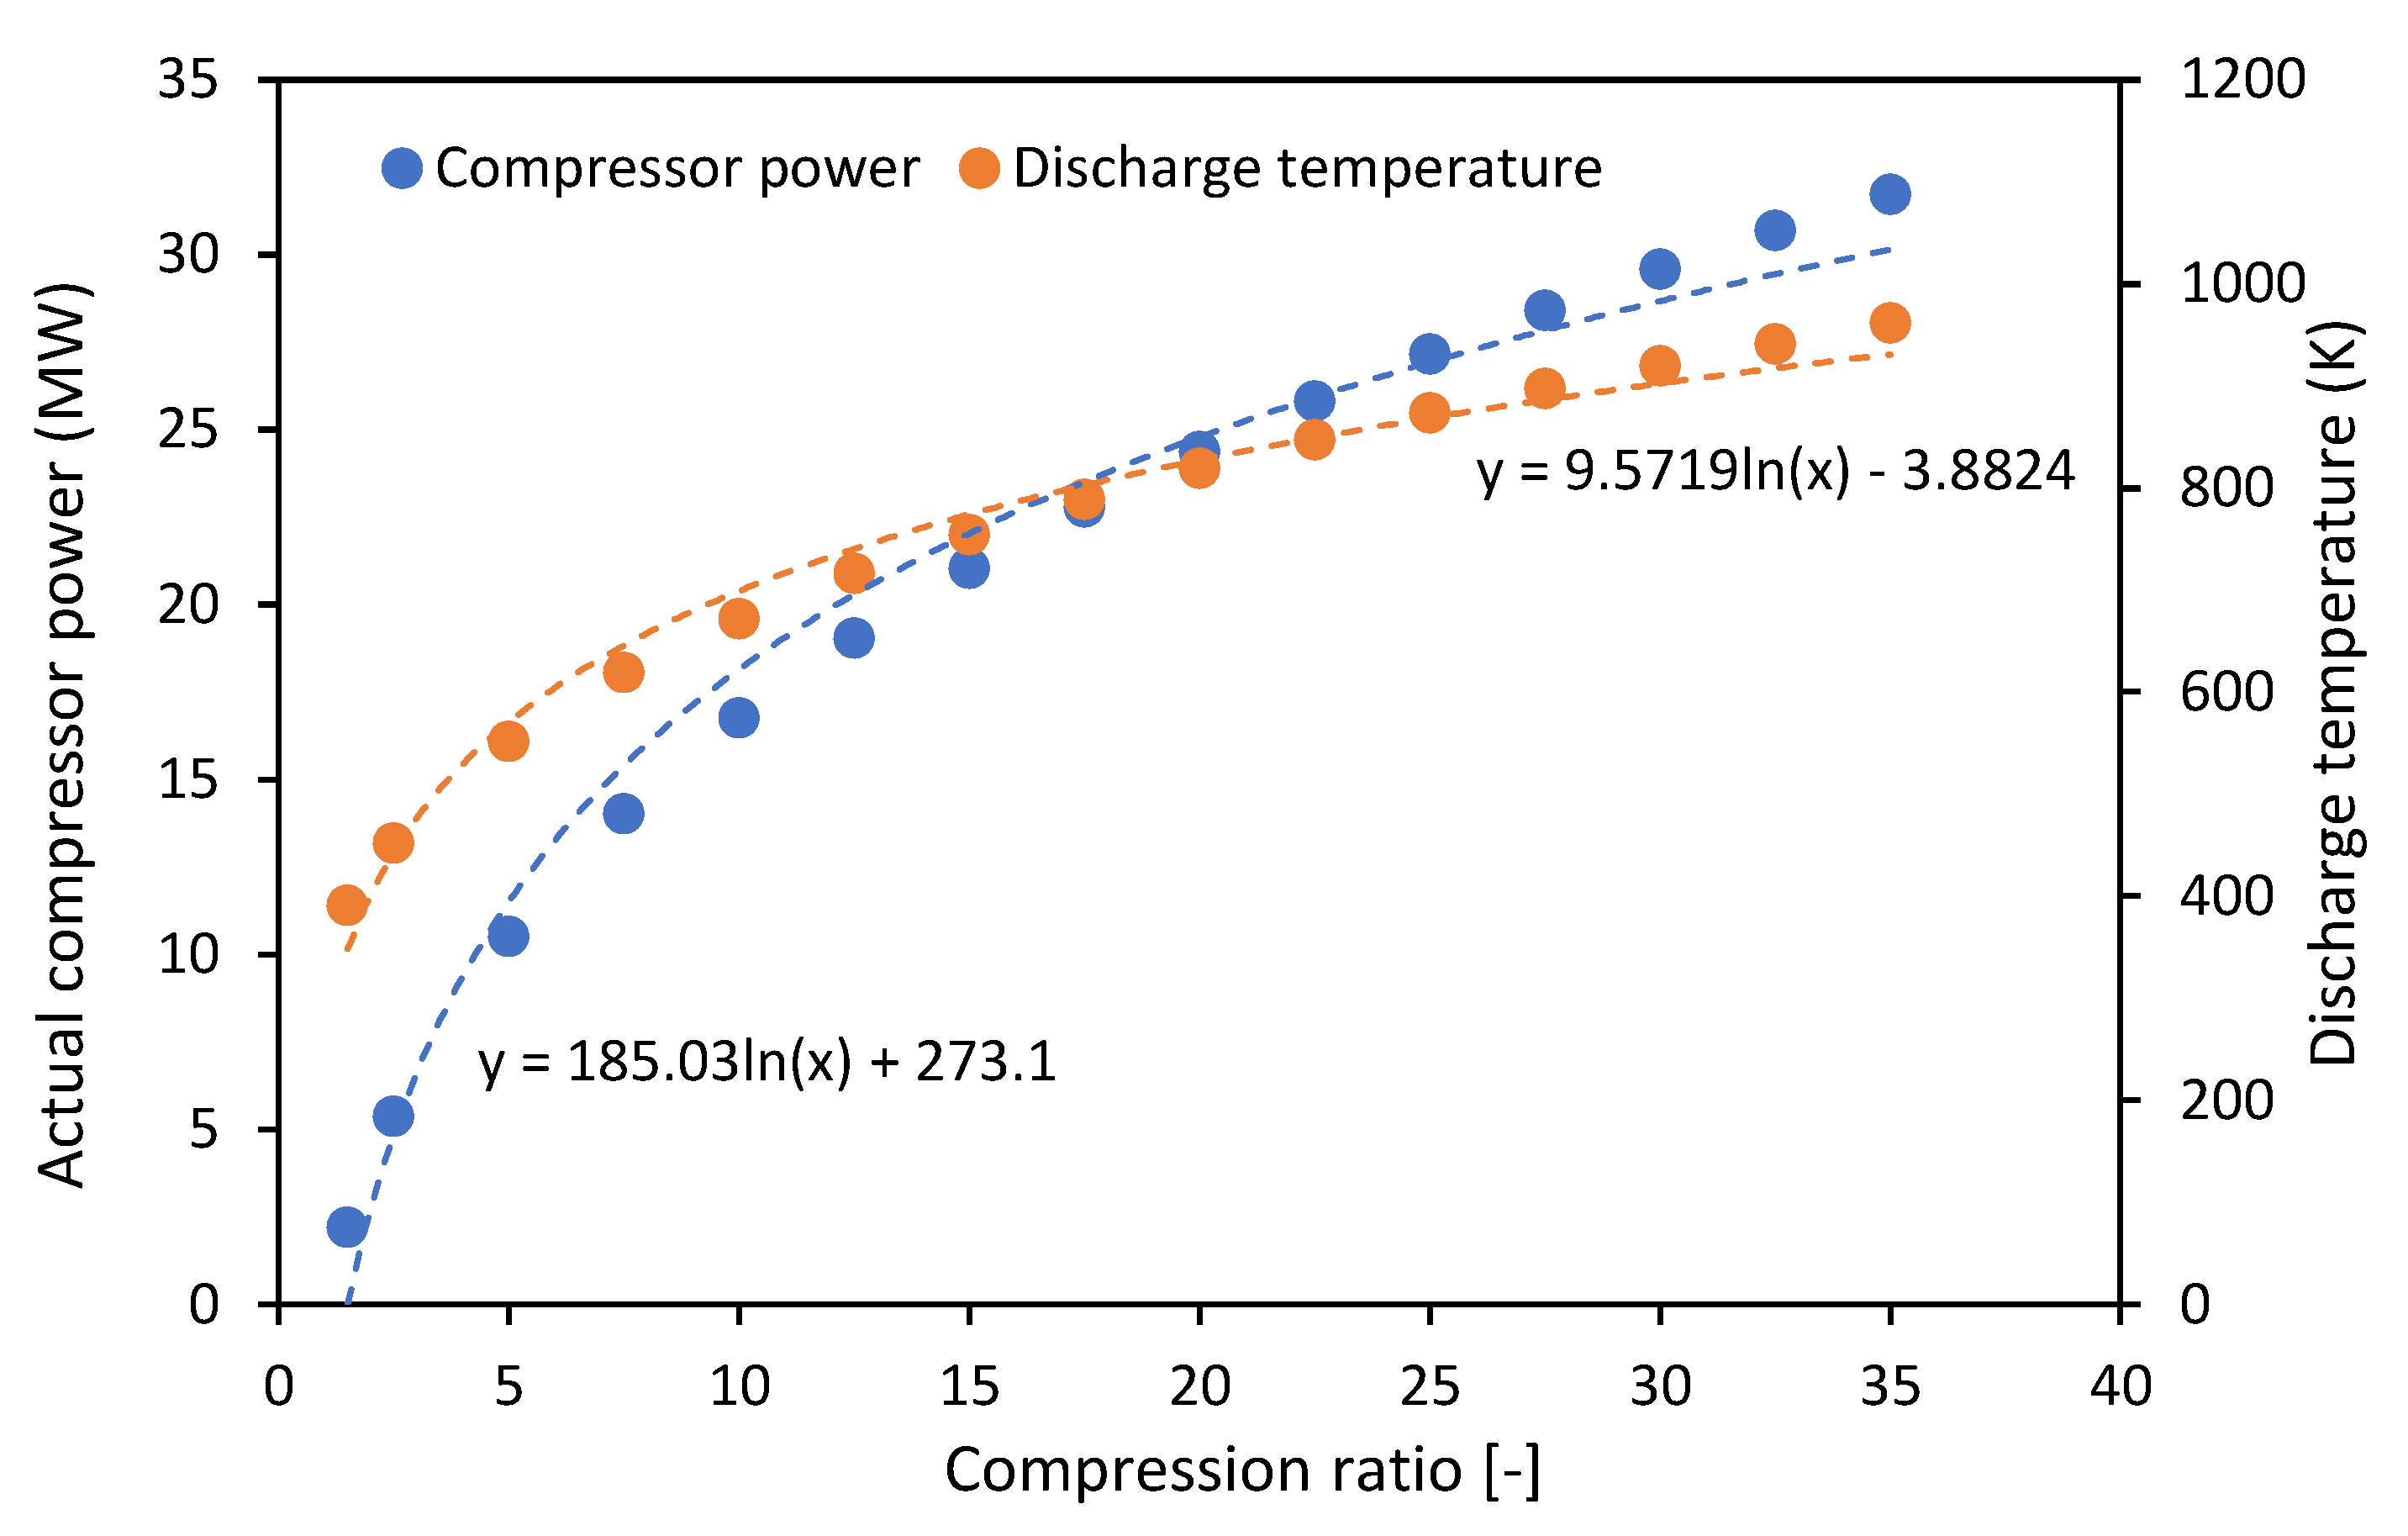
3.3. Compressor Power Calculation

Followed by the cost of production, hydrogen compression dominates the delivery cost in the hydrogen supply chain [42]. Thus, some basic calculations to understand the energy, capital expenditure, operating cost and levelised cost for compression are reported in this section. A single-stage compressor was designed with a capacity of 123,196 Nm3H2/h (10.96 tH2/h) using solar and wind farms, assuming a design capacity of 600 MW with a capacity factor of 0.3 and 0.45, respectively. The process flow diagram for H2 compression is shown in Figure 5.
In modelling, the suction pressure and temperature of the compressor are assumed to be 20 bar and 75 °C, respectively, while the efficiency of the compressor is assumed to be 85%. Moreover, the detailed formulas and assumptions used for the modelling are reported in Table 2. The required isentropic power for the single-stage reciprocating compressor is designed at various compression ratios or discharge pressure according to the following equations [35].
p i = 2.31 k ( k 1 ) × ( T d i s T s u c t ) M   ×   Q m
Pi = Power (kW);
Tsuct = Compressor inlet temperature (K);
Tdis = Compressor outlet temperature (K);
M = Molar weight of the hydrogen gas (g/mol);
Qm = Compressor throughput (kg/h);
k = Isentropic coefficient of the gas (1.4).
The discharge temperature of the compressor was calculated using the following formula:
T o u t T i n = p 2 p 1 ( γ 1 ) γ γ = C p C v
The effect of the compression ratio (outlet to the inlet pressure of the gas) on compressor power and discharge temperature is shown in Figure 6. The study considered the discharge pressure of 30 to 700 bar, leading to a compression ratio of 1.5 to 35. As an obvious fact, increasing compression ratio (CR) increases the power required and discharge temperature of the compressor following a logarithmic trend. Generally, the tube trailer is filled with pressure over 350 bar. Results show that a tube trailer with a pressure of 350 bar (CR = 17.5) requires a compressor with a power of 22.8 MW, while a compressor power of 32 MW is required when doubling the tube pressure. Increasing the compression ratio leads to an increase in the discharge temperature. For example, at a CR of 17.5, the discharge temperature is 789 K compared to 962 K using a CR of 35.
The energy consumption for hydrogen compression concerning the compression ratio is shown in Figure 7. This figure also shows the percentage of energy required from hydrogen itself for compression. Increasing the compression ratio increases energy consumption, as does hydrogen energy. Noticeably, the increase in energy consumption at lower CR is faster than that at higher CR. As can be seen, compression of H2 with a compression ratio between 1.5 and 35 leads to the consumption of energy with a range of 0.25 to 3.4 kWh/kgH2, which is equivalent to 0.70 to 10% of the energy from H2 considering a lower heating value, compared to 40% loss of energy for making liquid hydrogen [43].

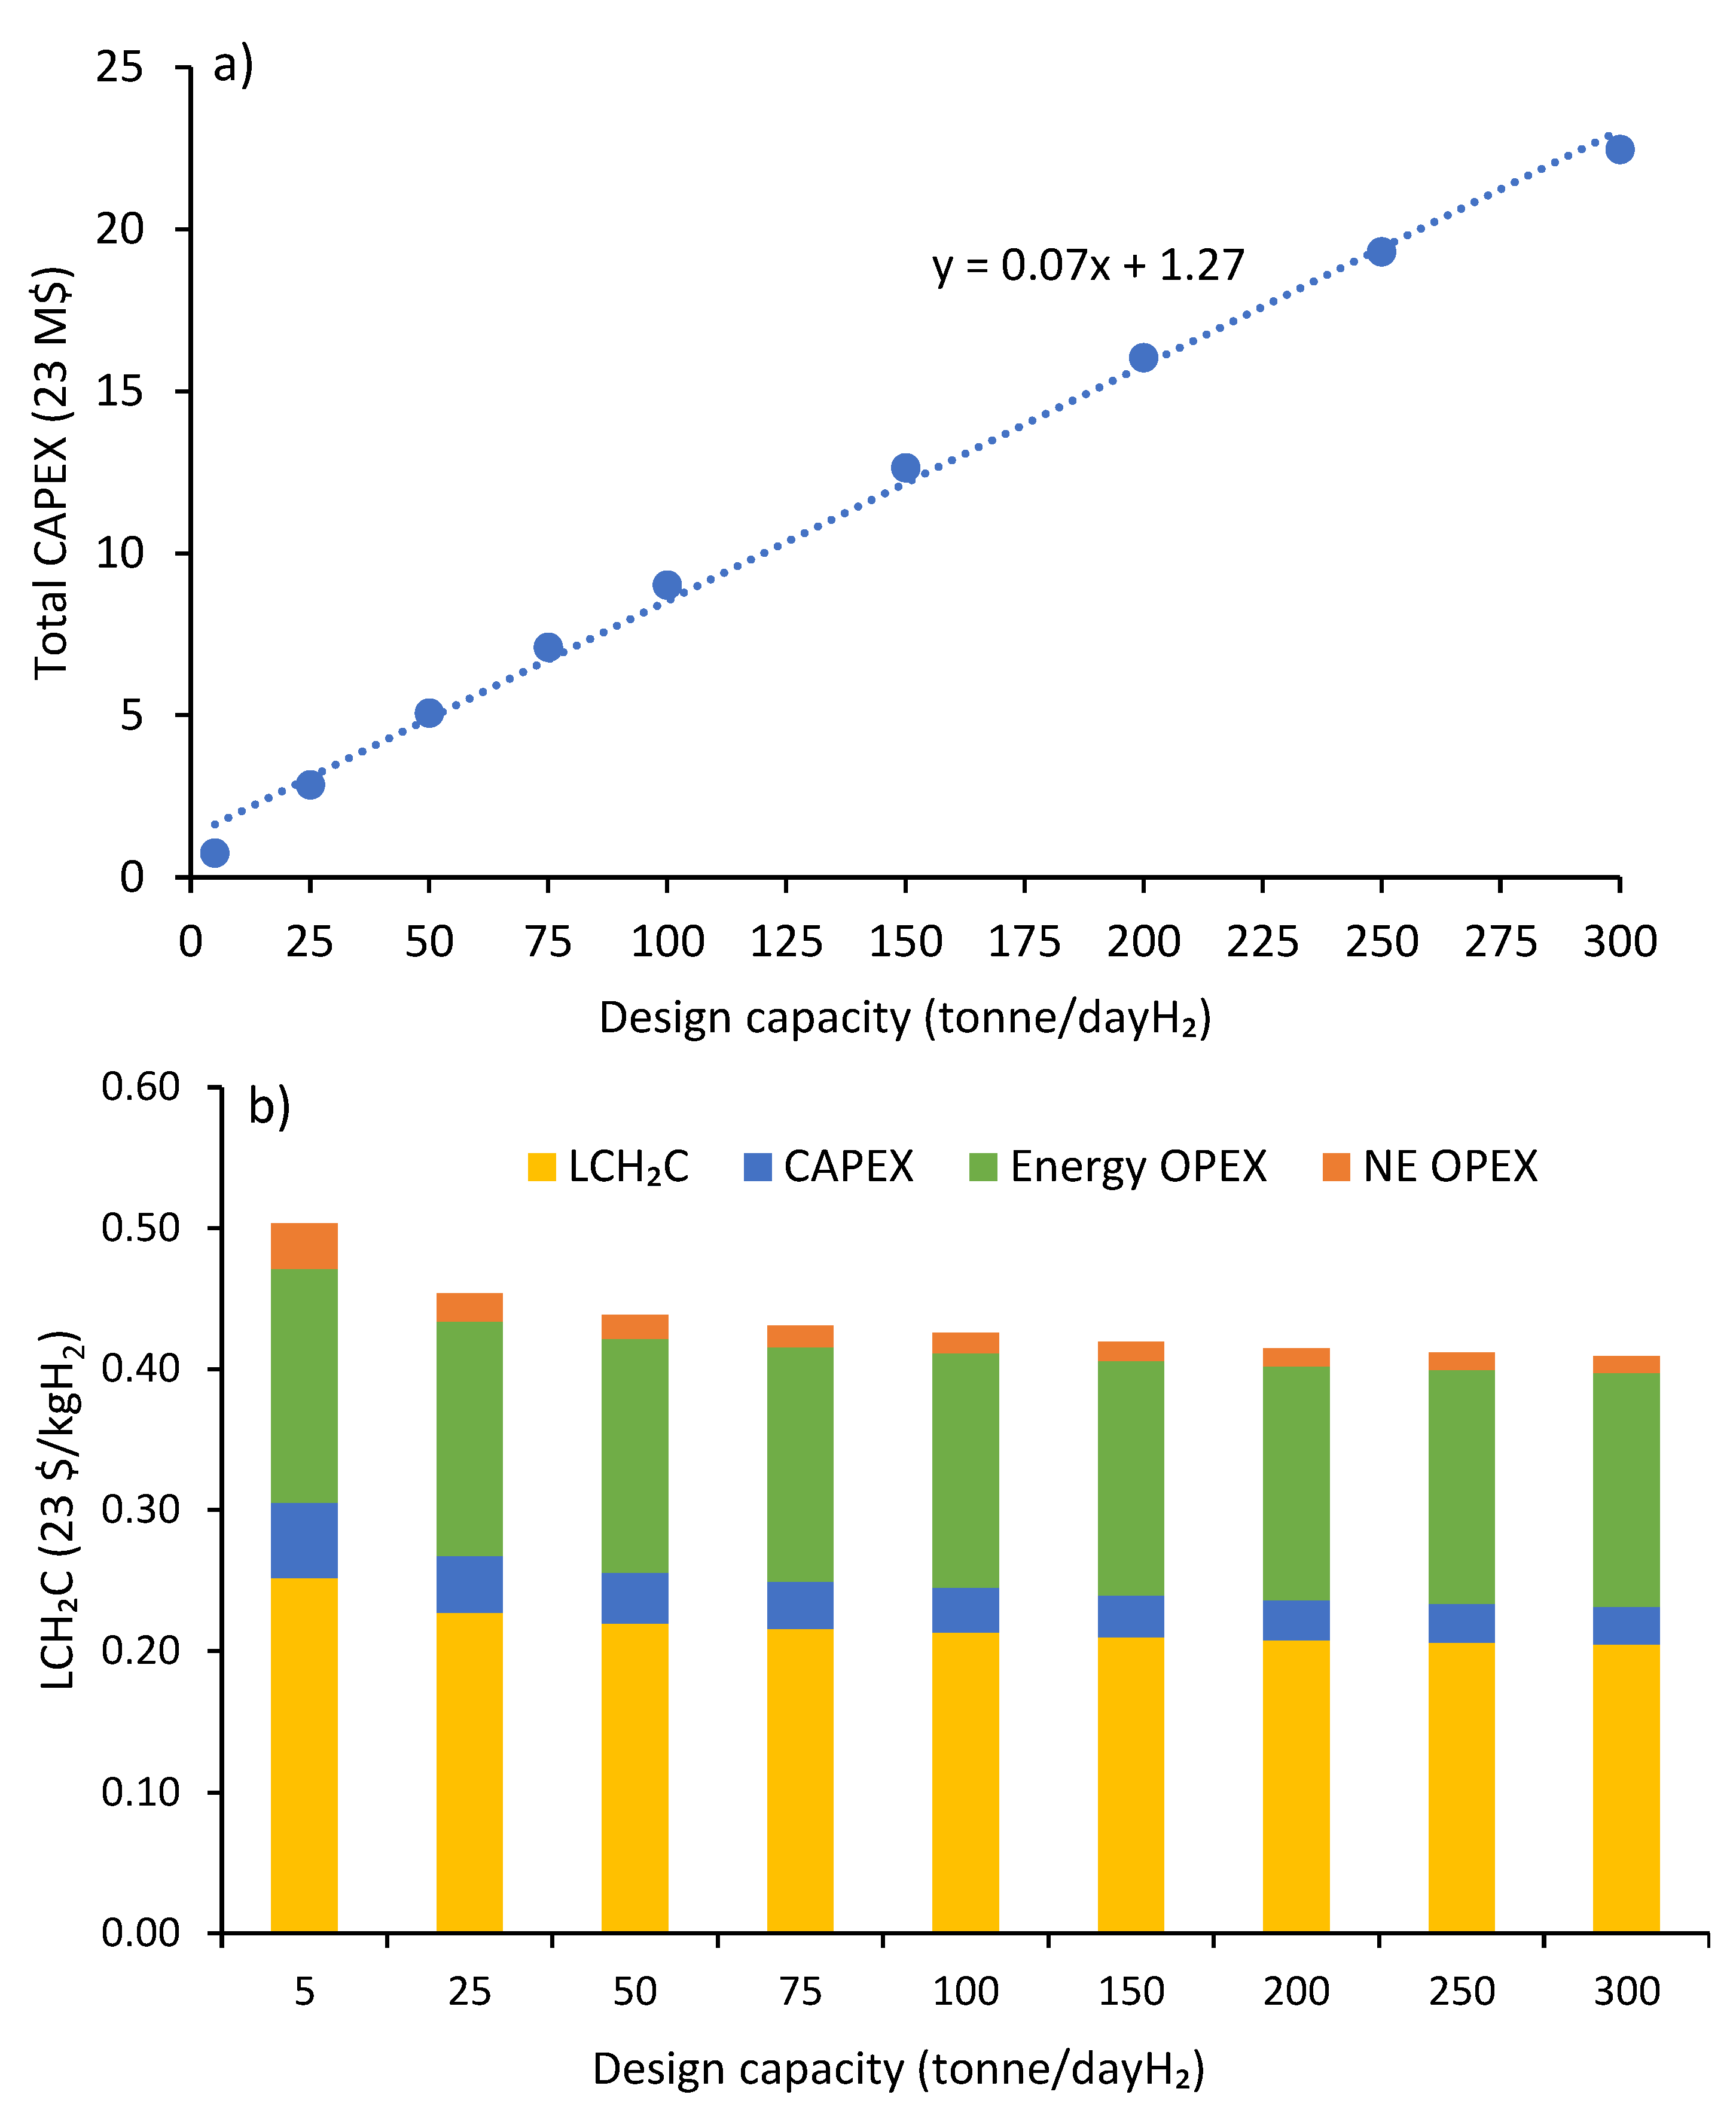
3.4. Technoeconomic Analysis for the Compression of Hydrogen

An important indicator regarding the economic viability of any financial investment in a project is the levelised cost. This section describes the simplified levelised cost of hydrogen for compression, a technique of processing hydrogen among different physicochemical forms [44]. The formula and assumptions used to derive levelised cost are reported in Section 2.2.2.
The initial design is carried out for a hydrogen flow rate of 10,964 kg/h (263 tonnes/day), similar to designing compressor power requirements. After that, a sensitivity study is carried out for capacities ranging from 5 to 300 tonnes/dayH2. The total capital cost concerning design capacity is shown in Figure 8a. The CAPEX increases with increasing design capacity. However, the cost is lower when the design capacity is higher. For example, the CAPEX is 0.15 million USD/t H2 while designing 5.0 t/day H2, leading to half of 0.075/t H2 in the case of 300 t/day H2.
The variation in the levelised cost of compression (LCH2C) is shown in Figure 8b. The LCH2C nearly follows an exponential decay trend concerning design capacity. For example, for a design capacity of 5.0 tonnes/day, the LCH2C is USD 0.25, which decreases to USD 0.20 for 300 tonnes/day capacity, similar to the cost reported by Ibagon et al., 2023 [24]. The changes seem insignificant, particularly with a capacity above 75 tonnes/day. The major contributor in LCH2C is energy-related operating cost, which is a constant value of USD 0.16, followed by the CAPEX for the compressor (USD 0.053–USD 0.027) and non-energy-related OPEX (USD 0.032–USD 0.012). The latter two parameters decrease with increasing design capacity. According to Ibagon et al., 2023 [24], the levelised cost of processing/compression is about 2.5–3% of the levelised cost of production in 2022. According to the current study, considering the best-case wind- and solar-based hydrogen, the current levelised cost of hydrogen compression is about 4–5% of the levelised for hydrogen production (Figure 4).

3.5. Technoeconomic Analysis for the Transportation of Hydrogen

The levelised cost of hydrogen for transportation concerning round-trip travel distance, the operating pressure of the tube trailer and design capacity is shown in Figure 9. As can be observed, the levelised cost of hydrogen transportation (LCH2T) concerning travel distance decreases with increasing round-trip distance. The LCH2T comprises the cost of the tractor and tube trailer. The tractor costs include capital investment, labour, fuel and fixed operating and maintenance costs. In contrast, the cost associated with tube trailers primarily includes capital investment, operating and maintenance costs. Over the range of travel distance of 300–1000 km, the tractor cost varies from USD 0.68 to USD 0.61/kg while the cost for a tube trailer is almost constant at 0.39, as shown in Figure 9a. Hence, the total cost with regard to the travel distance is over the range of USD 1.07 to USD 1.01/kg, which is similar to the cost reported by Ibagon et al., 2023 [24].
Likewise, the levelised cost of transportation decreases markedly with increasing operating pressure, as shown in Figure 9b. Increasing operating pressure from 300 to 600 bar decreases the cost by 46%, and the cost ranges from 1.5 to 0.81 USD/kgH2. As can be seen, like travel distance, operating pressure has an insignificant effect in terms of the tractor cost, which varies from 0.67 to 0.64 USD/kgH2 over the range. However, the tube trailer has a marked impact on LCH2T concerning operating pressure, and the LCH2T varies from 0.64 to 0.22 USD/kgH2 over the range. Thus, the total LCH2T comprising a tractor and tube trailer is 1.31 to 0.87 USD/kgH2 over the operating pressure of 300 to 700 bar.
Furthermore, increasing design capacity from 1 to 10 tonnes/day decreases the total LCH2T by 77%, and the LCH2T ranges from 3.17 to 0.72 USD/kgH2 (Figure 9c). Unlike the other two cases, the tractor significantly impacts LCH2T with respect to design capacity, while the impact of the tube trailer is minimal. Overall, it is found that to keep the LCH2T low, the tube operating pressure and design capacity should be as high as possible.
It is noteworthy to mention that, in the case of pipeline transportation, an existing natural gas pipeline may not be compatible with hydrogen. Moreover, valves, fittings and other piping-related instruments must be modified. Hence, a significant capital investment might be required in this aspect for the application of hydrogen in industries.

3.6. Technoeconomic Modelling for the Storage of Hydrogen

The levelised cost of storage, CAPEX and OPEX for the geological storage of hydrogen concerning the average hydrogen flow rate is shown in Figure 10. The LCH2 for storage decreases following an exponential decay trend with increasing to average hydrogen flow rate. The LCH2 for storage using the design capacity of 5 tonnes/day (0.6 million m3) costs 0.29 USD/kgH2 which decreases to 0.15 USD/kgH2 for the design capacity of 20 tonnes/day (2.42 million Nm3) following the power law of y = 0.58x−0.44, where y represents the LCH2 for storage and x represents the average hydrogen flow rate. A similar cost related to the storage of hydrogen was reported by Ibagon et al., 2023 [24].
The capital cost increases linearly with respect to the average hydrogen flow rate, ranging from USD 1.7 to USD 4.63 million, following a linear relationship of y = 0.19x + 0.82, where y represents the CAPEX for storage and x represents the average hydrogen flow rate. The OPEX for the geological storage is found to be USD 0.28 million with an average hydrogen flow rate of 5.0 tonnes/day and increases to USD 0.5 million when the average hydrogen flow rate is increased to 20 tonnes/day. Regardless of onsite generation or external sourcing, a process or manufacturing industry needs to construct storage facilities and store hydrogen equivalent to the plant’s demand for a few days.

4. Conclusions

In terms of the performance of an alkaline electrolyser, the modelling results show that an increase in the current density progressively increases the cell voltage, stack voltage and corresponding power and ultimately increases the hydrogen production. However, increasing current density increases heat loss and safety concerns. On the other hand, increasing the temperature was predicted to decrease the cell voltage, stack voltage, stack power and hydrogen production. Increasing the current density was predicted to decrease the hydrogen concentration in oxygen exponentially. In contrast, pressure was found to have minimal effect on all performance parameters at a constant temperature.
Technoeconomic modelling for hydrogen generation shows that electricity is the key factor for green hydrogen generation with a current cost of 7.7 to 9.6 USD/kgH2 using wind and solar under the base case. The higher levelised cost using standalone solar PV is primarily due to the lower capacity factor of about 0.30 compared to over 0.4 using wind-based electricity. Currently, 71% of the cost of hydrogen is due to the use of electricity, followed by upfront CAPEX of 20%, and the remaining 9% is due to the fixed operating and maintenance, ongoing CAPEX and water. The cost contribution of hydrogen using PV electricity is 14%-point lower than that of grid electricity. However, the upfront CAPEX, FO&M and ongoing CAPEX using solar electricity are 6%, 1.5% and 0.4%-point higher than those using grid electricity.
A sharp decline in upfront CAPEX, solar electricity and the overall cost of hydrogen is expected in the coming decades, with an estimated 6.5 and 3.4 USD/kgH2 by 2030 and 2040. A further reduction with standalone wind is expected with 5.3 and 2.9 USD/kgH2 by 2030 and 2040, respectively. The current levelised cost using a solar and wind mix (SWM) is estimated at 3.2 USD/kgH2 compared to USD 9.6 and USD 7.7 using standalone solar and wind. This SWM cost is expected to decrease in the coming decades with an estimated 2.7, 2.5 and 2.4 USD/kgH2 in 2030, 2040 and 2050, respectively. A decreasing hydrogen price in the coming decades means hydrogen will have widespread applications in industries and thereby a favorable impact on our environment. The current and future costs for hydrogen change substantially when considering the best-case electricity price from solar and wind. A calculation concerning compression, transportation and hydrogen storage shows that an additional USD 1.5 to USD 2.0 is required where the hydrogen demand is at least 5 tH2/day. A comparative fundamental and technoeconomic study concerning other electrolyser technologies is recommended for future study.

Author Contributions

Conceptualization, M.S.; Methodology, M.S.; Software, M.S.; Validation, M.A.R.; Formal analysis, M.S.; Investigation, M.S.; Resources, M.A.R. and G.A.B.; Writing—original draft, M.S.; Writing—review & editing, M.S., M.A.R. and G.A.B.; Supervision, M.A.R. and G.A.B.; Project administration, M.A.R. and G.A.B.; Funding acquisition, M.A.R. and G.A.B. All authors have read and agreed to the published version of the manuscript.

Funding

This research was funded by Victorian Hydrogen Hub (VH2), Swinburne University of Technology, Australia.

Data Availability Statement

The data presented in this study are available on request from the corresponding author. The data are not publicly available due to the nature of the study.

Conflicts of Interest

The authors declare no conflict of interest.

References

  1. IEA. International Energy Agency Global Hydrogen Review 2021; OECD Publishing: Paris, France, 2021. [Google Scholar]
  2. Khojasteh Salkuyeh, Y.; Saville, B.A.; MacLean, H.L. Techno-economic analysis and life cycle assessment of hydrogen production from natural gas using current and emerging technologies. Int. J. Hydrogen Energy 2017, 42, 18894–18909. [Google Scholar] [CrossRef]
  3. Shahabuddin, M.; Brooks, G.; Rhamdhani, M.A. Decarbonisation and hydrogen integration of steel industries: Recent development, challenges and technoeconomic analysis. J. Clean. Prod. 2023, 395, 136391. [Google Scholar] [CrossRef]
  4. Salkuyeh, Y.K.; Saville, B.A.; MacLean, H.L. Techno-economic analysis and life cycle assessment of hydrogen production from different biomass gasification processes. Int. J. Hydrogen Energy 2018, 43, 9514–9528. [Google Scholar] [CrossRef]
  5. Ali Khan, M.H.; Daiyan, R.; Neal, P.; Haque, N.; MacGill, I.; Amal, R. A framework for assessing economics of blue hydrogen production from steam methane reforming using carbon capture storage & utilisation. Int. J. Hydrogen Energy 2021, 46, 22685–22706. [Google Scholar]
  6. Turner, J.; Sverdrup, G.; Mann, M.K.; Maness, P.C.; Kroposki, B.; Ghirardi, M.; Evans, R.J.; Blake, D. Renewable hydrogen production. Int. J. Energy Res. 2008, 32, 379–407. [Google Scholar] [CrossRef] [Green Version]
  7. Kotowicz, J.; Jurczyk, M.; Węcel, D.; Ogulewicz, W. Analysis of hydrogen production in alkaline electrolyzers. J. Power Technol. 2016, 96, 149. [Google Scholar]
  8. Lehner, M.; Tichler, R.; Steinmüller, H.; Koppe, M. Power-to-Gas: Technology and Business Models; Springer: Berlin/Heidelberg, Germany, 2014. [Google Scholar]
  9. Shiva Kumar, S.; Lim, H. An overview of water electrolysis technologies for green hydrogen production. Energy Rep. 2022, 8, 13793–13813. [Google Scholar] [CrossRef]
  10. Sanchez, M.; Amores, E.; Abad, D.; Rodriguez, L.; Clemente-Jul, C. Aspen Plus model of an alkaline electrolysis system for hydrogen production. Int. J. Hydrogen Energy 2020, 45, 3916–3929. [Google Scholar] [CrossRef]
  11. Sánchez, M.; Amores, E.; Rodríguez, L.; Clemente-Jul, C. Semi-empirical model and experimental validation for the performance evaluation of a 15 kW alkaline water electrolyzer. Int. J. Hydrogen Energy 2018, 43, 20332–20345. [Google Scholar] [CrossRef]
  12. Buttler, A.; Spliethoff, H. Current status of water electrolysis for energy storage, grid balancing and sector coupling via power-to-gas and power-to-liquids: A review. Renew. Sustain. Energy Rev. 2018, 82, 2440–2454. [Google Scholar] [CrossRef]
  13. Ursua, A.; Gandia, L.M.; Sanchis, P. Hydrogen production from water electrolysis: Current status and future trends. Proceedings IEEE 2011, 100, 410–426. [Google Scholar] [CrossRef]
  14. Zeng, K.; Zhang, D. Recent progress in alkaline water electrolysis for hydrogen production and applications. Prog. Energy Combust. Sci. 2010, 36, 307–326. [Google Scholar] [CrossRef]
  15. Li, X.; Walsh, F.C.; Pletcher, D. Nickel based electrocatalysts for oxygen evolution in high current density, alkaline water electrolysers. Phys. Chem. Chem. Phys. 2011, 13, 1162–1167. [Google Scholar] [CrossRef] [Green Version]
  16. Pletcher, D.; Li, X. Prospects for alkaline zero gap water electrolysers for hydrogen production. Int. J. Hydrogen Energy 2011, 36, 15089–15104. [Google Scholar] [CrossRef] [Green Version]
  17. Leng, Y.; Chen, G.; Mendoza, A.J.; Tighe, T.B.; Hickner, M.A.; Wang, C.-Y. Solid-state water electrolysis with an alkaline membrane. J. Am. Chem. Soc. 2012, 134, 9054–9057. [Google Scholar] [CrossRef]
  18. Zghaibeh, M.; Barhoumi, E.M.; Okonkwo, P.C.; Ben Belgacem, I.; Beitelmal, W.H.; Mansir, I.B. Analytical model for a techno-economic assessment of green hydrogen production in photovoltaic power station case study Salalah city—Oman. Int. J. Hydrogen Energy 2022, 47, 14171–14179. [Google Scholar] [CrossRef]
  19. Benalcazar, P.; Komorowska, A. Prospects of green hydrogen in Poland: A techno-economic analysis using a Monte Carlo approach. Int. J. Hydrogen Energy 2022, 47, 5779–5796. [Google Scholar] [CrossRef]
  20. Minutillo, M.; Perna, A.; Forcina, A.; Di Micco, S.; Jannelli, E. Analyzing the levelized cost of hydrogen in refueling stations with on-site hydrogen production via water electrolysis in the Italian scenario. Int. J. Hydrogen Energy 2021, 46, 13667–13677. [Google Scholar] [CrossRef]
  21. Fragiacomo, P.; Genovese, M. Technical-economic analysis of a hydrogen production facility for power-to-gas and hydrogen mobility under different renewable sources in Southern Italy. Energy Convers. Manag. 2020, 223, 113332. [Google Scholar] [CrossRef]
  22. Lee, S.; Na, U.J.; Jo, H. Techno-economic assessment of green hydrogen production via two-step thermochemical water splitting using microwave. Int. J. Hydrogen Energy 2023, 48, 10706–10723. [Google Scholar] [CrossRef]
  23. Babarit, A.; Gilloteaux, J.-C.; Clodic, G.; Duchet, M.; Simoneau, A.; Platzer, M.F. Techno-economic feasibility of fleets of far offshore hydrogen-producing wind energy converters. Int. J. Hydrogen Energy 2018, 43, 7266–7289. [Google Scholar] [CrossRef]
  24. Ibagon, N.; Muñoz, P.; Díaz, V.; Teliz, E.; Correa, G. Techno-economic analysis for off-grid green hydrogen production in Uruguay. J. Energy Storage 2023, 67, 107604. [Google Scholar] [CrossRef]
  25. Jang, D.; Kim, J.; Kim, D.; Han, W.-B.; Kang, S. Techno-economic analysis and Monte Carlo simulation of green hydrogen production technology through various water electrolysis technologies. Energy Convers. Manag. 2022, 258, 115499. [Google Scholar] [CrossRef]
  26. Ulleberg, Ø. Modeling of advanced alkaline electrolyzers: A system simulation approach. Int. J. Hydrogen Energy 2003, 28, 21–33. [Google Scholar] [CrossRef]
  27. AEMO. Assumptions and Scenarios Report. 2021. Available online: https://aemo.com.au/-/media/files/major-publications/isp/2021/2021-inputs-assumptions-and-scenarios-report.pdf?la=en (accessed on 25 April 2023).
  28. AEMO. Costs and Technical Parameter Review Consultation Report. Available online: https://www.aemo.com.au/-/media/files/electricity/nem/planning_and_forecasting/isp/2021/aurecon---cost-and-technical-parameters-review-2020.pdf?la=en (accessed on 27 May 2023).
  29. Graham, P.; Hayward, J.; Foster, J.; Havas, L. GenCost 2021–2022: Consultation Draft; Commonwealth Scientific and Industrial Research Organisation (CSIRO): Canberra, Australia, 2021.
  30. Bruce, S.; Temminghoff, M.; Hayward, J.; Schmidt, E.; Munnings, C.; Palfreyman, D.; Hartley, P. National Hydrogen Roadmap; CSIRO: Canberra, Australia, 2018.
  31. Khan, M.H.A.; Daiyan, R.; Han, Z.; Hablutzel, M.; Haque, N.; Amal, R.; MacGill, I. Designing optimal integrated electricity supply configurations for renewable hydrogen generation in Australia. IScience 2021, 24, 102539. [Google Scholar] [CrossRef]
  32. Balasubramanian, V.; Haque, N.; Bhargava, S.; Madapusi, S.; Parthasarathy, R. Techno-Economic Evaluation Methodology for Hydrogen Energy Systems. In Bioenergy Resources and Technologies; Elsevier: Amsterdam, The Netherlands, 2021; pp. 237–260. [Google Scholar]
  33. IEA (International Energy Agency). The Future of Hydrogen: Seizing Today’s Opportunities. 2019. Available online: https://iea.blob.core.windows.net/assets/9e3a3493-b9a6-4b7d-b499-7ca48e357561/The_Future_of_Hydrogen.pdf (accessed on 24 April 2023).
  34. Brinsmead, T.S.; Hayward, J.; Graham, P. Australian Electricity Market Analysis Report to 2020 and 2030; CSIRO Technical Report No. EP141067; CSIRO: Canberra, Australia, 2014.
  35. Khan, M.A.; Young, C.; Mackinnon, C.; Layzell, D. The Techno-Economics of Hydrogen Compression. Tech. Briefs Can. Transit. Accel. 2021, 1, 1e36. [Google Scholar]
  36. CPI. CPI Inflation Calculation. 2019. Available online: https://www.officialdata.org/us/inflation/2013?endYear=2019&amount=567 (accessed on 18 March 2023).
  37. Inflation Calculator. Inflation Calculator for Canadian Dollar. 2023. Available online: https://www.bankofcanada.ca/rates/related/inflation-calculator/#:~:text=The%20Inflation%20Calculator%20uses%20monthly,this%20cost%20is%20called%20inflation (accessed on 22 March 2023).
  38. ROAM Consulting. Projections of Electricity Generation in Australia to 2050. 2011. Available online: https://treasury.gov.au/sites/default/files/2019-03/c2011-sglp-supplementary-ROAM.pdf (accessed on 26 March 2023).
  39. Build Australia. Australia Becomes the Fourth Most Expensive Region for Construction Labour: Global Report. 2022. Available online: https://www.buildaustralia.com.au/news_article/australia-becomes-the-fourth-most-expensive-region-for-construction-labour-global-report/ (accessed on 17 March 2023).
  40. Haug, P.; Koj, M.; Turek, T. Influence of process conditions on gas purity in alkaline water electrolysis. Int. J. Hydrogen Energy 2017, 42, 9406–9418. [Google Scholar] [CrossRef]
  41. De Atholia, T.; Flannigan, G.; Lai, S. Renewable Energy Investment in Australia|Bulletin—March 2020; Reserve Bank of Australia: Sydney, Australia, 2020.
  42. Parks, G. Hydrogen Station Compression, Storage, and Dispensing Technical Status and Costs; National Renewable Energy Laboratory: Golden, CO, USA, 2014.
  43. Barthélémy, H.; Weber, M.; Barbier, F. Hydrogen storage: Recent improvements and industrial perspectives. Int. J. Hydrogen Energy 2017, 42, 7254–7262. [Google Scholar] [CrossRef]
  44. Tarhan, C.; Çil, M.A. A study on hydrogen, the clean energy of the future: Hydrogen storage methods. J. Energy Storage 2021, 40, 102676. [Google Scholar] [CrossRef]
Figure 1. Effect of temperature on (a) stack power, (b) cell voltage, (c) heat generation and (d) hydrogen production and content of H2 in oxygen (HTO).
Processes 11 02196 g001
Figure 2. Effect of pressure on (a) stack power, (b) cell voltage, (c) heat generation and (d) hydrogen production and the content of H2 in oxygen (HTO).
Processes 11 02196 g002
Figure 3. Current and projected cost of hydrogen production using AEL assuming base case for electricity price: (a) grid, (b) standalone solar, (c) standalone wind and (d) solar and wind mix.
Processes 11 02196 g003
Figure 4. Current and projected cost of hydrogen production under best-case electricity price: (a) standalone solar, (b) standalone wind and (c) solar and wind mix.
Processes 11 02196 g004
Figure 5. Process flow diagram for hydrogen compression.
Processes 11 02196 g005
Figure 6. Effect of compression ratio on compressor power and discharge temperature.
Processes 11 02196 g006
Figure 7. Consumption of hydrogen concerning compression ratio.
Processes 11 02196 g007
Figure 8. (a) Total capital cost and (b) levelised cost for the compression of hydrogen concerning design capacity.
Processes 11 02196 g008
Figure 9. Levelised cost of hydrogen for transportation concerning (a) round-trip travel distance with a constant pressure of 500 bar and hydrogen demand of 5 t/day, (b) operating pressure with a constant distance of 500 km and hydrogen demand of 5 t/day, and (c) hydrogen demand with a constant distance of 500 km and pressure of 500 bar.
Processes 11 02196 g009
Figure 10. LCH2 for storage, CAPEX and OPEX for the geological storage of hydrogen concerning design capacity of 45 tonnes and hydrogen leaving pressure of 70 bar.
Processes 11 02196 g010
Table 1. Summary of the technoeconomic modelling in the literature (euro to dollar: 1.12).
ReferencesMethodsKey Findings
Salkuyeh et al., 2018 [4]Biomass gasification-based H2 productionLCH2: 3–3.5 USD/kgH2
Zghaibeh et al., 2022 [18]PV solar-based H2 productionLCH2: ~7 USD/kgH2
Benalcazar et al., 2022 [19]PEM water electrolysis H2 productionLCH2: ~7–15 USD/kgH2
Minutillo et al., 2021 [20]Water electrolysis-based H2 productionLCH2: ~10–14 USD/kgH2
Fragiacomo and Genovese, 2020 [21]PEM water electrolysis H2 productionLCH2: ~7.75–11 USD/kgH2
Lee et al., 2023 [22]CSP-based solar H2 productionLCH2: ~14.4 USD/kgH2
Babarit et al., 2018 [23]Offshore wind-based H2 productionLCH2: ~8–10.5 USD/kgH2
Ibagon et al., 2023 [24]Off-grid green H2 productionLCH2: ~3.5 USD/kgH2
Jang et al., 2022 [25]Different electrolysis-based H2 productionLCH2: ~7.0–10 USD/kgH2
Table 2. Key equations used for the modelling of AEL.
Decomposition of water H 2 O H 2 + 1 2 O 2 (1)
Cell voltage V C e l l = V r e v + r 1 + r 2 × T i + s × l o g [ ( t 1 + t 2 T + t 3 T 2 ) × i + 1 (2)
Faradic efficiency η F = η H 2   P r o d u c e d η H 2   t h e o r e t i c a l (3)
Faraday’s efficiency η F = i 2 f 11   +   f 12   ×   T   +   i 2 × f 11 + f 22 + T (4)
Hydrogen to oxygen ( H T O ) = ( C 1 + C 2 × T + C 3 × T 2 ( C 4 + C 5 × T + C 6 × T 2 ) × E X P ( C 7 + C 8 × T + C 9 × T 2 ) / i ) + ( E 1 + E 2 × p + E 3 × p 2 ( E 4 + E 5 × p + E 6 × p 2 ) × E X P ( E 7 + E 8 × p + E 9 × p 2 ) / i ) (5)
Mass balance
H2 production rate n H 2 , p r o d u c t = n F × I Z   ×   F   ×   N (6)
n H 2 , c a t = n H 2 , p r o d (7)
n O 2 , a n = n O 2 , p r o d = 1 2 n H 2 , p r o d (8)
n H 2 O = n H 2 , p r o d (9)
Energy balance
H = G + T S (10)
Thermoneutral cell voltage V t n = H Z   ×   F (11)
Heat generation in cell Q g e n = N × I × ( V c e l l V t n ) (12)
Q e x c e s s = Q g e n Q l o s s (13)
η e n = n H 2   ×   L H V H 2 W n e t (14)
n H 2 = W ( S t a c k ) V C e l l   ×   Z   ×   F (15)
W n e t = W s t a c k + W p u m p R 1 + W p u m p R 2 + W p u m p H 2 O + W p u m p c o o l + W f a n (16)
Stack power W s t a c k = V C e l l × N × I (17)
W s t a c k = V s t a c k × I = V c e l l × N × i × A c e l l (18)
Fractional conversion of H2O F C W = m o l a r   m a s s   o f   H 2 O   ×   H 2 O   c o n v e r s i o n F r a c t i o n   o f   H 2 O   ×   H 2 O   f l o w   r a t e (19)
Disclaimer/Publisher’s Note: The statements, opinions and data contained in all publications are solely those of the individual author(s) and contributor(s) and not of MDPI and/or the editor(s). MDPI and/or the editor(s) disclaim responsibility for any injury to people or property resulting from any ideas, methods, instructions or products referred to in the content.

