

Comparison of Conventional and Green Extraction Techniques for the Isolation of Phenolic Antioxidants from Sea Fennel
 , , and
Abstract
:1. Introduction
2. Materials and Methods
2.1. Chemicals
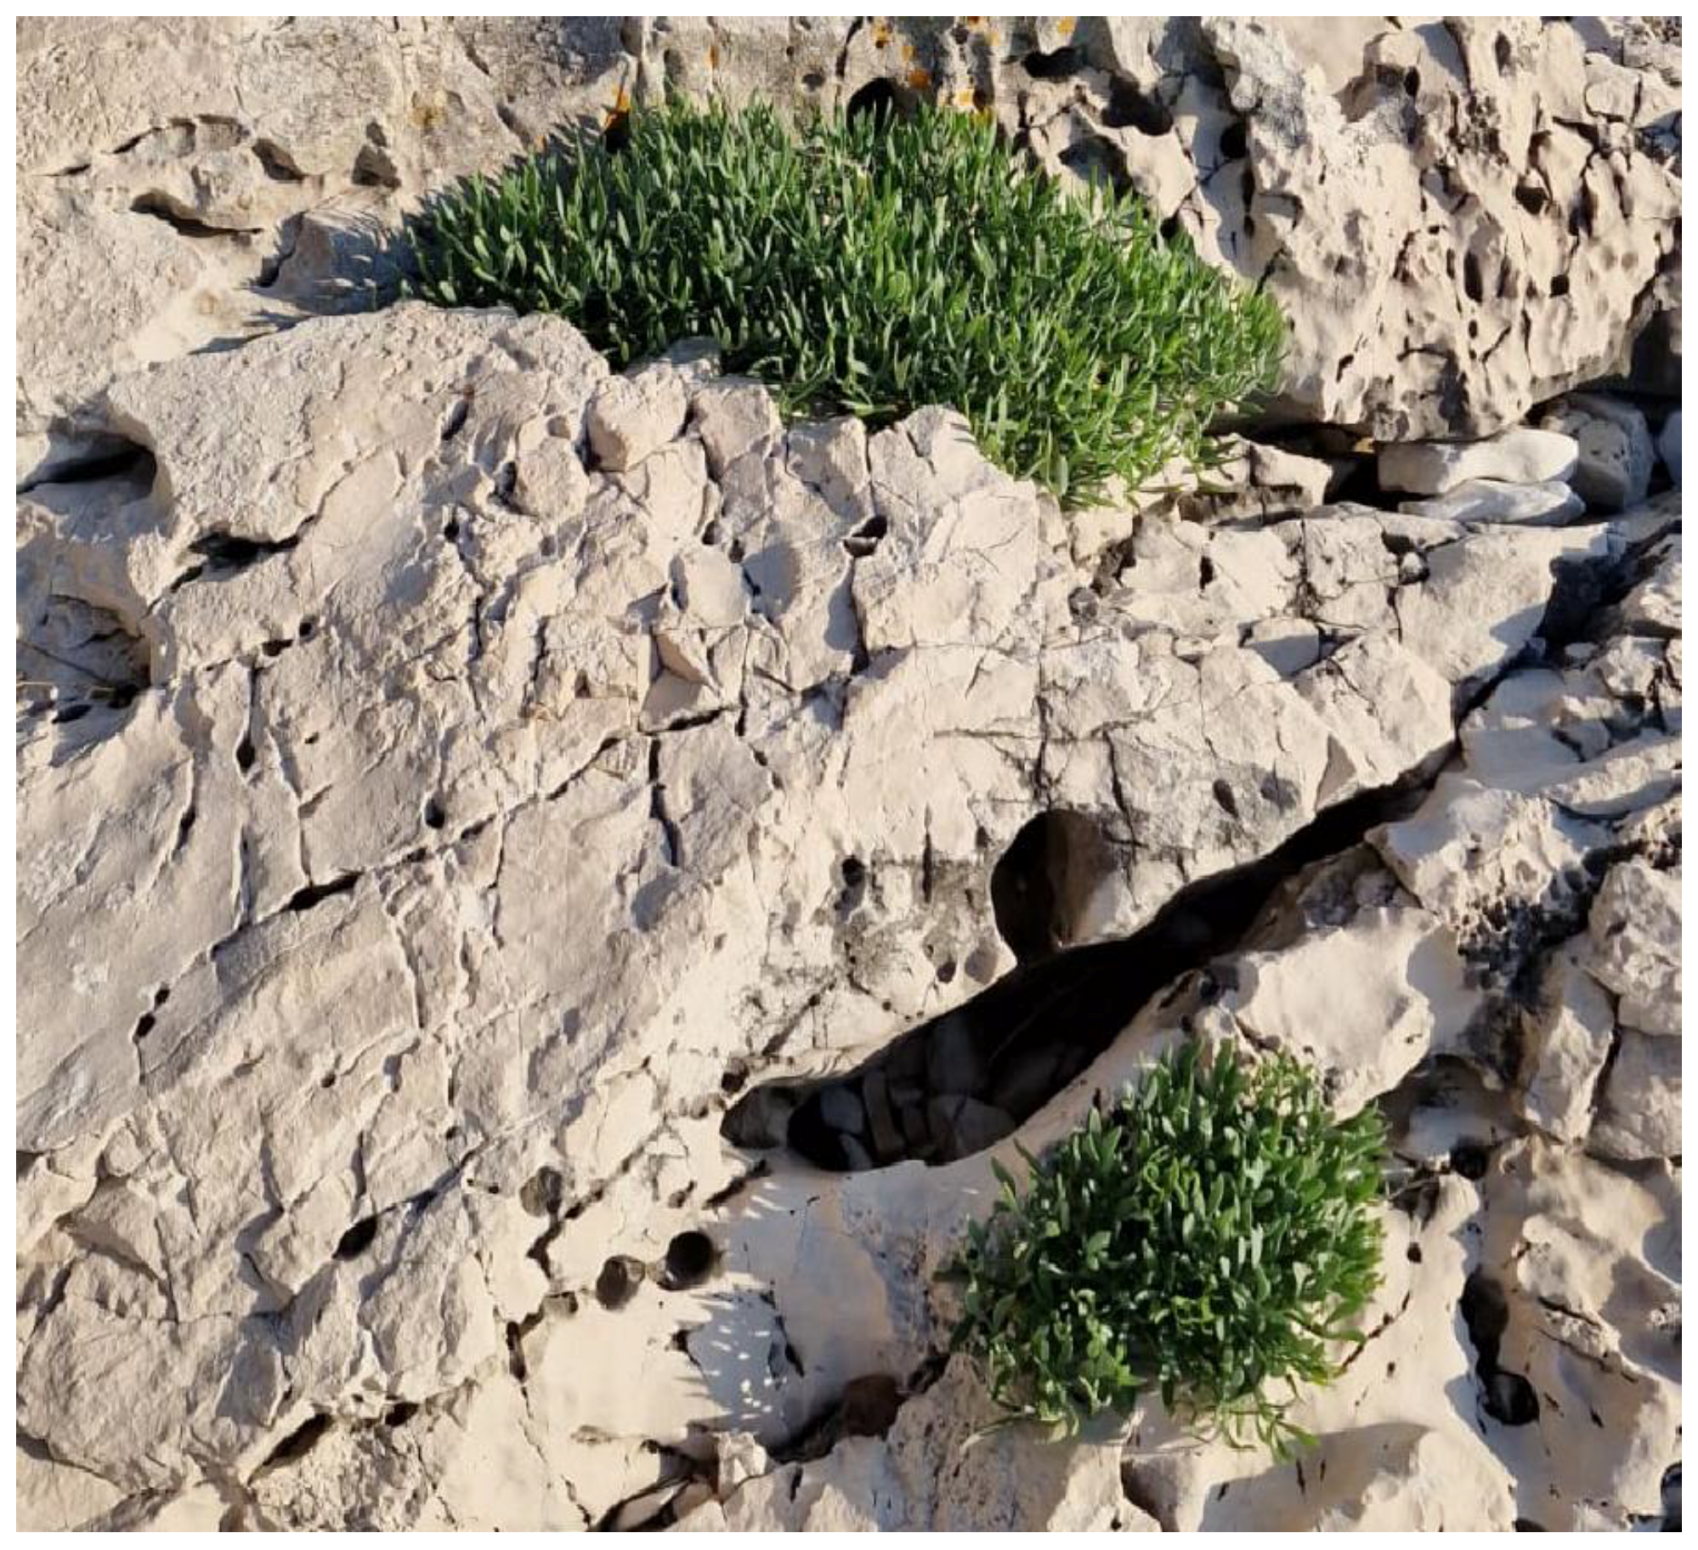
2.2. Plant Material
2.3. Extractions
2.4. Spectrophotometric Measurements of Total Phenolic, Flavonoid, and Tannin Content
2.5. High-Performance Liquid Chromatography–Ultraviolet/Visible (HPLC-UV/VIS) Analysis of Individual Phenolic Compounds
2.6. Antioxidant Activity
2.7. Statistical Analysis
2.8. Greenness Assessment Method
3. Results and Discussion
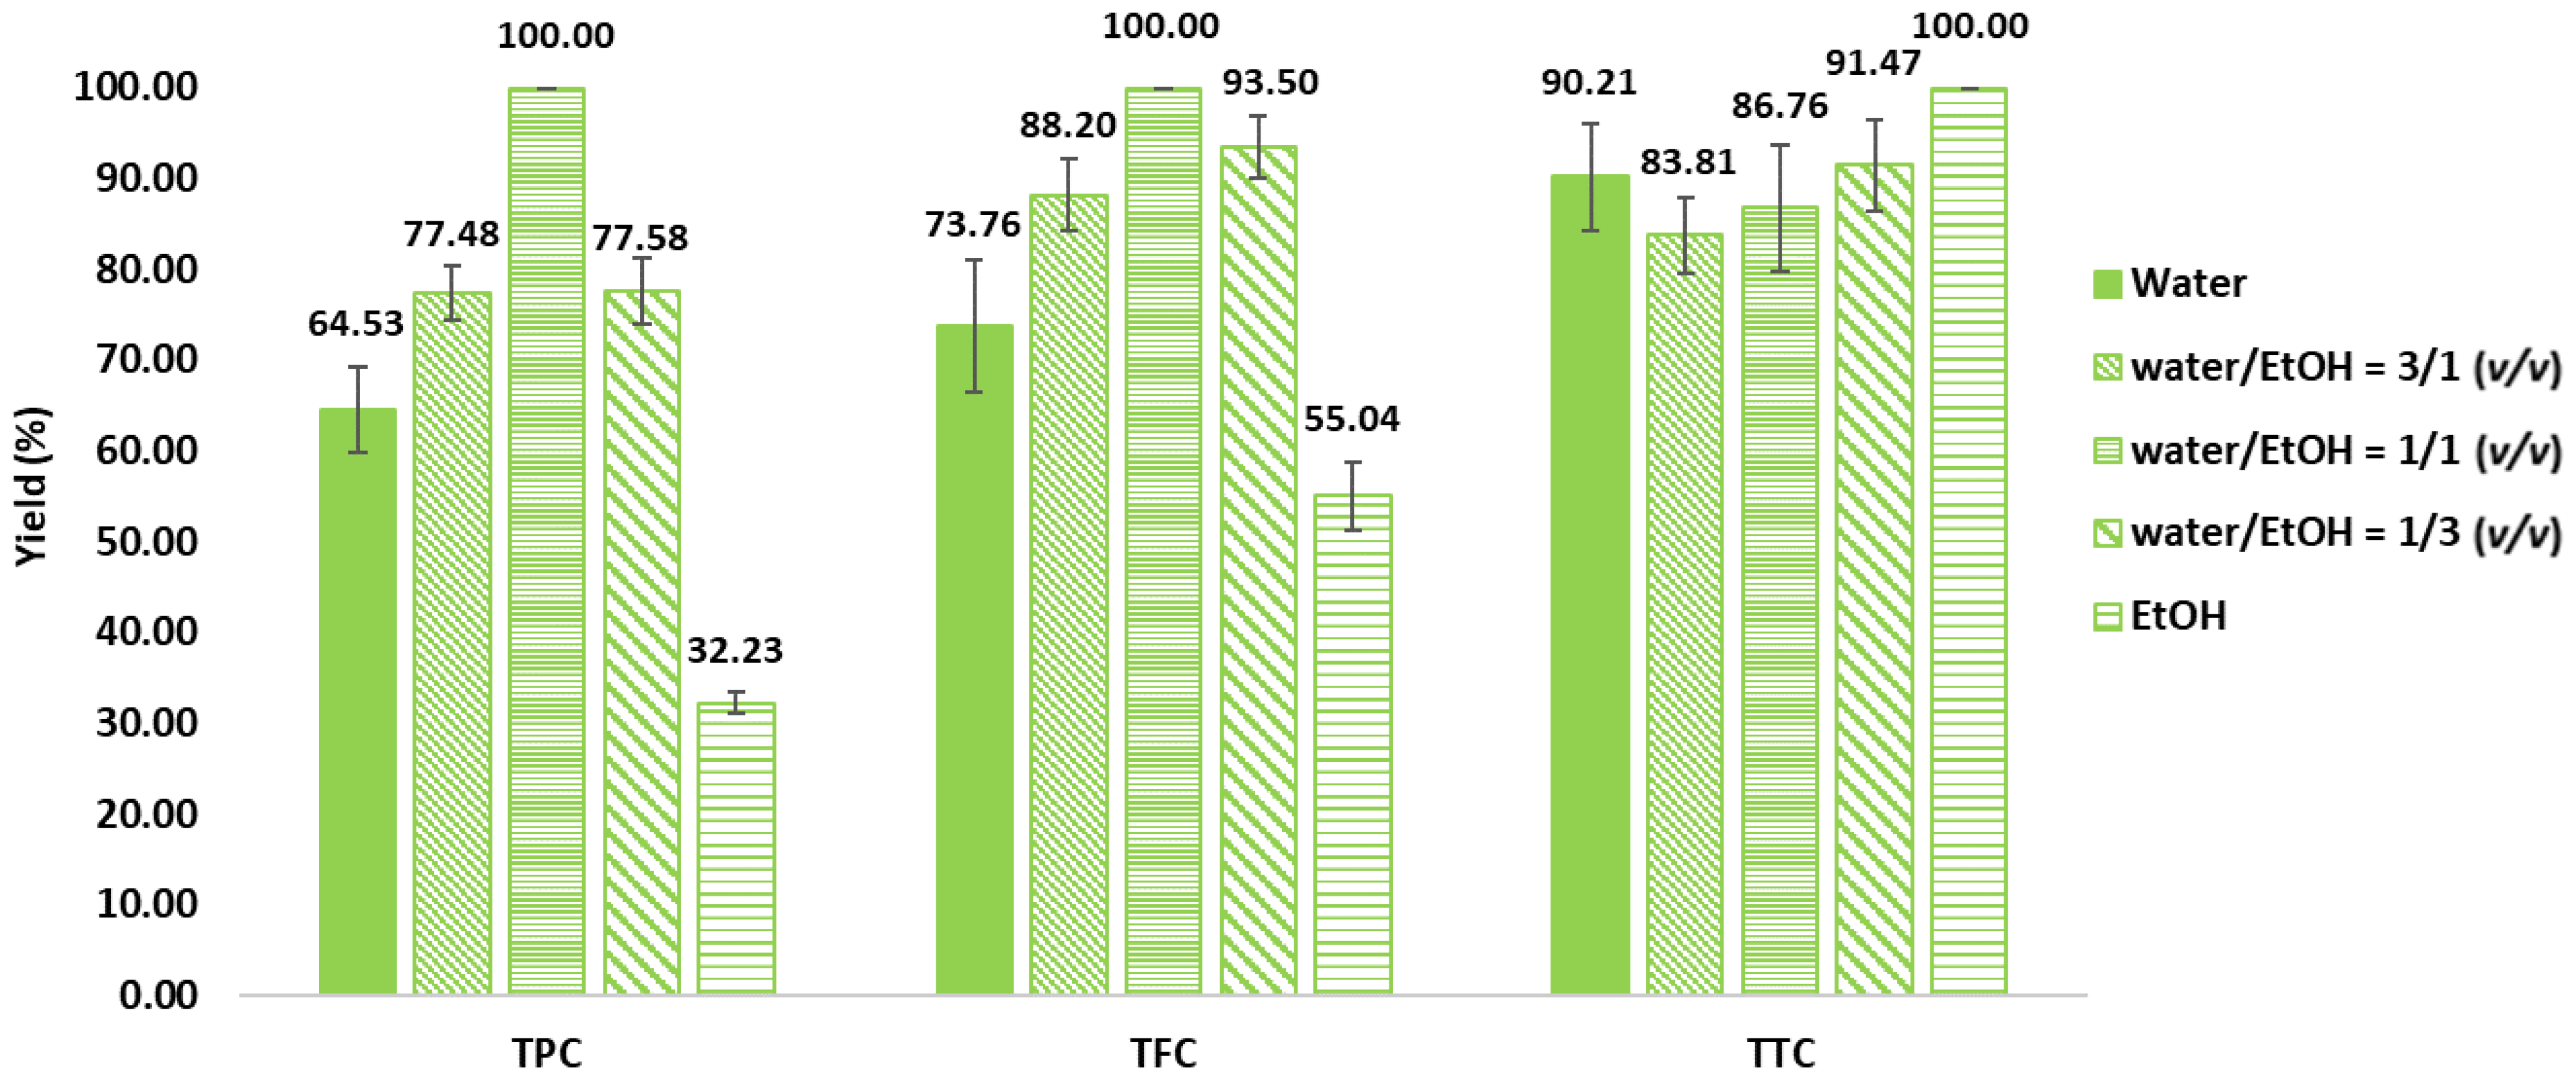
3.1. Solvent Optimization
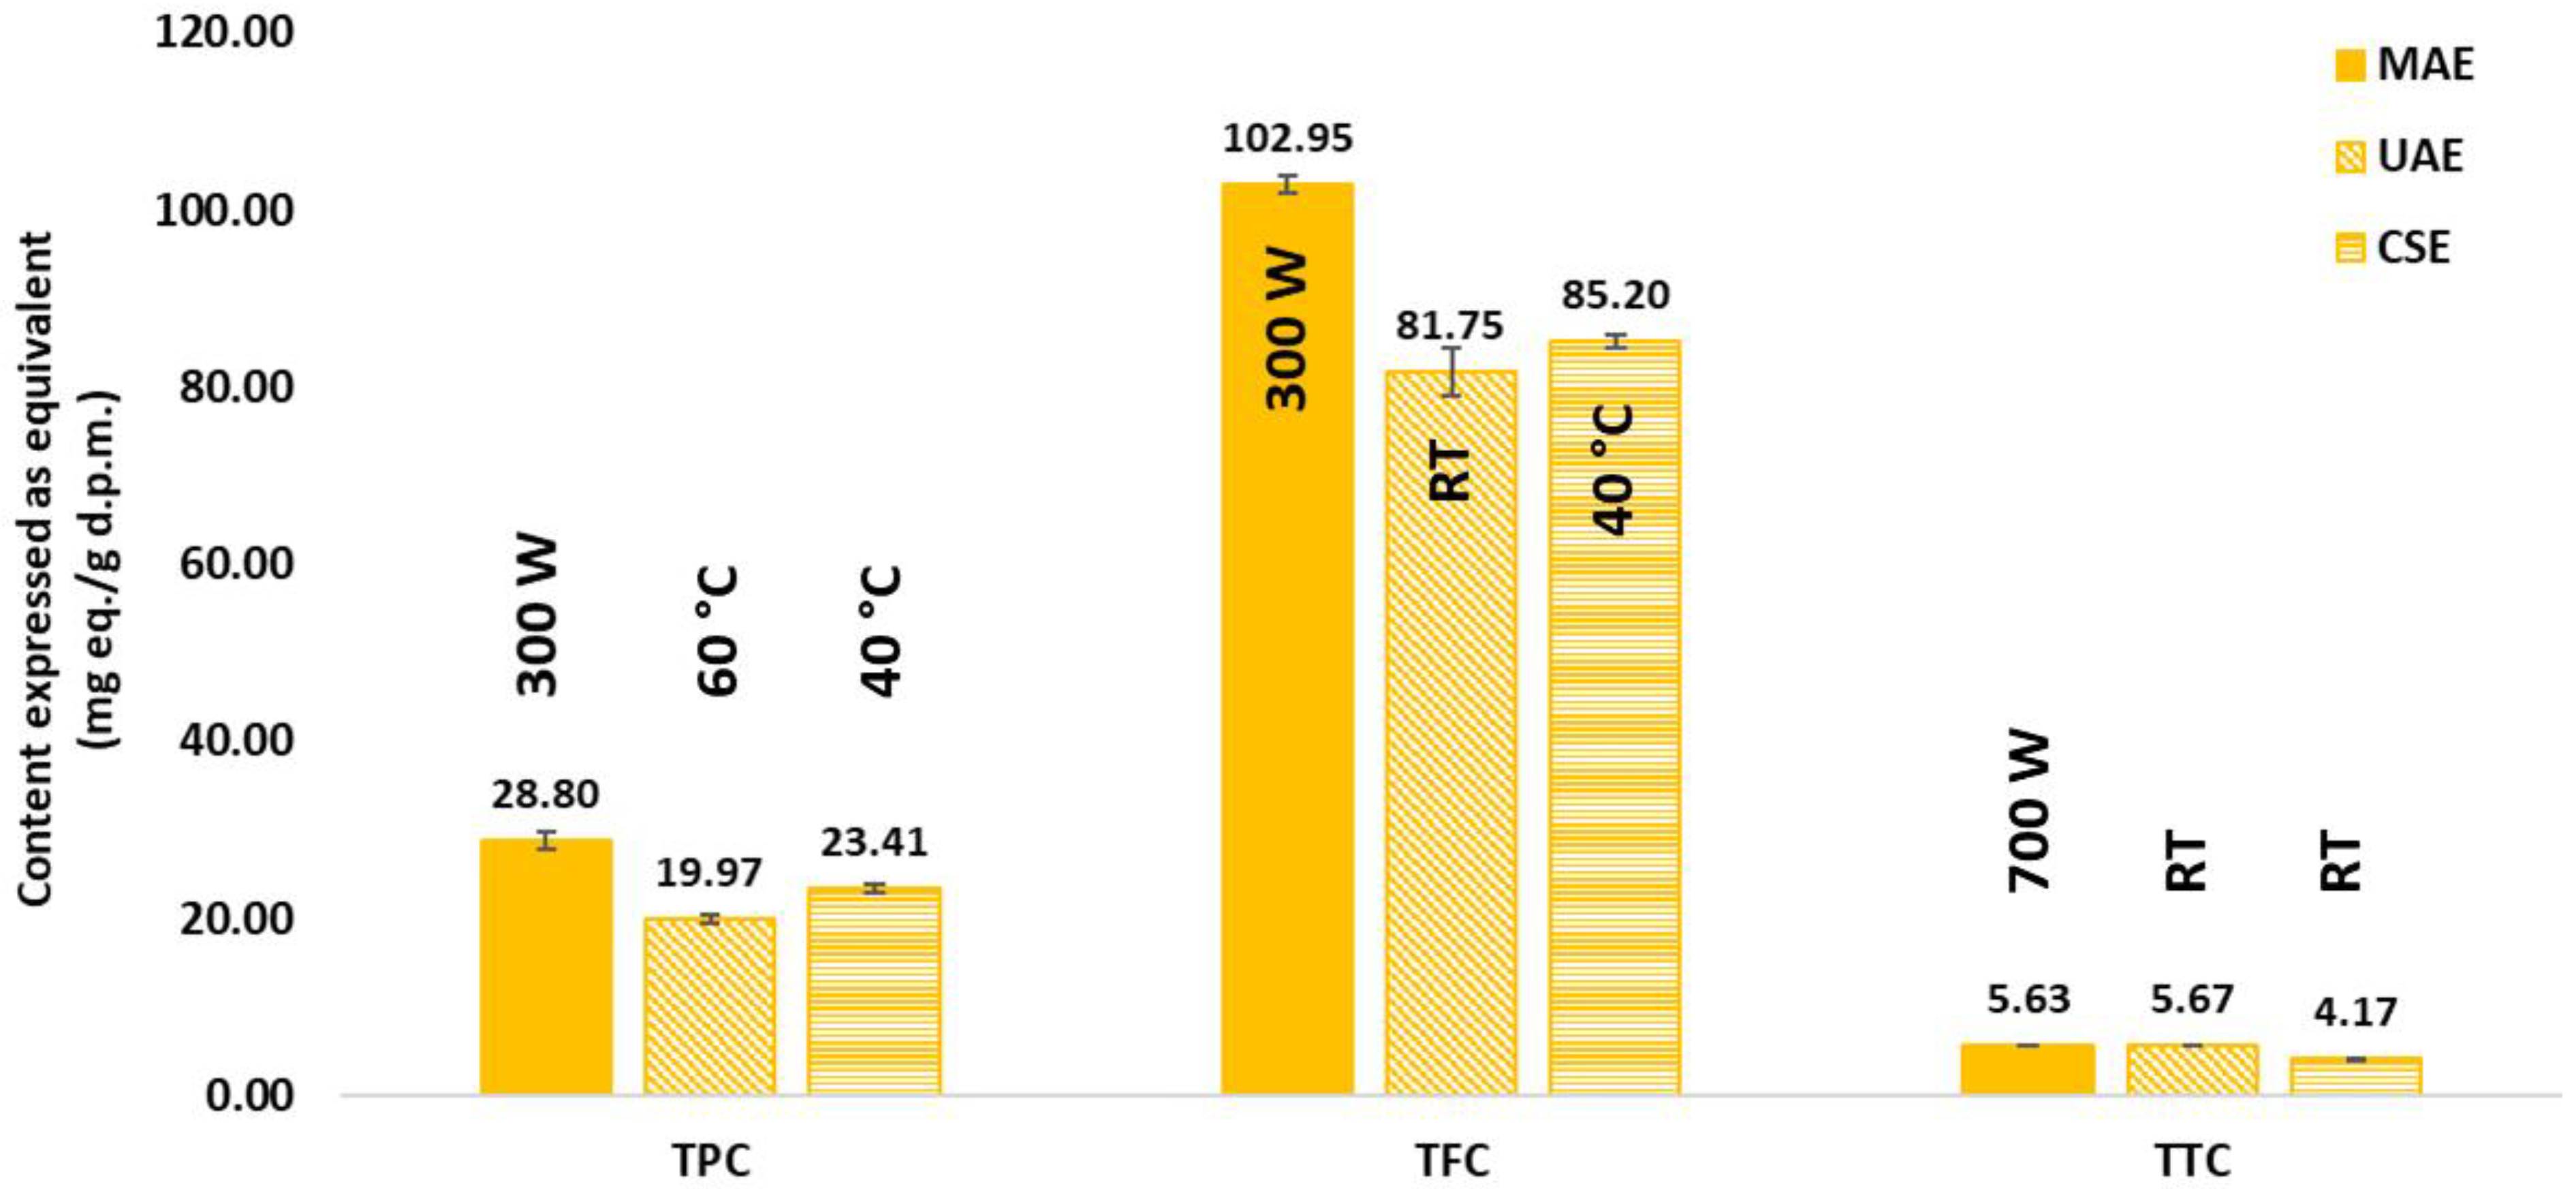
3.2. Ultraviolet–Visible (UV-VIS) Analysis of Total Phenolic Content, Total Flavonoid Content, and Total Tannin Content
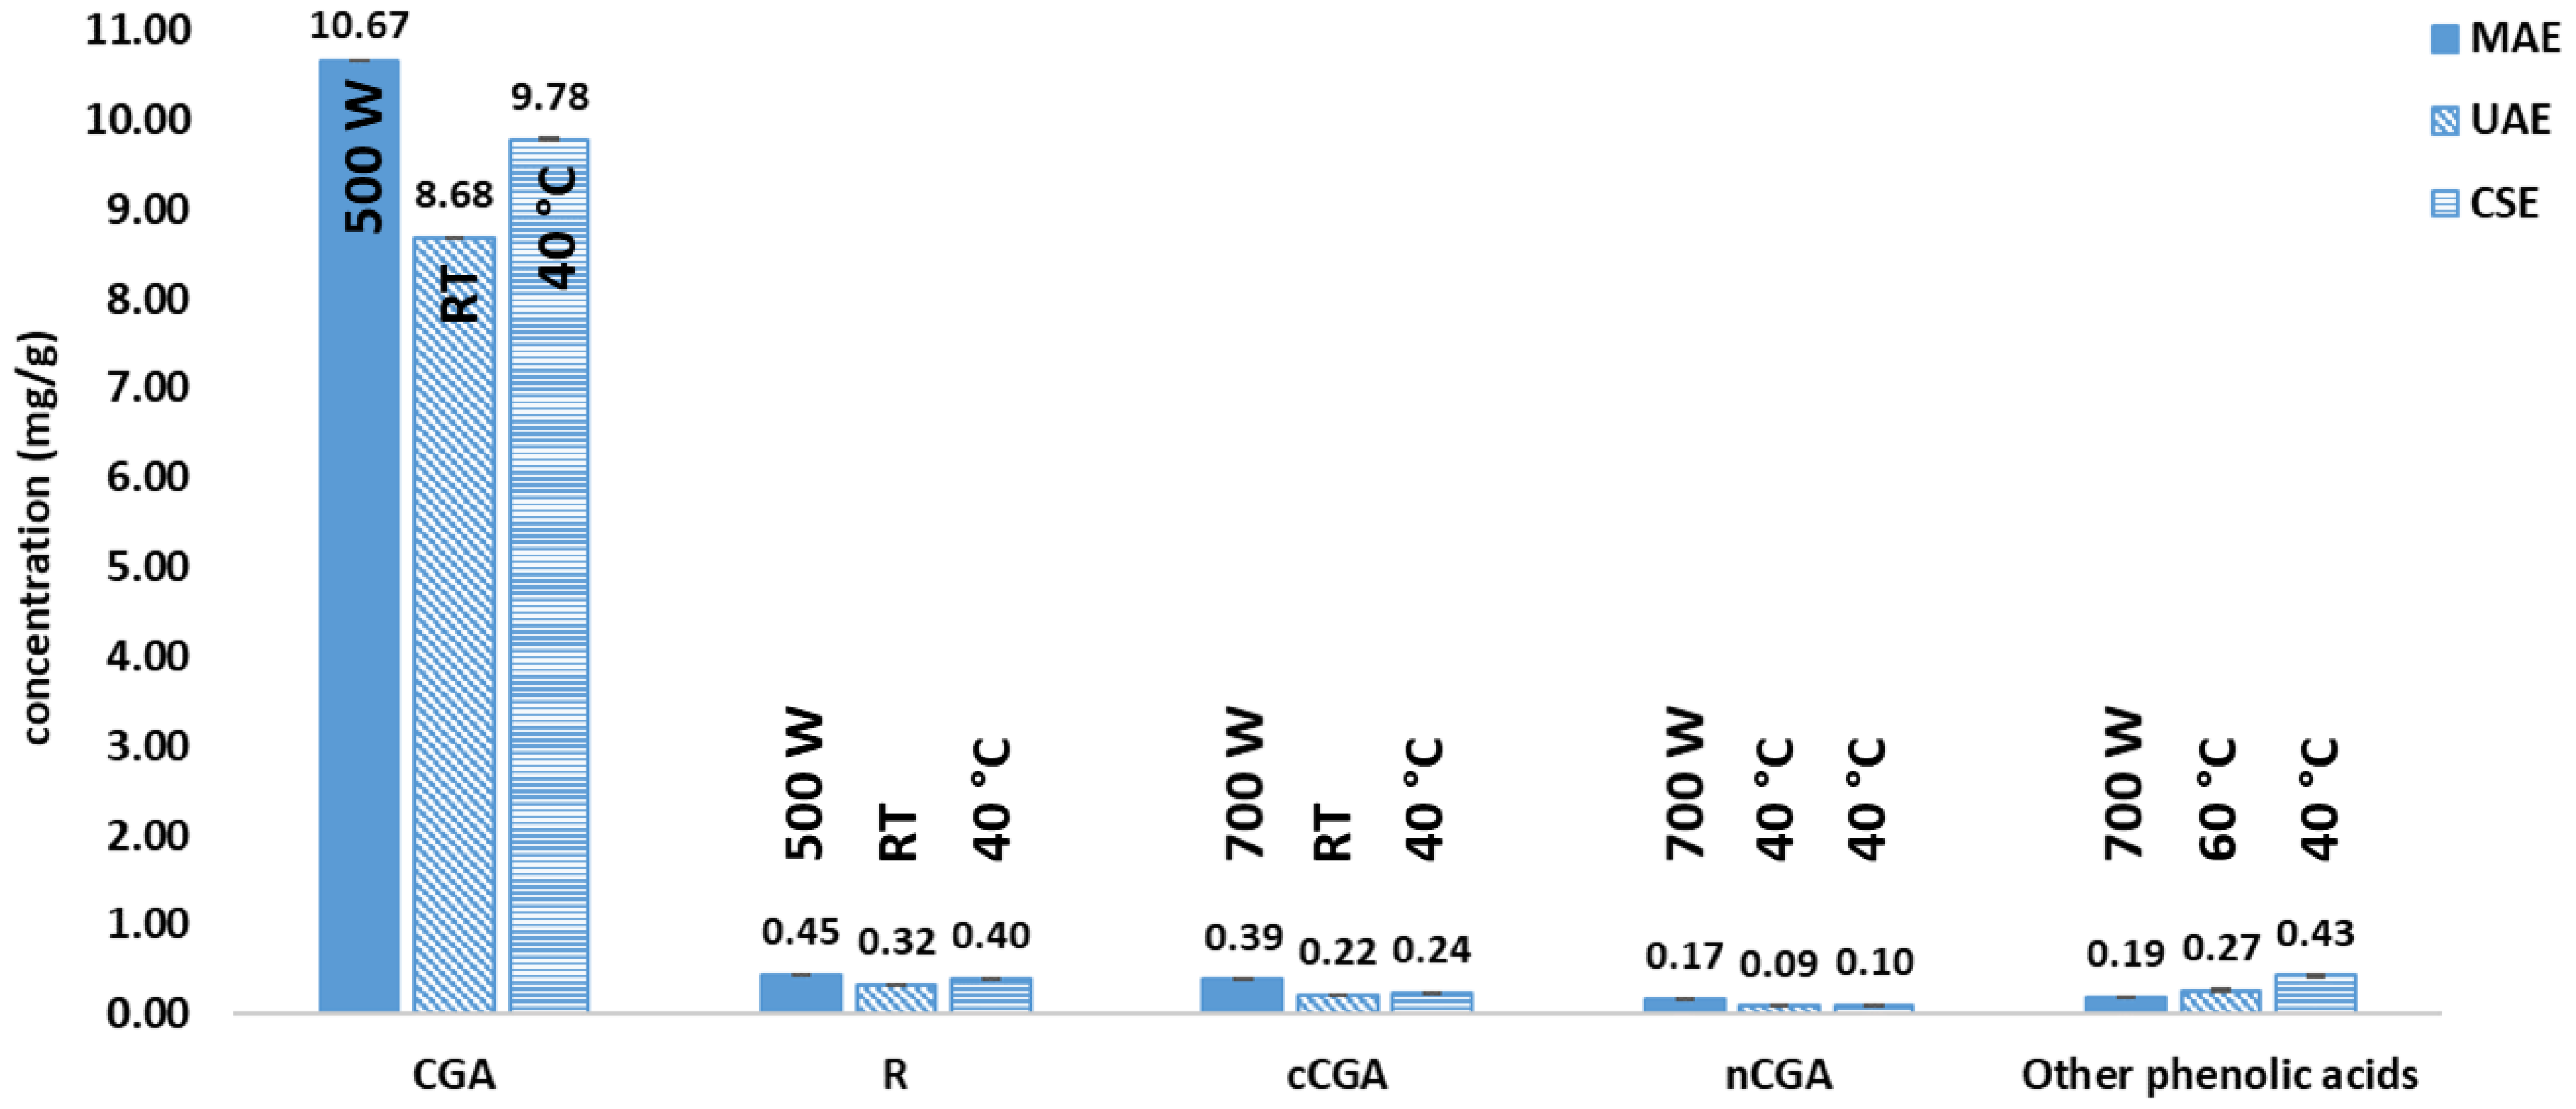
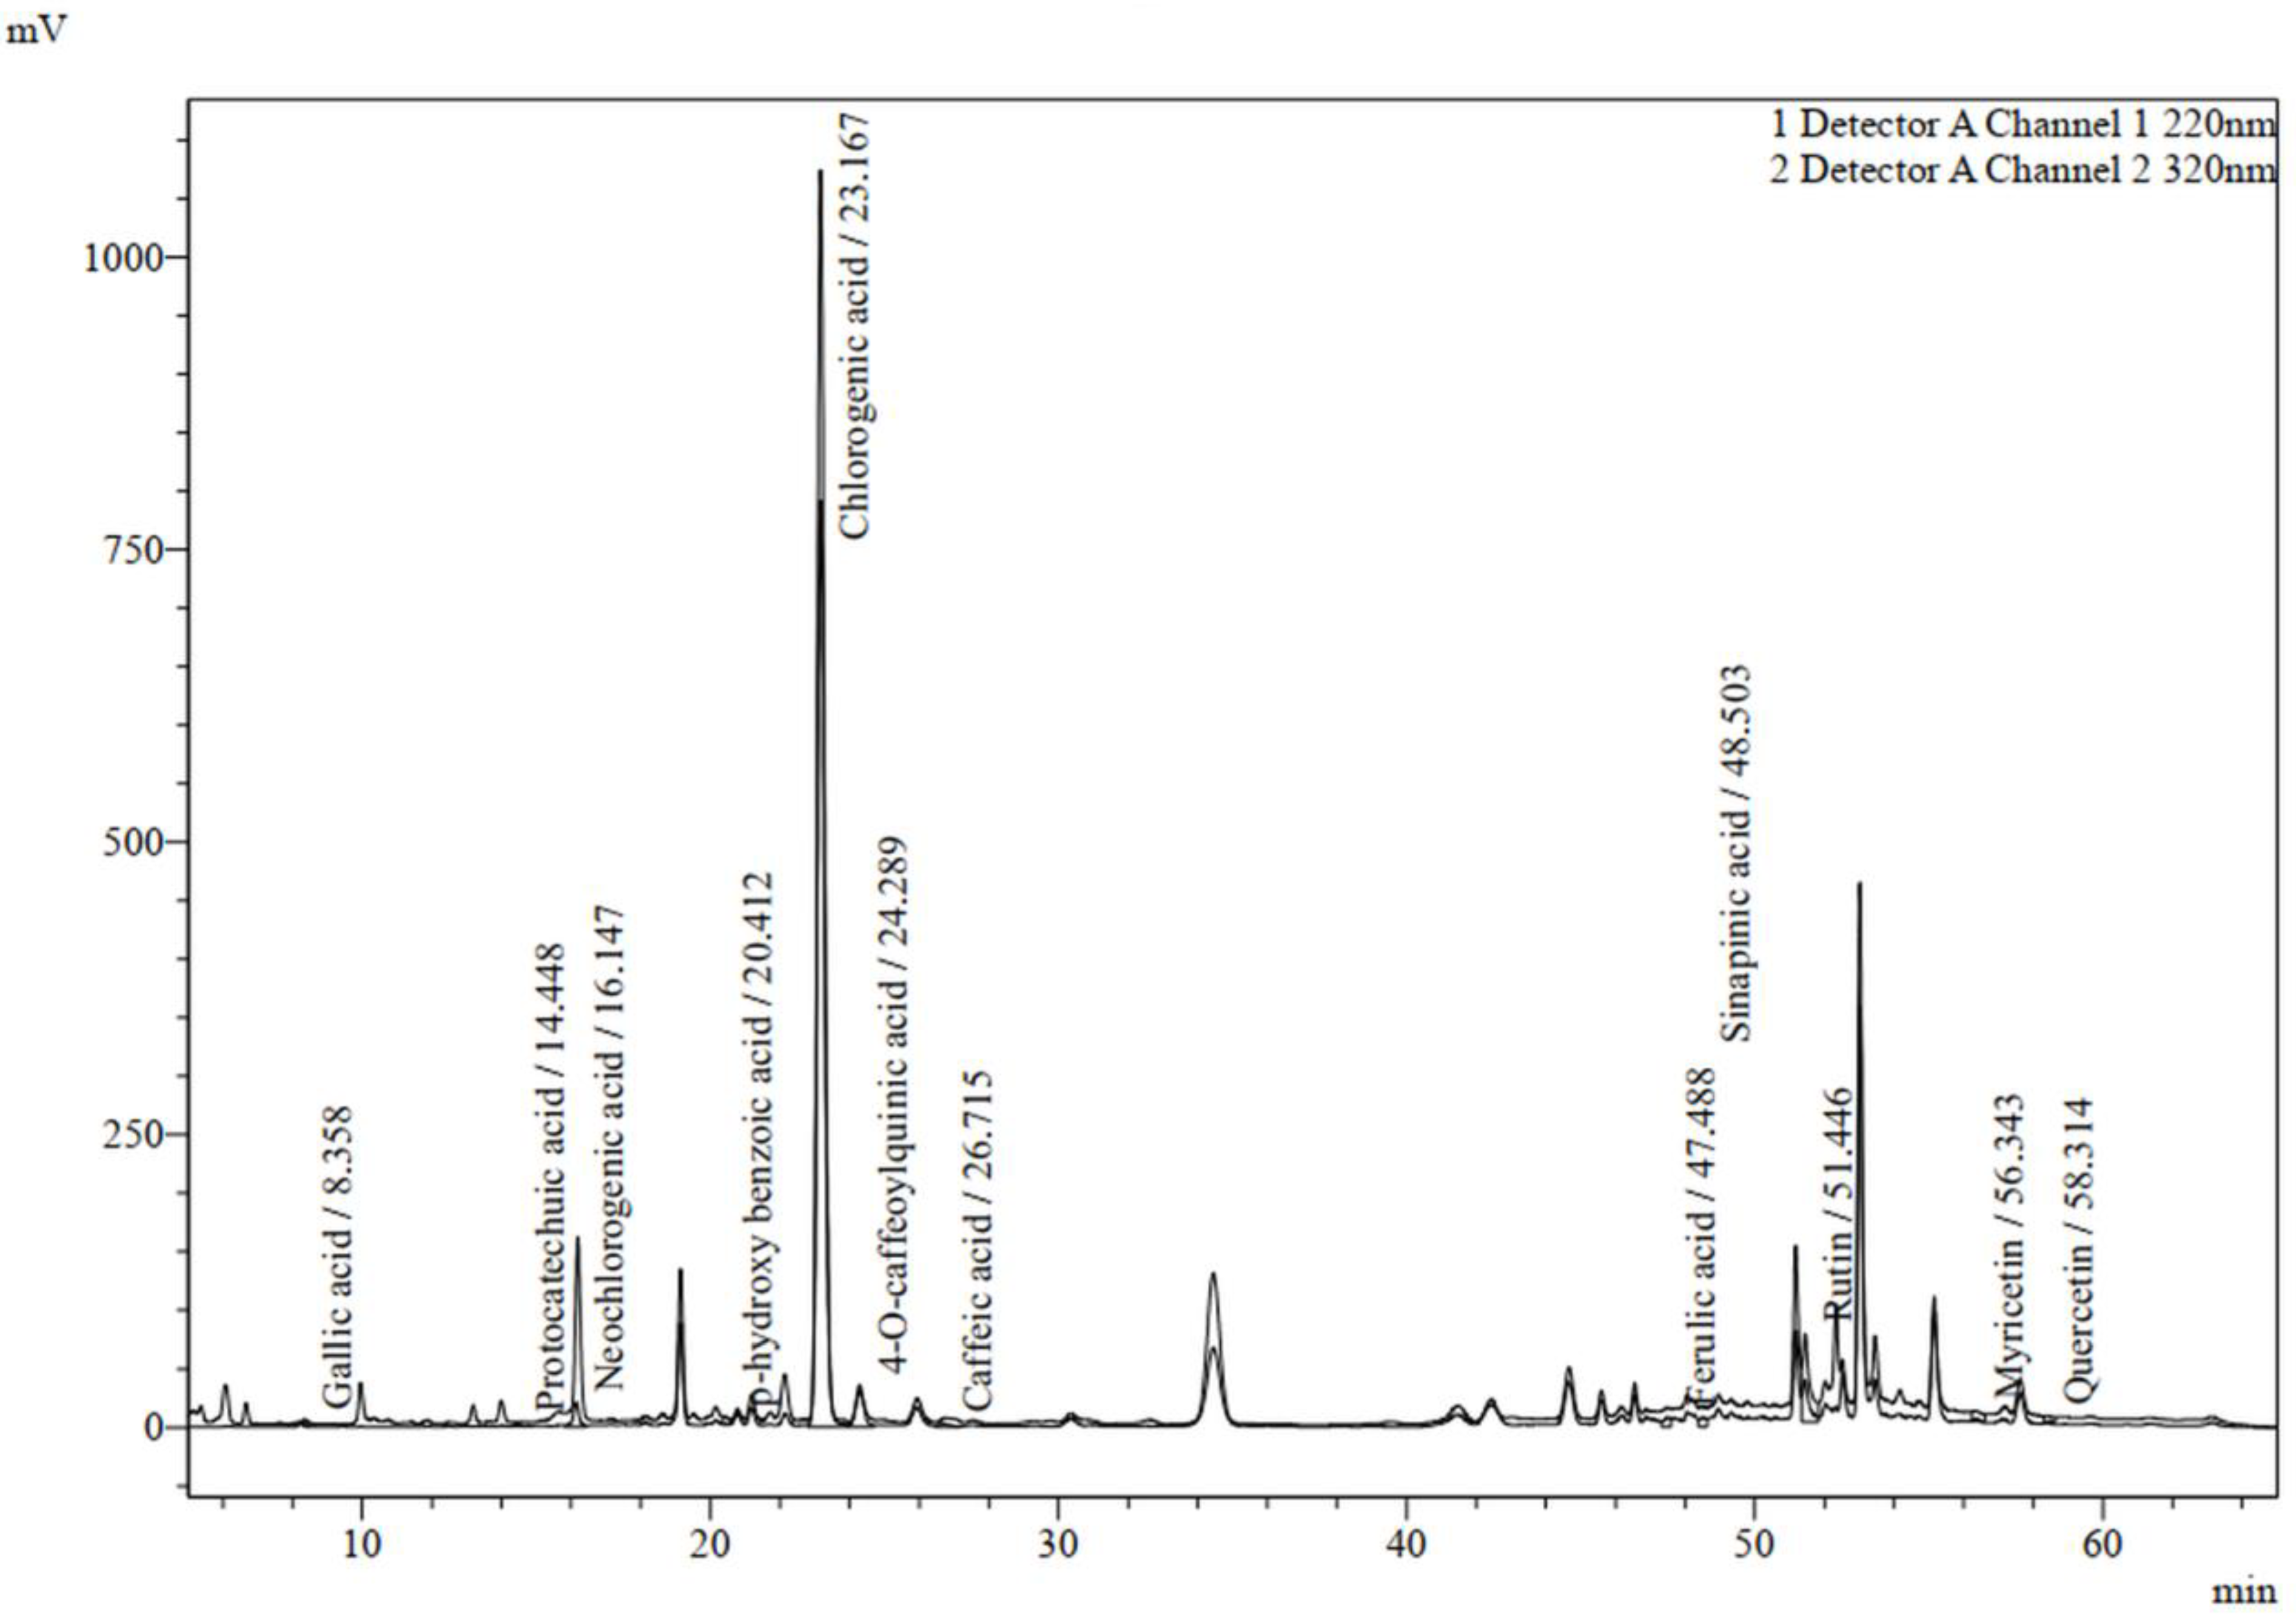
3.3. HPLC-UV/VIS Analysis of Individual Phenolic Compounds
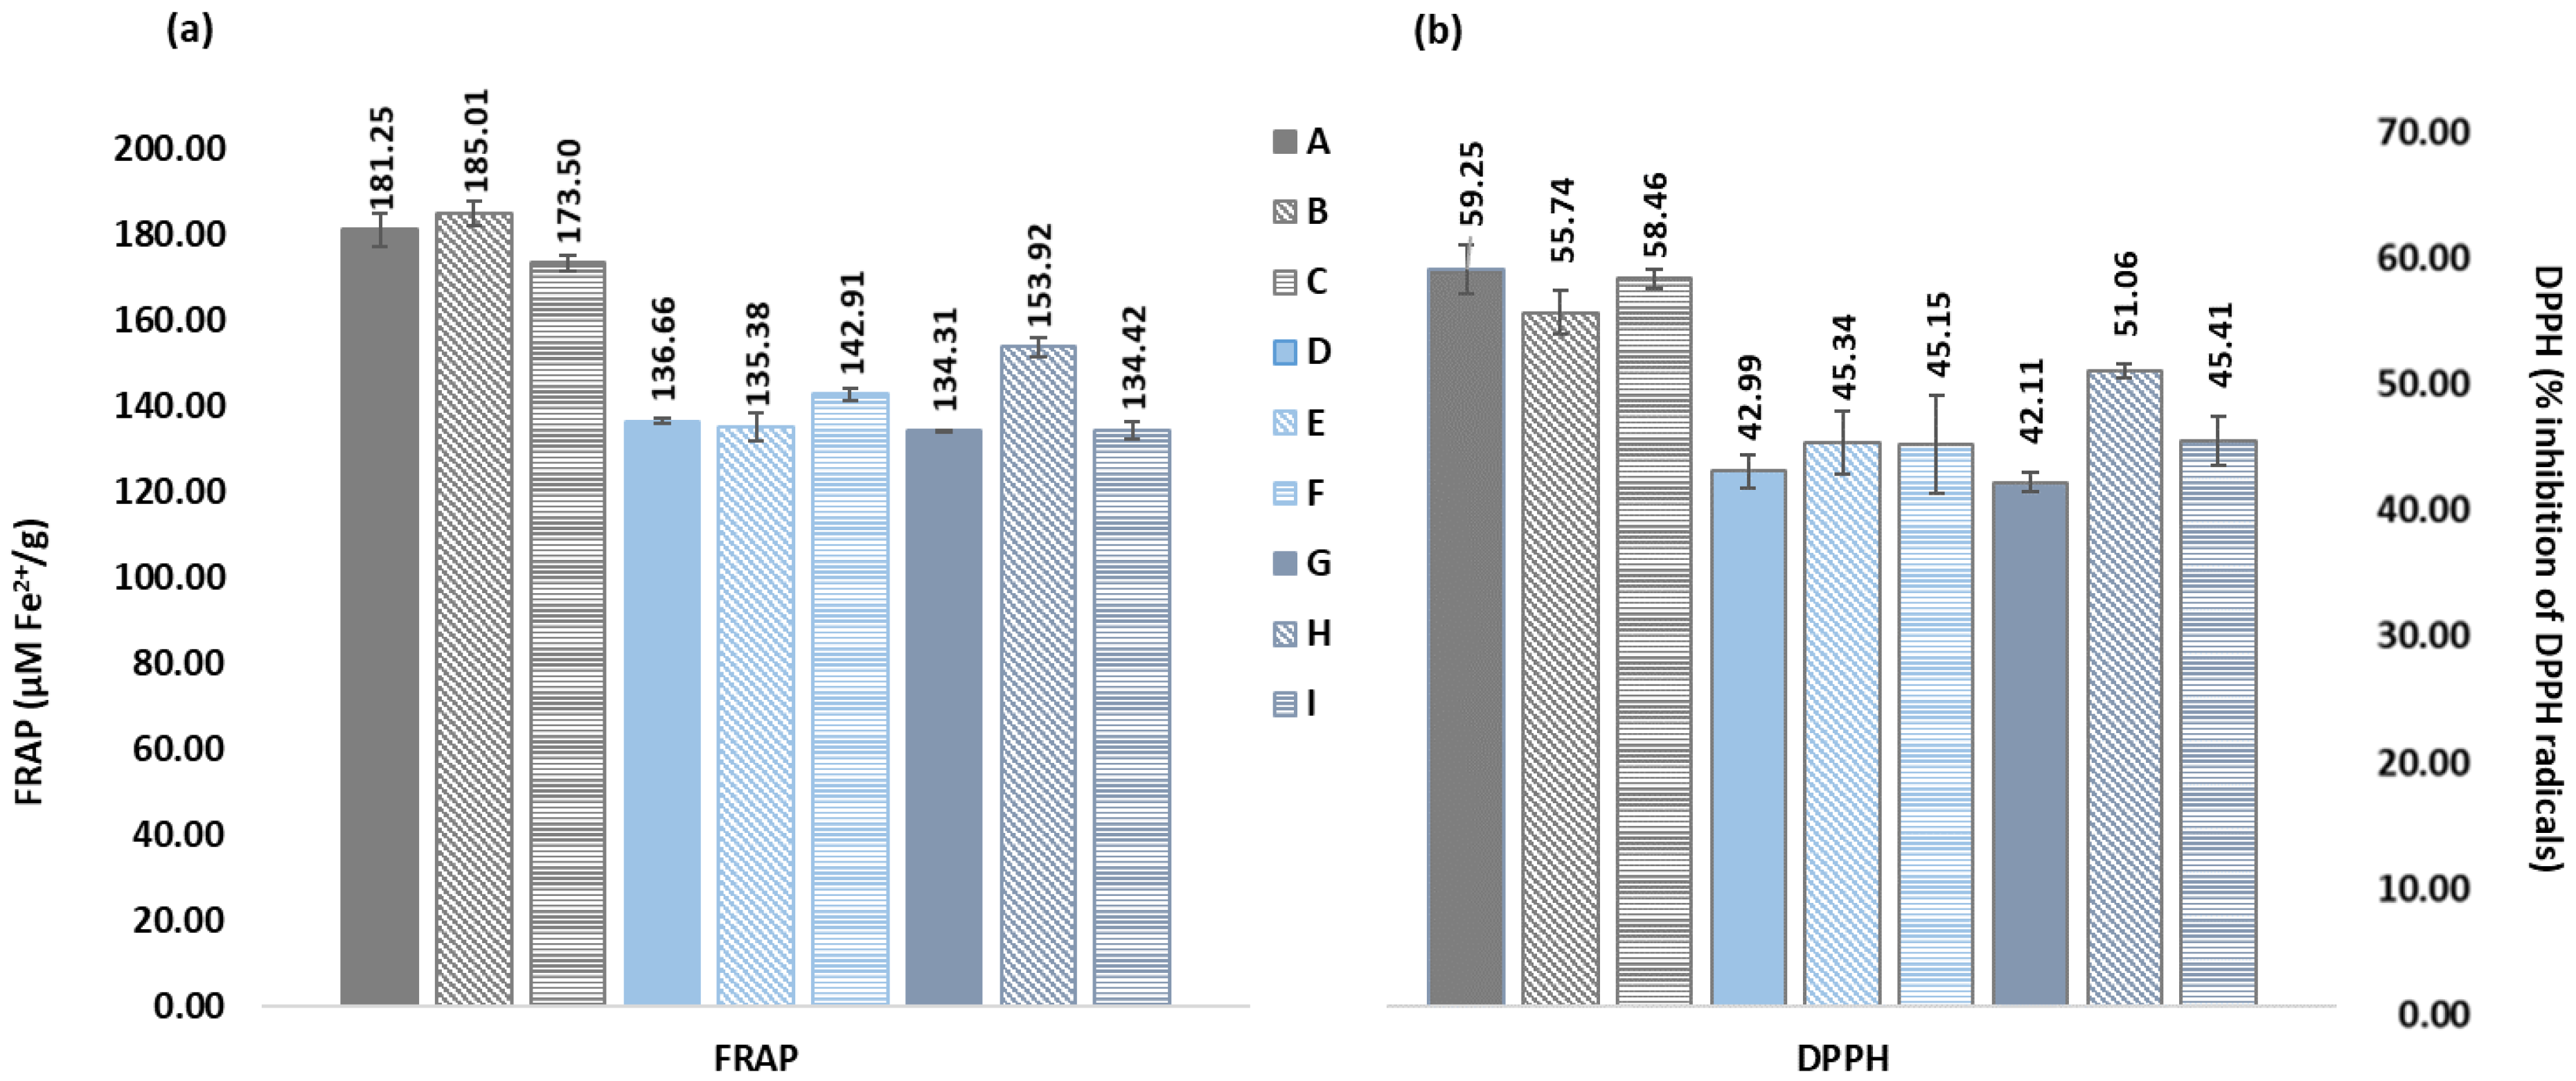
3.4. Antioxidant Activity
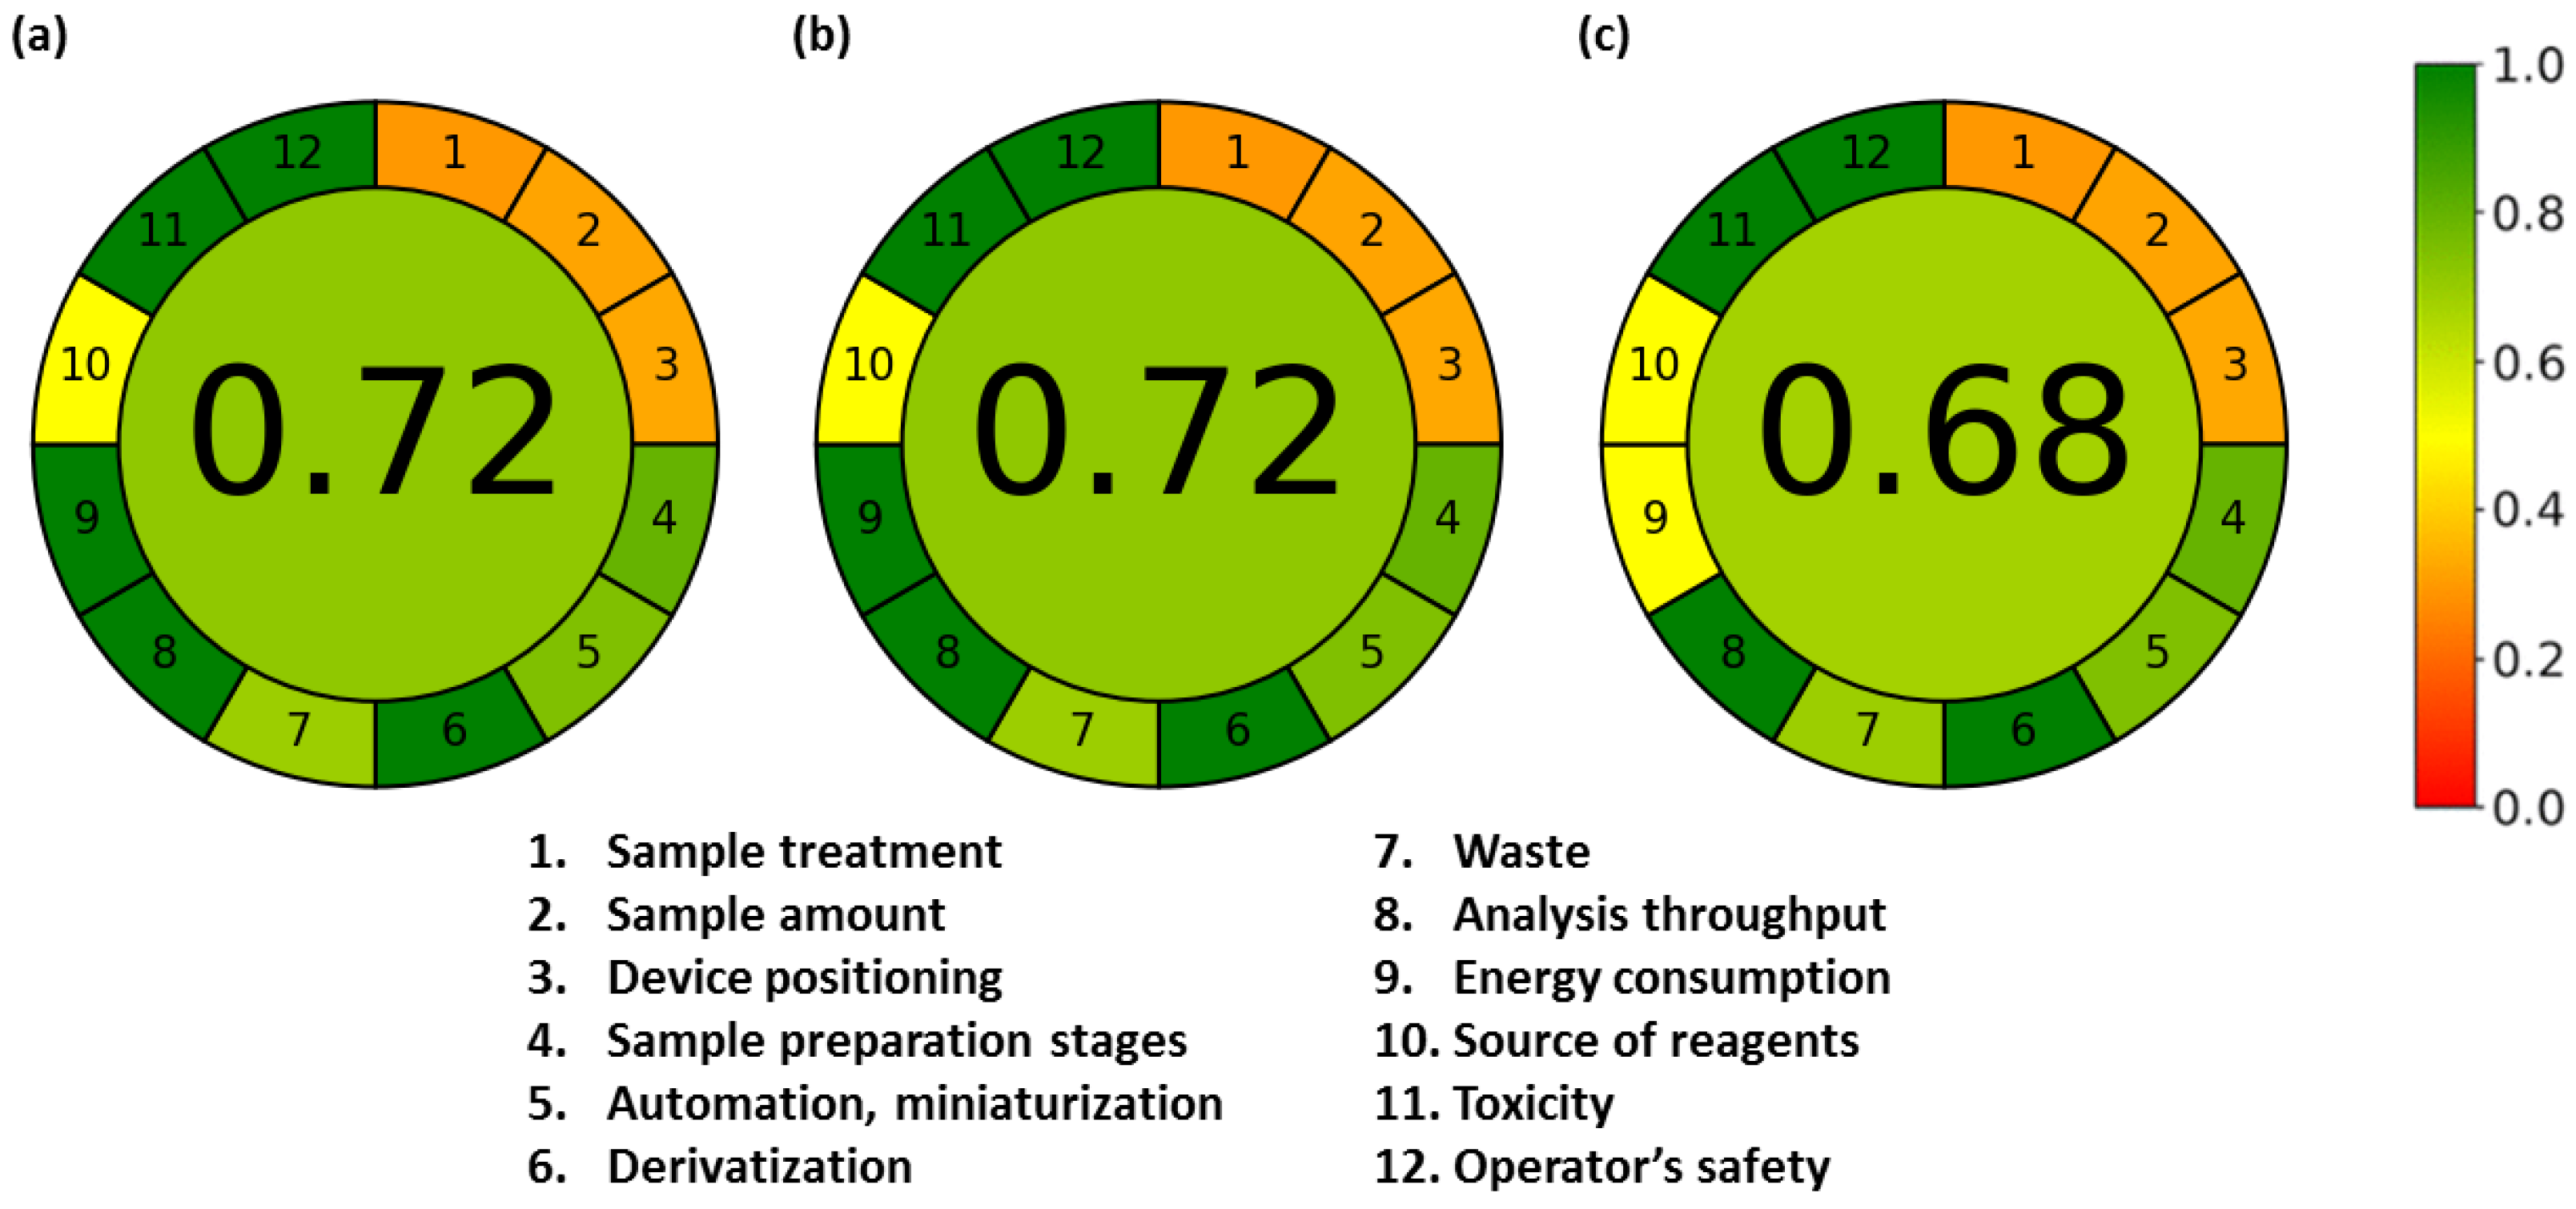
3.5. Greenness Assessment Method
4. Conclusions
Author Contributions
Funding
Data Availability Statement
Acknowledgments
Conflicts of Interest
Abbreviations
| AGREE | analytical greenness |
| BHT | butylated hydroxytoluene |
| CA | caffeic acid |
| CEs | catechin equivalents |
| cCGA | chlorogenic acid |
| nCGA | neochlorogenic acid |
| CSE | conventional solvent extraction |
| d.p.m. | dry plant material |
| DPPH | 2,2-diphenyl-1-picryl-hydrazyl |
| EAE | enzyme-assisted extraction |
| EtOH | ethanol |
| FA | ferulic acid |
| FDA | US Food and Drug Administration |
| FRAP | ferric reducing antioxidant power |
| GA | gallic acid |
| GAEs | gallic acid equivalents |
| GRAS | generally recognized as safe |
| HPLC-UV/VIS | high-performance liquid chromatography coupled with an ultraviolet/visible detector |
| MAE | microwave-assisted extraction |
| PCA | protocatechuic acid |
| PEF | pulsed electric field |
| PLE | pressure-assisted liquid extraction |
| PHBA | p-hydroxybenzoic acid |
| R | rutin |
| REs | rutin equivalents |
| RT | room temperature |
| SA | sinapic acid |
| SC-CO2 | supercritical CO2 extraction |
| SD | statistical deviation |
| TFC | total flavonoid content |
| TPC | total phenolic content |
| TTC | total tannin content |
| UAE | ultrasound-assisted extraction |
| UV-VIS | ultraviolet–visible spectrophotometric measurements |
References
- Siracusa, L.; Kulisic-Bilusic, T.; Politeo, O.; Krause, I.; Dejanovic, B.; Ruberto, G. Phenolic Composition and Antioxidant Activity of Aqueous Infusions from Capparis spinosa L. and Crithmum maritimum L. before and after Submission to a Two-Step in Vitro Digestion Model. J. Agric. Food Chem. 2011, 59, 12453–12459. [Google Scholar] [CrossRef]
- Atia, A.; Barhoumi, Z.; Mokded, R.; Abdelly, C.; Smaoui, A. Environmental Eco-Physiology and Economical Potential of the Halophyte Crithmum maritimum L. (Apiaceae). J. Med. Plants Res. 2011, 5, 3564–3571. [Google Scholar]
- Renna, M. Reviewing the Prospects of Sea Fennel (Crithmum maritimum L.) as Emerging Vegetable Crop. Plants 2018, 7, 92. [Google Scholar] [CrossRef] [Green Version]
- Zafeiropoulou, V.; Tomou, E.M.; Douros, A.; Skaltsa, H. The Effect of Successive Harvesting on The Volatile Constituents of Two Essential Oils of Cultivated Populations of Sea Fennel (Crithmum maritimum L.) in Greece. J. Essent. Oil-Bear. Plants 2021, 24, 1–11. [Google Scholar] [CrossRef]
- Generalić Mekinić, I.; Blažević, I.; Mudnić, I.; Burčul, F.; Grga, M.; Skroza, D.; Jerčić, I.; Ljubenkov, I.; Boban, M.; Miloš, M.; et al. Sea Fennel (Crithmum maritimum L.): Phytochemical Profile, Antioxidative, Cholinesterase Inhibitory and Vasodilatory Activity. J. Food Sci. Technol. 2016, 53, 3104–3112. [Google Scholar] [CrossRef] [Green Version]
- Generalić Mekinić, I.; Šimat, V.; Ljubenkov, I.; Burčul, F.; Grga, M.; Mihajlovski, M.; Lončar, R.; Katalinić, V.; Skroza, D. Influence of the Vegetation Period on Sea Fennel, Crithmum maritimum L. (Apiaceae), Phenolic Composition, Antioxidant and Anticholinesterase Activities. Ind. Crops Prod. 2018, 124, 947–953. [Google Scholar] [CrossRef]
- Pereira, C.G.; Barreira, L.; da Rosa Neng, N.; Nogueira, J.M.F.; Marques, C.; Santos, T.F.; Varela, J.; Custódio, L. Searching for New Sources of Innovative Products for the Food Industry within Halophyte Aromatic Plants: In Vitro Antioxidant Activity and Phenolic and Mineral Contents of Infusions and Decoctions of Crithmum maritimum L. Food Chem. Toxicol. 2017, 107, 581–589. [Google Scholar] [CrossRef]
- Kadoglidou, K.; Irakli, M.; Boutsika, A.; Mellidou, I.; Maninis, N.; Sarrou, E.; Georgiadou, V.; Tourvas, N.; Krigas, N.; Moysiadis, T.; et al. Metabolomic Fingerprinting and Molecular Characterization of the Rock Samphire Germplasm Collection from the Balkan Botanic Garden of Kroussia, Northern Greece. Plants 2022, 11, 573. [Google Scholar] [CrossRef]
- Saranraj, P.; Behera, S.S.; Ray, R.C. Traditional Foods from Tropical Root and Tuber Crops: Innovations and Challenges. In Innovations and Challenges; Elsevier Inc.: Amsterdam, The Netherlands, 2019; Chapter 7. [Google Scholar] [CrossRef]
- Houta, O.; Akrout, A.; Neffati, M.; Amri, H. Phenolic Contents, Antioxidant and Antimicrobial Potentials of Crithmum maritimum Cultivated in Tunisia Arid Zones. J. Biol. Act. Prod. Nat. 2011, 1, 138–143. [Google Scholar] [CrossRef]
- Jallali, I.; Zaouali, Y.; Missaoui, I.; Smeoui, A.; Abdelly, C.; Ksouri, R. Variability of Antioxidant and Antibacterial Effects of Essential Oils and Acetonic Extracts of Two Edible Halophytes: Crithmum maritimum L. and Inula crithmoïdes L. Food Chem. 2014, 145, 1031–1038. [Google Scholar] [CrossRef]
- Roleira, F.M.F.; Varela, C.L.; Costa, S.C.; Tavares-da-Silva, E.J. Phenolic Derivatives from Medicinal Herbs and Plant Extracts: Anticancer Effects and Synthetic Approaches to Modulate Biological Activity. Stud. Nat. Prod. Chem. 2018, 57, 115–156. [Google Scholar] [CrossRef]
- Alara, O.R.; Abdurahman, N.H.; Ukaegbu, C.I. Extraction of Phenolic Compounds: A Review. Curr. Res. Food Sci. 2021, 4, 200–214. [Google Scholar] [CrossRef]
- Altemimi, A.; Lakhssassi, N.; Baharlouei, A.; Watson, D.G.; Lightfoot, D.A. Phytochemicals: Extraction, Isolation, and Identification of Bioactive Compounds from Plant Extracts. Plants 2017, 6, 42. [Google Scholar] [CrossRef] [Green Version]
- Li, H.; Pordesimo, L.; Weiss, J. High Intensity Ultrasound-Assisted Extraction of Oil from Soybeans. Food Res. Int. 2004, 37, 731–738. [Google Scholar] [CrossRef]
- Gallo, M.; Ferracane, R.; Graziani, G.; Ritieni, A.; Fogliano, V. Microwave Assisted Extraction of Phenolic Compounds from Four Different Spices. Molecules 2010, 15, 6365–6374. [Google Scholar] [CrossRef] [PubMed] [Green Version]
- Baltacıoğlu, H.; Baltacıoğlu, C.; Okur, I.; Tanrıvermiş, A.; Yalıç, M. Optimization of Microwave-Assisted Extraction of Phenolic Compounds from Tomato: Characterization by FTIR and HPLC and Comparison with Conventional Solvent Extraction. Vib. Spectrosc. 2021, 113, 103204. [Google Scholar] [CrossRef]
- Lovrić, V.; Putnik, P.; Bursać Kovačević, D.; Jukić, M.; Dragović-Uzelac, V. The Effect of Microwave-Assisted Extraction on the Phenolic Compounds and Antioxidant Capacity of Blackthorn Flowers. Food Technol. Biotechnol. 2017, 55, 243–250. [Google Scholar] [CrossRef]
- Saifullah, M.; McCullum, R.; McCluskey, A.; Vuong, Q. Comparison of Conventional Extraction Technique with Ultrasound Assisted Extraction on Recovery of Phenolic Compounds from Lemon Scented Tea Tree (Leptospermum petersonii) Leaves. Heliyon 2020, 6, e03666. [Google Scholar] [CrossRef]
- Babotă, M.; Frumuzachi, O.; Gâvan, A.; Iacoviță, C.; Pinela, J.; Barros, L.; Ferreira, I.C.F.R.; Zhang, L.; Lucini, L.; Rocchetti, G.; et al. Optimized Ultrasound-Assisted Extraction of Phenolic Compounds from Thymus comosus Heuff. Ex Griseb. et Schenk (Wild Thyme) and Their Bioactive Potential. Ultrason. Sonochem. 2022, 84, 105954. [Google Scholar] [CrossRef]
- Barros, F.; Dykes, L.; Awika, J.M.; Rooney, L.W. Accelerated Solvent Extraction of Phenolic Compounds from Sorghum Brans. J. Cereal Sci. 2013, 58, 305–312. [Google Scholar] [CrossRef]
- Repajić, M.; Ekić, S.; Kruk, V.; Dragović Uzelac, V. Effect of Accelerated Solvent Extraction Conditions on the Isolation of Bioactive Compounds from Fennel (Foeniculum vulgare Mill.) Seeds. Hrvat. Časopis Za Prehrambenu Tehnol. Biotehnol. I Nutr. 2021, 15, 102–106. [Google Scholar] [CrossRef]
- Lima, M.d.A.; Andreou, R.; Charalampopoulos, D.; Chatzifragkou, A. Supercritical Carbon Dioxide Extraction of Phenolic Compounds from Potato (Solanum tuberosum) Peels. Appl. Sci. 2021, 11, 3410. [Google Scholar] [CrossRef]
- Fiori, L.; de Faveri, D.; Casazza, A.A.; Perego, P. Grape By-Products: Extraction of Polyphenolic Compounds Using Supercritical CO2 and Liquid Organic Solvent–a Preliminary Investigation Subproductos de La Uva: Extracción de Compuestos Polifenólicos Usando CO2 Supercrítico y Disolventes Orgánicos Líquidos-una investigación preliminar. CYTA-J. Food 2009, 7, 163–171. [Google Scholar] [CrossRef]
- Athanasiadis, V.; Pappas, V.M.; Palaiogiannis, D.; Chatzimitakos, T.; Bozinou, E.; Makris, D.P.; Lalas, S.I. Pulsed Electric Field-Based Extraction of Total Polyphenols from Sideritis Raiseri Using Hydroethanolic Mixtures. Oxygen 2022, 2, 91–98. [Google Scholar] [CrossRef]
- Carpentieri, S.; Ferrari, G.; Pataro, G. Optimization of Pulsed Electric Fields-Assisted Extraction of Phenolic Compounds from White Grape Pomace Using Response Surface Methodology. Front. Sustain. Food Syst. 2022, 6, 854968. [Google Scholar] [CrossRef]
- Gómez-García, R.; Martínez-Ávila, G.C.G.; Aguilar, C.N. Enzyme-Assisted Extraction of Antioxidative Phenolics from Grape (Vitis vinifera L.) Residues. 3 Biotech 2012, 2, 297–300. [Google Scholar] [CrossRef] [Green Version]
- Qadir, R.; Anwar, F.; Naseem, K.; Tahir, M.H.; Alhumade, H. Enzyme-Assisted Extraction of Phenolics from Capparis Spinosa Fruit: Modeling and Optimization of the Process by RSM and ANN. ACS Omega 2022, 7, 33031–33038. [Google Scholar] [CrossRef]
- Ghandahari Yazdi, A.P.; Barzegar, M.; Sahari, M.A.; Ahmadi Gavlighi, H. Optimization of the Enzyme-Assisted Aqueous Extraction of Phenolic Compounds from Pistachio Green Hull. Food Sci. Nutr. 2019, 7, 356–366. [Google Scholar] [CrossRef]
- Katalinic, V.; Mozina, S.S.; Generalic, I.; Skroza, D.; Ljubenkov, I.; Klancnik, A. Phenolic Profile, Antioxidant Capacity, and Antimicrobial Activity of Leaf Extracts from Six Vitis Vinifera L. Varieties. Int. J. Food Prop. 2013, 16, 45–60. [Google Scholar] [CrossRef]
- Yang, J.; Meyers, K.J.; Van Der Heide, J.; Rui, H.L. Varietal Differences in Phenolic Content and Antioxidant and Antiproliferative Activities of Onions. J. Agric. Food Chem. 2004, 52, 6787–6793. [Google Scholar] [CrossRef]
- Julkunen-Tiitto, R. Phenolic Constituents in the Leaves of Northern Willows: Methods for the Analysis of Certain Phenolics. J. Agric. Food Chem. 1985, 33, 213–217. [Google Scholar] [CrossRef]
- Pena-Pereira, F.; Wojnowski, W.; Tobiszewski, M. AGREE–Analytical GREEnness Metric Approach and Software. Anal. Chem. 2020, 92, 10076–10082. [Google Scholar] [CrossRef] [PubMed]
- Sun, C.; Wu, Z.; Wang, Z.; Zhang, H. Effect of Ethanol/Water Solvents on Phenolic Profiles and Antioxidant Properties of Beijing Propolis Extracts. Evid.-Based Complement. Altern. Med. 2015, 2015, 595393. [Google Scholar] [CrossRef] [Green Version]
- Alemán, A.; Marín, D.; Taladrid, D.; Montero, P.; Carmen Gómez-Guillén, M. Encapsulation of Antioxidant Sea Fennel (Crithmum maritimum) Aqueous and Ethanolic Extracts in Freeze-Dried Soy Phosphatidylcholine Liposomes. Food Res. Int. 2019, 119, 665–674. [Google Scholar] [CrossRef] [PubMed] [Green Version]
- Osmić, S.; Begić, S.; Mićić, V.; Petrović, Z.; Avdić, G. Effect of Solvent and Extraction Conditions on Antioxidative Activity of Sage (Salvia officinalis L.) Extracts Obtained by Maceration. Technol. Acta 2019, 11, 1–8. [Google Scholar] [CrossRef]
- Jiménez-Moreno, N.; Volpe, F.; Moler, J.A.; Esparza, I.; Ancín-Azpilicueta, C. Impact of Extraction Conditions on the Phenolic Composition and Antioxidant Capacity of Grape Stem Extracts. Antioxidants 2019, 8, 597. [Google Scholar] [CrossRef] [Green Version]
- Urías-Orona, V.; Gutiérrez-Soto, G.; Ruiz-Bautista, J.; Flores-Alonso, R.; Montiel-Ramos, I.; Martínez-Ávila, G.C.G.; Aranda-Ruiz, J.; Niño-Medina, G. Influence of Extraction Solvent on Phenolic Content and Antioxidant Capacity Level of a Commercial Food Supplement from Moringa oleifera Leaves. Arch. Latinoam. Nutr. 2017, 67, 211–217. [Google Scholar]
- Fatiha, B.; Khodir, M.; Farid, D.; Tiziri, R.; Karima, B.; Sonia, O.; Mohamed, C. Optimisation of Solvent Extraction of Antioxidants (Phenolic Compounds) from Algerian Mint (Mentha spicata L.). Pharmacogn. Commun. 2012, 2, 72–86. [Google Scholar] [CrossRef]
- Lohvina, H.; Sándor, M.; Wink, M. Effect of Ethanol Solvents on Total Phenolic Content and Antioxidant Properties of Seed Extracts of Fenugreek (Trigonella foenum-graecum L.) Varieties and Determination of Phenolic Composition by Hplc-Esi-Ms. Diversity 2022, 14, 7. [Google Scholar] [CrossRef]
- Bui-Phuc, T.; Nhu-Trang, T.T.; Cong-Hau, N. Comparison of Chemical Composition of Essential Oils Obtained by Hydro-Distillation and Microwave-Assisted Extraction of Japanese Mint (Mentha Arvensis L.) Grown in Vietnam. IOP Conf. Ser. Mater. Sci. Eng. 2020, 991, 012039. [Google Scholar] [CrossRef]
- Huma, Z.E.; Jayasena, V.; Nasar-Abbas, S.M.; Imran, M.; Khan, M.K. Process Optimization of Polyphenol Extraction from Carob (Ceratonia siliqua) Kibbles Using Microwave-Assisted Technique. J. Food Process. Preserv. 2018, 42, e13450. [Google Scholar] [CrossRef]
- Cristina, C.; Lucia, P.; Sara, S.; Francesco, S.; Nobile Matteo Alessandro, D.; Amalia, C. Study of the Efficacy of Two Extraction Techniques from Crithmum maritimum and Salicornia europaea. J. Food Nutr. Res. 2018, 6, 456–463. [Google Scholar] [CrossRef] [Green Version]
- Meot-Duros, L.; Magné, C. Antioxidant Activity and Phenol Content of Crithmum maritimum L. Leaves. Plant Physiol. Biochem. 2009, 47, 37–41. [Google Scholar] [CrossRef] [PubMed]
- Hayta, M.; İşçimen, E.M. Antidiabetic, Antihypertensive and Antioxidant Properties of Grapevine Leaf Extracts Obtained by Ultrasound, Microwave Assisted, and Classical Solvent Extraction. Erwerbs-Obstbau 2018, 60, 79–85. [Google Scholar] [CrossRef]
- Goltz, C.; Ávila, S.; Barbieri, J.B.; Igarashi-Mafra, L.; Mafra, M.R. Ultrasound-Assisted Extraction of Phenolic Compounds from Macela (Achyrolcine satureioides) Extracts. Ind. Crops Prod. 2018, 115, 227–234. [Google Scholar] [CrossRef]
- Gharekhani, M.; Ghorbani, M.; Rasoulnejad, N. Microwave-Assisted Extraction of Phenolic and Flavonoid Compounds from Eucalyptus camaldulensis Dehn Leaves as Compared with Ultrasound-Assisted Extraction. Lat. Am. Appl. Res. 2012, 42, 305–310. [Google Scholar]
- Pan, X.; Niu, G.; Liu, H. Microwave-Assisted Extraction of Tea Polyphenols and Tea Caffeine from Green Tea Leaves. Chem. Eng. Process. 2003, 42, 129–133. [Google Scholar] [CrossRef]
- Routray, W.; Orsat, V. MAE of Phenolic Compounds from Blueberry Leaves and Comparison with Other Extraction Methods. Ind. Crops Prod. 2014, 58, 36–45. [Google Scholar] [CrossRef]
- Chahyadi, A.; Elfahmi. The Influence of Extraction Methods on Rutin Yield of Cassava Leaves (Manihot esculenta Crantz). Saudi Pharm. J. 2020, 28, 1466–1473. [Google Scholar] [CrossRef]
- Baiano, A.; Romaniello, R.; Giametta, F.; Fiore, A. Optimization of Process Variables for the Sustainable Extraction of Phenolic Compounds from Chicory and Fennel By-Products. Appl. Sci. 2023, 13, 4191. [Google Scholar] [CrossRef]
- Liang, N.; Kitts, D.D. Role of Chlorogenic Acids in Controlling Oxidative and Inflammatory Stress Conditions. Nutrients 2015, 8, 16. [Google Scholar] [CrossRef] [PubMed] [Green Version]
- Sato, Y.; Itagaki, S.; Kurokawa, T.; Ogura, J.; Kobayashi, M.; Hirano, T.; Sugawara, M.; Iseki, K. In Vitro and in Vivo Antioxidant Properties of Chlorogenic Acid and Caffeic Acid. Int. J. Pharm. 2011, 403, 136–138. [Google Scholar] [CrossRef] [PubMed]
- Saqib, M.; Iqbal, S.; Mahmood, A.; Akram, R. Theoretical Investigation for Exploring the Antioxidant Potential of Chlorogenic Acid: A Density Functional Theory Study. Int. J. Food Prop. 2016, 19, 745–751. [Google Scholar] [CrossRef] [Green Version]
- Cebi, A.; Ustaoglu, F. The Free Radical Scavenging Activity of Crithmum maritimum L. from the Blacksea Cost. ODÜ Tıp Derg. 2022, 9, 67–72. [Google Scholar]


| Sample | Extraction Method | Time | Conditions | |
|---|---|---|---|---|
| A | MAE | 30 min | Power | 300 W |
| B | 500 W | |||
| C | 700 W | |||
| D | UAE | Temperature | RT | |
| E | 40 °C | |||
| F | 60 °C | |||
| G | CSE | Temperature | RT | |
| H | 40 °C | |||
| I | 60 °C | |||
| Type of Extraction | Condition | TPC (mg GAE/g d.p.m.) | TFC (mg RE/g d.p.m.) | TTC (mg CE/g d.p.m.) |
|---|---|---|---|---|
| MAE | 300 W | 28.80 ± 0.88 | 102.95 ± 1.01 | 3.68 ± 0.10 |
| 500 W | 27.17 ± 0.42 | 97.83 ± 1.29 | 3.14 ± 0.08 | |
| 700 W | 25.91 ± 0.45 | 89.61 ± 1.04 | 5.63 ± 0.06 | |
| UAE | RT | 19.96 ± 0.52 | 81.75 ± 2.62 | 5.67 ± 0.09 |
| 40 °C | 18.46 ± 0.83 | 80.53 ± 0.35 | 3.87 ± 0.09 | |
| 60 °C | 19.97 ± 0.58 | 77.69 ± 0.56 | 3.34 ± 0.02 | |
| CSE | RT | 20.61 ± 077 | 79.56 ± 0.84 | 4.17 ± 0.13 |
| 40 °C | 23.41 ± 0.57 | 85.20 ± 0.76 | 3.35 ± 0.14 | |
| 60 °C | 20.87 ± 0.53 | 82.96 ± 2.05 | 3.40 ± 0.09 |
| Phenolic Compound | Concentration (mg/g) ± SD | |||||||||
|---|---|---|---|---|---|---|---|---|---|---|
| MAE | UAE | CSE | ||||||||
| 300 W | 500 W | 700 W | RT | 40 °C | 60 °C | RT | 40 °C | 60 °C | ||
| CGA | 10.50 ± 0.00 | 10.67 ± 0.00 | 10.10 ± 0.01 | 8.68 ± 0.00 | 8.38 ± 0.00 | 8.33 ± 0.01 | 8.91 ± 0.00 | 9.78 ± 0.01 | 8.66 ± 0.00 | |
| R | 0.43 ± 0.01 | 0.45 ± 0.00 | 0.42 ± 0.00 | 0.32 ± 0.00 | 0.12 ± 0.00 | 0.32 ± 0.00 | 0.34 ± 0.00 | 0.40 ± 0.00 | 0.34 ± 0.01 | |
| cCGA | 0.37 ± 0.00 | 0.38 ± 0.00 | 0.39 ± 0.00 | 0.22 ± 0.00 | 0.21 ± 0.00 | 0.21 ± 0.00 | 0.20 ± 2 0.00 | 0.24 ± 0.00 | 0.21 ± 0.00 | |
| nCGA | 0.16 ± 0.00 | 0.17 ± 0.00 | 0.17 ± 0.00 | 0.09 ± 0.00 | 0.09 ± 0.00 | 0.09 ± 0.00 | 0.09 ± 0.00 | 0.10 ± 0.00 | 0.09 ± 0.00 | |
| Other phenolic acids | 0.72 ± 0.02 | 0.74 ± 0.01 | 0.75 ± 0.00 | 0.55 ± 0.00 | 0.53 ± 0.01 | 0.57 ± 0.00 | 0.67 ± 0.11 | 0.78 ± 0.01 | 0.69 ± 0.01 | |
| Other phenolic acids | PHBA | 0.06 ± 0.00 | 0.06 ± 0.00 | 0.07 ± 0.00 | 0.04 ± 0.00 | 0.04 ± 0.00 | 0.05 ± 0.00 | 0.11 ± 0.07 | 0.20 ± 0.00 | 0.19 ± 0.00 |
| SA | 0.05 ± 0.01 | 0.06 ± 0.00 | 0.05 ± 0.00 | 0.13 ± 0.00 | 0.13 ± 0.00 | 0.15 ± 0.01 | 0.11 ± 0.01 | 0.05 ± 0.00 | 0.04 ± 0.00 | |
| FA | 0.03 ± 0.00 | 0.04 ± 0.00 | 0.03 ± 0.00 | 0.03 ± 0.00 | 0.03 ± 0.00 | 0.05 ± 0.00 | 0.02 ± 0.00 | 0.03 ± 0.00 | 0.02 ± 0.00 | |
| CA | 0.02 ± 0.00 | 0.02 ± 0.00 | 0.02 ± 0.00 | 0.01 ± 0.00 | 0.01 ± 0.00 | 0.01 ± 0.00 | 0.06 ± 0.00 | 0.08 ± 0.00 | 0.07 ± 0.00 | |
| GA | 0.02 ± 0.00 | 0.01 ± 0.00 | 0.02 ± 0.00 | 0.01 ± 0.00 | 0.01 ± 0.00 | 0.01 ± 0.00 | 0.01 ± 0.00 | 0.01 ± 0.00 | 0.01 ± 0.00 | |
| PCA | 0.01 ± 0.00 | 0.01 ± 0.00 | <0.01 | <0.01 | <0.01 | <0.01 | 0.05 ± 0.00 | 0.06 ± 0.00 | 0.05 ± 0.00 | |
Disclaimer/Publisher’s Note: The statements, opinions and data contained in all publications are solely those of the individual author(s) and contributor(s) and not of MDPI and/or the editor(s). MDPI and/or the editor(s) disclaim responsibility for any injury to people or property resulting from any ideas, methods, instructions or products referred to in the content. |
© 2023 by the authors. Licensee MDPI, Basel, Switzerland. This article is an open access article distributed under the terms and conditions of the Creative Commons Attribution (CC BY) license (https://creativecommons.org/licenses/by/4.0/).
Share and Cite
Veršić Bratinčević, M.; Kovačić, R.; Popović, M.; Radman, S.; Generalić Mekinić, I. Comparison of Conventional and Green Extraction Techniques for the Isolation of Phenolic Antioxidants from Sea Fennel. Processes 2023, 11, 2172. https://doi.org/10.3390/pr11072172
Veršić Bratinčević M, Kovačić R, Popović M, Radman S, Generalić Mekinić I. Comparison of Conventional and Green Extraction Techniques for the Isolation of Phenolic Antioxidants from Sea Fennel. Processes. 2023; 11(7):2172. https://doi.org/10.3390/pr11072172
Chicago/Turabian StyleVeršić Bratinčević, Maja, Rea Kovačić, Marijana Popović, Sanja Radman, and Ivana Generalić Mekinić. 2023. "Comparison of Conventional and Green Extraction Techniques for the Isolation of Phenolic Antioxidants from Sea Fennel" Processes 11, no. 7: 2172. https://doi.org/10.3390/pr11072172