Article

Study on Production Characteristics during N2 Flooding in Low Permeability Reservoirs: Effect of Matrix Permeability and Fracture

1
Xinjiang Oilfield Company, PetroChina, Karamay 834000, China
2
Southwest Oil & Gas Company, Sinopec, Chengdu 610041, China
3
Production Division, China Oilfield Services Limited, Tianjin 300450, China
4
Key Laboratory of Unconventional Oil & Gas Development, China University of Petroleum (East China), Ministry of Education, Qingdao 266580, China
5
School of Petroleum Engineering, China University of Petroleum (East China), Qingdao 266580, China
*
Author to whom correspondence should be addressed.
Processes 2023, 11(7), 2112; https://doi.org/10.3390/pr11072112
Submission received: 15 June 2023 / Revised: 5 July 2023 / Accepted: 12 July 2023 / Published: 15 July 2023
(This article belongs to the Topic Multi-Phase Flow and Unconventional Oil/Gas Development)

Abstract

:
The N2 flooding enhanced oil recovery process is an important technical means for the development of low permeability reservoirs due to its good energy enhancement effect and good injectivity. Low permeability reservoirs have a large permeability span and strong heterogeneity, which will have a significant impact on gas injection development. In order to explore the influence of matrix permeability and fractures on the production characteristics of N2 flooding, this study conducted a series of displacement experiments with full-scale matrix permeability (0.1–50 mD) and different fracture conditions. The research results indicate that, in non-fracture low permeability cores, the pressure difference decreased with the matrix permeability increase, and the volume of N2 injection required to achieve the highest injection pressure decreased. In addition, the increase in matrix permeability accelerates the gas breakthrough and gas channeling, but is beneficial for improving no-gas oil recovery and ultimate oil recovery due to the decrease in crude oil flow resistance. The impact of different matrix permeability ranges on production characteristics varies. When the matrix permeability is less than 2 mD, the characteristics of oil and gas production are significantly affected by changes in matrix permeability. When the matrix permeability is greater than 2 mD, the impact of changes in matrix permeability on development effectiveness is weakened. The existence of fracture causes a high permeability channel to appear in the low permeability matrix, exacerbating the gas breakthrough and channeling, and significantly reducing the utilization of matrix crude oil (about a 50% decrease in oil recovery). The increase in matrix permeability is beneficial for weakening the heterogeneity between fractures and the matrix, alleviating the gas channeling, thereby increasing the swept volume in the low permeability matrix and improving oil recovery.

1. Introduction

With the gradual exploration and development of oil and gas resources, the proportion of low permeability oil field reserves continues to increase, and the research and development of low permeability oil reservoirs will become increasingly important [1,2,3,4,5,6]. For low permeability reservoirs, due to the strong heterogeneity of the reservoir, the water injection pressure is high, exceeding the fracture pressure [7,8,9,10]. After injection, the water channeling characteristics are obvious, and the development effect is poor. The overall performance is characterized by “no injection, no production”. In addition, low permeability reservoirs have strong sensitivity, and water injection can cause significant formation damage, making the permeability of the formation worse [11,12,13,14,15,16]. On site application has found that injecting N2 into the formation to develop low permeability reservoirs can overcome problems such as low liquid production and poor water absorption capacity in water injection development [17,18,19,20,21]. Therefore, applying N2 to the development of low permeability reservoirs has enormous advantages.
N2 has relatively stable chemical properties and exhibits strong inertness under normal conditions. N2 is not corrosive and non-toxic, making it safe and reliable to use. The compression coefficient of N2 is high and, due to the harsh conditions for N2 to reach the critical value, the elastic energy of N2 can be used to reduce the decay rate of formation energy in the depressurization production of oil reservoirs, and the elastic flow of gas can be used to drive out crude oil [22,23]. N2 has a low solubility in oil and therefore has a high interfacial tension with oil [24]. When it flows along the large channel, it is subjected to strong resistance caused by the Jamin effect [25]. Therefore, compared to CO2 flooding, more gas can flow along the pores and more oil can be expelled [26].
Due to the significant difference in viscosity between N2 and crude oil, it is easy for it to flow along high permeability channels. Therefore, reservoir heterogeneity has a significant impact on the effectiveness of N2 injection development [27,28,29,30]. The permeability range of low-permeability reservoirs is wide (0.1 mD–50 mD) and, considering that volume fracturing is often used to transform reservoirs in current low-permeability reservoir development [31], the presence of fractures can help improve the injection capacity of low-permeability reservoirs, but it also further increases the local heterogeneity of low-permeability reservoirs, which is a problem that needs full attention for gas drive technology.
Currently, research on gas EOR mainly includes the EOR mechanism (interface effect, energy enhancement, dissolved gas flooding, pore-scale oil recovery, etc.) [32,33,34,35], gas migration law (macro and micro observation) [25,36,37,38,39] and gas channeling prevention and control [40,41,42]. Within this research area, CO2 flooding accounts for a considerable proportion and some studies have discussed the impact of fractures, which has a certain enlightening significance for this project. Tang et al. [34] used nuclear magnetic resonance (NMR) technology to investigate the multiphase flow characteristics and fluid exchange phenomena at the pore scale during CO2 injection in fractured low-permeability cores. They found that, in CO2 flooding, mass transfer between fractures and the matrix occurs through percolation pores (PP) and migration pores (MP) connected to the fractures, with control over pressure difference, the number of PP and MP connected to the fractures and the swelling capacity of the oil. Similarly, Zhang et al. [35] also used NMR to investigate the fluid behavior in fractured ultra-low permeability cores and found that saturated oil in the pores connected to the fractures was first displaced. The oil recovery rate in adsorption pores, percolation pores and migration pores was determined by the compression state of the pore-throat and pore-fractures. Tang et al. [37] established microscopic visual models based on the actual sandstone pore throat characteristics, and carried out CO2 flooding and CO2-foam flooding experiments. What is striking in this study is that the micro models adopted take account of the influence of fractures, and it is found that fractures help improve the connectivity of a porous medium, but also significantly increase gas channeling and accelerate gas breakthrough, which deepens the understanding of gas migration patterns in fractured reservoirs. Ma et al. [43] conducted comparative oil displacement experiments on N2, CO2 and water under three levels of matrix permeability (0.1 mD, 1 mD and 10 mD) and analyzed the impact of system pressures on oil displacement efficiency. The experimental results indicate that the increase in matrix permeability and system pressure is beneficial for improving the oil displacement efficiency of ScCO2 and N2 flooding, but their influencing mechanisms are different. ScCO2 flooding benefits more from the increase in pore throat radii and the increase in miscibility content, while the main reason for the increase in N2 flooding oil recovery is the increase in N2 density and the decrease in interfacial tension between phases.
Overall, the impact of fractures on gas EOR development effectiveness in low permeability reservoirs with different matrix permeabilities needs to be clarified. In response to this issue, this article conducted a series of low permeability core N2 displacement experiments with different matrix permeability (0.1 mD–50 mD) and fracture conditions, systematically analyzing the characteristics of crude oil and N2 extraction. The research results are helpful in providing guidance for N2 flooding technology in low permeability reservoirs.

2. Experimental Section

2.1. Materials

The N2 used was purchased from Qingdao Tianyuan Co., Ltd. (Qingdao, China) The oil used was a mixture of dead oil and aviation kerosene in a ratio of 1:5. The viscosity of the oil sample in different temperature, measured using an Anton Paar rheometer (Anton Paar Ltd., Graz, Austria), is shown in Figure 1. And the density measured using a density bottle at room temperature was 0.792 g/cm3. The four components of the oil sample were determined using the chromatographic column method, and the results showed that the oil was mainly composed of saturated and aromatic components, as well as a small amount of resin and asphaltene components. The relevant physical property parameters can be seen in Table 1. A calcium chloride solution with a concentration of 1.08 × 10⁵ mg·L−1 was used to simulate formation water. The core used in the experiment was natural low permeability core, and the mineral components are shown in Table 2.
Fracturing treatment was carried out on some low permeability cores through tensioning and the image of the fractured core is shown in the Figure 2. There was only one fracture in the fractured core that was centered and perpendicular to the end face. The fractures made had a certain degree of tortuosity and good closure, with no relative slip on the fracture surface, which could effectively simulate low permeability reservoirs with well-developed natural or artificial fractures.

2.2. Apparatus

The schematic of the N2 flooding experiment is shown in Figure 3. It mainly consisted of a N2 injection system, temperature control system, pressure control system, pressure transmitter and oil/gas collection system. An ISCO pump (Teledyne, Thousand Oaks, CA, USA, 100 DX, maximum flow rate of 60 mL/min, flow accuracy < 0.25 μL/min, maximum working pressure of 68 MPa, pressure accuracy of ± 0.5%) was used for the core-saturated formation of water and oil. A gas mass flow meter (Brooks, Hatfield, PA, USA, 5850 E, maximum flow rate of 50 mL/min, maximum working pressure of 15 MPa, maximum working pressure difference of 2 MPa, and accuracy of ±1% FS) was used for controlling N2 flow rate. Real-time recording of core inlet was performed using pressure by pressure sensors (3210 PD, maximum pressure of 5 MPa, accuracy of 0.1% FS). Real-time recording of oil production during the experiment was performed using a balance (PL3002, range 3100 g, graduation value 0.01 g). The pressure control system includes a backpressure valve and a hand pump, which are used to control the flow pressure and confining pressure at the outlet end of the core during the N2 injection process.

2.3. Experimental Procedure

The specific experimental steps are as follows: (1) clean the core with an ultrasonic device and dry it at 105 °C, and calculate the permeability and pore volume of the core; (2) the core is vacuumed and saturated with simulated formation water, and then placed in a displacement core holder to inject experimental oil into the core at a constant flow rate. The bound water saturation is established and aged for three days at formation temperature. The core parameters after experimental treatment are shown in Table 3. (3) Control the experimental temperature at a constant temperature of 70 °C, set a fixed back pressure of 2 MPa and start N2 flooding. Use a gas flow meter to inject N2 at a constant rate of 0.1 mL/min until the end of this group of experiments and adjust the core confining pressure in real time to maintain a constant difference (effective stress) of 2 MPa between the confining pressure and injection pressure. (4) During the N2 injection process, pressure sensors are used to record the changes in displacement pressure, a balance is used to measure the changes in oil production during the N2 displacement process and the drainage and gas collection method is used to measure the weight of water to reflect the changes in N2 production during the displacement process. (5) Repeat steps (2)–(4) for replacing cores with different permeability until all experiments are completed.

3. Results and Discussions

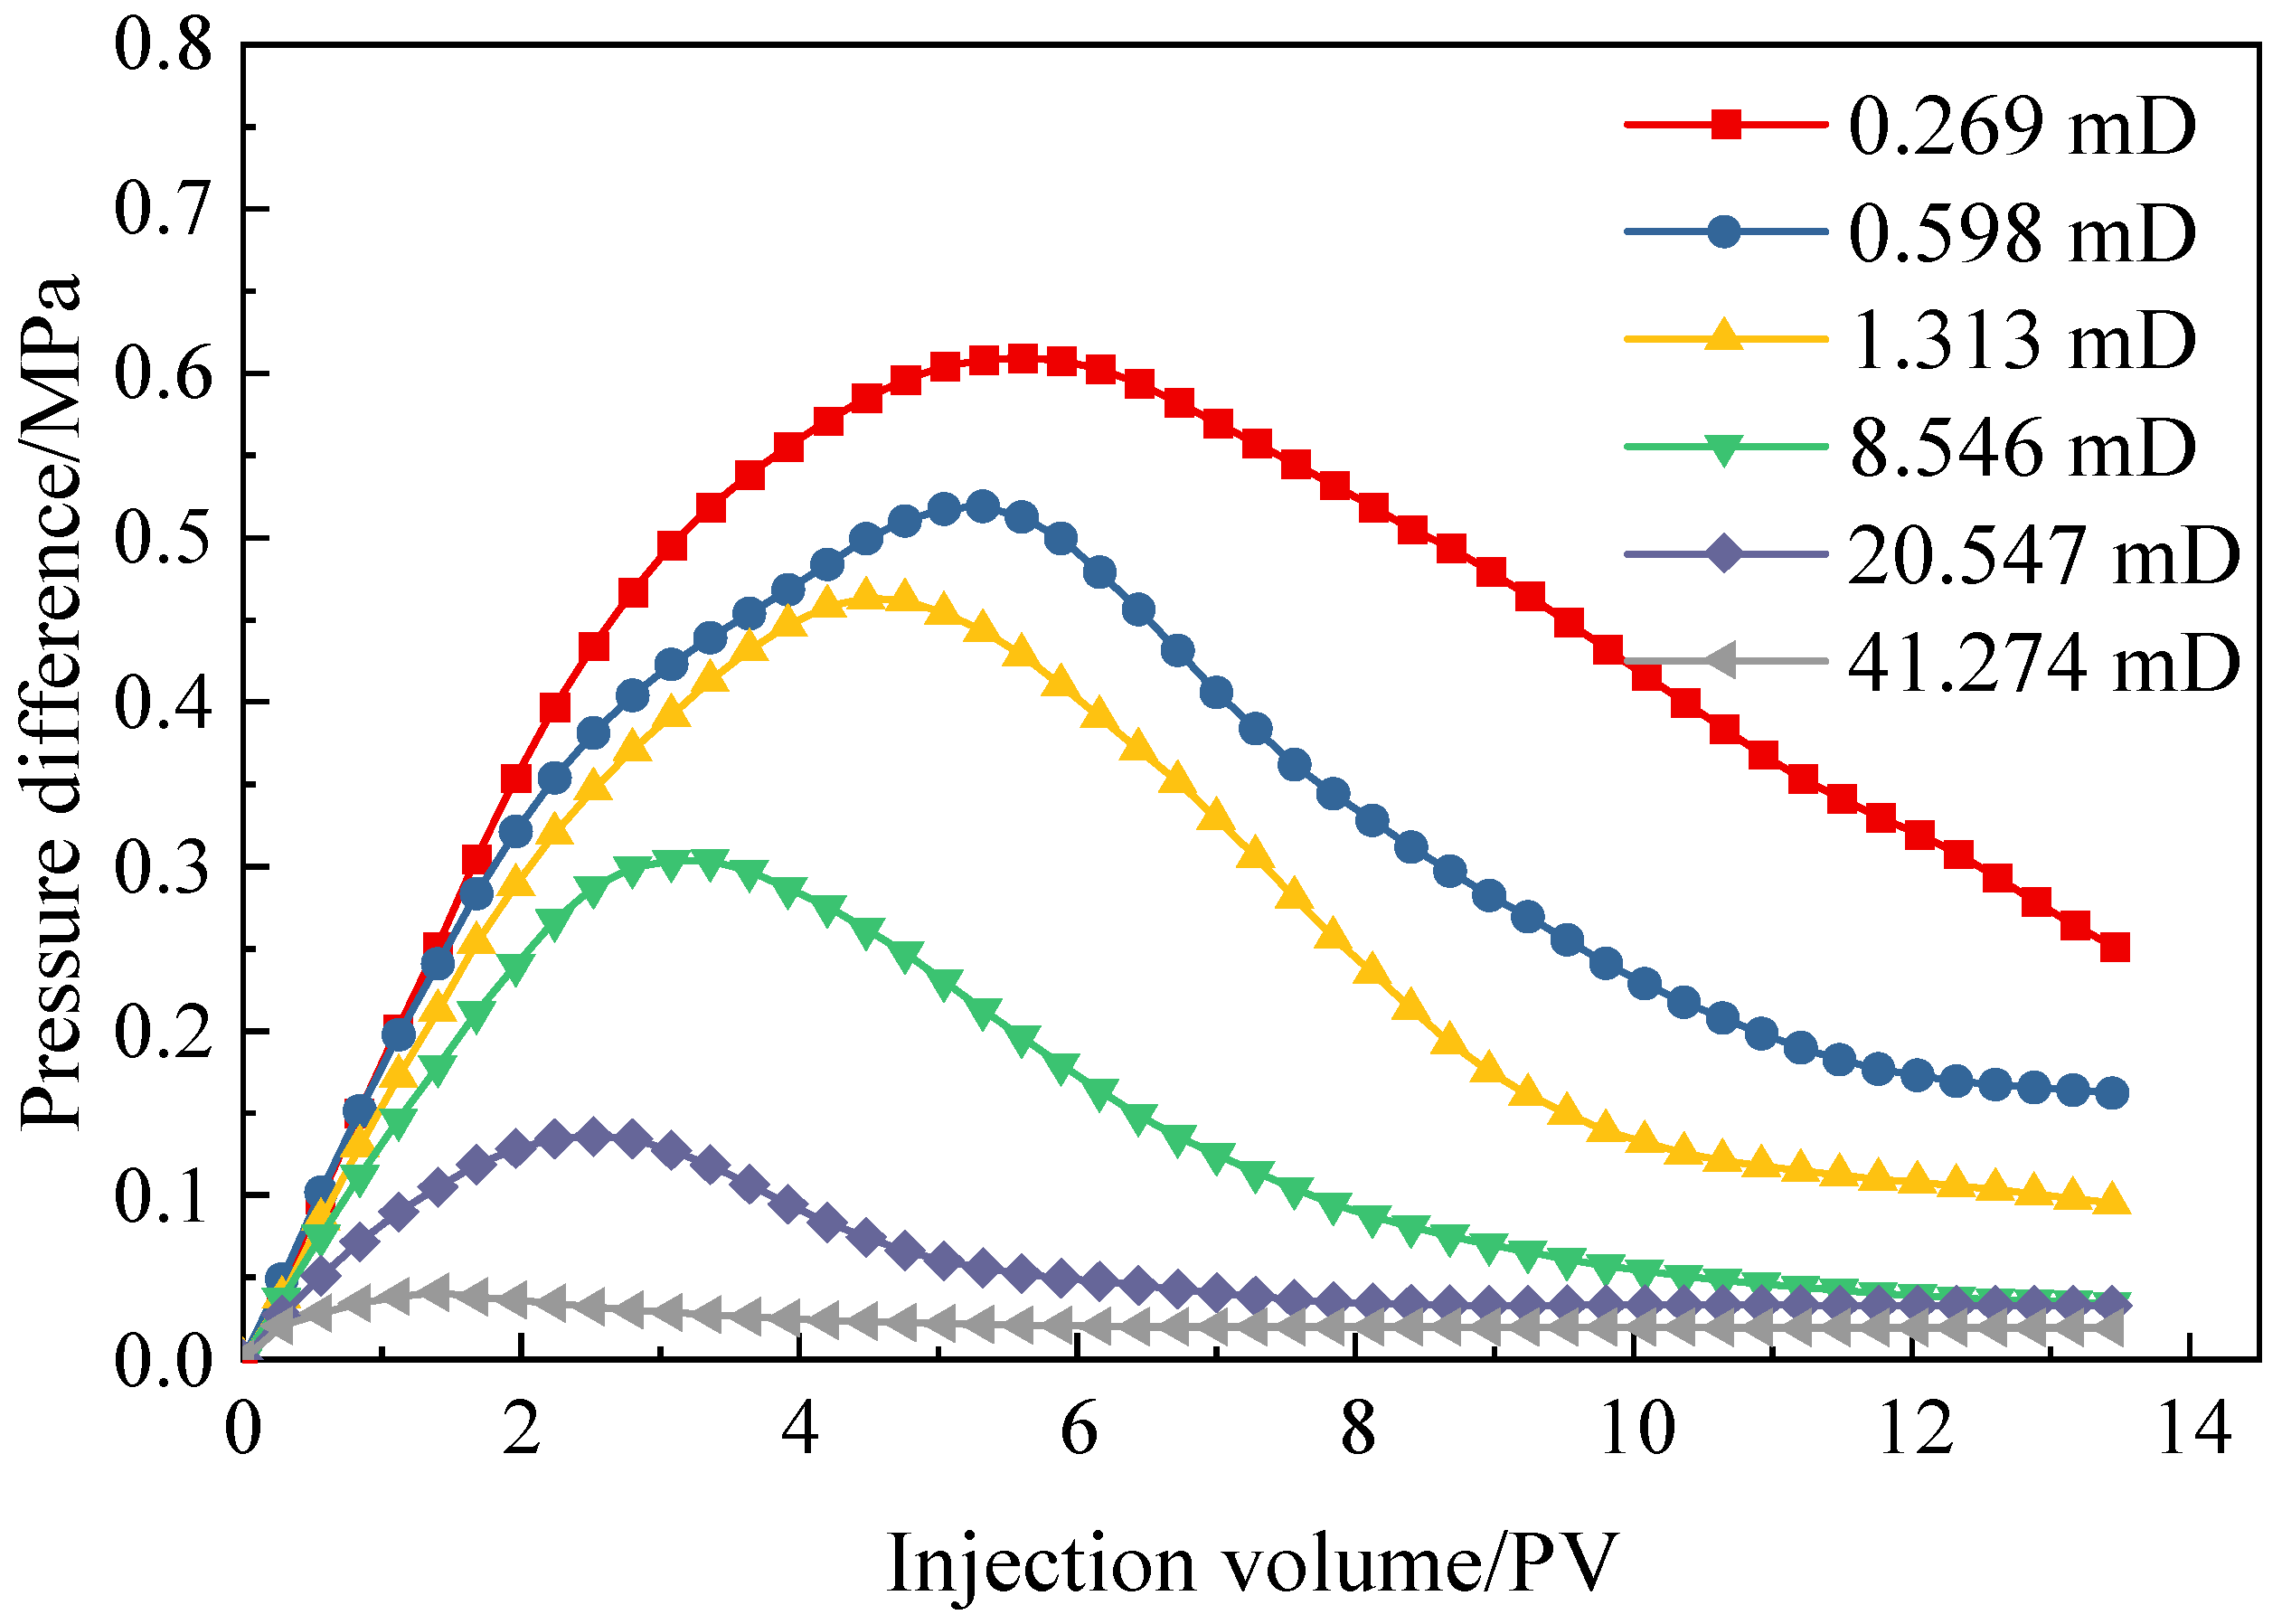
3.1. Pressure Difference Characteristics

Figure 4 shows the pressure difference curve changes during the N2 flooding of non-fracture low permeability cores with different matrix permeabilities. It can be seen from the figure that, as the matrix permeability increased, the capillary force decreased and the crude oil flow resistance decreased. At the same injection pore volume, the pressure difference significantly decreased. The maximum displacement pressure gradient under each matrix permeability, and the change in N2 injection volume when reaching the maximum pressure difference, are shown in Figure 5. As the permeability increased, the maximum displacement pressure gradient gradually decreased, and the corresponding N2 injection volume also continued to decrease. However, the relationship did not change linearly, and the decrease gradually slowed down as the matrix permeability increased. When the permeability of the core matrix was low, the maximum displacement pressure gradient changed relatively significantly. When the matrix permeability increased from 0.269 mD to 1.313 mD, the maximum displacement pressure gradient decreased from 6.18 MPa·m−1 to 4.80 MPa·m−1, a decrease of 22.3%, and the corresponding N2 injection volume decreased from 5.6 PV to 5.32 PV. When the matrix permeability was higher, the maximum displacement pressure gradient difference between each matrix permeability, and the difference in N2 injection amount when reaching the maximum value, decreased. Specifically, when the permeability of the core matrix increased from 8.546 mD to 41.274 mD, the maximum displacement pressure gradient decreased from 3.06 MPa·m−1 to 0.42 MPa·m−1, and the corresponding N2 injection volume decreased from 3.36 PV to 1.4 PV.

3.2. Oil and Gas Production Characteristics

Figure 6 shows the recovery changes of N2 flooding under different matrix permeability conditions. When the matrix permeability increased from 0.269 mD to 1.313 mD, the oil recovery increased from 23.29% to 32.74%. As the core permeability increased, the increase in recovery rate gradually decreased, achieving the highest crude oil recovery rate of 39.6% in the core with a matrix permeability of 41.274 mD. In addition, as the matrix permeability increased, the time of the commencement of product oil at the outlet of the core gradually advanced. This was mainly due to the slow oil breakthrough time at the outlet of the core due to the small pore throat and difficulty in gas injection when the permeability was low. As the permeability of the matrix increased, the average pore throat radius increased, the flow resistance of crude oil decreased and the starting pressure decreased, making it easier for N2 to displace oil from the matrix. However, at the same time, gas production was quickly monitored after oil production at the outlet and, with the continuous injection of N2, the gas production rate rapidly increased, resulting in a rapid slowdown in the growth of the recovery curve.
Figure 7 shows the relationship curve between the volume of gas produced in each group of experiments and the amount of N2 injected. In the N2 flooding experiments with matrix permeability less than 1 mD, the gas production rate was significantly lower than the injection rate when the gas first appeared at the outlet, and the gas production curve rose slowly. As the amount of N2 injection increased, the gas pressure continued to rise. When the gas formed a mainstream channel in the rock core, gas channeling occurred and the gas production rate significantly increased. After the gas channeling, the injection pressure began to decrease. Finally, the gas production rate gradually stabilized at the set injection rate of the gas body as the displacement pressure decreased. When the permeability range was greater than 1 mD, gas was more likely to flow in porous media. When it began to produce gas, the gas production rate was very close to the injection rate and the gas recovery curve was relatively stable.
To further analyze the laws of gas production and gas channeling, the time of gas breakthrough and gas channeling at the outlet of the core was statistically analyzed and plotted, as shown in Figure 8. From the graph, it can be seen that, as the permeability of the matrix increased, the timing of gas breakthrough and gas channeling both decreased and tended to slow down. In the core with a matrix permeability of 0.269 mD, the gas breakthrough time and gas channeling time were 3.57 PV and 6.56 PV, respectively. However, when the matrix permeability increased to 1.313 mD, the gas breakthrough time and gas breakthrough time were significantly shortened to 1.96 PV and 4.01 PV, respectively, showing a sharp downward trend in Figure 8. As the matrix permeability continued to increase, the decrease in the two time periods significantly slowed down. Finally, in the experiment with a matrix permeability of 41.274 mD, the gas breakthrough time and gas breakthrough time were 1.11 PV and 1.69 PV, respectively. In addition, it can be seen from the figure that the time interval from the beginning of gas breakthrough to the gas channeling gradually decreased with the increase in matrix permeability. In the 0.269 mD core, after bubbles began to appear at the core production end, the gas was channeled after injecting 2.99 PV N2. However, in the experiment with matrix permeability of 41.274 mD, this time interval was only 0.58 PV. These phenomena all indicate that, as the matrix increased, N2 was more prone to fingering and channeling along the large pores, leading to more obvious gas channeling phenomena.
Figure 9 shows the changes in gas production rate before and after gas channeling under different core permeability conditions. From the curve, it can be seen that, when the permeability was less than 1 mD, the gas production rate during gas channeling was high, and the difference in gas production rate gradually decreased with the increase in permeability. When the permeability was greater than 10 mD, there was no significant change in gas production rate when gas channeling occurred. When the permeability was 0.269 mD, the maximum difference of gas production rate was 0.167 mL/min before and after the gas channeling, which was significantly greater than the injection rate of 0.1 mL/min. When the core permeability increased to 41.274 mD, the gas production rate was relatively stable during the gas production process, and the formation time of the main gas flow channel was relatively early. The difference in gas production rate at the outlet was only 0.018 mL/min, which was basically the same as the injection rate.
Gas channeling also had a significant impact on the crude oil production at the core production end. Figure 10 shows the curves of the ultimate oil recovery, non-gas oil recovery and its proportion as a function of matrix permeability. From the graph, it can be seen that the non-gas oil recovery and its proportion increased with the increase in matrix permeability, and the trend of change was highly consistent with the trend of the ultimate recovery. Based on the previous analysis, it can be concluded that, in low permeability formation, the decrease in crude oil flow resistance caused by the increase in matrix permeability accounted for a higher proportion than the acceleration of injected gas channeling, which led to an increase in the non-gas oil recovery, even though the gas breakthrough was gradually advanced, thereby improving the ultimate oil recovery. Interestingly, combined with Figure 8, Figure 9 and Figure 10, it can be observed that the trend of each curve shows a similar pattern, with a rapid mutation from around 0.1 mD to 1 mD, and a more gradual trend in the subsequent stages of higher permeability. Through power function fitting analysis, it was found that the matrix permeability corresponding to the turning point is approximately 2 mD. Based on this, the studied permeability range can be divided into two parts, with areas less than 2 mD being permeability sensitive areas and areas greater than 2 mD being permeability insensitive areas. This indicates that, in the implementation of gas injection development technology for super-low or ultra-low permeability reservoirs, the heterogeneity of reservoir permeability is more worthy of attention, which will have a significant impact on the implementation effect of the technology. However, in the development of general low permeability reservoirs, the difference in permeability between regions will not be the main factor affecting the development effect.

3.3. Effect of Fracture on Production Characteristics

Figure 11 shows the oil and gas recovery curves of three fractured low-permeability cores. It can be seen from the figure that, due to the existence of the main channel of the fracture, the gas production rate at the outlet of the core was fast, and the gas production rate was basically the same as the injection rate. This also led to a delay in the oil production time compared to the non-fracture cores. In addition, due to the rapid formation of gas channeling, the increase in oil recovery almost only occurred in the first 2 PV, and the continuous injection of N2 in the subsequent process only brought less than a 5% increase in oil recovery. However, by observing the gas production curve (Figure 11b), it can be seen that the influence of matrix permeability changes on gas production patterns in fractured cores was different from that in non-fracture cores. At the same injection volume, the gas production rate in fractured cores with high matrix permeability was lower than that in cores with low matrix permeability. At the same time, the gas breakthrough time and gas channeling time in fractured cores showed a delayed change pattern as the matrix permeability increased, which is exactly the opposite of that in non-fracture cores (Figure 12). Analysis suggests that the presence of fracture transforms low-permeability cores into strongly heterogeneous systems, and the degree of heterogeneity in this system increases with the decrease in matrix permeability. Injecting N2 gas mainly flows along fractures with high conductivity, and its ability to enter the matrix and produce crude oil is closely related to the matrix permeability. The higher the matrix permeability, the easier it is for injected gas to enter the matrix. This results in a larger gas sweep range in fractured cores with high matrix permeability, which is also the main reason for delayed gas channeling and increased recovery rate.
Figure 13 shows the comparison between the oil recovery of fractured and non-fracture cores. The permeability of fractures was three orders of magnitude higher than that of low-permeability matrices. The existence of fractures created a dominant mainstream channel in the core, which formed a strong heterogeneous system between fractures and low-permeability matrices. Injected gas flowed strongly along the fractures, resulting in a limited coverage of crude oil in the matrix and a significant decrease in oil recovery compared to non-fractured cores. But the proportion of oil recovery decreased with the increase in matrix permeability, indicating that high matrix permeability is beneficial for alleviating the adverse impact of fractures on gas channeling and oil recovery.

4. Conclusions

(1)
In a low permeability core without fractures, the higher the matrix permeability, the lower the pressure difference and the smaller the amount of N2 injection required to achieve the highest injection pressure. The decrease gradually slows down as the matrix permeability increases. At the same time, the increase in matrix permeability accelerates the formation of gas breakthrough and gas channeling but, benefiting from the decrease in crude oil flow resistance, the non-gas oil recovery still shows an increasing trend and the ultimate recovery rate also improves.
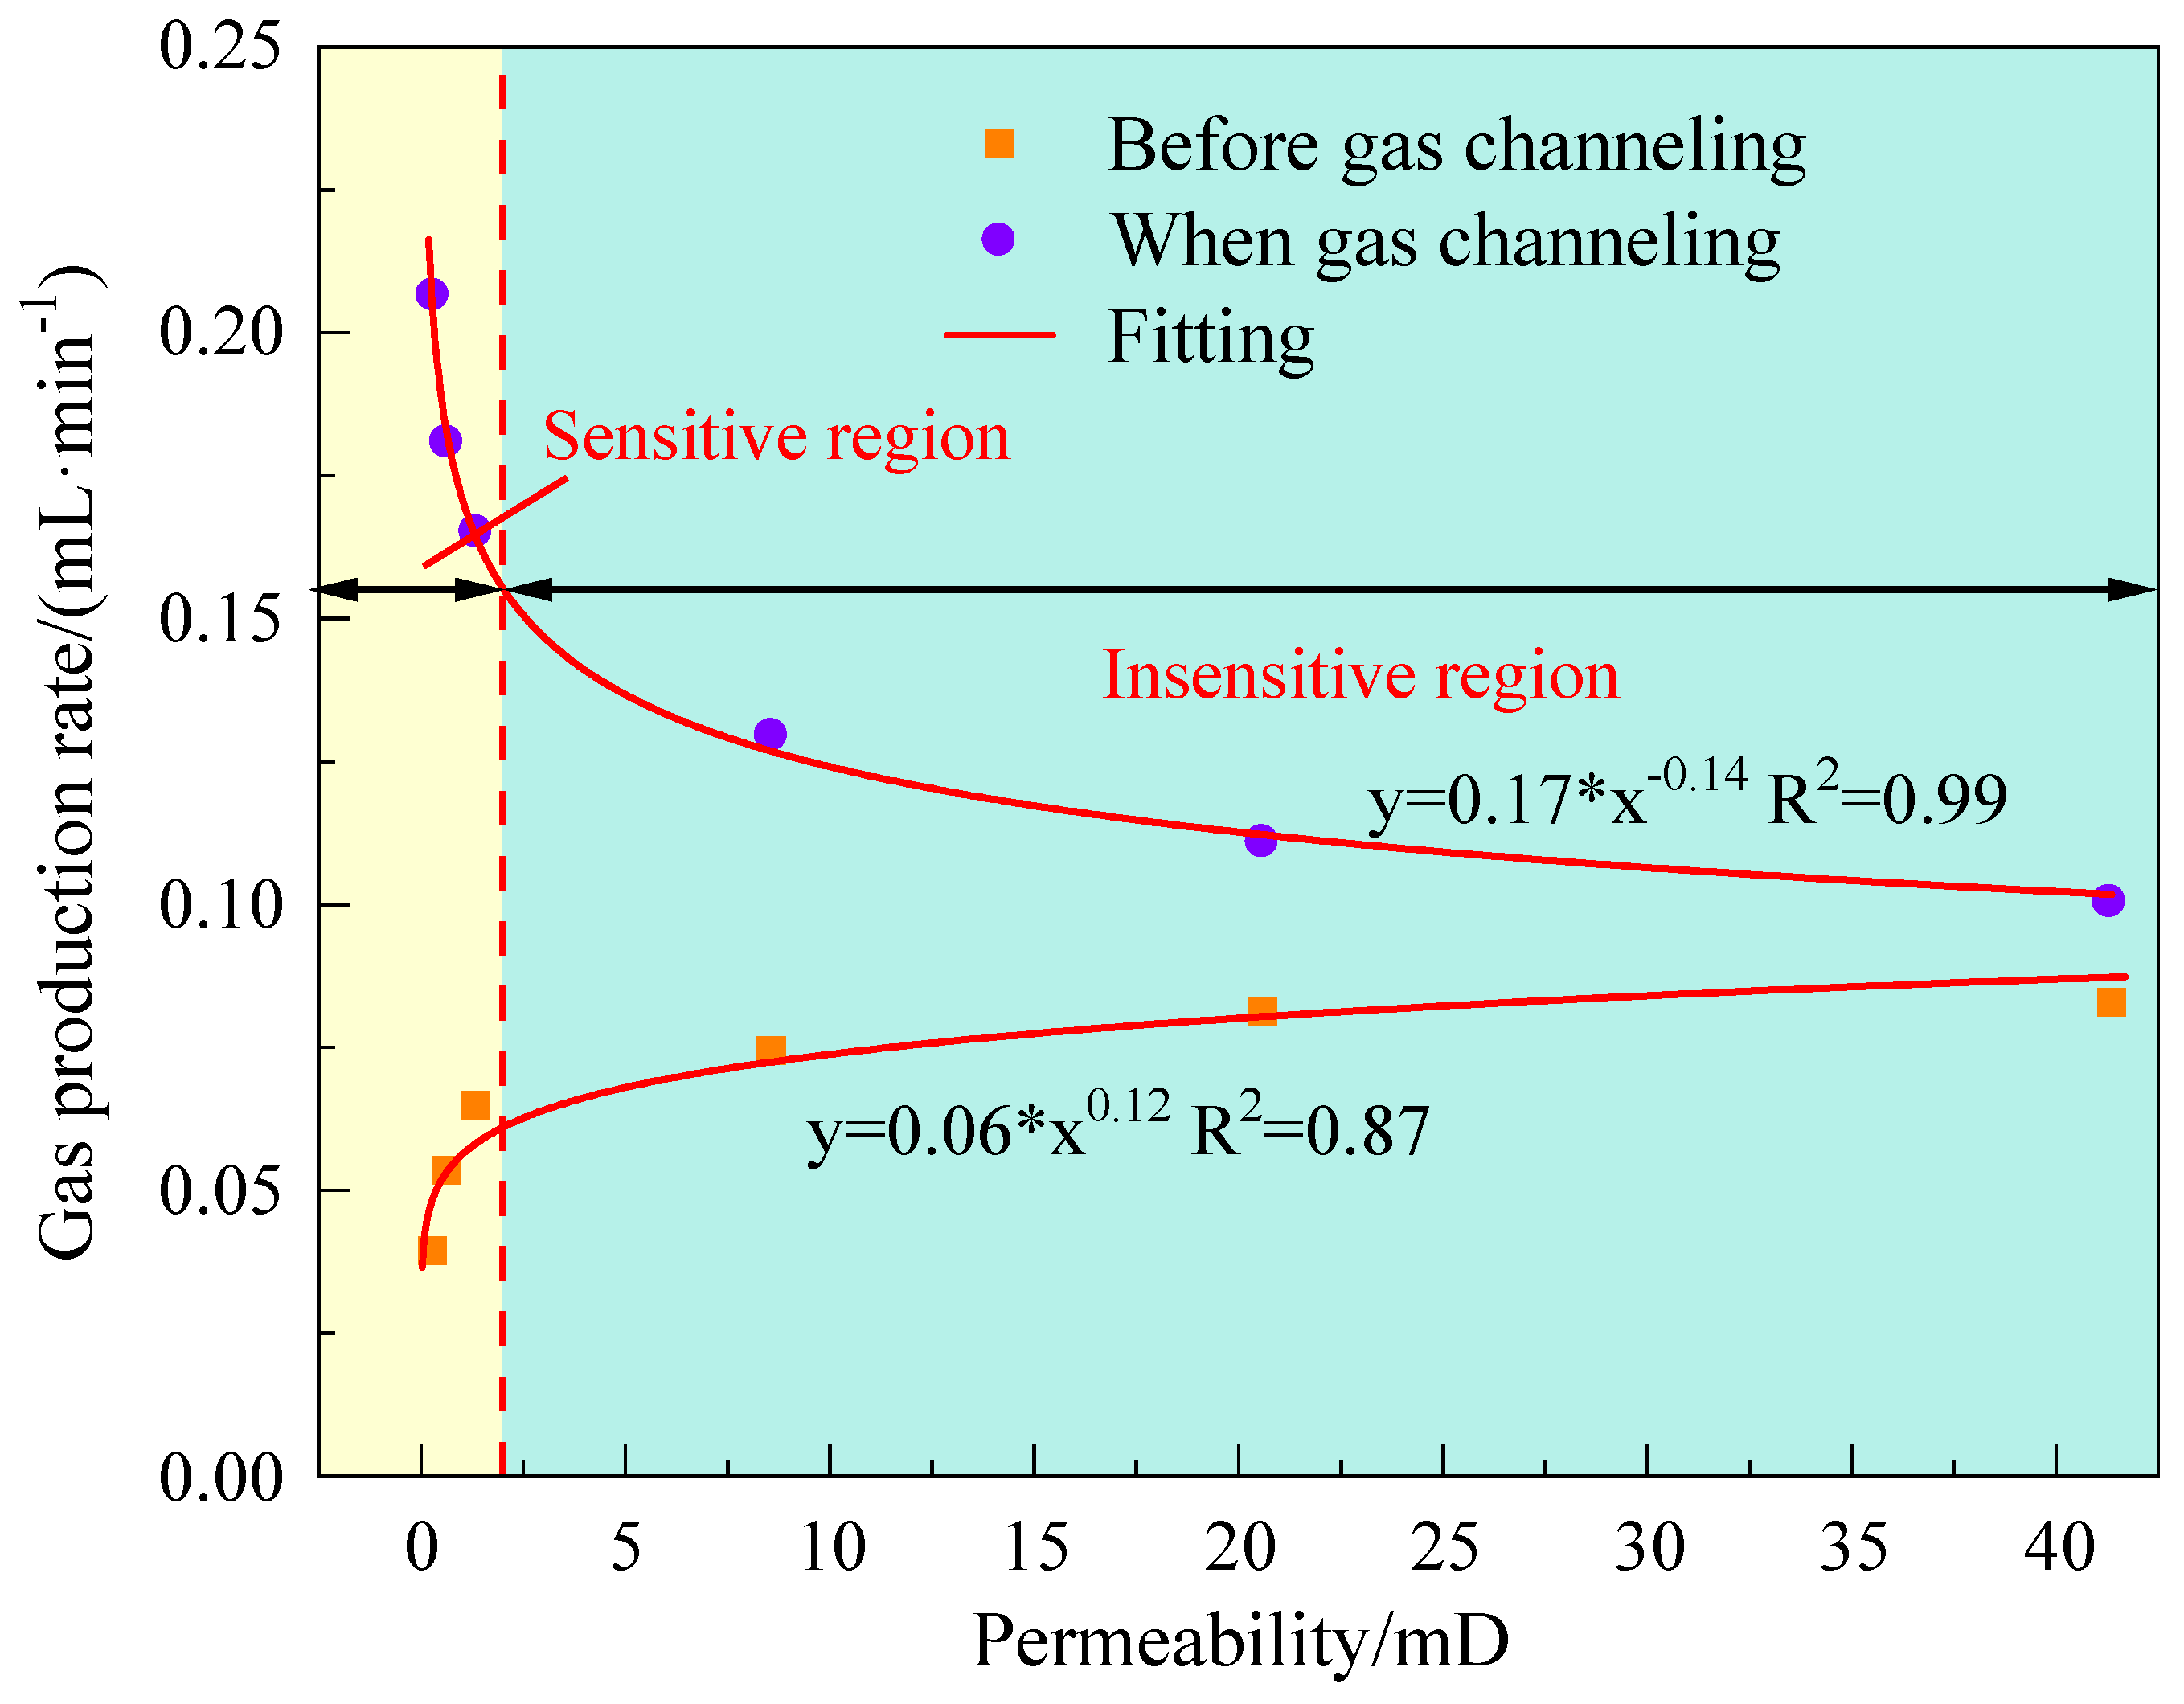
(2)
There are significant differences in the variation patterns of various production characteristics before and after the matrix permeability of 2 mD in low permeability matrixes. When the matrix permeability is less than 2 mD, the characteristics of oil and gas production are significantly affected by changes in matrix permeability. When the matrix permeability is greater than 2 mD, the impact of changes in matrix permeability on development effectiveness is weakened. This indicates that, in the development of reservoirs with ultra-low matrix permeability, the corresponding development methods and injection parameters should be adjusted to achieve better development results.
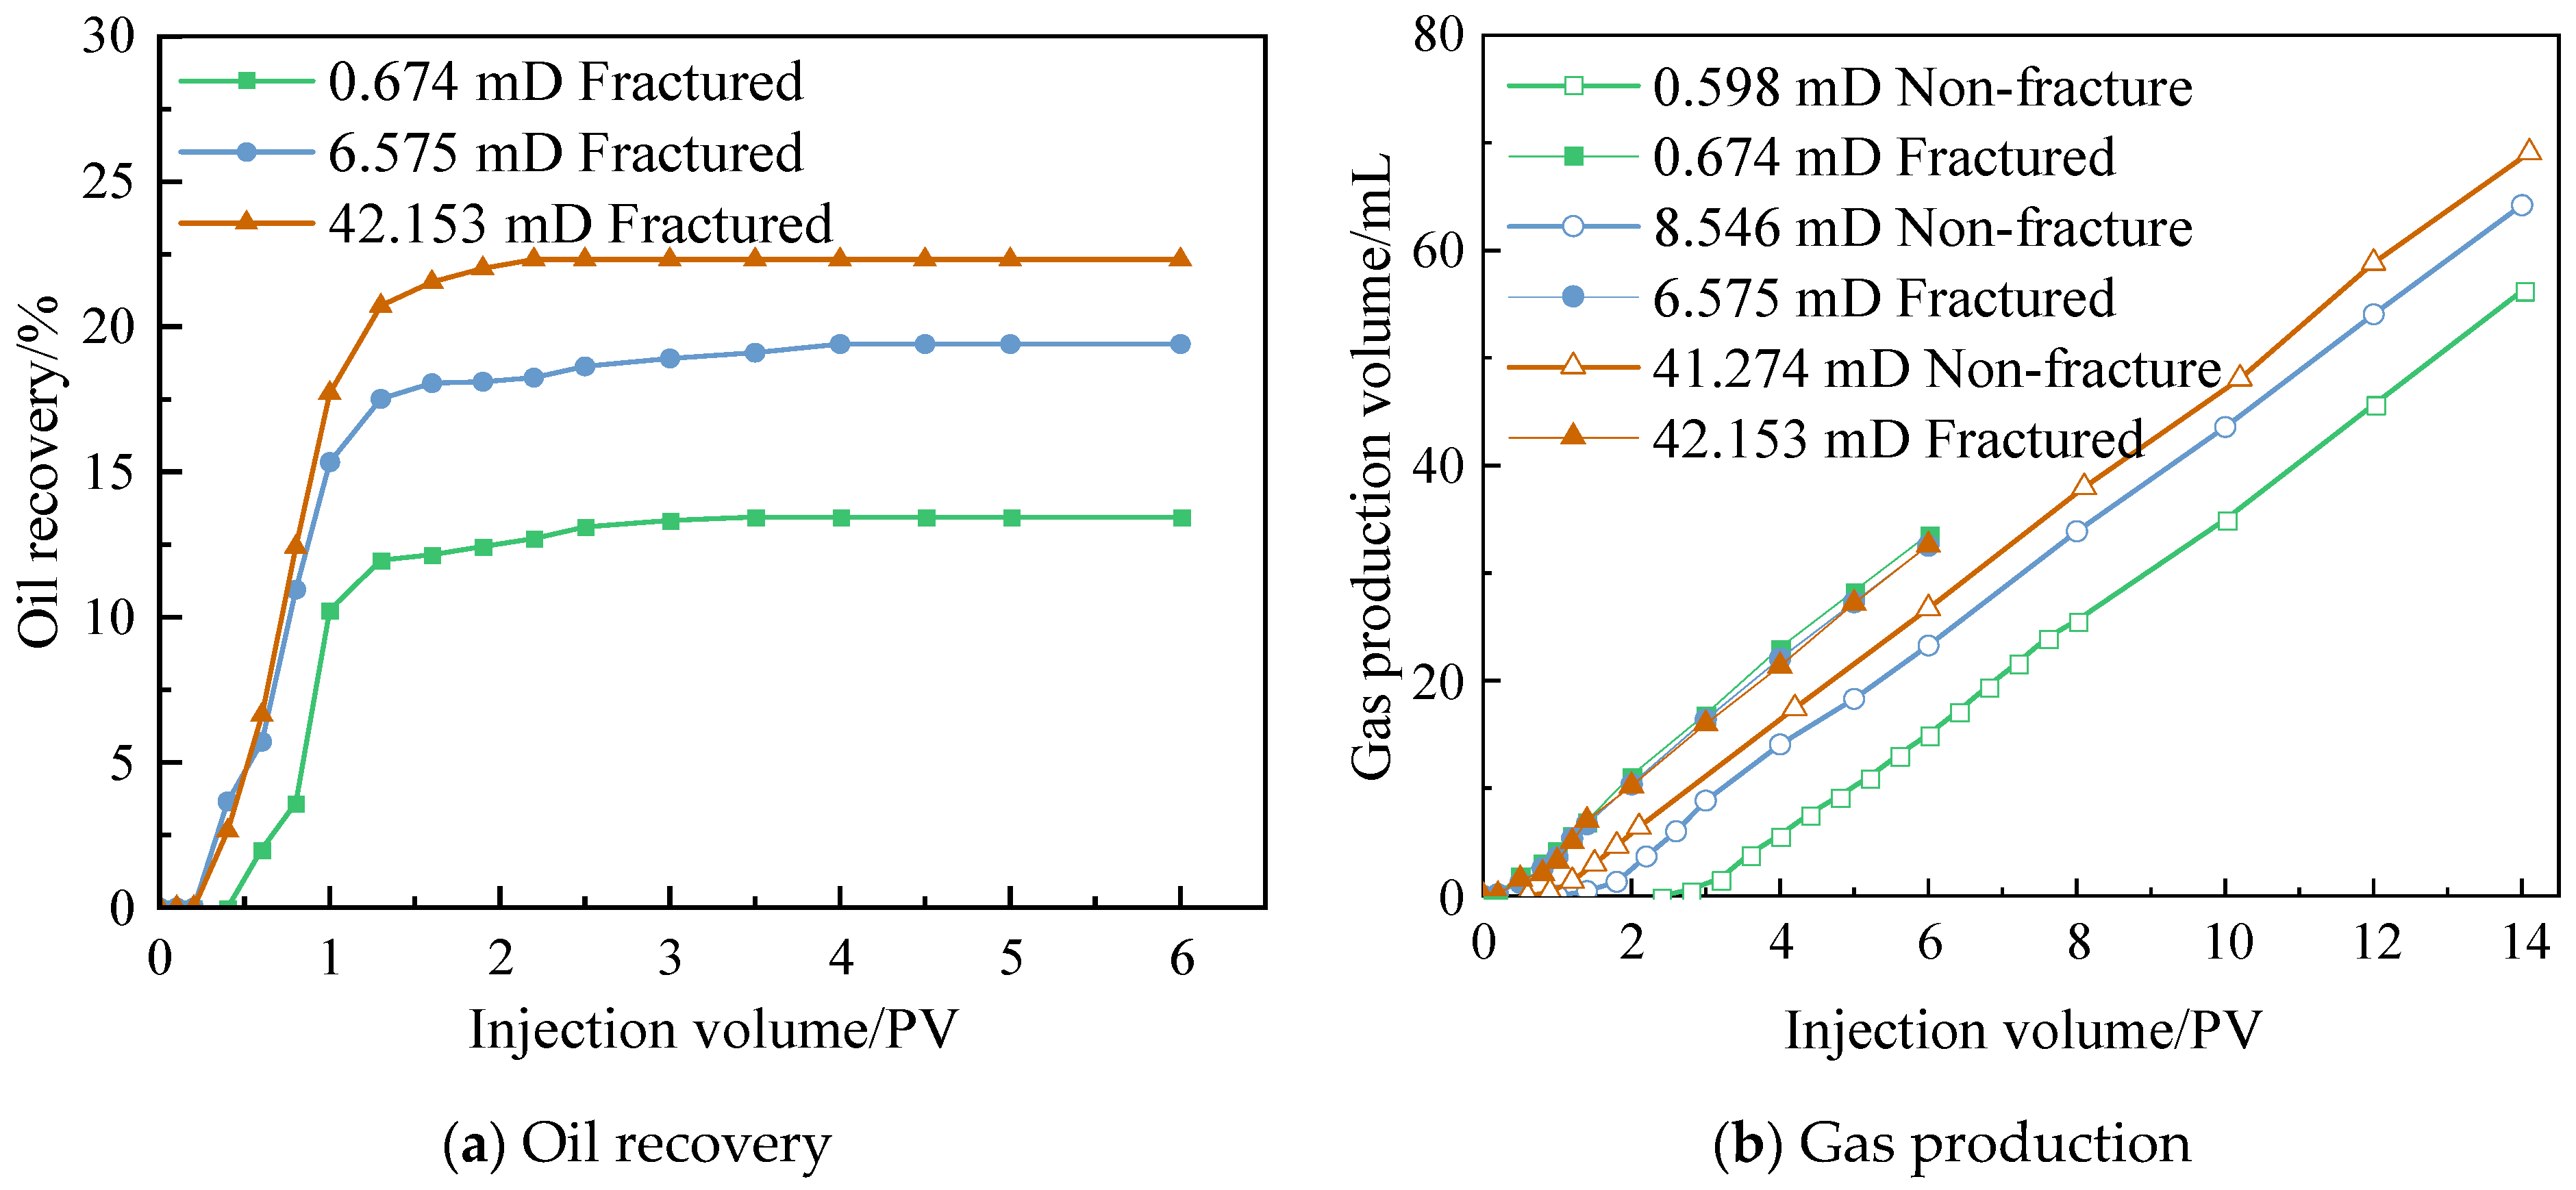
(3)
The huge difference in conductivity between fractures and low-permeability matrixes makes the fractured low-permeability core a strong heterogeneous system, greatly exacerbating the gas breakthrough and channeling and significantly reducing the utilization of matrix crude oil. The oil recovery of fractured cores has decreased by about 50% compared to non-fractured cores. But the increase in matrix permeability is beneficial for weakening the heterogeneity between fractures and matrixes, alleviating the gas channeling and thereby increasing the swept volume of N2 gas in the matrix and improving the crude oil recovery rate.

Author Contributions

Conceptualization, B.L.; Methodology, B.L.; Software, K.A. and H.L. (Haifeng Li); Validation, Y.L.; Investigation, R.W. and H.L. (Haibo Li); Data curation, Y.L., H.L. (Haibo Li), L.Z. and H.L. (Haifeng Li); Writing—original draft, R.W., K.A. and L.Z.; Writing—review & editing, R.W.; Visualization, R.W.; Supervision, B.L. All authors have read and agreed to the published version of the manuscript.

Funding

This research was funded by PetroChina Xinjiang Oilfield Company project “Study on the mechanism of gravity flooding and storage using gas produced by fire flooding”.

Data Availability Statement

All data used to support the findings of this study are included within the article.

Acknowledgments

The study was supported by the Xinjiang Oilfield Company project “Study on the mechanism of gravity flooding and storage using gas produced by fire flooding”. We sincerely appreciate the researchers from the Shandong Engineering Research Center of CO2 Utilization and Storage, and the Shandong Provincial Key Laboratory of Heavy Oil Recovery Technology, for their assistance in this study.

Conflicts of Interest

The authors declare no conflict of interest.

References

  1. Kang, W.L.; Zhou, B.B.; Issakhov, M.; Gabdullin, M. Advances in enhanced oil recovery technologies for low permeability reservoirs. Pet. Sci. 2022, 19, 1622–1640. [Google Scholar] [CrossRef]
  2. Li, Y. Technical advancement and prospect for CO2 flooding enhanced oil recovery in low permeability reservoirs. Pet. Geol. Recovery Effic. 2020, 27, 1–10. [Google Scholar]
  3. Shanley, K.W.; Cluff, R.M.; Robinson, J.W. Factors controlling prolific gas production from low-permeability sandstone reservoirs: Implications for resource assessment, prospect development, and risk analysis. AAPG Bull. 2004, 88, 1083–1121. [Google Scholar] [CrossRef] [Green Version]
  4. Sander, R.; Pan, Z.J.; Connell, L.D. Laboratory measurement of low permeability unconventional gas reservoir rocks: A review of experimental methods. J. Nat. Gas Sci. Eng. 2018, 37, 248–279. [Google Scholar] [CrossRef]
  5. Wang, Z.J.; Li, S.Y.; Li, Z.M. A novel strategy to reduce carbon emissions of heavy oil thermal recovery: Condensation heat transfer performance of flue gas-assisted steam flooding. Appl. Therm. Eng. 2022, 205, 118076. [Google Scholar] [CrossRef]
  6. Wang, Z.J.; Li, S.Y.; Jin, Z.J.; Li, Z.M.; Liu, Q.Y.; Zhang, K.Q. Oil and gas pathway to net-zero: Review and outlook. Energy Strategy Rev. 2023, 45, 101048. [Google Scholar] [CrossRef]
  7. Chen, H.; Liu, X.L.; Sun, L.H.; Yang, R.; Yang, S.L. Experimental study on dynamic characteristics of low temperature oxidation for Bohai offshore light oil under reservoir conditions. Fuel 2021, 283, 119282. [Google Scholar] [CrossRef]
  8. Chen, H.; Qing, S.; Ye, Z.B.; Han, L.J.; Wang, X.; Xu, L.; Liu, Z.K. Experimental investigation of hydrophobically modified α-zrp nanosheets for enhancing oil recovery in low-permeability sandstone cores. ACS Omega 2019, 4, 22178–22186. [Google Scholar] [CrossRef] [Green Version]
  9. Chen, Z.; Su, Y.L.; Li, L.; Meng, F.K.; Zhou, X.M. Characteristics and mechanisms of supercritical CO2 flooding under different factors in low-permeability reservoirs. Pet. Sci. 2022, 19, 1174–1184. [Google Scholar] [CrossRef]
  10. Cong, L.; Li, W.L.; Lei, J.C.; Li, R.B. The current situation and prospects of development of low permeability oil reservoir. Adv. Mater. Res. 2013, 734–737, 1286–1289. [Google Scholar] [CrossRef]
  11. Wang, Z.J.; Li, S.Y.; Li, S.P.; Zhu, J.Z.; Yang, H. Molecular dynamics simulation of the synergistic effect of a compound surfactant on the stability of CO2 oil-based foam. AICHE J. 2023, e18150. [Google Scholar] [CrossRef]
  12. Ding, M.; Li, Q.; Yuan, Y.; Wang, Y.; Zhao, N.; Han, Y. Permeability and heterogeneity adaptability of surfactant-alternating-gas foam for recovering oil from low-permeability reservoirs. Pet. Sci. 2022, 19, 1185–1197. [Google Scholar] [CrossRef]
  13. Ezekiel, J.; Ren, S.R.; Zhang, L.; Wang, Y.T.; Liu, Y.M.; Deng, J.Y.; Wang, G.B. Displacement mechanisms of air injection for IOR in low permeability light oil reservoirs. Int. J. Oil Gas Coal Technol. 2017, 16, 1–26. [Google Scholar] [CrossRef]
  14. Fraim, M.L.; Moffitt, P.D.; Yannimaras, D.V. Laboratory testing and simulation results for high pressure air injection in a waterflooded North Sea oil reservoir. In Proceedings of the SPE Annual Technical Conference and Exhibition, San Antonio, TX, USA, 5–8 October 1997. [Google Scholar]
  15. Hendraningrat, L.; Li, S.; Torsaeter, O. Enhancing oil recovery of low-permeability berea sandstone through optimized nanofluids concentration. In Proceedings of the SPE Enhanced Oil Recovery Conference, Kuala Lumpur, Malaysia, 2–4 July 2013. [Google Scholar]
  16. Kang, W.; Zhao, H.; Shao, S.; Zhang, X.; Zhu, T.; Yang, H. Surfactant combination for improving the imbibition recovery of ultra-low permeability reservoir. Oilfield Chem. 2019, 36, 124–132. [Google Scholar]
  17. Wang, Z.J.; Li, S.Y.; Peng, D.L.; Cheng, H.; Wei, Y.H. The effect of interfacial tension on CO2 oil-based foam stability under different temperatures and pressures. Fuel 2023, 341, 127755. [Google Scholar] [CrossRef]
  18. Qu, M.; Liang, T.; Hou, J.R. Study on Fluid Behaviors of Foam-Assisted Nitrogen Flooding on a Three-Dimensional Visualized Fracture-Vuggy Model. Appl. Sci. 2021, 11, 11082. [Google Scholar] [CrossRef]
  19. Xiong, C.M.; Li, S.J.; Ding, B.; Geng, X.F.; Zhang, J.; Yan, Y.G. Molecular insight into the oil displacement mechanism of gas flooding in deep oil reservoir. Chem. Phys. Lett. 2021, 783, 139044. [Google Scholar] [CrossRef]
  20. Mohammed, N.; Abbas, A.J.; Enyi, G.C. Investigating the flow behaviour of CO2 and N2 in porous medium using core flooding experiment. J. Pet. Sci. Eng. 2022, 208, 109753. [Google Scholar] [CrossRef]
  21. Bayat, M.; Lashkarbolooki, M.; Hezave, A.Z.; Ayatollahi, S. Investigation of gas injection flooding performance as enhanced oil recovery method. J. Nat. Gas Sci. Eng. 2016, 29, 37–45. [Google Scholar] [CrossRef]
  22. Wang, Z.J.; Du, H.W.; Li, S.Y.; Li, S.P. Experimental study on gas-assisted cyclic steam stimulation under heavy-oil sandstone reservoir conditions: Effect of N2/CO2 ratio and foaming agent. Geoenergy Sci. Eng. 2023, 228, 211976. [Google Scholar] [CrossRef]
  23. Zhang, L. Progress and research direction of EOR technology in eastern mature oilfields of Sinopec. Oil Gas Geol. 2022, 43, 717–723. [Google Scholar]
  24. Liu, X.L.; He, W.D.; Ge, J.J.; Zhang, G.C.; Jiang, P. Progress of research and application of EOR technologies in carbonate reservoirs. Appl. Chem. Ind. 2012, 41, 1236–1241. [Google Scholar]
  25. Zhou, X.; Wang, Y.; Zhang, L.; Zhang, K.; Jiang, Q.; Pu, H.; Wang, L.; Yuan, Q. Evaluation of enhanced oil recovery potential using gas/water flooding in a tight oil reservoir. Fuel 2020, 272, 117706. [Google Scholar] [CrossRef]
  26. Wei, B.; Zhang, X.; Wu, R.N.; Zou, P.; Gao, K.; Xu, X.G.; Pu, W.F.; Wood, C. Pore-scale monitoring of CO2 and N2 flooding processes in a tight formation under reservoir conditions using nuclear magnetic resonance (NMR): A case study. Fuel 2019, 246, 34–41. [Google Scholar] [CrossRef]
  27. Kong, D.; Lian, P.; Zheng, R.; Li, Y. Performance demonstration of gas-assisted gravity drainage in a heterogeneous reservoir using a 3D scaled model. RSC Adv. 2021, 49, 30610–30622. [Google Scholar] [CrossRef]
  28. Shi, J.Q.; Durucan, S.; Fujioka, M. A reservoir simulation study of CO2 injection and N2 flooding at the Ishikari coalfield CO2 storage pilot project, Japan. Int. J. Greenh. Gas Control 2008, 1, 47–57. [Google Scholar] [CrossRef]
  29. Wu, S.; Li, Z.; Wang, Z.; Sarma, H.K.; Zhang, C.; Wu, M. Investigation of CO2/N2 injection in tight oil reservoirs with confinement effect. Energy Sci. Eng. 2020, 8, 1194–1208. [Google Scholar] [CrossRef] [Green Version]
  30. Rezaei, M.; Shadizadeh, S.; Vosoughi, M.; Kharrat, R. An experimental investigation of sequential CO2 and N2 gas injection as a new EOR method. Energy Sources Part A Recovery Util. Environ. Eff. 2014, 34, 1938–1948. [Google Scholar] [CrossRef]
  31. Wang, H.; Liao, X.; Ding, H. Monitoring and evaluating the volume fracturing effect of horizontal well. J. Nat. Gas Sci. Eng. 2015, 22, 498–502. [Google Scholar] [CrossRef]
  32. Du, D.; Li, C.; Song, X.; Liu, Q.; Ma, N.; Wang, X.; Shen, Y.; Li, Y. Experimental study on residue oil distribution after the supercritical CO2 huff-n-puff process in low permeability cores with Nuclear Magnetic Resonance (NMR). Arabian J. Chem. 2021, 14, 103355. [Google Scholar] [CrossRef]
  33. Wang, L.; Yu, W. Mechanistic simulation study of gas puff and huff process for bakken tight oil fractured reservoir. Fuel 2019, 239, 1179–1193. [Google Scholar] [CrossRef]
  34. Tang, M.; Zhang, T.; Ma, Y.K.; Hao, D.Y.; Yang, X.; Li, Y.F. Experimental study on fracture effect on the multiphase flow in ultra-low permeability sandstone based on LF-NMR. Geoenergy Sci. Eng. 2023, 222, 211399. [Google Scholar] [CrossRef]
  35. Zhang, T.; Tang, M.; Ma, Y.K.; Zhu, G.P.; Zhang, Q.H.; Wu, J.; Xie, Z.Z. Experimental study on CO2/Water flooding mechanism and oil recovery in ultralow-Permeability sandstone with online LF-NMR. Energy 2022, 252, 123948. [Google Scholar] [CrossRef]
  36. Xu, J.Z.; Wu, K.L.; Li, Z.D.; Li, J.; Xu, Q.L.; Li, L.K.; Chen, Z.X. Nanoscale pore size distribution effects on gas production from fractal shale rocks. Fractals-Complex Geom. Patterns Scaling Nat. Soc. 2019, 27, 1950142. [Google Scholar] [CrossRef]
  37. Tang, Y.; Hou, C.X.; He, Y.W.; Tang, J.H.; Wang, Y.; Qin, J.Z. Microscopic flow characteristics of immiscible CO2 flooding and CO2 foam flooding after water flooding in fractured porous media: A visual investigation. Transp. Porous Media 2023. [Google Scholar] [CrossRef]
  38. Er, V.; Babadagli, T.; Xu, Z.H. Pore-scale investigation of the matrix−fracture interaction during CO2 injection in naturally fractured oil reservoirs. Energy Fuels 2010, 24, 1421–1430. [Google Scholar] [CrossRef]
  39. Cui, M.; Wang, R.; Lv, C.; Tang, Y. Research on microscopic oil displacement mechanism of CO2 EOR in extra-high water cut reservoirs. J. Pet. Sci. Eng. 2017, 154, 315–321. [Google Scholar] [CrossRef]
  40. Duan, X.G.; Hou, J.R.; Zhao, F.L.; Ma, Y.F.; Zhang, Z.X. Determination and controlling of gas channel in CO2 immiscible flooding. J. Energy Inst. 2016, 89, 12–20. [Google Scholar] [CrossRef]
  41. Qu, M.; Hou, J.R.; Wen, Y.C.; Liang, T. Nitrogen gas channeling characteristics in fracture-vuggy carbonate reservoirs. J. Pet. Sci. Eng. 2020, 186, 106723. [Google Scholar] [CrossRef]
  42. Luo, J.; Wang, L. Research on gas channeling identification method for gas injection development in high-pressure heterogeneous reservoir. Processes 2022, 10, 2366. [Google Scholar] [CrossRef]
  43. Ma, N.H.; Li, C.F.; Wang, F.; Liu, Z.W.; Zhang, Y.; Jiang, L.M.; Shu, Y.; Du, D.X. Laboratory study on the oil displacement process in low-permeability cores with different injection fluids. ACS Omega 2022, 7, 8013–8022. [Google Scholar] [CrossRef] [PubMed]
Figure 1. Viscosity–temperature curve of oil sample.
Processes 11 02112 g001
Figure 2. Side image of fractured core.
Processes 11 02112 g002
Figure 3. Flow chart of the N2 flooding experiment device.
Processes 11 02112 g003
Figure 4. Injection pressure variation in different matrix permeability cores during N2 flooding.
Processes 11 02112 g004
Figure 5. The variation of maximum displacement pressure gradient and corresponding injection volume with matrix permeability.
Processes 11 02112 g005
Figure 6. Oil recovery change in N2 flooding in different matrix permeability cores.
Processes 11 02112 g006
Figure 7. Curve of gas production in different matrix permeabilities.
Processes 11 02112 g007
Figure 8. Changes in gas breakthrough point and gas channeling point in different matrix permeabilities.
Processes 11 02112 g008
Figure 9. Gas production rate before and after gas channeling with different permeability.
Processes 11 02112 g009
Figure 10. Non-gas oil recovery and its proportion in different matrix permeabilities.
Processes 11 02112 g010
Figure 11. Oil recovery and gas production curve in fractured cores.
Processes 11 02112 g011
Figure 12. Gas breakthrough point and gas channeling point in fractured cores.
Processes 11 02112 g012
Figure 13. Comparison of oil recovery with and without fracture.
Processes 11 02112 g013
Table 1. Properties of experimental oil.
Density (kg·m−3)Saturated Hydrocarbon (%)Aromatic Hydrocarbon (%)Colloid Content (%)Asphaltene Content (%)
79263.3526.695.753.68
Table 2. Mineral components.
Quartz/wt%Feldspar/wt%Plagioclase/wt%Calcite/wt%Others/wt%
62.422.510.62.32.2
Table 3. Physical parameters of natural cores.
Core NumberLength
/cm
Diameter
/cm
Permeability
/mD
Porosity
/%
Saturated Oil
/mL
Fracture Condition
1 9.862.5050.2698.513.11Non-fracture
2 9.872.5050.5989.633.04Non-fracture
3 9.652.5031.3139.872.92Non-fracture
4 9.932.5088.5469.643.35Non-fracture
5 9.672.50520.54710.323.74Non-fracture
6 9.792.50241.27410.373.86Non-fracture
7 9.782.5050.6749.453.45Fractured
8 9.872.5056.5759.713.71Fractured
9 9.942.50442.15310.893.98Fractured
Disclaimer/Publisher’s Note: The statements, opinions and data contained in all publications are solely those of the individual author(s) and contributor(s) and not of MDPI and/or the editor(s). MDPI and/or the editor(s) disclaim responsibility for any injury to people or property resulting from any ideas, methods, instructions or products referred to in the content.

