Article

Effect of Freeze–Thaw Cycles on Physicochemical and Functional Properties of Ginger Starch

1
Department of Food Sciences, National Chiayi University, Chiayi City 600355, Taiwan
2
Department of Food Nutrition, Chung Hwa University of Medical Technology, Tainan City 71703, Taiwan
*
Author to whom correspondence should be addressed.
Processes 2023, 11(6), 1828; https://doi.org/10.3390/pr11061828
Submission received: 5 April 2023 / Revised: 2 June 2023 / Accepted: 13 June 2023 / Published: 15 June 2023

Abstract

:
Ginger (Zingiber officinale Roscoe.) starch is a waste product generated during the extraction of bioactive compounds from ginger. This study aimed to treat ginger starch with different freeze–thaw cycles and explore the effect on the functional components, physicochemical properties, and structural properties of ginger starch. The results of the study showed that as the number of freeze–thaw cycles increased, the content of resistant starch, amylose, total starch, and recrystallization in ginger starch increased significantly (p < 0.05). Freeze-dried ginger starch exhibited a C-type crystal structure in the X-ray diffraction pattern. The Fourier-transform infrared spectroscopy results also showed that the value of A1047/1022 increased, indicating that the freeze–thaw cycle would increase the degree of starch recrystallization. In terms of physical and chemical properties, compared with gelatinized starch, freeze–thawed starch had low swelling power, high solubility, low peak viscosity and breakdown, indicating higher thermal stability. In conclusion, freeze–thaw treatment can promote the formation of resistant starch from ginger starch and reduce starch hydrolysis, reflecting the potential of low–GI foods. We hope that ginger starch can be used as a raw material for new applications in functional foods.

1. Introduction

Ginger (Zingiber officinale Roscoe.) has been regarded as a representative substance in medicinal and edible plants since ancient times. As a spice and medicinal plant, it has a history of thousands of years. Ginger is rich in nutrients and contains approximately 200 compounds, among which, functional factors such as gingerol and ginger phenol have immune-boosting properties, as well as antitumor, antioxidant, antibacterial, and cardiovascular and gastrointestinal protective effects [1]. Currently, the world’s ginger production is approximately 2.15 million tons, and Taiwan is one of the top ten ginger-producing countries in the world, producing approximately 20,000 tons. Ginger is commonly sold as fresh products, dried goods, or processed into ginger powder or health supplements. However, the extraction of the active ingredients or processing of ginger often generates large amounts of waste, including starch residues and wastewater discharge, resulting in resource waste and water pollution [2].
Root and tuber medicinal plants have high starch content, which can be an important source of carbohydrates in the human diet. Nevertheless, natural starches have certain limitations, including inadequate thermal stability, low shear resistance, and susceptibility to aging [3]. These limitations impose restrictions on their range of applications. The result showed that the residual material of ginger obtained after supercritical fluid extraction of its active ingredients showed a starch content ranging from 30 to 50%. Observation under scanning electron microscopy revealed a spherical shape, and the gelatinization peak temperature was approximately 83.24 °C. The starch exhibited a C-type crystalline structure, indicating a higher content of resistant starch in ginger starch [4]. Digestive enzymes transform starch into glucose, which is the source of energy for the body. Depending on its properties in the human body, starch can be classified as rapidly digestible starch (RDS), slowly digestible starch (SDS), or resistant starch (RS) [5]. With increasing health awareness, resistant starch has become a global health concern. Research reports indicate that resistant starch has health benefits in improving gastrointestinal function and can be used in the development of probiotics and low glycemic index (GI) foods with low–calorie content [6]. Resistant starch is a type of starch that is not digested by enzymes in the small intestine of a healthy human body. Its functional characteristics are similar to those of dietary fiber, and it can be effectively broken down into short–chain fatty acids such as acetic acid, propionic acid, and butyric acid in the large intestine by beneficial bacteria, maintaining an acidic intestinal environment, reducing the growth of harmful bacteria, lowering cholesterol levels in the blood, helping intestinal peristalsis, promoting bowel movements, reducing the incidence of colon cancer, and improving intestinal health [7].
Resistant starch can be classified into five types based on the processing method, raw material properties, or nutritional characteristics. The different five types of resistant starch include physically entrapped starch, native starch granules, retrograded starch, chemically modified starch, and complex linear starch with lipids [6]. The mechanism of type III resistant starch (RS3) formation is that the structure of starch changes after gelatinization; when it undergoes retrogradation, linear and branched starch are rearranged to form a more stable structure [8]. In addition, increasing the number of cooling cycles increases the content of resistant starch [8]. The freeze–thaw cycle is one of the processing methods used for pretreatment, which involves repeatedly subjecting starch to high- and low-temperature cycles within a certain period [9]. This affects the internal structure of starch and promotes its retrogradation, wherein it re–gels and forms a regular mesh–like structure. This structure is more compact, with smaller internal spaces that hinder the action of digestive enzymes. Retrogradation also results in the formation of resistant starch [10]. In our laboratory’s previous experimental results, we found significant changes in the amylose and resistant starch contents of potato and sweet potato starches after five and three freeze–thaw cycles, respectively.
The application of freeze–thaw cycles and increasing the number of cooling cycles can alter the particle structure and physicochemical properties of the starch [11]. Therefore, this study used ginger starch with different freeze–thaw cycles to produce large amounts of resistant starch. The effects of the preparation method on digestibility, physicochemical properties, and resistant starch formation were also investigated. This can transform ginger from a regular food ingredient into a functional food material, which can enhance the utilization value and technological development of its raw materials. The aim of this study is to utilize freeze–thaw cycle technology for the physical modification of ginger starch, aiming to analyze the physicochemical properties of the starch and achieve a reduction in digestion rate and other functional characteristics in ginger starch.

2. Materials and Methods

2.1. Chemical Reagent

Acetone, acetic acid, dimethyl sulfoxide, ethanol, hexane, iodine, maleic acid, potassium hydroxide, potassium hydrogen, phthalate potassium iodide, sulfuric acid, and sodium hydroxide were purchased from Sigma-Aldrich (St. Louis, MO, USA). Other chemicals used were of analytical grade.

2.2. Sample Preparation

In this study, Zingiber officinale Roscoe. sourced from Taitung County, Taiwan, was used as the raw material. Fresh ginger is crushed using a juicer. The ginger was dispersed in deionized water at a ratio of 1:5 (w/v), stirring for 30 min at room temperature (25 ± 1 °C). The lower layer of the resulting ginger pulp is rinsed three times with distilled water and then dried in a freeze–dried. The powders were subjected to extraction using 95% ethanol to remove impurities such as lipids, proteins, pigments, and other compounds. The ginger starch was crushed and passed through a 40–mesh filter. Ginger starch contains a moisture content of 8.4%, and the raw starch material is stored in a drying cabinet for future use.
The experiments were performed according to the methods described by Wang et al. (2020) [12] and Wang et al. (2019) [13], with some modifications. Starch was added to distilled water to prepare a 10% starch suspension, which was subjected to the following two different treatments: (1) gelatinization treatment by shaking the mixture in a water bath at 100 °C for 20 min; (2) freeze–thaw treatment by freezing the mixture at −20 °C for 2 h and then thawing it at 50 °C for 30 min. Each freeze–thaw treatment cycle was considered one cycle. The procedure was repeated for different numbers of cycles depending on the experimental design. The starch samples were subjected to repeated freeze–thaw (FT) treatments for 0, 1, 3, 5, and 7 cycles. They were then freeze–dried and passed through a 40–mesh sieve. The resulting samples were stored in drying dishes until further use.

2.3. Analysis of Resistant Starch and Total Starch Content

The resistant starch content was analyzed using the Megazyme® resistant starch kit (Bray, Co., Wicklow, Ireland). The starch samples were determined on the basis of the method described by Englyst et al. [5]. The sample was sieved through a 40–mesh standard sieve, and 100 ± 5 mg of starch sample was accurately weighed and placed in a centrifuge tube. Then, 4 mL of enzyme solution (pancreatic α-amylase, 10 mg/mL amyloglucosidase (3000 U/mL), AMG) was added and mixed thoroughly. The mixture was heated continuously at 37 °C for 16 h. Next, 4 mL of 99% ethanol was added, and the mixture was centrifuged at 3000 rpm for 10 min. The supernatant was then carefully removed and transferred to another container to which 8 mL of 50% ethanol was added, followed by centrifugation at 3000 rpm for 10 min. This step was repeated twice, and the supernatants obtained in the subsequent steps were mixed. The combined supernatant was quantitatively transferred to 100 mL of 0.1 M sodium acetate buffer solution (pH 4.5). The precipitate was magnetically stirred, and 2 mL of 2 M KOH was added. The mixture was stirred for 20 min in an ice bath, followed by the addition of 8 mL of 1.2 M acetate buffer (pH 3.8) and 0.1 mL of AMG (3300 U/mL). The mixture was then placed in a water bath at 50 °C for 30 min and centrifuged at 3000 rpm for 10 min. The absorbance was measured at a wavelength of 510 nm using a spectrophotometer, and the values were used to calculate the content of resistant starch, non-resistant starch, and total starch according to the corresponding formula.
Resistant   starch   ( > 10 % )   ( g / 100   g ) = E × F / W × 90
Resistant   starch   ( < 10 % )   ( g / 100   g ) = E × F / W × 9.27
Non-resistant   starch   ( g / 100   g ) = E   ×   F / W   ×   9 0
Total   starch   ( TS ) = resistant   starch + non-resistant   starch

2.4. Analysis of Amylose Content

The method described by Knutson (2000) was modified using Soxhlet extraction to remove fat from the samples [14]. The extracted powder was collected and dried for subsequent experiments. Next, 20 ± 0.1 mg of the extracted starch and different ratios of amylose were weighed into test tubes, followed by the addition of 8 mL of 90% DMSO and shaking for 2 min. The mixture was then heated at 85 °C for 15 min in a water bath. After cooling to room temperature, the volume was adjusted to 25 mL using distilled water. To a 50 mL volumetric flask, 1 mL of the diluted sample and 40 mL of distilled water were added, followed by the addition of 5 mL of iodine solution and mixing. Distilled water was added up to the 50 mL mark, and the mixture was allowed to stand for 15 min to develop color. Absorbance was measured at 600 nm.

2.5. In Vitro Digestibility

To prepare the starch enzyme solution, 3.64 g of α-amylase from the porcine pancreas was weighed, and 12 mL of distilled water was added to it. The mixture was stirred for 15 min using a magnetic stirrer and then centrifuged at 1500× g for 10 min. Then, 10 mL of the supernatant was collected, to which 125 µL of AMG solution was added, followed by thorough mixing to prepare the starch enzyme solution.
To measure the RDS, SDS, and total starch hydrolysis rate, the method described by Zhang (2023) was used with some modifications as follows: 100 mg of the starch sample was accurately weighed and added to a centrifuge tube containing 4 mL of 0.1 M pH 5.2 sodium acetate buffer and 1 mL of the enzyme solution. The solution was mixed well and incubated at 37 °C with constant shaking at 150 rpm for 0, 20, 30, 60, 90, 120, 150, and 180 min to allow enzymatic hydrolysis. At each time point, 0.1 mL of the solution was taken out, and 0.9 mL of 95% ethanol was added to it [15], followed by thorough mixing to terminate the enzymatic reaction. The tube was centrifuged at 1500× g for 10 min and 0.1 mL of the supernatant was collected, followed by the addition of 3 mL of GOPOD solvent. The mixture was incubated in a water bath at 50 °C for 20 min to allow for color development, and the absorbance was measured at 510 nm. Sodium acetate buffer and glucose standard solutions were used as blank and control solutions, respectively. The RDS, SDS, and total hydrolysis rate (HI %) were calculated using the following formulas:
D-Glucose (%) = (ΔA SAMPLE)/(ΔA D-Glucose standard (100 µg)) × 100
RDS (%) = (G20 − G0) × 0.9
SDS (%) = (G120 − G20) × 0.9
RS   ( % ) = 100     RDS SDS
Next, the nonlinear equation established by Goñi et al. (1997) was used to calculate the kinetics of starch hydrolysis [16]. The area under the hydrolysis curve (AUC) of the starch hydrolysis sample was calculated using the following formula: The AUC was compared with that of white bread to calculate the hydrolysis index (HI), which was then used to estimate the glycemic index (eGI).
AUC   = t f t 0 C k 1 exp k t f t 0
C: the equilibrium concentration (%) at 180 min;
tf: the final reaction time (180 min);
T0: the initial reaction time (0 min);
k: first-order reaction rate constant (min−1), which can be calculated by the following:
C   = 1 e kt eGI   = 8.198 + 0.862 × HI %

2.6. Water-Holding and Oil-Holding Capacity Measurement

The method described by Sangnark and Noomborm (2003) was used with some modifications for the measurements [17]. For this, 0.2 g of starch sample (W0) was weighed into a 50 mL centrifuge tube (W1), and then 10 mL of deionized water (soybean oil) was added and mixed. The tube was placed in a 30 °C water bath and heated and shaken for 30 min. Subsequently, it was centrifuged at 3000× g for 20 min, and the supernatant was discarded. The weight of the centrifuge tube was then measured (W2).
Water-holding   capacity   ( g / g ) = ( W 2 W 0 W 1 ) / W 0
Oil-holding   capacity   ( g / g ) = ( W 2 W 0 W 1 ) / W 0

2.7. Swelling Power and Solubility

The method was adapted from Ye et al. (2019) with some modifications [18]. A 50 mL centrifuge tube was weighed to obtain the tare weight (W0). Then, 0.25 g of the sample was weighed and added to the centrifuge tube, followed by the addition of 10 mL of deionized water. The tube was then placed in a water bath at 65, 75, 85, and 95 °C and shaken for 30 min. After cooling in an ice bath for 20 min, the tube was centrifuged at 8000× g for 20 min, the supernatant was poured into a crucible (W2), and the precipitate (W1) was weighed. The crucible was placed in an oven at 105 °C for 24 h, removed, and cooled to room temperature in a desiccator. The weight of the crucible (W3) was then recorded.
Solubility   ( % ) = ( W 3 W 2 ) / 0.25 × 100 %
Swelling   power   ( % ) = ( W 1 W 0 ) / 0.25 × ( 1 Solubility / 100 ) × 100 %

2.8. Differential Scanning Calorimeter (DSC)

The analysis was performed using a differential scanning calorimeter. A starch sample (2.5 mg) was weighed, added to 3 times the volume of water (starch: water = 1:3), placed in an aluminum sample pan, sealed, and allowed to equilibrate overnight for hydration. The sample was heated from 50 °C to 135 °C at a rate of 10 °C/min and cooled back down to 50 °C at the same rate. The heat absorption curve of the sample was recorded to determine the onset temperature (TO), peak temperature (TP), final temperature (TC) of gelatinization, and to calculate the enthalpy of gelatinization (ΔH). A reference sample was prepared by adding an equal volume of distilled water to another sample pan.

2.9. Pasting Properties

Three grams of the sample were added to 27 g of distilled water to prepare a 10% starch solution. The solution was analyzed using a rapid–visco analyzer under the following conditions: temperature increased from 50 °C to 95 °C at a rate of 6 °C/min and held for 5 min, followed by a decrease from 95 °C to 50 °C at a rate of 6 °C/min, while the solution was stirred at 160 rpm. Viscosity changes in the test samples were measured [15].

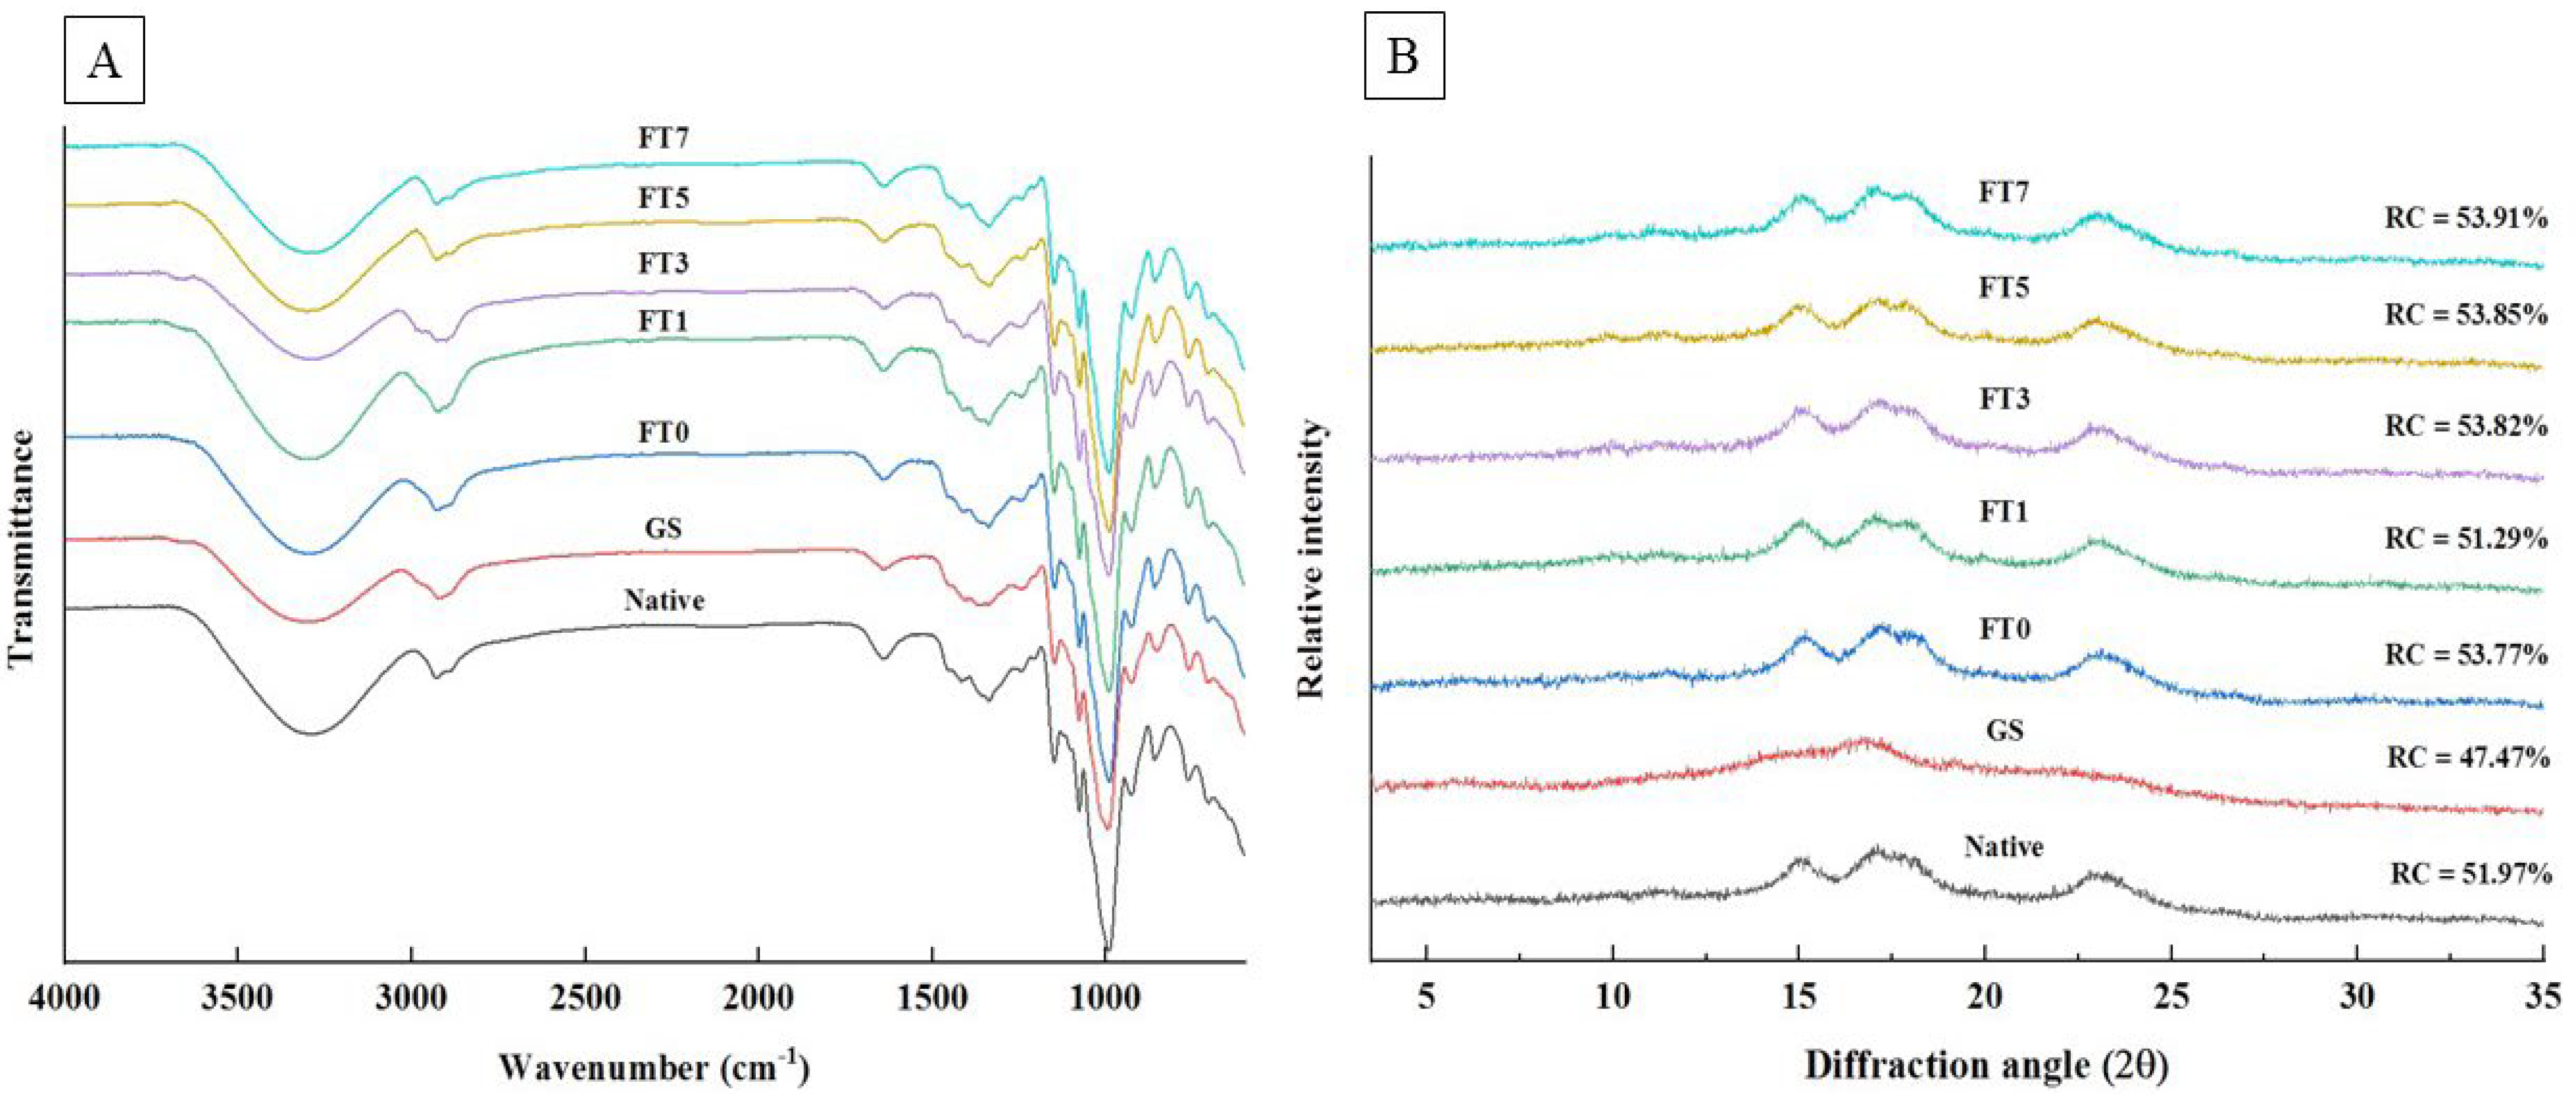
2.10. Fourier Transform Infrared Spectrometer (FTIR Spectrometer)

Fourier transform infrared spectroscopy (FTIR) (Nicolect 380, Thermo Fisher Scientific Inc., Waltham, MA, USA) was performed according to the method described by Qi et al. (2021) with slight modifications [19]. A small amount of the sample was placed on the platform for wavelength scanning, with a wavenumber range of 1200–800 cm−1, a resolution of 4 cm−1, and 64 scans. The absorption values at 995, 1047, and 1022 cm−1 wave numbers were calculated accordingly.

2.11. X-ray Diffractometry
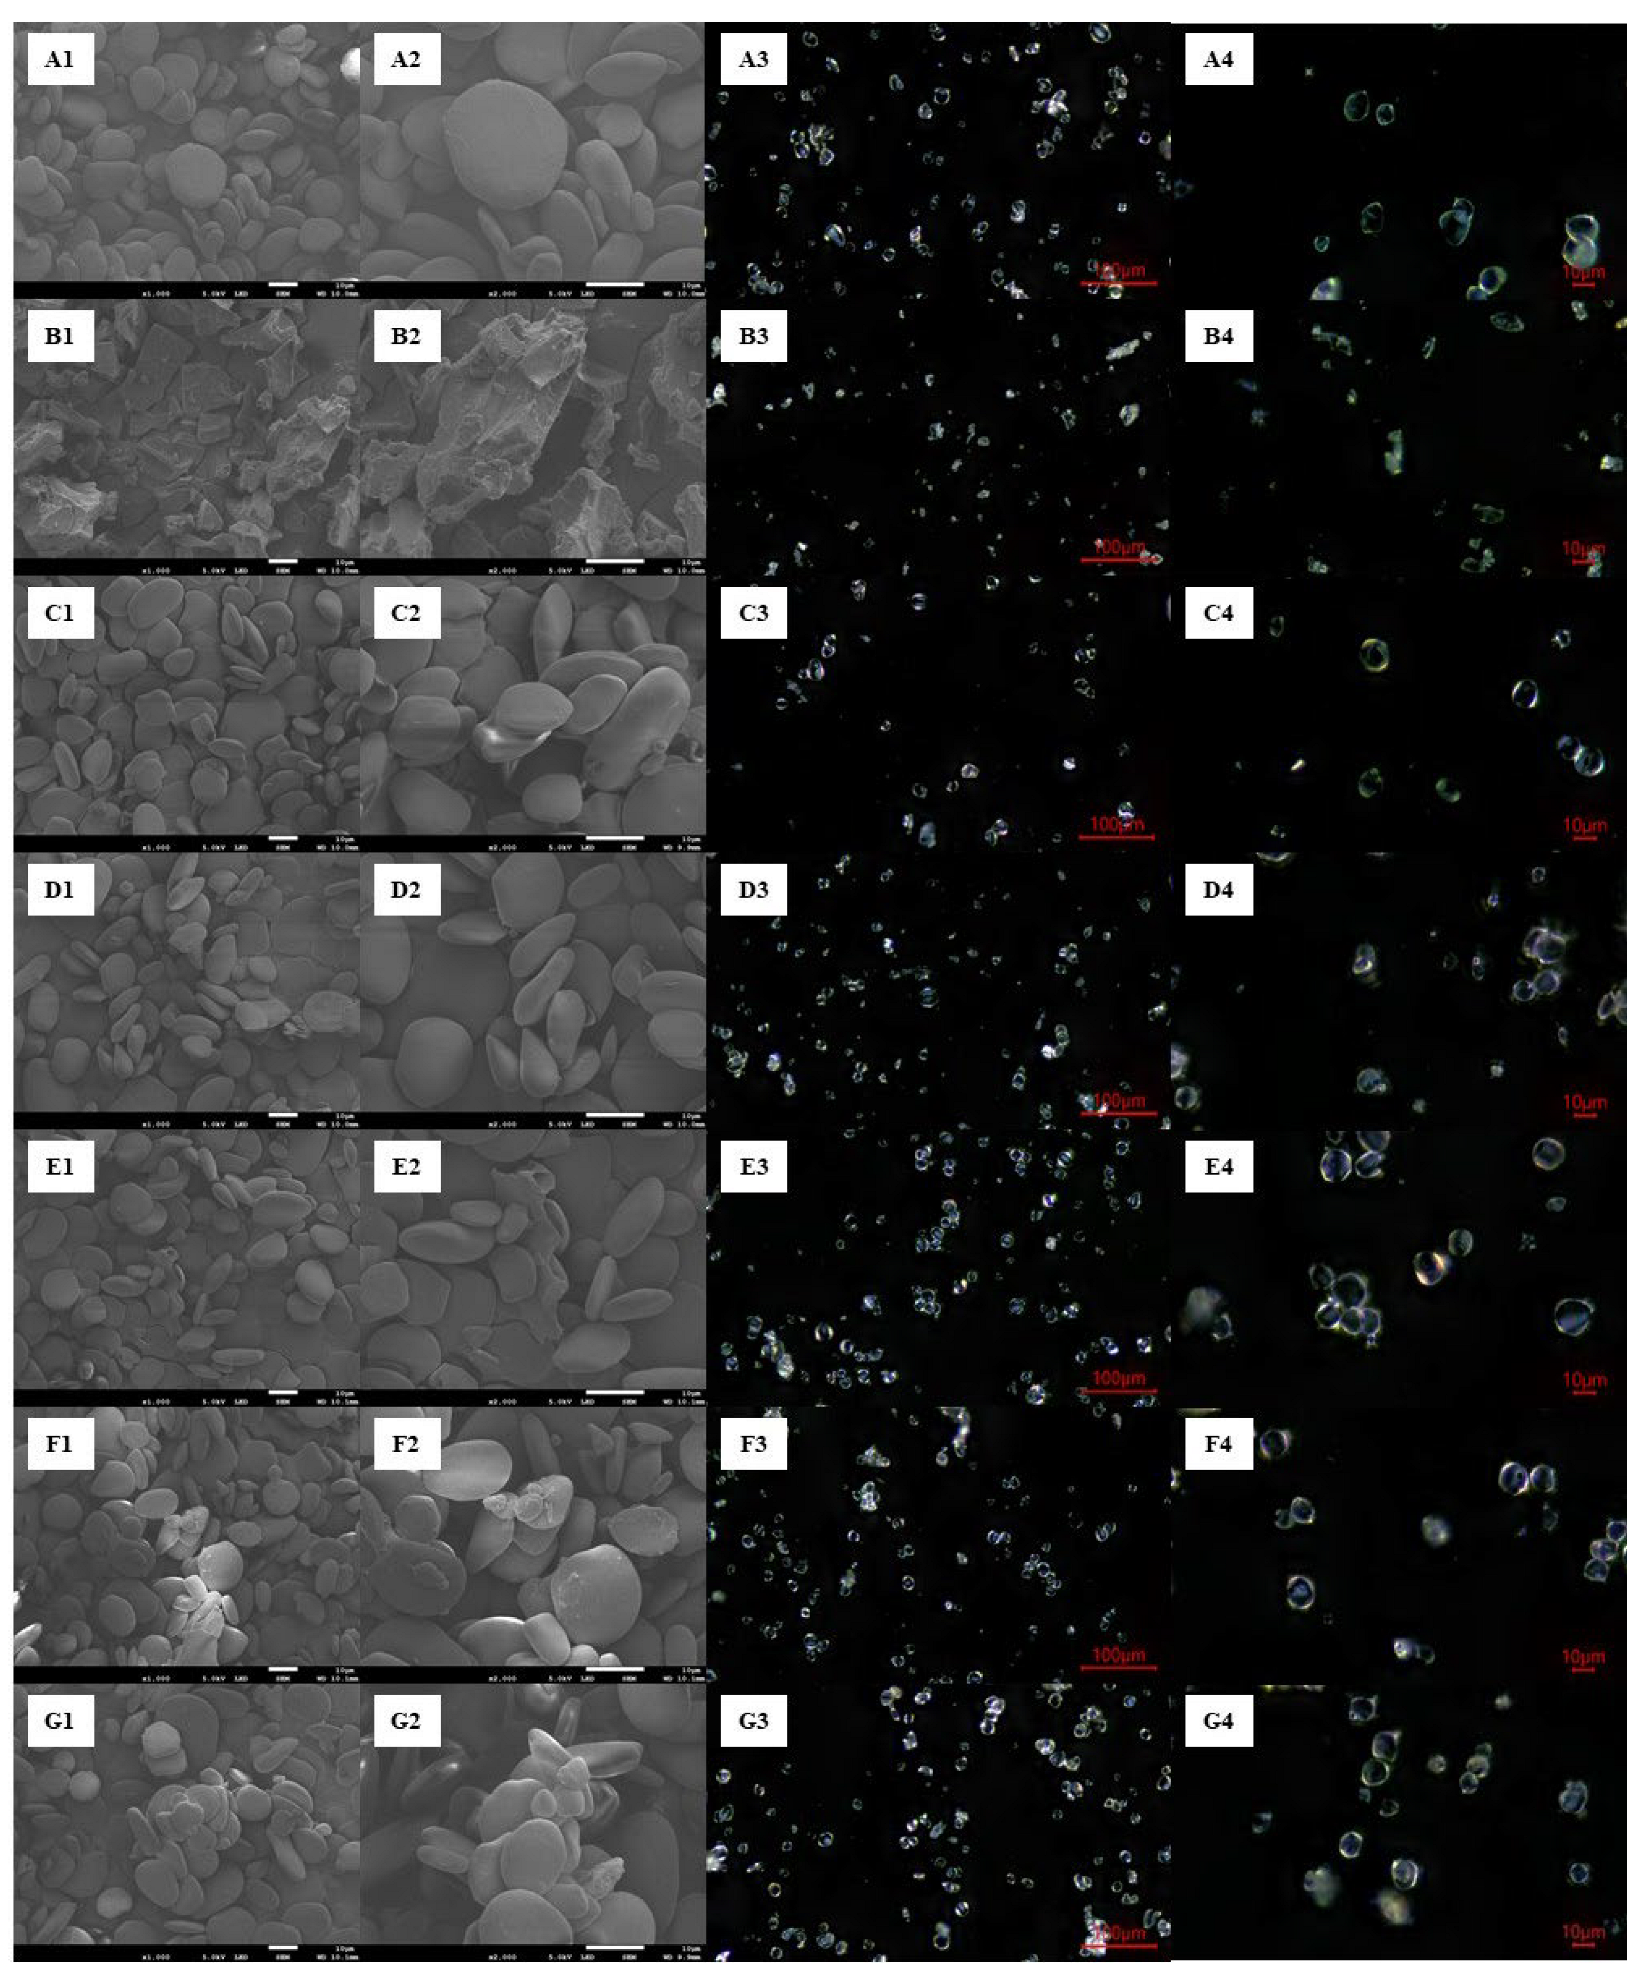
A small amount of the starch sample was placed in an X-ray powder diffraction instrument (PANalytical X’Pert3 Powder). The instrument was operated at a voltage of 45 kV, current of 40 mA, and scanning speed of 3°/min. The angle 2θ was scanned from 3° to 35°. The relative crystallinity was calculated using Origin 2021b software with the peak area to obtain the crystalline, non–crystalline, and peak areas.
Relative crystallinity (RC %) = Ac/(Ac + Aa) × 100
Relative crystallinity of each peak (C) = Ap/Ac × 100
Ac: crystalline area, Aa: amorphous area, Ap: peak area, C: relative crystallinity of each peak.

2.12. Maltese Cross

Polarized light microscopy was performed in accordance with the method described by Qi et al. (2021) [19]. A small amount of sample was placed on a microscope slide, followed by the addition of a drop of distilled water and gentle stirring to evenly disperse the starch in the water. A cover glass was then placed over the mixture to prevent the generation of bubbles. Starch particle morphology and polarization crossing were observed under polarized light.

2.13. Microstructural Characteristics

Following the method described by Sun et al. (2023), a field-emission scanning electron microscope (JSM-7100F) was used to observe the surface and size of the starch particles [20]. Starch samples (100 mg) were placed in microcentrifuge tubes and coated with platinum for 2 min using a coating machine (vacuum degree of 2.4 Pa). Starch particle surfaces were observed at 100×, 500×, 1000×, and 2000× magnification under an accelerating voltage of 5 kV.

2.14. Statistical Analysis

Each experiment was performed in triplicate, and the mean and standard deviation (Mean ± SD) were calculated. The statistical software XLSTAT (Lumivero 2019) (Lumivero, Denver, CO, USA) was used to perform an analysis of variance (ANOVA), and Duncan’s multiple range test was used for post–hoc comparisons. Statistical significance was set at p < 0.05.

3. Results and Discussion

3.1. Composition Analysis of Ginger Starch

The compositional differences between different types of starch arise due to factors such as the source of starch, particle size and density, content, ratio, and chain length of amylose and amylopectin, crystallinity, and formation of amylose–lipid complexes [21]. Resistant starch is difficult to be hydrolyzed by digestive enzymes in the small intestine of healthy individuals but can be digested and utilized by microbiota in the large intestine, generating short–chain fatty acids that are beneficial for colon health. It is considered a new type of dietary fiber. It is evident that untreated ginger starch primarily consists of RS types 1 and 2, as it contains intact starch granules. (Table 1). After processing, the RS content of the starch decreased because the natural RS in the starch was easily destroyed by high temperatures or processing. Therefore, untreated frozen–thawed starch (FT0) showed a higher content of resistant starch as it did not undergo heat treatment. Furthermore, during repeated freeze–thaw cycles, starch dehydration, and condensation reactions occurred, causing some degree of aggregation in straight–chain starch, accelerating the formation of crystal nuclei, and significantly increasing the RS content (p < 0.05) with increasing freeze–thaw cycles. The straight–chain starch content in this study, except for gelatinized starch, was not significantly different from that of untreated ginger starch and was approximately 30%, which was higher than the straight–chain starch content of sweet potato and potato starches mentioned in previous studies [22,23].
Previous studies have indicated that the main reason for the increase in RS content is that the straight–chain starch molecules in starch re–aggregate within a short period of time to undergo recrystallization, forming hydrogen bonds and creating a closely packed structure that forms a double helix. Moreover, straight–chain starch–lipid complexes in starch can inhibit the decomposition of digestive enzymes. In contrast, branched–chain starches require a long time to aggregate and arrange, which promotes an increase in SDS in starch [21,24,25]. The RDS and SDS contents of the untreated ginger starch in the in vitro digestion test were 1.77% and 11.73%, respectively (Table 1). After gelatinization, the starch granules were damaged, and the structure became loose, which increased the size of the gaps in the particle structure and made it easier for digestive enzymes to hydrolyze the starch, promoting an increase in RDS and SDS contents. However, freeze–thaw treatment could rearrange the branched and linear starch molecules by increasing the number of cycles, making the structure tighter and less susceptible to hydrolysis.
As shown in Table 1, RDS remained unchanged at 1.09%, but SDS decreased with the number of cycles (p < 0.05). Some SDS was converted into RS, resulting in an increase in the RS content. This result was confirmed by the glycemic index (GI). GI is often used as an indicator of postprandial blood glucose levels and can be used to evaluate the amount of glucose released by food in the blood, with white bread or glucose as reference foods [26]. The GI value of gelatinized starch (115.09) was significantly higher than that of the other ginger starch treatments (p < 0.05), and untreated ginger starch had the lowest GI value of 26.50. Among the frozen–thawed starch groups, the starch hydrolysis rate of the 7–cycle treatment decreased gradually with digestion time compared to the 1–cycle treatment, indicating that the thawing process during the first freeze–thaw cycle had a significant impact on the internal structure of the starch (Table 1). However, with increasing cycles, repeated retrogradation tightened the structure. In the middle to late stages of hydrolysis, it was difficult for the enzyme to enter the recrystallization area, resulting in a gradual decrease in the hydrolysis rate and GI value from 40.23 to 32.3. Except for gelatinized starch, the GI values of the other starches were all lower than 60, indicating that they could be considered low–GI foods. These results are consistent with those of previous studies [12].

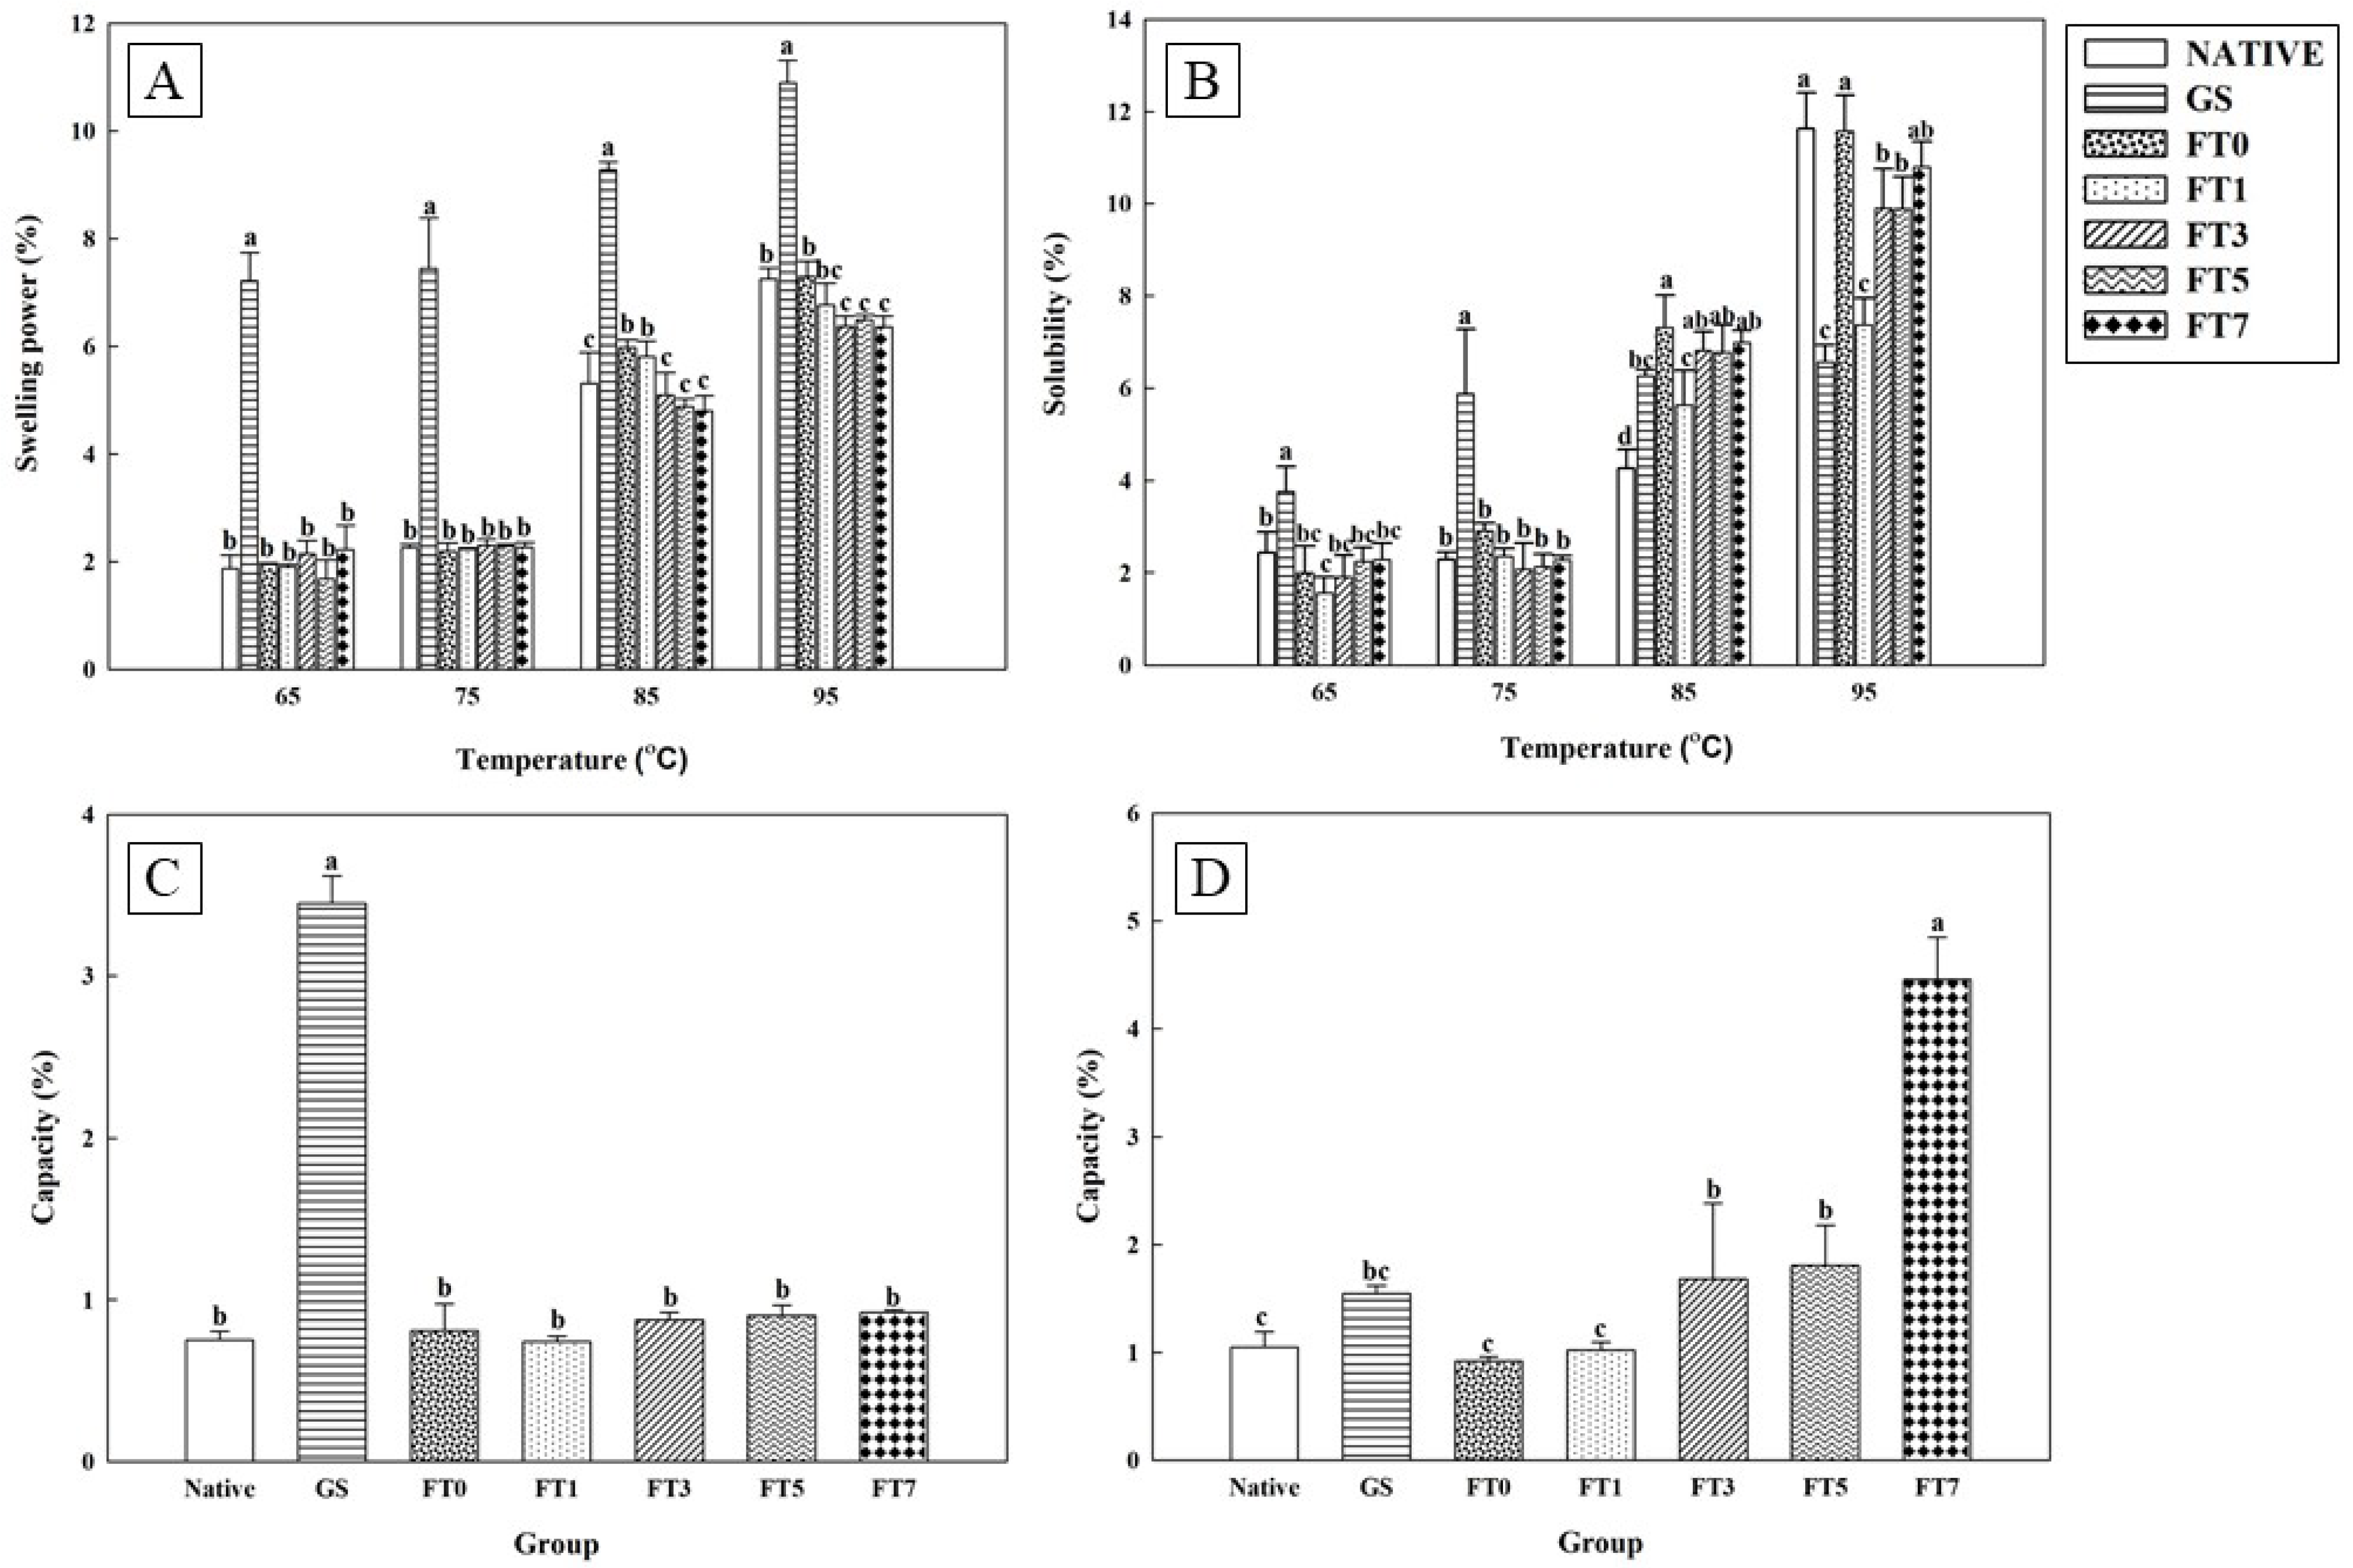
3.2. The Physicochemical Properties of Ginger Starch

The swelling power and solubility of starch increased with temperature. Figure 1A shows that between 65 °C and 95 °C, the degree of swelling of the gelatinized starch was higher than that of other treatment groups, indicating that high–temperature treatment of starch destroys the intact crystals in natural starch, causing a decrease in the content of linear starch, and thus making starch granules easier to absorb water and swell [27]. The untreated ginger starch and frozen–thawed starch have stable structures or are influenced by the freezing–thawing cycle, which enhances the interaction between amylose–amylose and amylose–amylopectin; amylose helps to form a dense and multilayered three–dimensional structure [28]. Starch solubility is influenced by the hydroxyl groups of internal lipids, which suppress hydration within the amorphous regions of starch granules, thereby limiting their expansion. Figure 1B shows that the solubility of the gelatinized starch is the highest between 65 °C and 75 °C. This is because most of the gelatinized starch is in an amorphous state and is easily hydrated and dissolved in water at low temperatures, resulting in increased solubility. An increase in temperature caused starch gelatinization, and the gelation process caused structural changes; however, solubility did not increase significantly. As the temperature increased to 95 °C, the untreated ginger starch had the highest solubility, while the starch treated with freeze–thaw cycles resulted in more broken starch granules and an increased proportion of short chains, which exposed more hydrophilic groups and made them easier to hydrate. However, the content of short chains was still lower than that of the untreated ginger starch. This indicates that freeze–thaw treatment can cause the starch to undergo retrogradation and promote recrystallization, which is consistent with the findings of Chen et al. [28].
Resistant starch is a type of dietary fiber. Dietary fibers have a porous surface that provides good water- and oil-holding capacities. In Figure 1C, it is shown that the water-holding capacity of ginger starch after gelatinization is the highest, while there is no significant difference among other groups. The reason for this may be that the structure of ginger starch is destroyed by high temperature, which becomes porous, allowing water molecules to easily penetrate and increasing its water-holding capacity. In comparison to gelatinized ginger starch, freeze–thawed starch has a lower water-holding capacity. The previous literature has mentioned that resistant starch has a low water-holding capacity, which provides good processing and application abilities, thus improving product texture [29]. Freeze–thawed ginger starch and gelatinized starch groups exhibited a higher oil-holding capacity, which might be due to the characteristics of highly lipophilic starch, with a rough structure, large surface area, and strong adsorption capacity (Figure 1D). The literature shows that ultrasonic and freeze–thaw co–treatment of potato starch can increase its oil absorption capacity from 59% to 80% by creating more grooves, gaps, and wrinkles on the surface of the starch particles [12]. With an increase in the number of freeze–thaw cycles, the oil-holding capacity of starch also increased. In particular, starch subjected to 7 freeze–thaw cycles had the highest oil-holding capacity. This may be due to the deformation of the starch granules caused by freeze–thaw cycles, resulting in a wrinkled surface and a rougher texture, thereby increasing the surface area and oil absorption capacity. This result is consistent with those of previous studies on corn and potato starches [13].

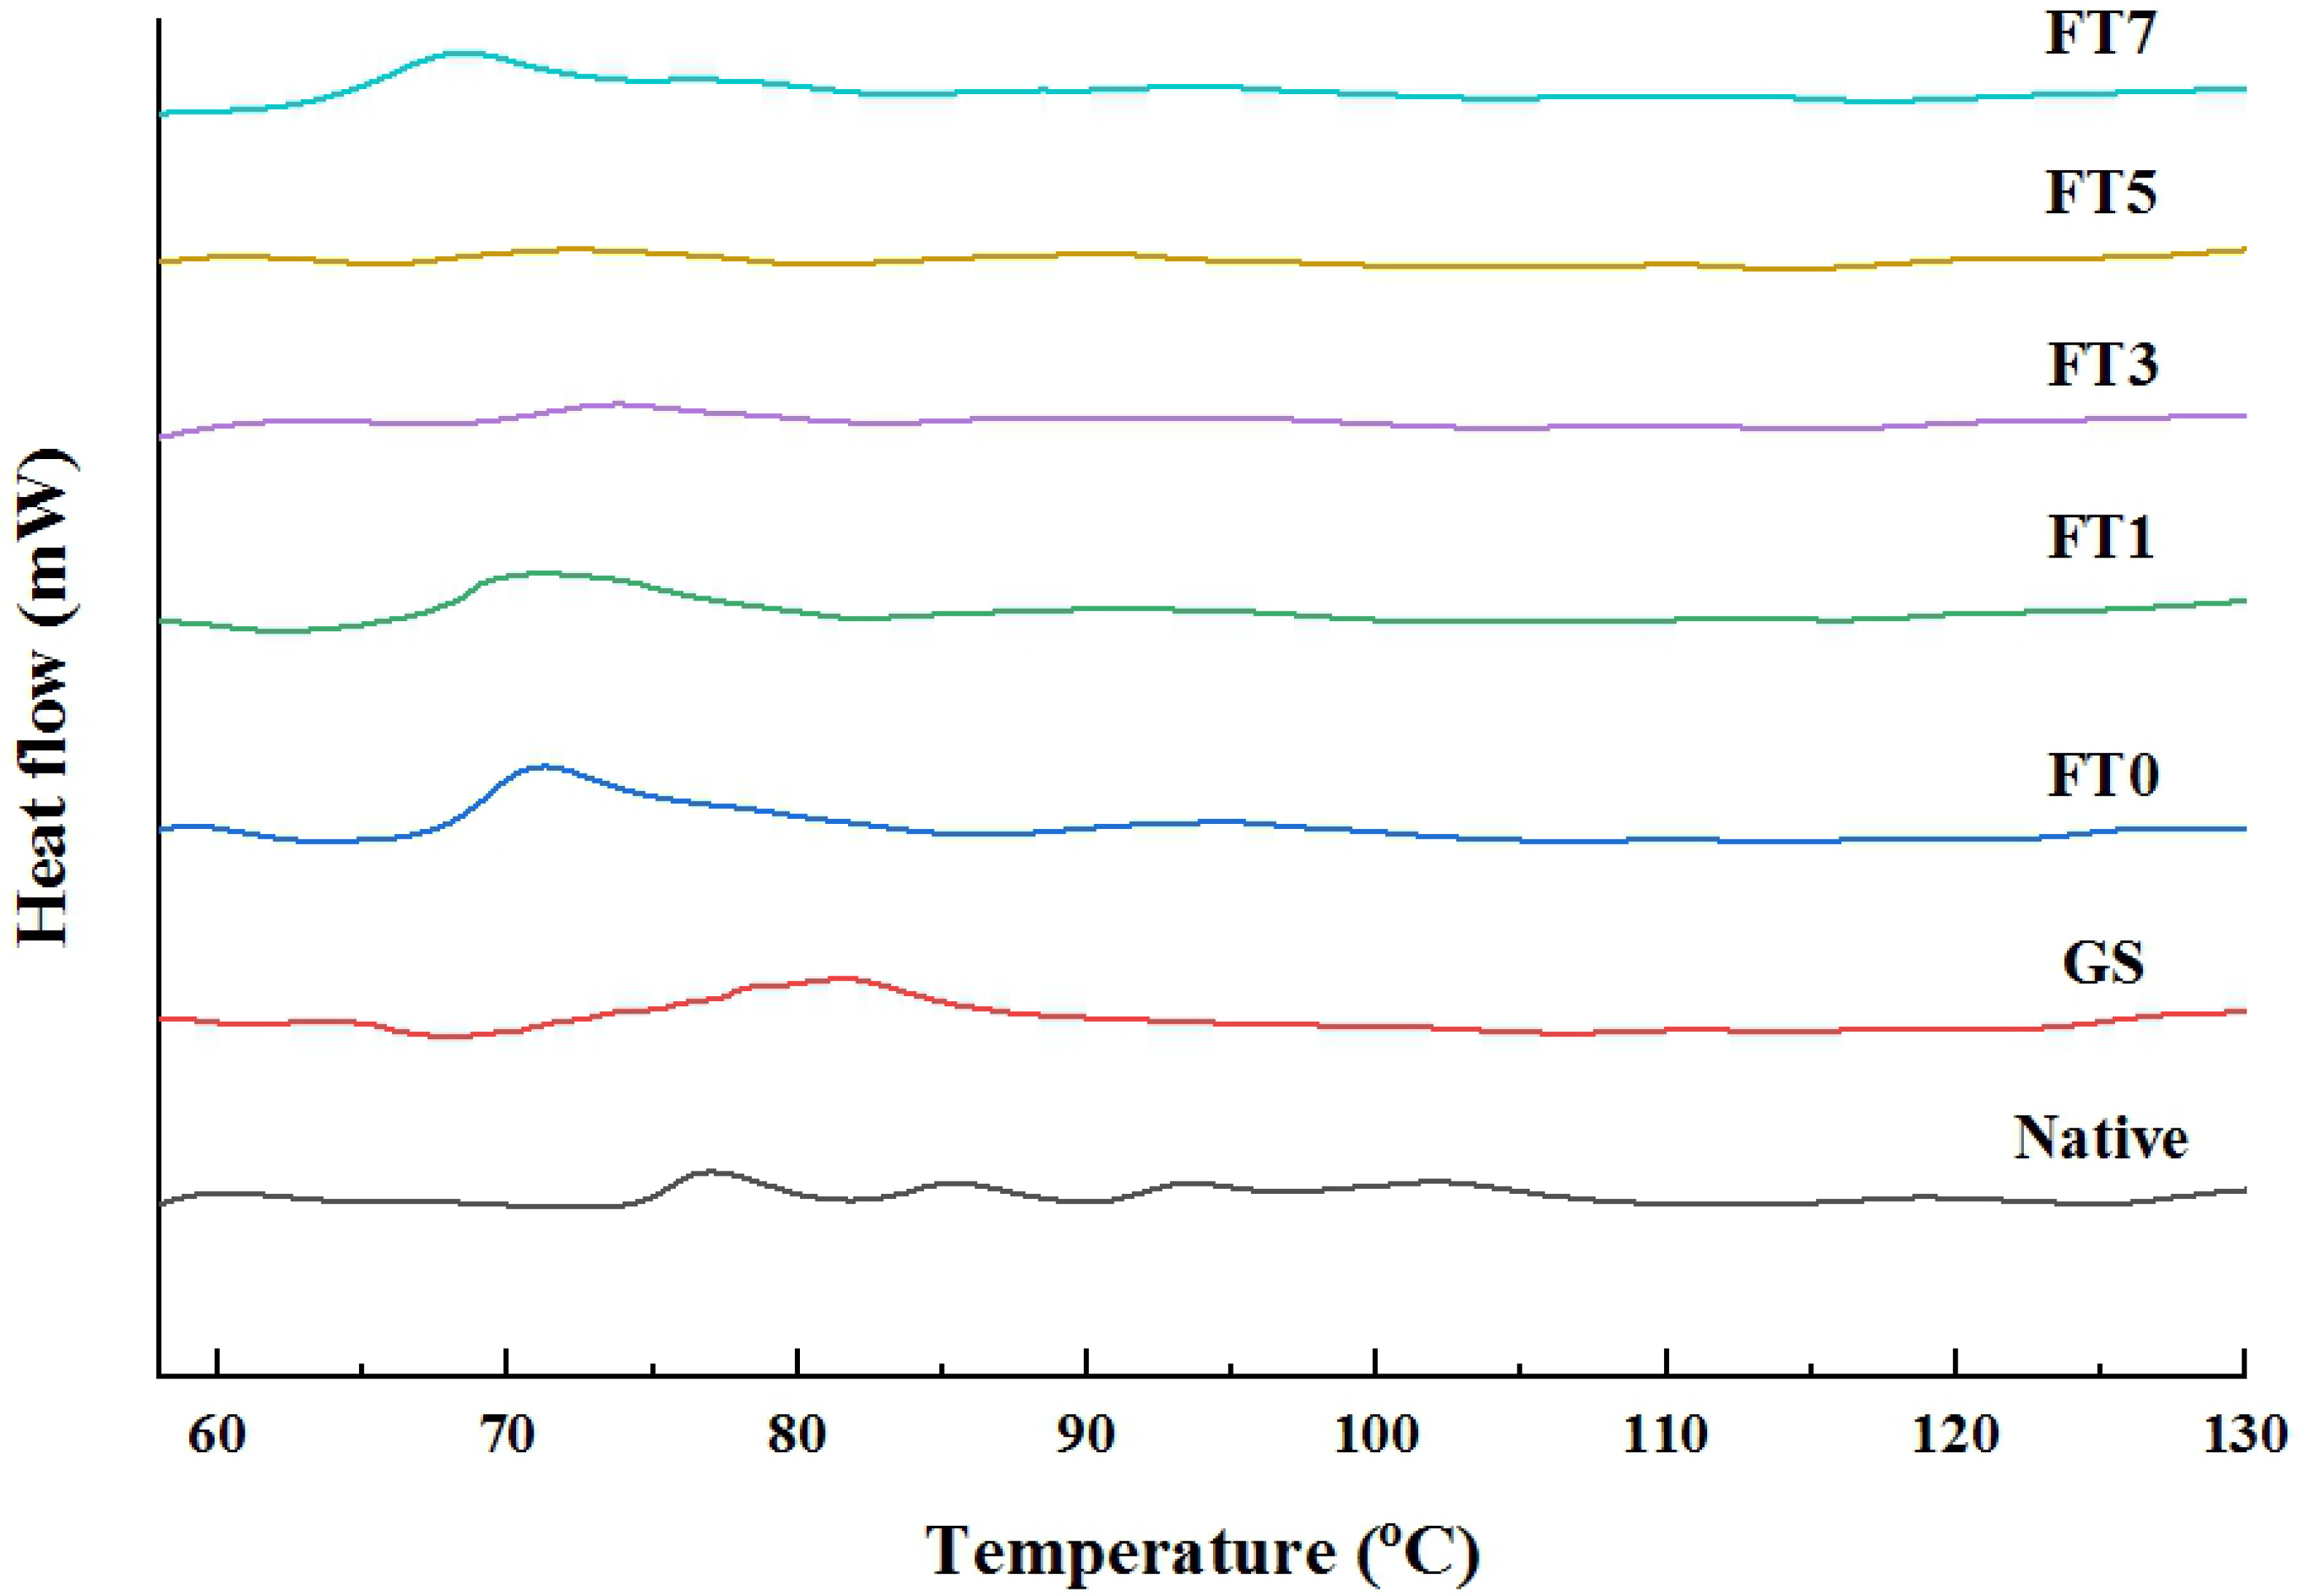
3.3. The Gelatinization Characteristics of Ginger Starch

The differential scanning calorimetry (DSC) endothermic curve can reflect the temperature at which the crystalline structure in starch melts and the corresponding enthalpy change (ΔH). The results shown in Figure 2 indicate that the gelatinization temperature of untreated ginger starch is between 70.69 °C and 78.1 °C, which is consistent with the previous literature on ginger starch research [4]. Compared with untreated ginger starch, the gelatinization temperature of ginger starch treated by gelatinization and freeze–thawing was slightly lower, especially for gelatinized starch, which had the lowest gelatinization temperature, with a temperature range of 61–67 °C. As the number of freeze–thaw cycles increased, the gelatinization temperature of the freeze–thawed starch gradually increased. In starch subjected to 7 freeze–thaw cycles, two absorption peaks were found, with the first absorption peak detected at 62–73 °C and the second absorption peak detected at 76–85 °C. Li et al. (2020) reported that branched starch is usually distributed in the amorphous region and melts easily under heat. Therefore, the first absorption peak represents the gelatinization temperature of branched starch, whereas the second absorption peak represents the gelatinization temperature of resistant starch [30].
Enthalpy is the energy required for the double-helix structure of starch to dissociate and melt during gelatinization. It is usually positively correlated with the double– and single–helical crystal structures in starch [31]. The ΔH value of untreated ginger starch is 15.16 J/g. Through freeze–thaw treatment, the starch structure is transformed from a high–energy disordered state to a low–energy ordered state. In the seven cycles of freeze–thaw treatment, the second absorption peak appeared with a ΔH value of 24.17 J/g. This may be due to the combination of linear starch and lipids, which increases crystallinity and thus increases the enthalpy value. The freeze–thaw treatment increased both the peak temperature and enthalpy value, indicating that the treatment accelerated the molecular arrangement of macromolecules by breaking them down. This led to the formation of more double-helical structures as the starch molecules bonded to each other. Starch gelatinization caused a high degree of starch structure damage, leading to a decrease in crystallinity and a lower ΔH value compared to untreated ginger starch. Previous studies have demonstrated that wheat and potatoes exhibit similar trends [12,32].

3.4. The Pasting Properties of Ginger Starch

After modification, starch demonstrated an increased gelatinization temperature and decreased viscosity, thus losing its natural gelatinization properties. Previous studies have shown that the peak viscosity (PV) and breakdown viscosity (BD) of starch reflect its swelling ability and colloidal stability. After modification, the PV and BD of starch decreased, indicating its thermal and shear stability [8,33]. As shown in Table 2, there were no significant differences in the peak temperature (PT), PV, trough viscosity (TV), or BD of freeze–thawed starch and untreated ginger starch, except for the gelatinized starch group. There was no significant difference in the PT value, PV, TV, or BD between the frozen–thawed and untreated ginger starches, except for the gelatinized starch. It is speculated that natural ginger starch has a high peak temperature, and the reason for its higher gelatinization temperature compared to other starches mentioned in the literature is that the particle structure of ginger starch is tighter; therefore, this structure requires more energy to be destroyed [30]. Starch treated with repeated freeze–thaw cycles retains the characteristics of natural starch, which is not easily affected by thermal expansion, consistent with the solubility and swelling power results. The BD value of the gelatinized starch was the highest, indicating that high temperatures destroyed the ordered starch chains, resulting in a decrease in crystallinity, which decreased the gelatinization temperature and increased the viscosity. After gelatinization, starch can expand under high temperatures and mechanical shear forces, causing breakdown and a decrease in viscosity. The BD value reflects the thermal stability of starch, and a lower BD value indicates better thermal stability. The low BD value of the frozen–thawed starch indicates improved shear resistance of the starch. It is speculated that freeze–thaw treatment may enhance the orderliness of the amorphous regions in the starch granules, resulting in increased tolerance to high temperatures and shear forces. Setback (SB) is used to measure the degree of starch molecular recrystallization during the cooling process and serves as an indicator of short-term starch aging and gelation ability [11]. The results showed that the highest SB value was 3.60 Pa.s for gelatinized starch (Table 2), and compared to the SB value of untreated ginger starch, freeze–thaw starch had a higher SB value. Amylose content, which is an important component of starch, is related to the gelatinization and retrogradation properties of starch. The main mechanism of short–term retrogradation is the formation of double helical structures between amylose molecules through intermolecular hydrogen bonds, which leads to the gelation and recrystallization of starch. Freeze–thaw cycles can accelerate the retrogradation of starch molecules, and the molecular chains in starch undergo rearrangement, which enhances internal bonding and increases thermal stability [34].

3.5. Structural Analysis of Ginger Starch

The FTIR spectrum of untreated ginger starch shown in Figure 3A indicates the presence of peaks at 3300, 2926, 1647, 1422, 1149, 1078, 995, 925, and 858–700 cm−1. The peak at 3300 cm−1 is related to the stretching vibration of hydrogen bonds in -OH, whereas the peak at 2926 cm−1 is related to the asymmetric stretching vibration of -CH. The peaks at 1647, 1149, 1078, and 925 cm−1 are respectively related to the bending vibration of -OH, asymmetric stretching and vibration of C-O-C, and vibration of glycosidic bonds [35]. Freezing and thawing, as well as gelatinization treatment, did not cause any significant changes to the molecular groups of ginger starch or the emergence of new functional groups, which is consistent with the study on porous corn starch by Zhao et al. (2018) [36]. After enzymatic–assisted freezing and thawing of corn starch or ultrasound–assisted freezing and thawing of potato starch, no significant changes were observed in the characteristic absorption peaks of the treated starches [12]. The hydrophobic groups of starch can be reflected in the range of 2800–3000 cm−1. Freezing, thawing, and gelatinization of starch resulted in a higher peak intensity at 2926 cm−1, which increased with an increase in the number of freeze–thaw cycles. The hydroxyl groups in the hydrophilic groups of starch increased in the range of 3100–3500 cm−1, affecting the hydrophilicity of starch [13]. Gelatinized starch showed a strong peak, and the absorption peaks in the starch treated with 3, 5, and 7 freeze–thaw cycles were higher than those of untreated ginger starch. Therefore, it exhibited better oil and water absorption rates, further confirming its water and oil retention abilities. He et al. (2020) mentioned that the absorption peak near 3300 cm−1 shifts gradually with increasing intensity, indicating the existence of hydrogen bond interactions between starch chains [37]. This indicates that starch forms more hydrogen bonds, thus proving that resistant starch has a more stable and robust structure. It is mentioned that starch has unique absorption peaks at 1047 and 1022 cm−1, and the degree of starch crystallinity and double helix structure can be analyzed by the R1047/1022 and R1022/995 ratios. Figure 3A shows that the highest R1022/995 was in the untreated ginger starch because natural starch has a higher proportion of double helix structures. However, after 5 and 7 cycles of freezing and thawing, R1022/995 showed an increasing trend, indicating that short–term retrogradation promotes the formation of a double–helical structure in amylose. The results showed that the R1047/1022 value of untreated ginger starch was higher than that of frozen–thawed and gelatinized ginger starch, indicating that the ordered structure of ginger starch was favored. This may be due to the fact that during the processing of frozen–thawed starch, the double helix structure of starch in the crystalline region is dissociated, and the crystal rearranges during the re–crystallization process, thus increasing the short–range ordered crystallization degree of starch.
Figure 3B shows the characteristic peaks of natural ginger starch appearing at 10°, 11°, 15°, 17°, 18°, and 23°, exhibiting the C-type starch crystalline structure, similar to the C-type crystalline characteristics of supercritical extracted ginger starch studied by Braga, Moreschi, and Meirele (2006) [4]. The XRD patterns of natural ginger starch and red sweet potato starch are both Ca-type [20], indicating that the crystalline structure of ginger starch is not altered by the freeze–thaw treatment. According to the literature, high temperatures break hydrogen bonds in the crystalline region of starch molecules, causing the double helix structure in starch to unfold and allowing water molecules to enter the interior of the particles, resulting in structural changes [6].
Except for the pregelatinized ginger starch, the relative crystallinity (RC) of the other treatment groups was significantly higher than that of the untreated ginger starch, a trend consistent with Szymońska et al. (2003) [38]. The distribution of water molecules within starch granules during the freezing of starch solutions affects the molecular arrangement within the structure, and the addition of starch with different water contents can affect the molecular arrangement within the structure. Bogracheva, Wang & Hedley (2001) found that for the same starch type, starch with a lower water content had a lower proportion of double helical structures, which in turn affected the content of ordered structures in starch [39]. Repeated freeze–thaw cycles may alter the internal structure of the starch granules. During the freezing process, starch granules are squeezed by the external water, leading to the weakening of the interactions between the double–helix structures during thawing. However, as the number of cycles increases, the molecular chains accelerate re–association, and the relative crystallinity slightly increases, which is consistent with the trend reported in the literature [39,40,41]. These results indicate that freeze–thaw cycles do not alter the crystalline structure of untreated ginger starch, but during the freeze–thaw process, the starch is prone to recrystallization, which can affect the degree of crystallinity and orderliness of the starch structure [32].

3.6. Microstructure of Ginger Starch

Figure 4 shows the microstructure of the surface of ginger starch particles under different magnifications before and after treatment. Figure 4(A2) shows that the untreated ginger starch particles had an oblong shape with a smooth surface and no damage, with an average particle size of 14.04 μm, which is similar to the particle morphology mentioned in the literature [30]. Figure 4(A4) shows that the hilum of ginger starch is not located at the center of the particle, and the molecular arrangement is the same as that of potato, which is a concentric layer pattern. The polarization cross of ginger starch is not very obvious, which may be due to the fact that when the starch particle is lying flat or the thickness is thin, the birefringence of the particle is weak under the polarizing microscope, consistent with the characteristics of yellow ginger starch discussed in Huang et al. (2015) [42,43]. The refractive strength is determined by factors such as the starch particle size, degree of crystallization, and molecular alignment trend, resulting in different positions, shapes, and strengths of polarization crosses for different types of starch [44]. In the SEM images, besides the gelatinized starch, there was no significant difference in the appearance of the starch particles after freeze–thaw treatment, indicating that freeze–thaw treatment did not significantly alter the particle structure. However, when observed at a magnification of 1000×, the gelatinized starch no longer retained its original starch particle morphology (Figure 4(B1)). Xiao (2020) found that after the gelatinization of corn, rice, and sweet potato starch, broken starch granules aggregated to form lumps in microscopic structure images, and the higher the degree of gelatinization was, the greater the loss of crystallinity [44]. In this study, gelatinized starch was observed more clearly using polarized light microscopy (Figure 4(B4)). The higher degree of starch fragmentation and crystal destruction, the disappearance of the starch hilum, and birefringence indicated starch gelatinization (Figure 4(B4)). The previous literature has mentioned that the destruction of the crystal structure during starch gelatinization begins in the hilum region. The expansion of this region affects the collapse of the entire particle structure, which is consistent with the structures reported in many starch gelatinization studies [45,46,47].
Figure 4(D2–G2) shows the microstructure of the freeze–thawed starch observed by SEM. After one freeze–thaw cycle, the surface of starch showed slight protrusions and partial damage, while after three cycles, some particles were broken, causing the damaged starch to aggregate and fuse with other intact starch particles. As the number of cycles increased to 7, the surface of the freeze–thawed starch became slightly rough and grooved, possibly because of the repeated transformation of water into ice crystals during the freeze–thaw treatment, exerting a strong mechanical compression force on the starch inside and outside. During the thawing process, starch expands, and soluble substances dissolve, causing water molecules to redistribute in the pores, which increases the surface area and causes the particles to cave in [12]. This, in turn, increases the oil absorption capacity of frozen–thawed starch, which is consistent with the results of its water and oil retention abilities. Multiple freeze–thaw cycles cause a large amount of water to move out of the starch particles, increasing their density. As shown in Figure 4(D2–G2), with an increasing number of cycles, the aggregation between particles increases due to freeze–thaw treatment, leading to the formation of larger polymer clusters, which in turn limits the action of digestive enzymes. Additionally, the freeze–thaw process causes expansion of the starch interior, dissolution of soluble substances, and redistribution of water molecules within the pores, resulting in an increase in surface area and particle concavity, which is consistent with the results of increased oil and water retention capacity.

4. Conclusions

This study utilized starch extracted from ginger wastewater as raw material and investigated the effects of freeze–thaw cycles on the physicochemical properties of resistant starch, including its content, digestive characteristics, and structural changes. The results showed that the freeze–thaw treatment of ginger starch increased its resistant starch and amylose content, decreased the content of rapidly digestible starch, and lowered the glycemic index. In terms of physicochemical properties, freeze–thawed starch showed lower swelling power, peak viscosity, and breakdown viscosity, and higher solubility and thermal stability than gelatinized ginger starch. Ginger starch treated with seven freeze–thaw cycles showed the highest oil-holding capacity, which was confirmed by FTIR and microscopic structure analysis. The above results suggest that freeze–thaw treatment accelerates the retrogradation of starch, causing the starch particles to aggregate and the molecular chains to rearrange into a dense network structure, making it difficult for digestive enzymes to hydrolyze. This not only changes the physicochemical properties of starch but also leads to high resistance starch content, low digestibility, and good oil-holding properties, reflecting the characteristics of dietary fiber and its potential as a low-GI food. This technology is expected to benefit the development of ginger starch raw materials and can be used for developing healthy foods, thereby enhancing the value–added application of ginger starch and achieving the benefit of waste recycling.

Author Contributions

W.-C.C. and Y.-C.W. performed the design for the framework of the study and analyzed the data. Y.-C.W. and Y.-C.L. determined most of the experimental assays, and W.-C.C. revised the manuscript. F.-L.H. and W.-C.C. participated in the study design and provided certain scientific suggestions and draft corrections. The corresponding author W.-C.C. was responsible for financial resources and funds for the project, the supervision of the research activities, and the manuscript’s submission. All authors have read and agreed to the published version of the manuscript.

Funding

This research work and subsidiary spending were supported by the Ministry of Science and Technology of the Republic of China (ROC), Taiwan, No. MOST 111-2221-E-415-001.

Institutional Review Board Statement

Not applicable.

Informed Consent Statement

Not applicable.

Data Availability Statement

The data presented in this study are available on request from the corresponding author.

Conflicts of Interest

The authors declare no conflict of interest.

References

  1. Afshari, A.T.; Shirpoor, A.; Farshid, A.; Saadatian, R.; Rasmi, Y.; Saboory, E.; Ilkhanizadeh, B.; Allameh, A. The effect of ginger on diabetic nephropathy, plasma antioxidant capacity and lipid peroxidation in rats. Food Chem. 2007, 101, 148–153. [Google Scholar] [CrossRef]
  2. Gao, Y.; Ozel, M.Z.; Dugmore, T.; Sulaeman, A.; Matharu, A.S. A biorefinery strategy for spent industrial ginger waste. J. Hazard Mater. 2021, 401, 123400. [Google Scholar] [CrossRef] [PubMed]
  3. He, Y.; Ye, F.; Tao, J.; Zhang, Z.; Zhao, G. Ozone exposure tunes the physicochemical properties of sweet potato starch by modifying its molecular structure. Int. J. Biol. Macromol. 2023, 236, 124002. [Google Scholar] [CrossRef]
  4. Braga, M.E.M.; Moreschi, S.R.M.; Meireles, M.A.A. Effects of supercritical fluid extraction on Curcuma longa L. and Zingiber officinale R. starches. Carbohydr. Polym. 2006, 63, 340–346. [Google Scholar] [CrossRef]
  5. Englyst, H.N.; Kingman, S.M.; Cummings, J.H. Classification and measurement of nutritionally important starch fractions. Eur. J. Clin. Nutr. 1992, 46, 33–50. [Google Scholar]
  6. Snelson, M.; Jong, J.; Manolas, D.; Kok, S.; Louise, A.; Stern, R.; Kellow, N. Metabolic effects of resistant starch type 2: A systematic literature review and meta-analysis of randomized controlled trials. Nutrients 2019, 11, 1833. [Google Scholar] [CrossRef] [PubMed] [Green Version]
  7. Rawi, M.H.; Abdullah, A.; Ismail, A.; Sarbini, S.R. Manipulation of gut microbiota using Acacia gum polysaccharide. ACS Omega 2021, 6, 17782–17797. [Google Scholar] [CrossRef] [PubMed]
  8. Liu, S.; Lin, L.; Shen, M.; Wang, W.; Xiao, Y.; Xie, J. Effect of mesona chinensis polysaccharide on the pasting, thermal and rheological properties of wheat starch. Int. J. Biol. Macromol. 2018, 118, 945–951. [Google Scholar] [CrossRef]
  9. Park, E.Y.; Baik, B.K.; Lim, S.T. Influences of temperature-cycled storage on retrogradation and in vitro digestibility of waxy maize starch gel. J. Cereal Sci. 2009, 50, 43–48. [Google Scholar] [CrossRef]
  10. Elfstrand, L.; Frigard, T.; Andersson, R.; Eliasson, A.C.; Jonsson, M.; Reslow, M.; Wahlgren, M. Recrystallisation behaviour of native and processed waxy maize starch in relation to the molecular characteristics. Carbohydr. Polym. 2004, 57, 389–400. [Google Scholar] [CrossRef]
  11. Liu, Y.; Gao, J.; Wu, H.; Gou, M.; Jing, L.; Zhao, K.; Zhang, B.; Zhang, G.; Li, W. Molecular, crystal and physicochemical properties of granular waxy corn starch after repeated freeze-thaw cycles at different freezing temperatures. Int. J. Biol. Macromol. 2019, 133, 346–353. [Google Scholar] [CrossRef] [PubMed]
  12. Wang, S.; Hu, X.P.; Wang, Z.; Bao, Q.Q.; Zhou, B.; Li, T.P.; Li, S.H. Preparation and characterization of highly lipophilic modified potato starch by ultrasound and freeze-thaw treatments. Ultrason. Sonochem. 2020, 64, 105054. [Google Scholar] [CrossRef]
  13. Wang, M.; Bai, X.; Jiang, Y.; Lang, S.; Yu, L. Preparation and characterization of low oil absorption starch via freeze-thawing. Carbohydr. Polym. 2019, 211, 266–271. [Google Scholar] [CrossRef] [PubMed]
  14. Knutson, C.A. Evaluation of variations in amylose–iodine absorbance spectra. Carbohydr. Polym. 2000, 42, 65–72. [Google Scholar] [CrossRef]
  15. Zhang, X.W.; Zhang, Y.T.; Xu, Z.; Liu, W.M.; Gao, B.Y.; Xie, J.H.; Chen, T.T.; Li, E.P.; Li, B.G.; Li, C. The addition of crosslinked corn bran arabinoxylans with different gelling characteristics was associated with the pasting, rheological, structural, and digestion properties of corn starch. J. Biol. Macromol. 2023, 236, 123906. [Google Scholar] [CrossRef]
  16. Goñi, I.; Garcia-Alonso, A.; Saura-Calixto, F. A starch hydrolysis procedure to estimate glycemic index. Nutr. Res. 1997, 17, 427–437. [Google Scholar] [CrossRef]
  17. Sangnark, A.; Noomhorm, A. Effect of particle sizes on functional properties of dietary fibre prepared from sugarcane bagasse. Food Chem. 2003, 80, 221–229. [Google Scholar] [CrossRef]
  18. Ye, J.; Luo, S.; Huang, A.; Chen, J.; Liu, C.; McClements, D. Synthesis and characterization of citric acid esterified rice starch by reactive extrusion: A new method of producing resistant starch. Food Hydrocoll. 2019, 92, 135–142. [Google Scholar] [CrossRef]
  19. Qi, Q.T.; Hong, Y.; Zhang, Y.Y.; Gu, Z.B.; Cheng, L.; Li, Z.F.; Li, C.M. Effect of cassava starch structure on scalding of dough and baking expansion ability. Food Chem. 2021, 352, 129350. [Google Scholar] [CrossRef]
  20. Sun, G.; Ni, P.; Lam, E.; Hrapovic, S.; Bing, D.; Yu, B.; Ai, Y. Exploring the functional attributes and in vitro starch and protein digestibility of pea flours having a wide range of amylose content. Food Chem. 2023, 405, 134938. [Google Scholar] [CrossRef]
  21. Shah, A.; Masoodi, F.A.; Gani, A.; Ashwar, B.A. In-vitro digestibility, rheology, structure, and functionality of RS3 from oat starch. Food Chem. 2016, 212, 749–758. [Google Scholar] [CrossRef] [PubMed]
  22. Takeda, Y.; Tokunaga, N.; Takeda, C.; Hizukuri, S. Physicochemical properties of sweet potato starches. Starch Stärke 1986, 38, 345–350. [Google Scholar] [CrossRef]
  23. Hoover, R. Composition, molecular structure, and physicochemical properties of tuber and root starches: A review. Carbohydr. Polym. 2001, 45, 253–267. [Google Scholar] [CrossRef]
  24. Dundar, A.N.; Gocmen, D. Effects of autoclaving temperature and storing time on resistant starch formation and its functional and physicochemical properties. Carbohydr. Polym. 2013, 97, 764–771. [Google Scholar] [CrossRef] [Green Version]
  25. Hasjim, J.; Ai, Y.; Jane, J.L. Novel Applications of Amylose-Lipid Complex as Resistant Starch Type 5. In Resistant Starch; Wiley: Hoboken, NJ, USA, 2013; pp. 79–94. [Google Scholar]
  26. Brand-Miller, J.C.; Stockmann, K.; Atkinson, F.; Petocz, P.; Denyer, G. Glycemic index, postprandial glycemia, and the shape of the curve in healthy subjects: Analysis of a database of more than 1000 foods. Am. J. Clin. Nutr. 2019, 89, 97–105. [Google Scholar] [CrossRef] [PubMed] [Green Version]
  27. Aggarwal, P.; Dollimore, D. A thermal analysis investigation of partially hydrolyzed starch. Thermochim. Acta 1998, 319, 17–25. [Google Scholar] [CrossRef]
  28. Chen, B.R.; Teng, Y.X.; Wang, L.H.; Xu, F.Y.; Li, Y.; Wen, Q.H.; Wang, R.; Li, J.; Wang, Z.; Zeng, X.A. Pulsed electric field-assisted esterification improves the freeze-thaw stability of corn starch gel by changing its molecular structure. J. Biol. Macromol. 2023, 231, 123085. [Google Scholar] [CrossRef]
  29. Baixauli, R.; Salvador, A.; Martínez-Cervera, S.; Fiszman, S.M. Distinctive sensory features introduced by resistant starch in baked products. LWT Food Sci. Technol. 2008, 41, 1927–1933. [Google Scholar] [CrossRef]
  30. Li, X.; Chen, W.; Chang, Q.; Zhang, Y.; Zheng, B.; Zeng, H. Structural and physicochemical properties of ginger (Rhizoma curcumae longae) starch and resistant starch: A comparative study. Int. J. Biol. Macromol. 2020, 144, 67–75. [Google Scholar] [CrossRef]
  31. Liu, H.S.; Yu, L.; Xie, F.W.; Chen, L. Gelatinization of cornstarch with different amylose/amylopectin content. Carbohydr. Polym. 2006, 65, 357–363. [Google Scholar] [CrossRef]
  32. Tao, H.; Zhang, B.; Wu, F.F.; Jin, Z.Y.; Xu, X.M. Effect of multiple freezing/thawing-modified wheat starch on dough properties and bread quality using a reconstitution system. J. Cereal Sci. 2016, 69, 132–137. [Google Scholar] [CrossRef]
  33. Du, K.; Jiang, H.X.; Yu, X.Z.; Jane, J.L. Physicochemical and functional properties of whole legume flour. LWT Food Sci. Technol. 2014, 55, 308–313. [Google Scholar] [CrossRef]
  34. Jyothi, A.N.; Moorthy, S.N.; Vimala, B. Physicochemical and functional properties of starch from two species of Curcuma. Int. J. Food Prop. 2007, 6, 135–145. [Google Scholar] [CrossRef]
  35. Huang, T.T.; Zhou, D.N.; Jin, Z.Y.; Xu, X.M.; Chen, H.Q. Effect of repeated heat-moisture treatments on digestibility, physicochemical and structural properties of sweet potato starch. Food Hydrocoll. 2016, 54, 202–210. [Google Scholar] [CrossRef]
  36. Zhao, A.Q.; Yu, L.; Yang, M.; Wang, C.J.; Wang, M.M.; Bai, X. Effects of the combination of freeze-thawing and enzymatic hydrolysis on the microstructure and physicochemical properties of porous corn starch. Food Hydrocoll. 2018, 83, 465–472. [Google Scholar] [CrossRef]
  37. He, H.; Chi, C.; Xie, F.; Li, X.; Liang, Y.; Chen, L. Improving the in vitro digestibility of rice starch by thermomechanically assisted complexation with guar gum. Food Hydrocoll. 2020, 102, 123130. [Google Scholar] [CrossRef]
  38. Szymońska, J.; Krok, F.; Komorowska-Czepirska, E.; Rębilas, K. Modification of granular potato starch by multiple deep-freezing and thawing. Carbohydr. Polym. 2003, 52, 1–10. [Google Scholar] [CrossRef]
  39. Bogracheva, T.Y.; Wang, Y.L.; Hedley, C.L. The effect of water content on the ordered/disordered structures in starches. Biopolymers 2001, 58, 247–259. [Google Scholar] [CrossRef]
  40. Chung, H.J.; Jeong, H.Y.; Lim, S.T. Effects of acid hydrolysis and defatting on crystallinity and pasting properties of freeze-thawed high amylose corn starch. Carbohydr. Polym. 2003, 54, 449–455. [Google Scholar] [CrossRef]
  41. Yang, Y.; Zheng, S.S.; Li, Z.; Pan, Z.; Huang, Z.M.; Zhao, J.Z.; Ai, Z. Influence of three types of freezing methods on physicochemical properties and digestibility of starch in frozen unfermented dough. Food Hydrocoll. 2021, 115, 106619. [Google Scholar] [CrossRef]
  42. Mishra, S.; Rai, T. Morphology and functional properties of corn, potato and tapioca starches. Food Hydrocoll. 2006, 20, 557–566. [Google Scholar] [CrossRef]
  43. Huang, J.; Zhao, L.; Man, J.; Wang, J.; Zhou, W.; Huai, H.; Wei, C. Comparison of physicochemical properties of B-type nontraditional starches from different sources. Int. J. Biol. Macromol. 2015, 78, 165–172. [Google Scholar] [CrossRef] [PubMed]
  44. Xiao, H.; Wang, S.; Xu, W.; Yin, Y.; Xu, D.; Zhang, L.; Liu, G.Q.; Luo, F.; Sun, S.; Lin, Q.; et al. The study on starch granules by using darkfield and polarized light microscopy. J. Food Compos. Anal. 2020, 92, 103576. [Google Scholar] [CrossRef]
  45. Bogracheva, T.Y.; Meares, C.; Hedley, C.L. The effect of heating on the thermodynamic characteristics of potato starch. Carbohydr. Polym. 2006, 63, 323–330. [Google Scholar] [CrossRef]
  46. Cai, C.; Wei, C. In situ observation of crystallinity disruption patterns during starch gelatinization. Carbohydr. Polym. 2013, 92, 469–478. [Google Scholar] [CrossRef] [PubMed]
  47. Tahir, R.; Ellis, P.P.; Bogracheva, T.Y.; Meares-Taylor, C.; Butterworth, P.J. Study of the structure and properties of native and hydrothermally processed wild-type, Iam, and Variant pea starch that affect amylolysis of these starches. Biomacromolecules 2011, 12, 123–133. [Google Scholar] [CrossRef]
Figure 1. Swelling power (A), solubility (B), water (C), and oil holding capacity (D) of ginger starch with native and different treatment. All values are the mean ± SD (n = 3). a–d means with different letters within the same column are significant (p < 0.05).
Processes 11 01828 g001
Figure 2. Thermal properties of ginger starch with native and different treatments. All values are the mean ± SD (n = 3). Native: unmodified starch; GS: ginger starch gelatinized at 100 °C for 20 min; FT0: ginger starch untreated with freeze–thaw; FT1: ginger starch treated with first freeze–thaw cycle; FT3: ginger starch treated with third freeze–thaw cycle; FT5: ginger starch treated with five freeze–thaw cycle; FT7: ginger starch treated with seventh freeze–thaw cycle.
Processes 11 01828 g002
Figure 3. FTIR spectra (A) and X–ray diffraction pattern (B) of ginger starch with native and different treatment. All values are the mean ± SD (n = 3). Native: unmodified starch; GS: ginger starch gelatinized at 100 °C for 20 min; FT0: ginger starch untreated with freeze–thaw; FT1: ginger starch treated with first freeze–thaw cycle; FT3: ginger starch treated with third freeze–thaw cycle; FT5: ginger starch treated with five freeze–thaw cycle; FT7: ginger starch treated with seventh freeze–thaw cycle.
Processes 11 01828 g003
Figure 4. SEM images (1000×: (A1G1);2000×: (A2G2)) and polarizing light microscope graphs (100 µm: (A3G3); 10 µm: (A4G4)) of ginger starch with native and different treatment (A: Native; B: GS; C: FT0; D: FT1; E: FT3; F: FT5; G: FT7).
Processes 11 01828 g004
Table 1. Composition analysis of ginger starch with native and different treatments.
ParameterTS (g/100 g)RDS (%)SDS (%)RS (g/100 g)Amylose (%)eGI
Native73.31 ± 0.57 a1.77 ± 0.46 c11.73 ± 0.18 f63.05 ± 0.16 a30.93 ± 0.87 abc26.50 ± 0.47 g
GS70.98 ± 0.78 b39.85 ± 0.66 a23.01 ± 0.54 a8.50 ± 0.11 e28.22 ± 0.27 d115.09 ± 0.99 a
FT067.98 ± 0.37 c3.49 ± 0.50 b17.06 ± 1.16 d59.29 ± 0.44 b31.92 ± 0.88 a32.11 ± 0.78 ef
FT164.16 ± 1.28 d1.39 + 0.13 c20.27 ± 0.71 b56.29 ± 0.63 d29.93 ± 0.54 c40.23 ± 0.66 b
FT364.54 ± 0.06 d1.02 ± 0.13 c19.13 ± 0.33 c57.34 ± 0.33 c30.68 ± 0.25 bc37.42 ± 0.71 c
FT569.10 ± 1.00 c0.95 ± 0.24 c17.39 ± 0.31 d57.99 ± 0.56 c30.67 ± 0.55 bc34.16 ± 0.60 d
FT770.85 ± 0.53 b1.06 ± 0.30 c15.70 ± 0.20 e58.86 ± 0.56 b31.54 ± 0.46 ab32.39 ± 0.21 e
All values are the mean ± SD (n = 3). a–g means with different letters within the same column are significant (p < 0.05). TS: total starch; RDS: rapidly digestible starch; SDS; slowly digestible starch; RS: resistant starch; eGI: estimated glycemic index. Native: unmodified starch; GS: ginger starch gelatinized at 100 °C for 20 min; FT0: ginger starch untreated with freeze–thaw; FT1: ginger starch treated with first freeze–thaw cycle; FT3: ginger starch treated with third freeze–thaw cycle; FT5: ginger starch treated with five freeze–thaw cycle; FT7: ginger starch treated with seventh freeze–thaw cycle.
Table 2. Pasting properties of ginger starch with native and different treatments.
ParameterPeak Temperature (°C)Peak Viscosity (Pa·s)Trough Viscosity (Pa·s)Final Viscosity (Pa·s)Breakdown (BD)Setback (SB)
NATIVE89.6 ± 0.28 a1.55 ± 0.08 c1.55 ± 0.08 c3.11 ± 0.27 c0.01 ± 0.00 b1.56 ± 0.19 c
GS76.5 ± 0.00 b3.89 ± 0.10 a3.48 ± 0.08 a7.08 ± 0.20 a0.41 ± 0.03 a3.60 ± 0.12 a
FT089.3 ± 0.21 a1.65 ± 0.01 bc1.65 ± 0.01 bc3.34 ± 0.01 bc0.00 b1.69 ± 0.00 bc
FT189.6 ± 0.28 a1.66 ± 0.03 bc1.66 ± 0.03 bc3.44 ± 0.00 bc0.00 b1.79 ± 0.21 bc
FT389.6 ± 0.28 a1.72 ± 0.01 bc1.72 ± 0.01 b3.65 ± 0.09 b0.00 b1.93 ± 0.08 b
FT590.1 ± 0.92 a1.74 ± 0.07 b1.74 ± 0.07 b3.71 ± 0.28 b0.00 b1.97 ± 0.21 b
FT790.3 ± 0.64 a1.73 ± 0.14 bc1.73 ± 0.14 b3.75 ± 0.42 b0.00 b2.02 ± 0.28 b
All values are the mean ± SD (n = 3). a–c means with different letters within the same column are significant (p < 0.05). Native: unmodified starch; GS: finger starch gelatinized at 100 °C for 20 min; FT0: ginger starch untreated with freeze–thaw; FT1: ginger starch treated with first freeze–thaw cycle; FT3: ginger starch treated with third freeze–thaw cycle; FT5: ginger starch treated with five freeze–thaw cycle; FT7: ginger starch treated with seventh freeze–thaw cycle.
Disclaimer/Publisher’s Note: The statements, opinions and data contained in all publications are solely those of the individual author(s) and contributor(s) and not of MDPI and/or the editor(s). MDPI and/or the editor(s) disclaim responsibility for any injury to people or property resulting from any ideas, methods, instructions or products referred to in the content.

