Article

Simulation of Rock Electrical Properties in Deep Reservoirs Based on Digital Rock Technology

1
Tianjin Branch of China National Offshore Oil Corporation Ltd., Tianjin 300459, China
2
Bohai Oilfield Research Institute, Tianjin Branch, China National Offshore Oil Corporation Ltd., Tianjin 300459, China
3
Well-Tech Department, China Oilfield Services Limited, COSL, Sanhe 065201, China
4
China National Offshore Oil Corporation EnerTech-Drilling & Production Co., Tianjin 300452, China
5
Frontiers Science Center for Deep Ocean Multispheres and Earth System, Key Lab of Submarine Geosciences and Prospecting Techniques, MOE and College of Marine Geosciences, Ocean University of China, Qingdao 266100, China
6
Deep-Sea Multidisciplinary Research Center, National Laboratory for Marine Science and Technology (Qingdao), Qingdao 266237, China
7
School of Geosciences, China University of Petroleum (East China), Qingdao 266580, China
*
Authors to whom correspondence should be addressed.
Processes 2023, 11(6), 1758; https://doi.org/10.3390/pr11061758
Submission received: 5 May 2023 / Revised: 6 June 2023 / Accepted: 7 June 2023 / Published: 9 June 2023

Abstract

:
Deep reservoirs are in a high-pressure and high-temperature (HPHT) environment, while the experimental conditions for rock electrical properties that meet the deep reservoir conditions are harsh and costly. Although digital rock technology can simulate the electrical properties of rocks, it is limited to electrical simulation studies under normal temperature and pressure conditions (NPT), which limits their ability to capture the electrical characteristics of deep hydrocarbon reservoirs. This limitation affects the accuracy of saturation prediction based on resistivity logging. To simulate the rock electrical properties under HPHT conditions, we proposed a low-cost and high-efficiency HPHT digital rock electrical simulation workflow. Firstly, samples from deep formations were CT-scanned and used to construct multi-component digital rocks that reflect the real microstructure of the samples. Then, mathematical morphology was used to simulate the overburden correction under high-pressure conditions, and the changes in the conductivity of formation water and clay minerals at different temperatures were used to simulate the conductivity changes of rock components under high-temperature conditions. To carry out the electrical simulation of digital rock in deep reservoirs, a numerical simulation condition for HPHT in deep layers was established, and the finite element method (FEM) was used. Finally, based on the equivalent changes in the conductivity of different components, the effects of clay minerals and formation water under HPHT conditions on rock electrical properties were studied and applied to predict the water saturation based on well logging data. We found that considering the influence of temperature, salinity, and clay type, the saturation index (n) of the rock depends on the ratio of the clay conductivity to the formation water conductivity. The larger the ratio is, the smaller the value of n. In addition, the average relative error between the predicted water saturation under HPHT conditions and the sealed coring analysis was 6.8%, which proved the accuracy of the proposed method. Overall, this method can effectively simulate the pressure and temperature environment of deep formations, reveal the electrical conductivity mechanisms of rocks under formation pressure and temperature conditions, and has promising prospects for the study of rock physical properties and reservoir evaluation in deep formations.

1. Introduction

With the increasing demand for oil and gas resources, oil and gas exploration has expanded to deep formations, making the deep strata a key target and research hotspot. To address the difficulties encountered in the accurate prediction and quantitative evaluation of deep reservoirs, it is necessary to conduct systematic and quantitative research on the micro characteristics of such reservoirs and their effects on electrical properties. Research methods for the electrical characteristics of deep mainly include rock electrical experiments and numerical simulations [1,2,3,4]. With the advancement of experimental techniques and equipment, both rock physics experiments and numerical simulation techniques have made significant progress. Deep oil and gas geological conditions are complex and fall under high pressure and high temperature (HPHT) conditions, and conventional rock physics experiments and numerical simulations cannot meet scientific research needs under deep conditions. Therefore, conducting HPHT rock physics experiments and numerical simulations to study the electrical and acoustic characteristics of rocks under real geological conditions is of great significance. Under HPHT conditions, rock electrical parameters and well logging response parameters such as density and acoustic time have certain differences from those under normal pressure and temperature (NPT), and some parameters do not have clear variations with pressure and temperature, which poses certain difficulties for oil and gas identification and reserve calculation under deep HPHT conditions.
Rock electrical parameters are important for analyzing reservoir physical properties and calculating reservoir saturation. Their values are closely related to rock composition, pore structure, and the distribution of internal two-phase fluids, and they change with pressure and temperature. In recent years, scholars have carried out a large number of HPHT rock electrical experiments, developed rock conductivity measurement methods suitable for different HPHT laboratory equipment, and studied the possible factors that may affect rock electrical properties under HPHT conditions. They systematically studied the changes in rock electrical parameters under HPHT conditions, mainly from the aspects of temperature, pressure, mineral composition, water saturation, particle size, and boundary thickness, and conducted in situ measurements of the electrical conductivity of geological materials, such as hornblende gabbro, gabbro, diorite, water-bearing melt basalt, molten andesite, and carbonated melts, under HPHT conditions [5,6,7,8,9,10,11]. In the field of resource exploration, there have been many research results on the influence of pressure and temperature on rock electrical properties through laboratory measurements [12,13,14,15]. Due to different research areas, opposite conclusions can be drawn about the variation in the cementation index m with temperature. Jing et al. [16] conducted experimental measurements of sandstone under reservoir conditions and concluded that geological factors increase with increasing pressure and temperature. Mahmood et al. [17] varied the pressure and temperature of experimental measurements and found that increasing confining pressure slightly increased the rock core cementation index m and saturation index n. At low clay content, the temperature did not affect m, while n decreased with increasing temperature and varied with rock type. Li [1] measured the conductivity of sandstone samples by setting a series of pressures, temperatures, salinities, and saturations. It was found that pressure had a minor effect on the properties of sandstone samples, while temperature and salinity had a significant effect on the conductivity of the samples.
Due to the difficulty in quantitatively analyzing the combined effects of clay mineral content and type and temperature/pressure conditions on electrical properties in HPHT rock electrical experiments, which typically measure the overall electrical resistivity of cores, there are many inconvenient factors in the study of rock conductivity mechanisms. The distribution of clay minerals in rocks affects the electrical properties of rocks [18]. For example, pure sandstone exhibits hydrophilic wetting properties, while clay minerals such as chlorite may cause the rock to exhibit some degree of hydrophobic wetting properties [19,20]. Clay minerals such as montmorillonite, illite, and kaolinite have cation exchange capacity and adsorption properties and develop certain micropores that change the conductivity of rocks and may also cause low-resistance phenomena in reservoirs [21,22]. Therefore, clarifying the influence of clay mineral content and type on the sandstone electrical properties in HPHT is of great significance for well logging interpretation of oil and gas saturation calculation and reservoir evaluation. In recent years, digital rock technology has played a significant role in the analysis of rock’s physical properties [23,24,25,26]. The most commonly used technique for studying the 3D spatial structures of porous media is X-ray micro-computed tomography (CT), which is capable of accurately identifying the structure of pores and clay mineral fractions [27,28,29]. When the constructed 3D digital rock models are combined with numerical simulation methods such as finite elements, the rock’s electrical properties can be calculated. Therefore, it is an effective means for the study of rock conductivity mechanisms. Garboczi [30] converted the problem of solving the voltage distribution of each pixel in digital rock to the problem of solving the system energy minimum based on the variational principle and ultimately determined the effective electrical conductivity of digital rock. Knackstedt et al. [31] studied the relative interconnectivity and tortuosity of pores and fluid phases in different samples and their contributions to electrical transport. Jiang et al. [32] used the finite element method (FEM) based on a digital rock to study the influence of the wetting and solubility of natural gas in the formation of water on the electrical properties of natural gas reservoir rocks. Nie et al. [33] used the FEM to simulate the electrical properties of shale digital rocks by setting the clay content and conductivity characteristics. Yan et al. [34] constructed a multi-mineral type digital rock and, based on the control variable method, studied the effects of factors such as porosity, clay content, temperature, water mineralization, heavy minerals, clay type, and wetting properties on rock electrical resistivity. Fan et al. [35] constructed a digital rock containing clay sandstone. They conducted an erosion process on the skeleton connected to the pore wall and established mud sandstones with different porosities and clay volume fractions to study the effects of clay volume fraction, clay mineral content, and water conductivity on electrical properties. Wu et al. [36] combined the discrete element method (DEM) and quadruplet structure generation set algorithm (QSGSA) to construct multi-component and multi-scale digital rocks based on pore size distribution and mineral composition percentage and studied the effects of mineral composition on rock electrical and elastic properties. Liu et al. [37] established a three-dimensional multi-mineral digital rock through multiscale imaging technology and used the FEM to study the effects of clay minerals and scanning resolution on calculated conductivity. Math2Market GmbH team used the explicit-jump immersed interface method to solve the electrical conduction and diffusion equation [38], and they found that small compressions lead to very different material properties. Previous researchers have made significant progress in HPHT rock physics experiments, and there has been significant development in the numerical simulation of the electrical properties of rocks. However, existing numerical digital rock simulation methods primarily focus on ambient temperature and pressure conditions, and there is a lack of research on the numerical simulation of rocks under HPHT conditions. This study aims to fill this research gap by conducting a digital rock simulation under HPHT conditions.
Here, low-permeability tight sandstone samples from the East China Sea shelf basin were selected for quantitative evaluation of minerals by scanning electron microscopy (QEMSCAN) and CT scanning experiments. Digital rock technology was used in combination with HPHT conditions to conduct numerical simulations of rock electrical properties. Compared to the 3D digital rock electrical simulations under NPT conditions, the key aspects of digital rock electrical simulations under HPHT conditions are the simulation of changes in rock pore structure and the variations in resistivity of different conducting components. In our study, mathematical morphology was used to simulate the overburden correction under high-pressure conditions, and the changes in the conductivity of formation water and clay minerals at different temperatures were used to simulate the conductivity changes of rock components under high-temperature conditions. The influence of factors such as clay minerals and formation water on rock electrical properties was analyzed, and the numerical simulation results were applied to calculate the water saturation from well logging data.

2. Materials and Methods

2.1. Materials

The samples were selected from the X depression in the northeastern part of the East China Sea shelf basin. The X depression is a large depression with an east fault and a west uplift, which has undergone three major evolutionary stages of faulting, folding, and regional subsidence on the pre-Palaeocene basement. The studied interval is a low-permeability tight sandstone gas reservoir in the area, with the main gas-bearing strata buried at depths greater than 3400 m. The formation has undergone strong compaction and multiple changes in the diagenetic environment due to two episodes of tectonic uplift, resulting in poor physical properties, strong heterogeneity, an anomalous pressure system, and a complex pore structure. In this study, low-permeability sandstone samples from the studied interval were selected, with burial depths greater than 3500 m and formation temperatures greater than 130 °C, belonging to HPHT formations. We collected core plug samples and conducted overburden pore permeability experiments, laboratory rock electrical experiments, QEMSCAN experiments, and CT scanning experiments. Detailed experimental information is described in the following text.

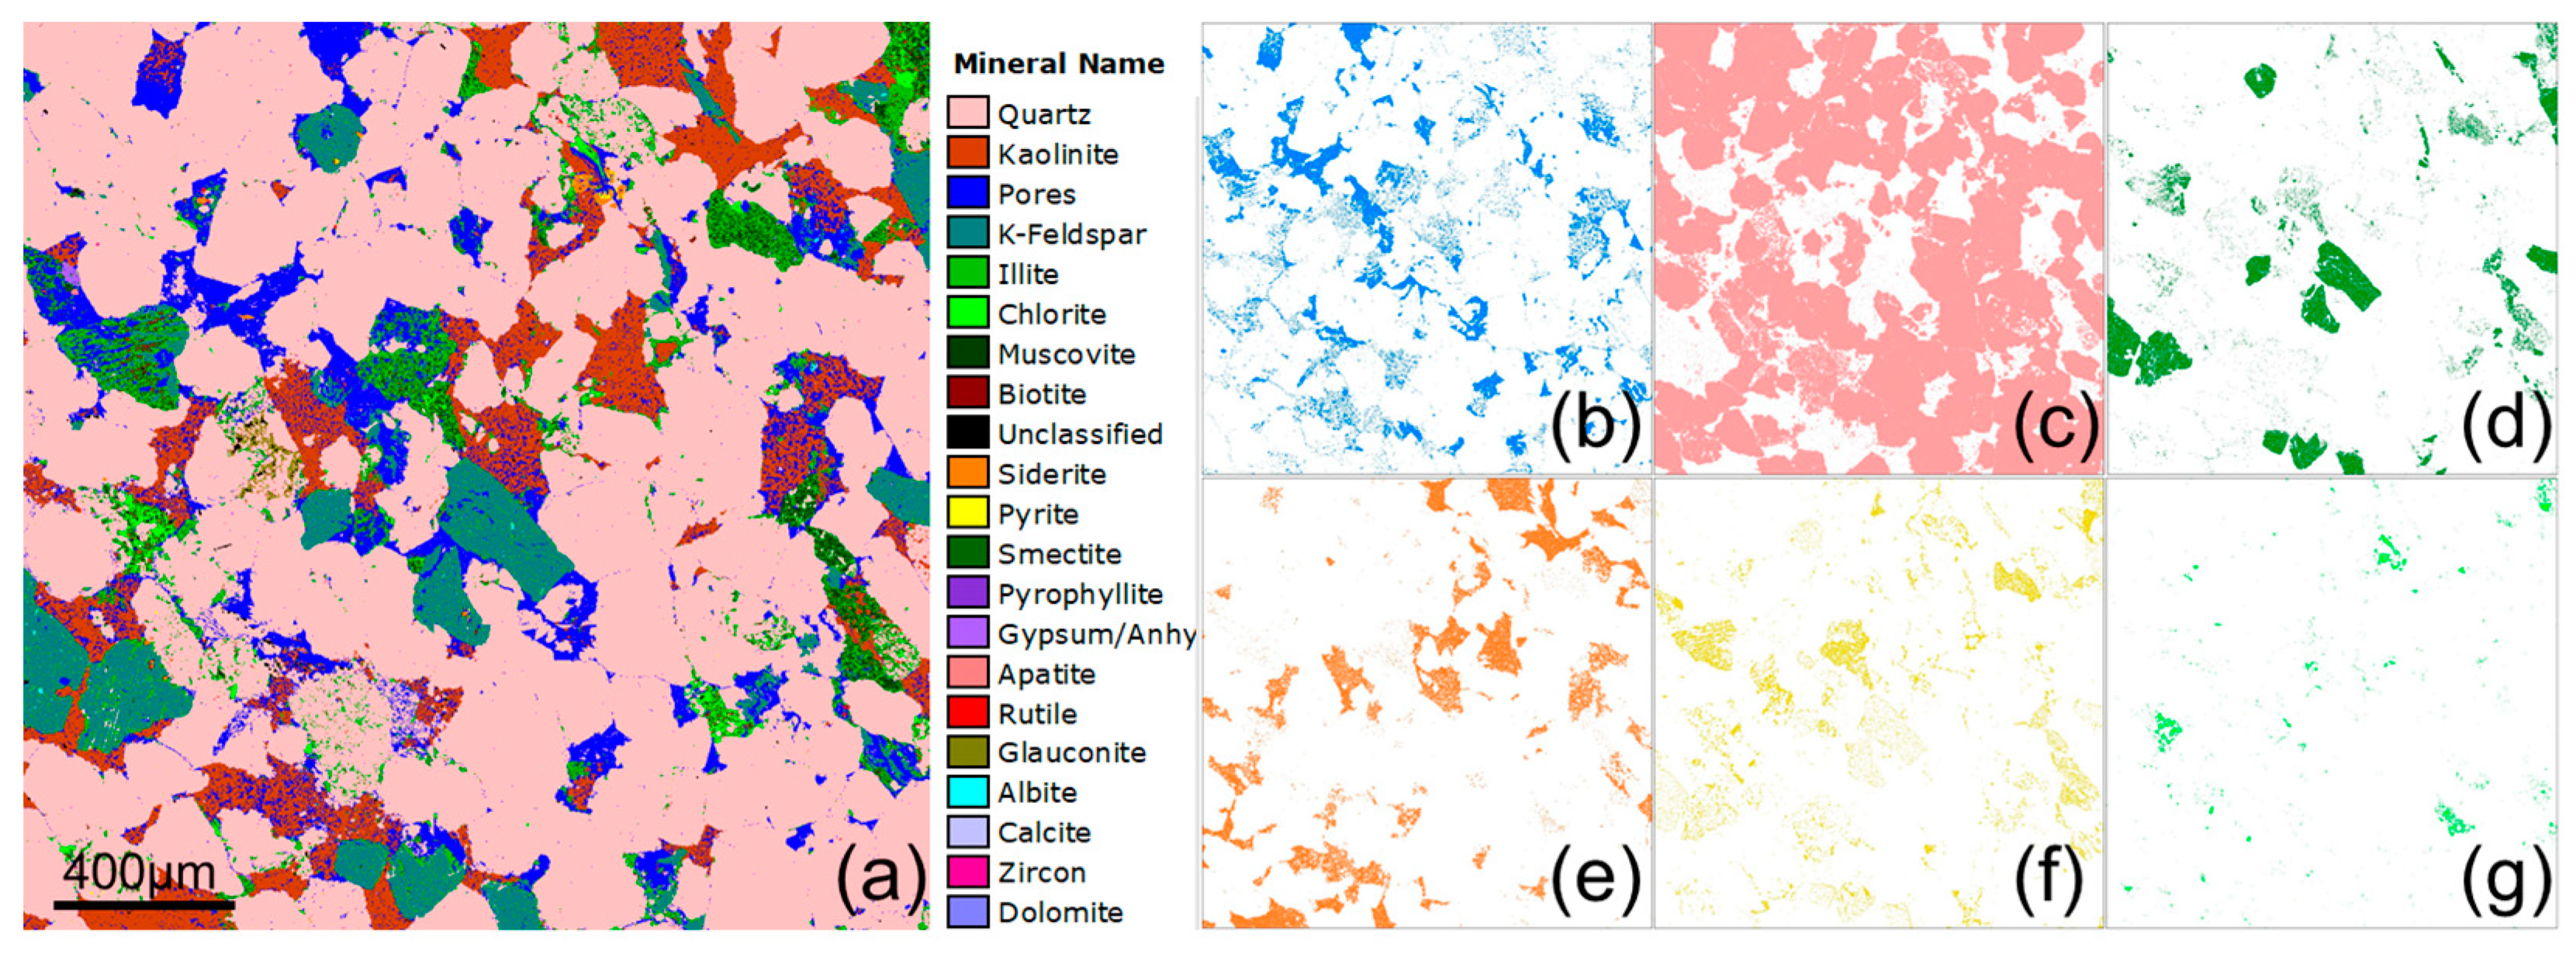
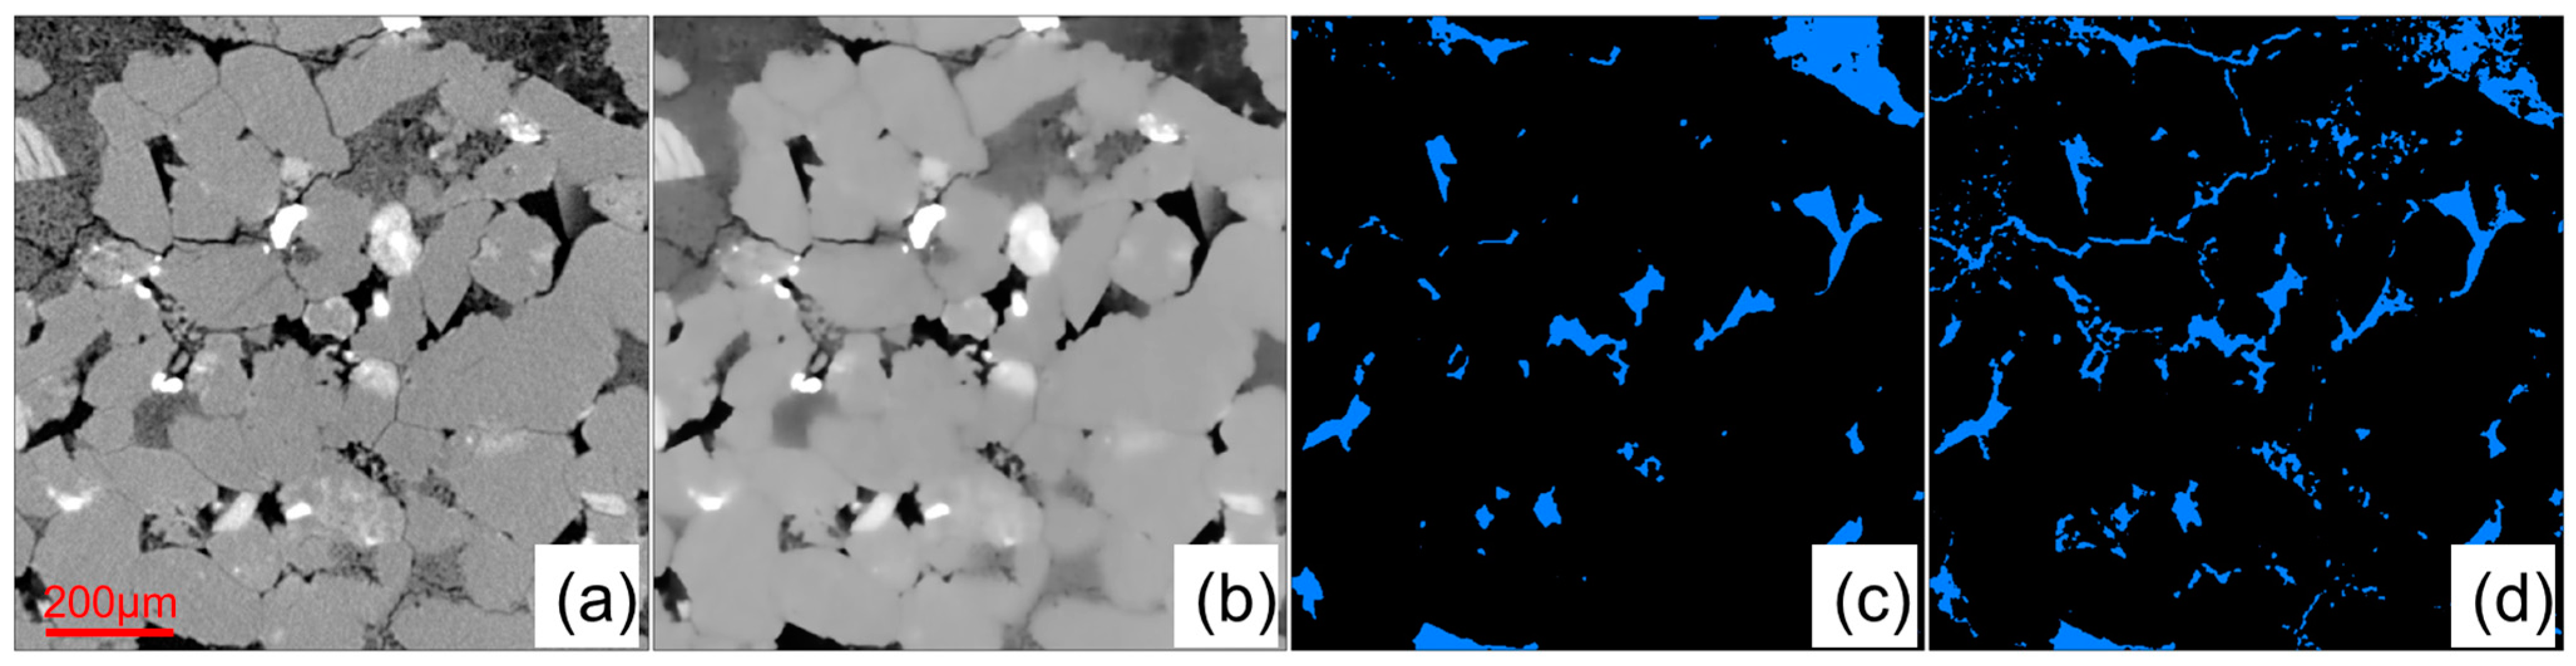
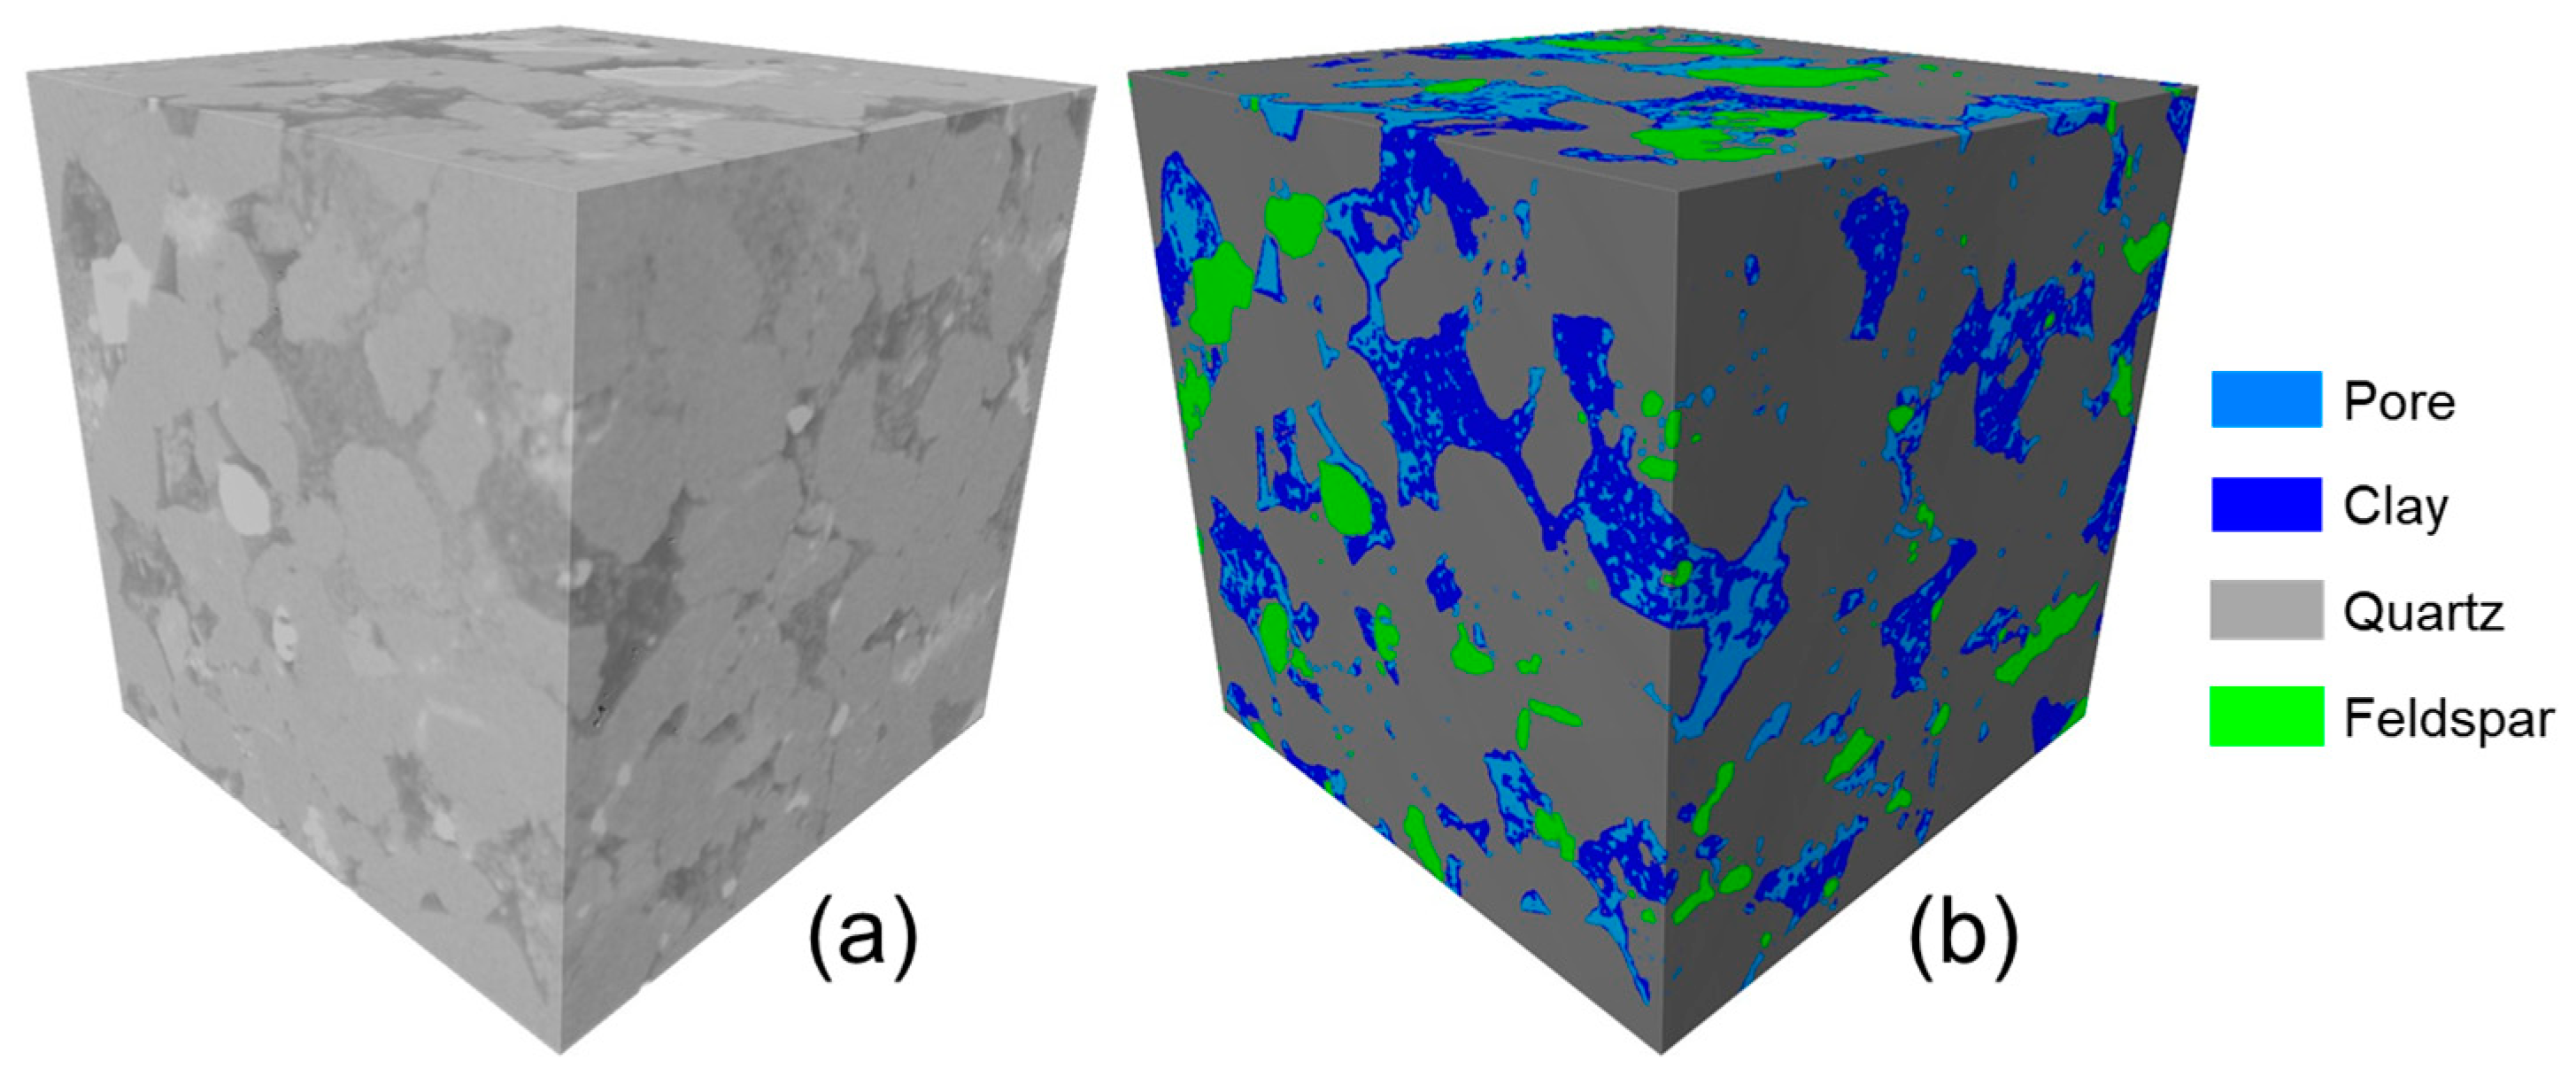
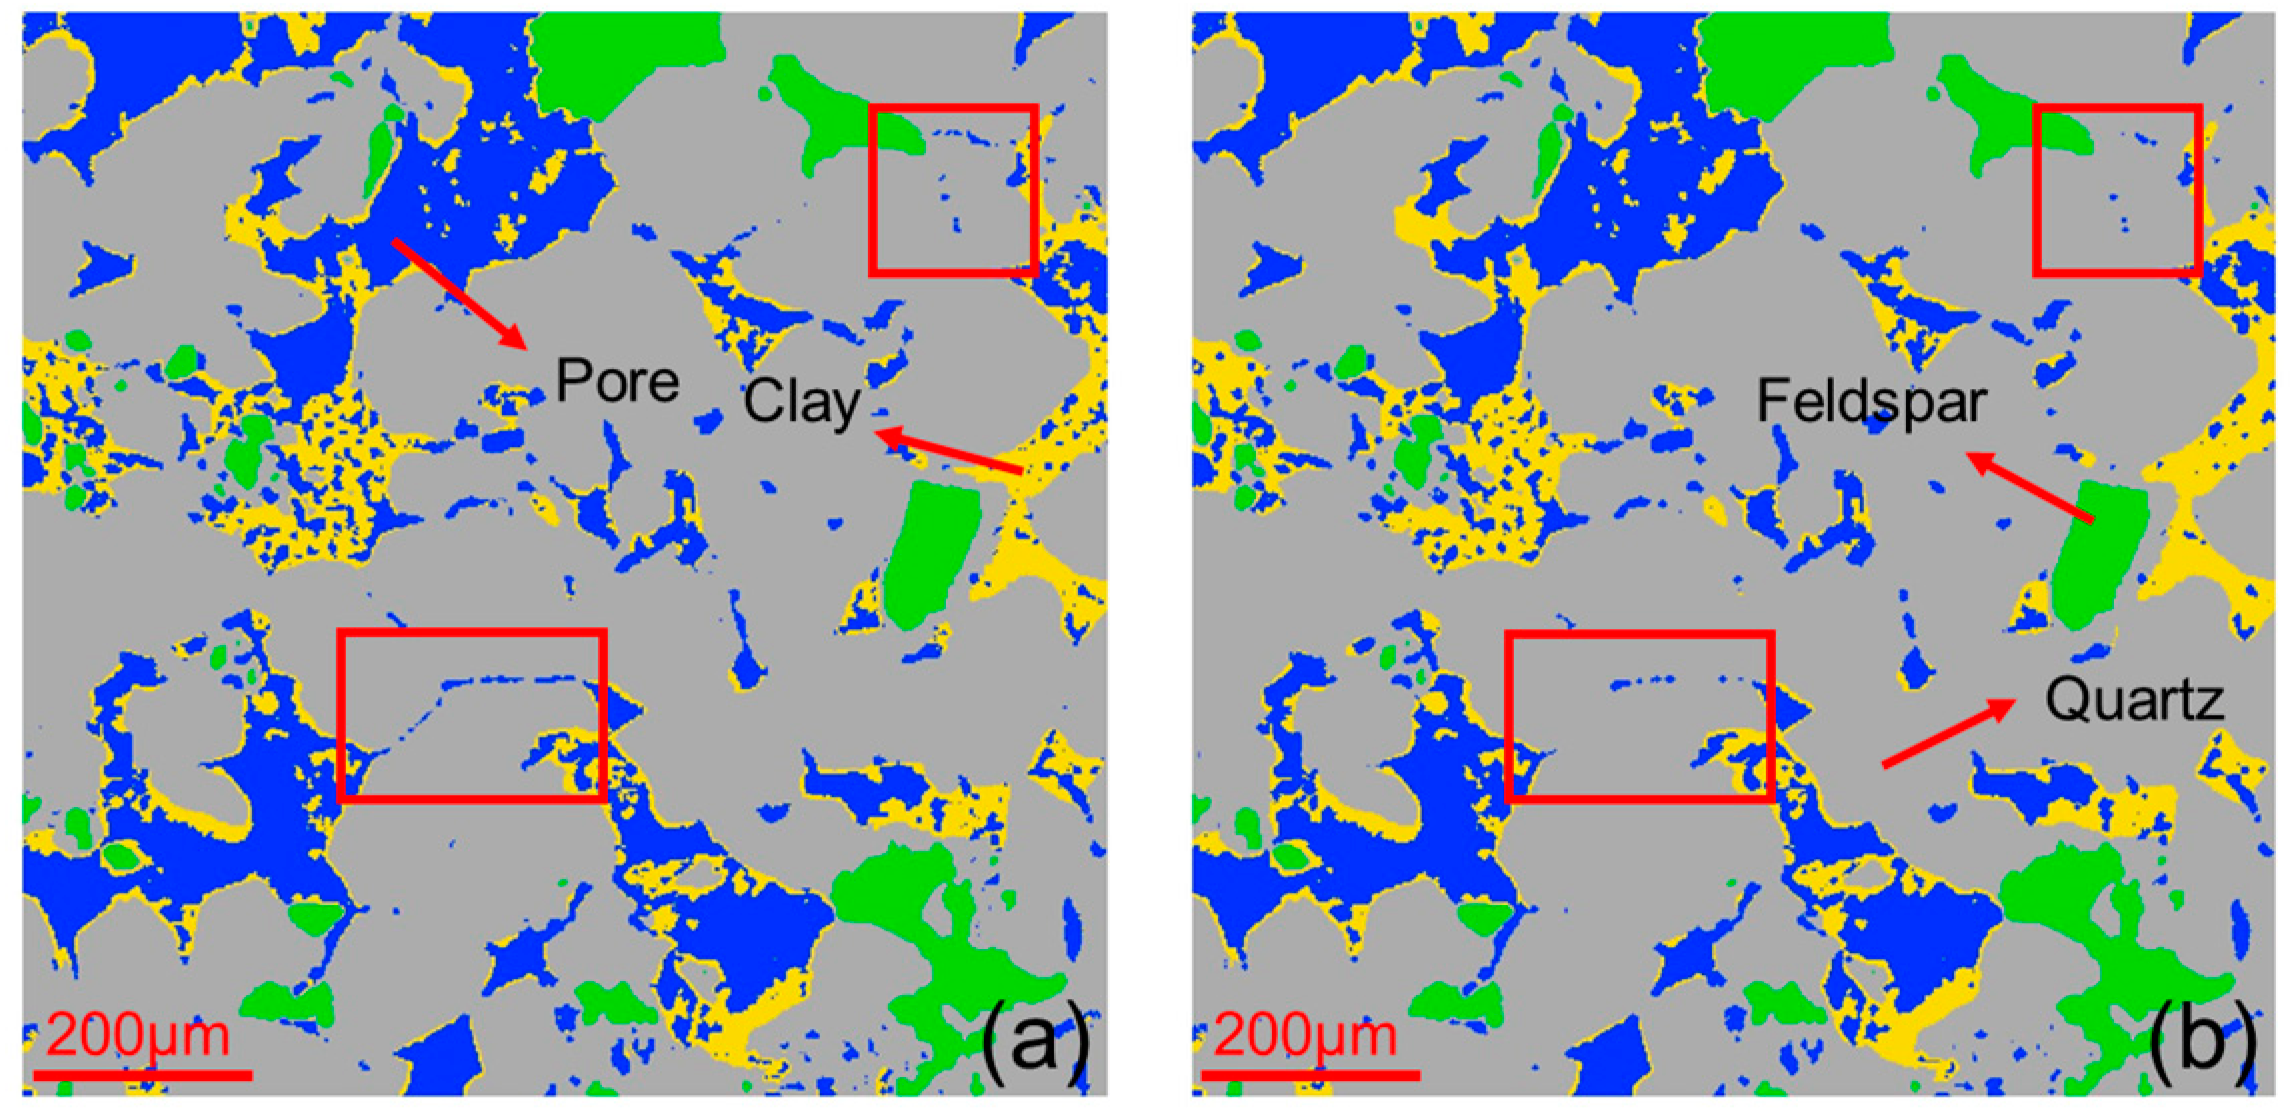
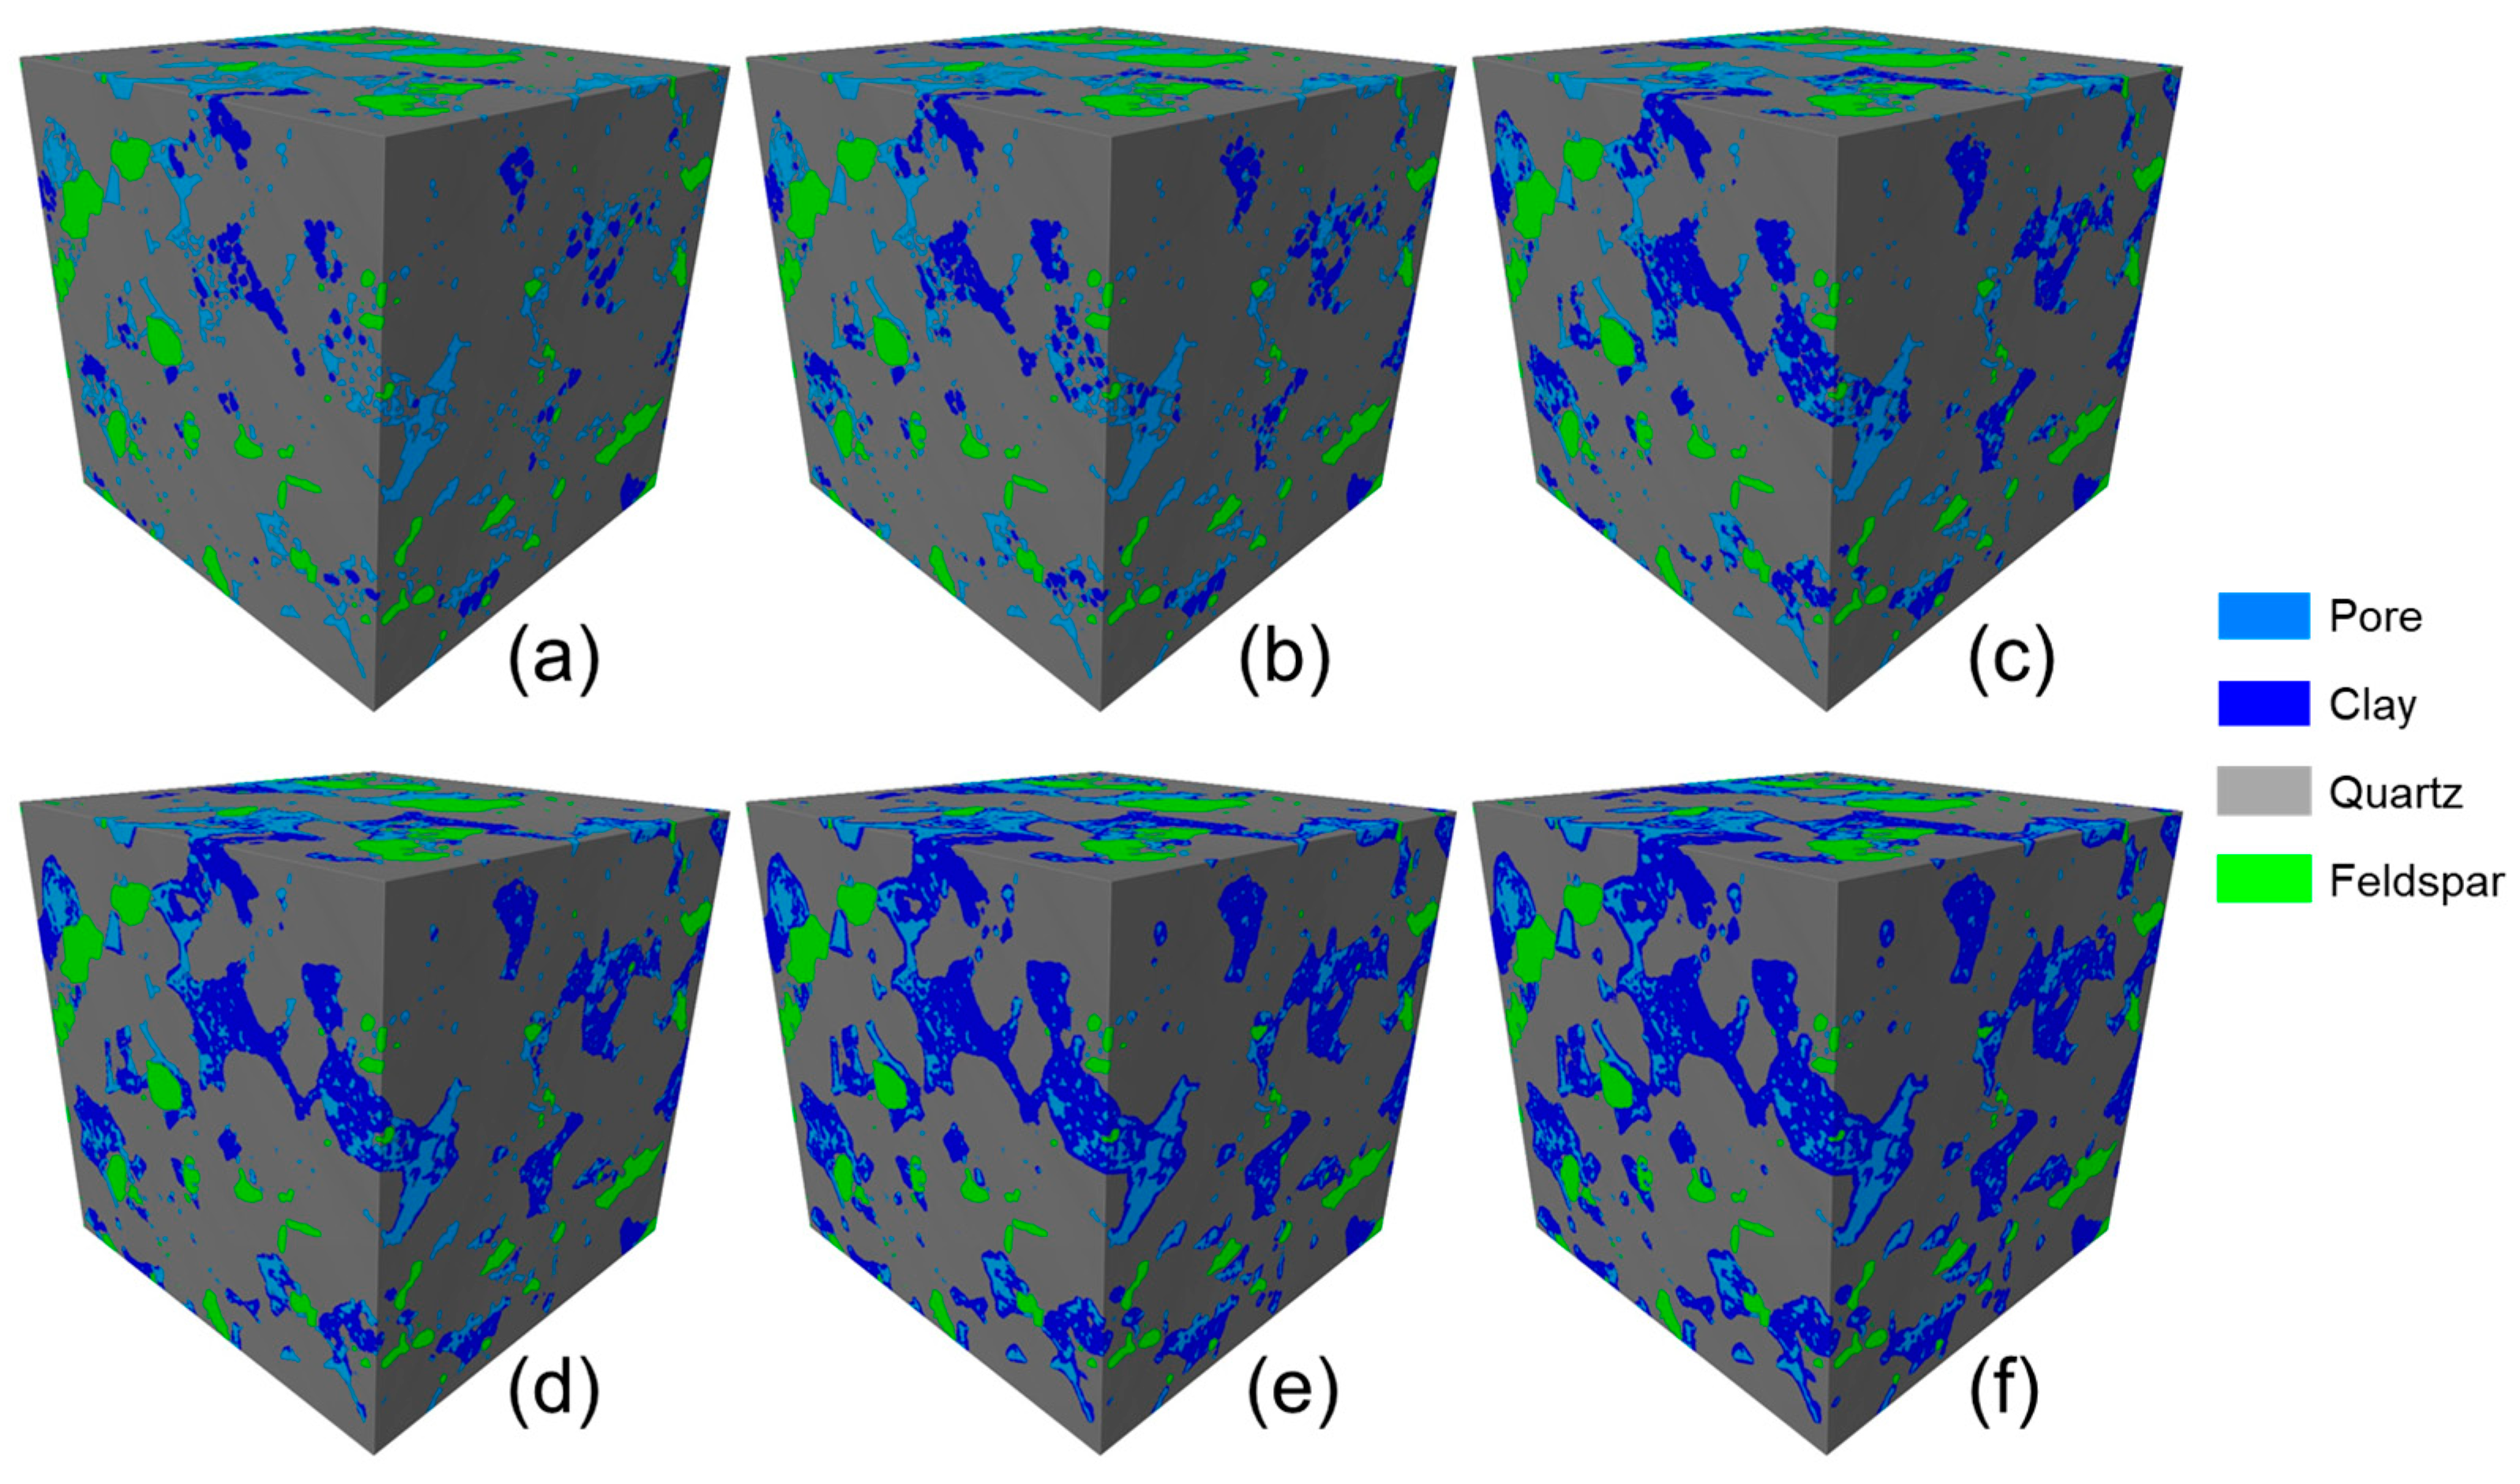
2.2. D Multi-Component Digital Rock Reconstruction

The low-permeability sandstone sample was selected for QEMSCAN scanning and CT scanning experiments to analyze the pore structure characteristics and mineral distribution. The QEMSCAN 650F rock analysis system (FEI Company, Hillsboro, OR, USA) was used to perform backscattered electron (BSE) imaging and mineral identification on samples, with an image resolution of 2 μm. The QEMSCAN test mainly reflects the 2D pore and mineral distribution of the low-permeability sandstone sample, as shown in Figure 1. The mineral scanning images were color-coded to represent pores and different minerals. Based on the proportion of different components, six main components were segmented, namely, pore, quartz, feldspar, kaolinite, illite, and chlorite. Their contents were 9.80%, 66.95%, 7.26%, 4.99%, 10.09%, and 0.91%, respectively. Figure 1 shows that the selected sandstone sample has a complex pore structure, mainly including intergranular pores and micropores in clay. The quartz appears relatively clean, while some feldspar is mixed with illite. The content of chlorite is low, and kaolinite is the predominant clay mineral with the highest content. Microscopic pores are developed in feldspar, illite, and kaolinite. Based on the QEMSCAN images, the types and proportions of pores and minerals can be determined, which provides an important reference for the further construction of 3D multi-component digital rock cores.
The sample was scanned using a nanoVoxel-2000 CT scanner (Sanying Precision Instruments, Tianjin, China) with a resolution of 3 μm. To construct a 3D multi-component digital rock, it is necessary to determine the mineral components in the CT images of the core. Different methods have been attempted for CT image segmentation. The conventional image processing procedure, which involves filtering and threshold segmentation, was initially used. In this study, we used the non-local means filter, which removed noise from the input CT image but preserves the sharpness of pore edges. The search window size was set to 8 voxels, and the spatial standard deviation in the Gaussian function was set to 5 to achieve a relatively good similarity weight. However, due to the presence of many micropores in the sample, filtering caused the loss of these pores, as shown in Figure 2b,c, where only the large pores were retained. Direct pore segmentation of the original CT images was another option. Threshold segmentation (Otsu’s thresholding method) and edge extraction (top-hat filter) were performed on the CT images to obtain the pore structure of the sample, as shown in Figure 2d. This method provided more accurate pore structure extraction results. For mineral segmentation, we attempted to incorporate the mineral composition results obtained from QEMSCAN into the digital rock model. However, due to the two-dimensional nature of the results obtained from QEMSCAN experiments and the overlapping grayscale values of different minerals in CT images, we had to conduct X-ray diffraction quantitative analysis experiments to obtain accurate primary clay mineral composition. It was conducted on the D2 PHASER XRD Analyzer (Bruker Corporation, Middlesex, MA, USA). The total clay content was 10.90%, with a content of 8.2% for kaolinite and 2.70% for illite. Additionally, the quartz content was 70.72% and the feldspar content was 7.08%. Therefore, we utilized the content values of these components as standards to perform segmentation on the CT images. The non-local means filtered and denoised image was directly segmented and divided into three parts: clay, quartz, and feldspar. As a result, a 3D multi-component digital core was constructed. Figure 3 shows the 3D grayscale image of rock with 500 × 500 × 500 voxels and the 3D multi-component digital rock.

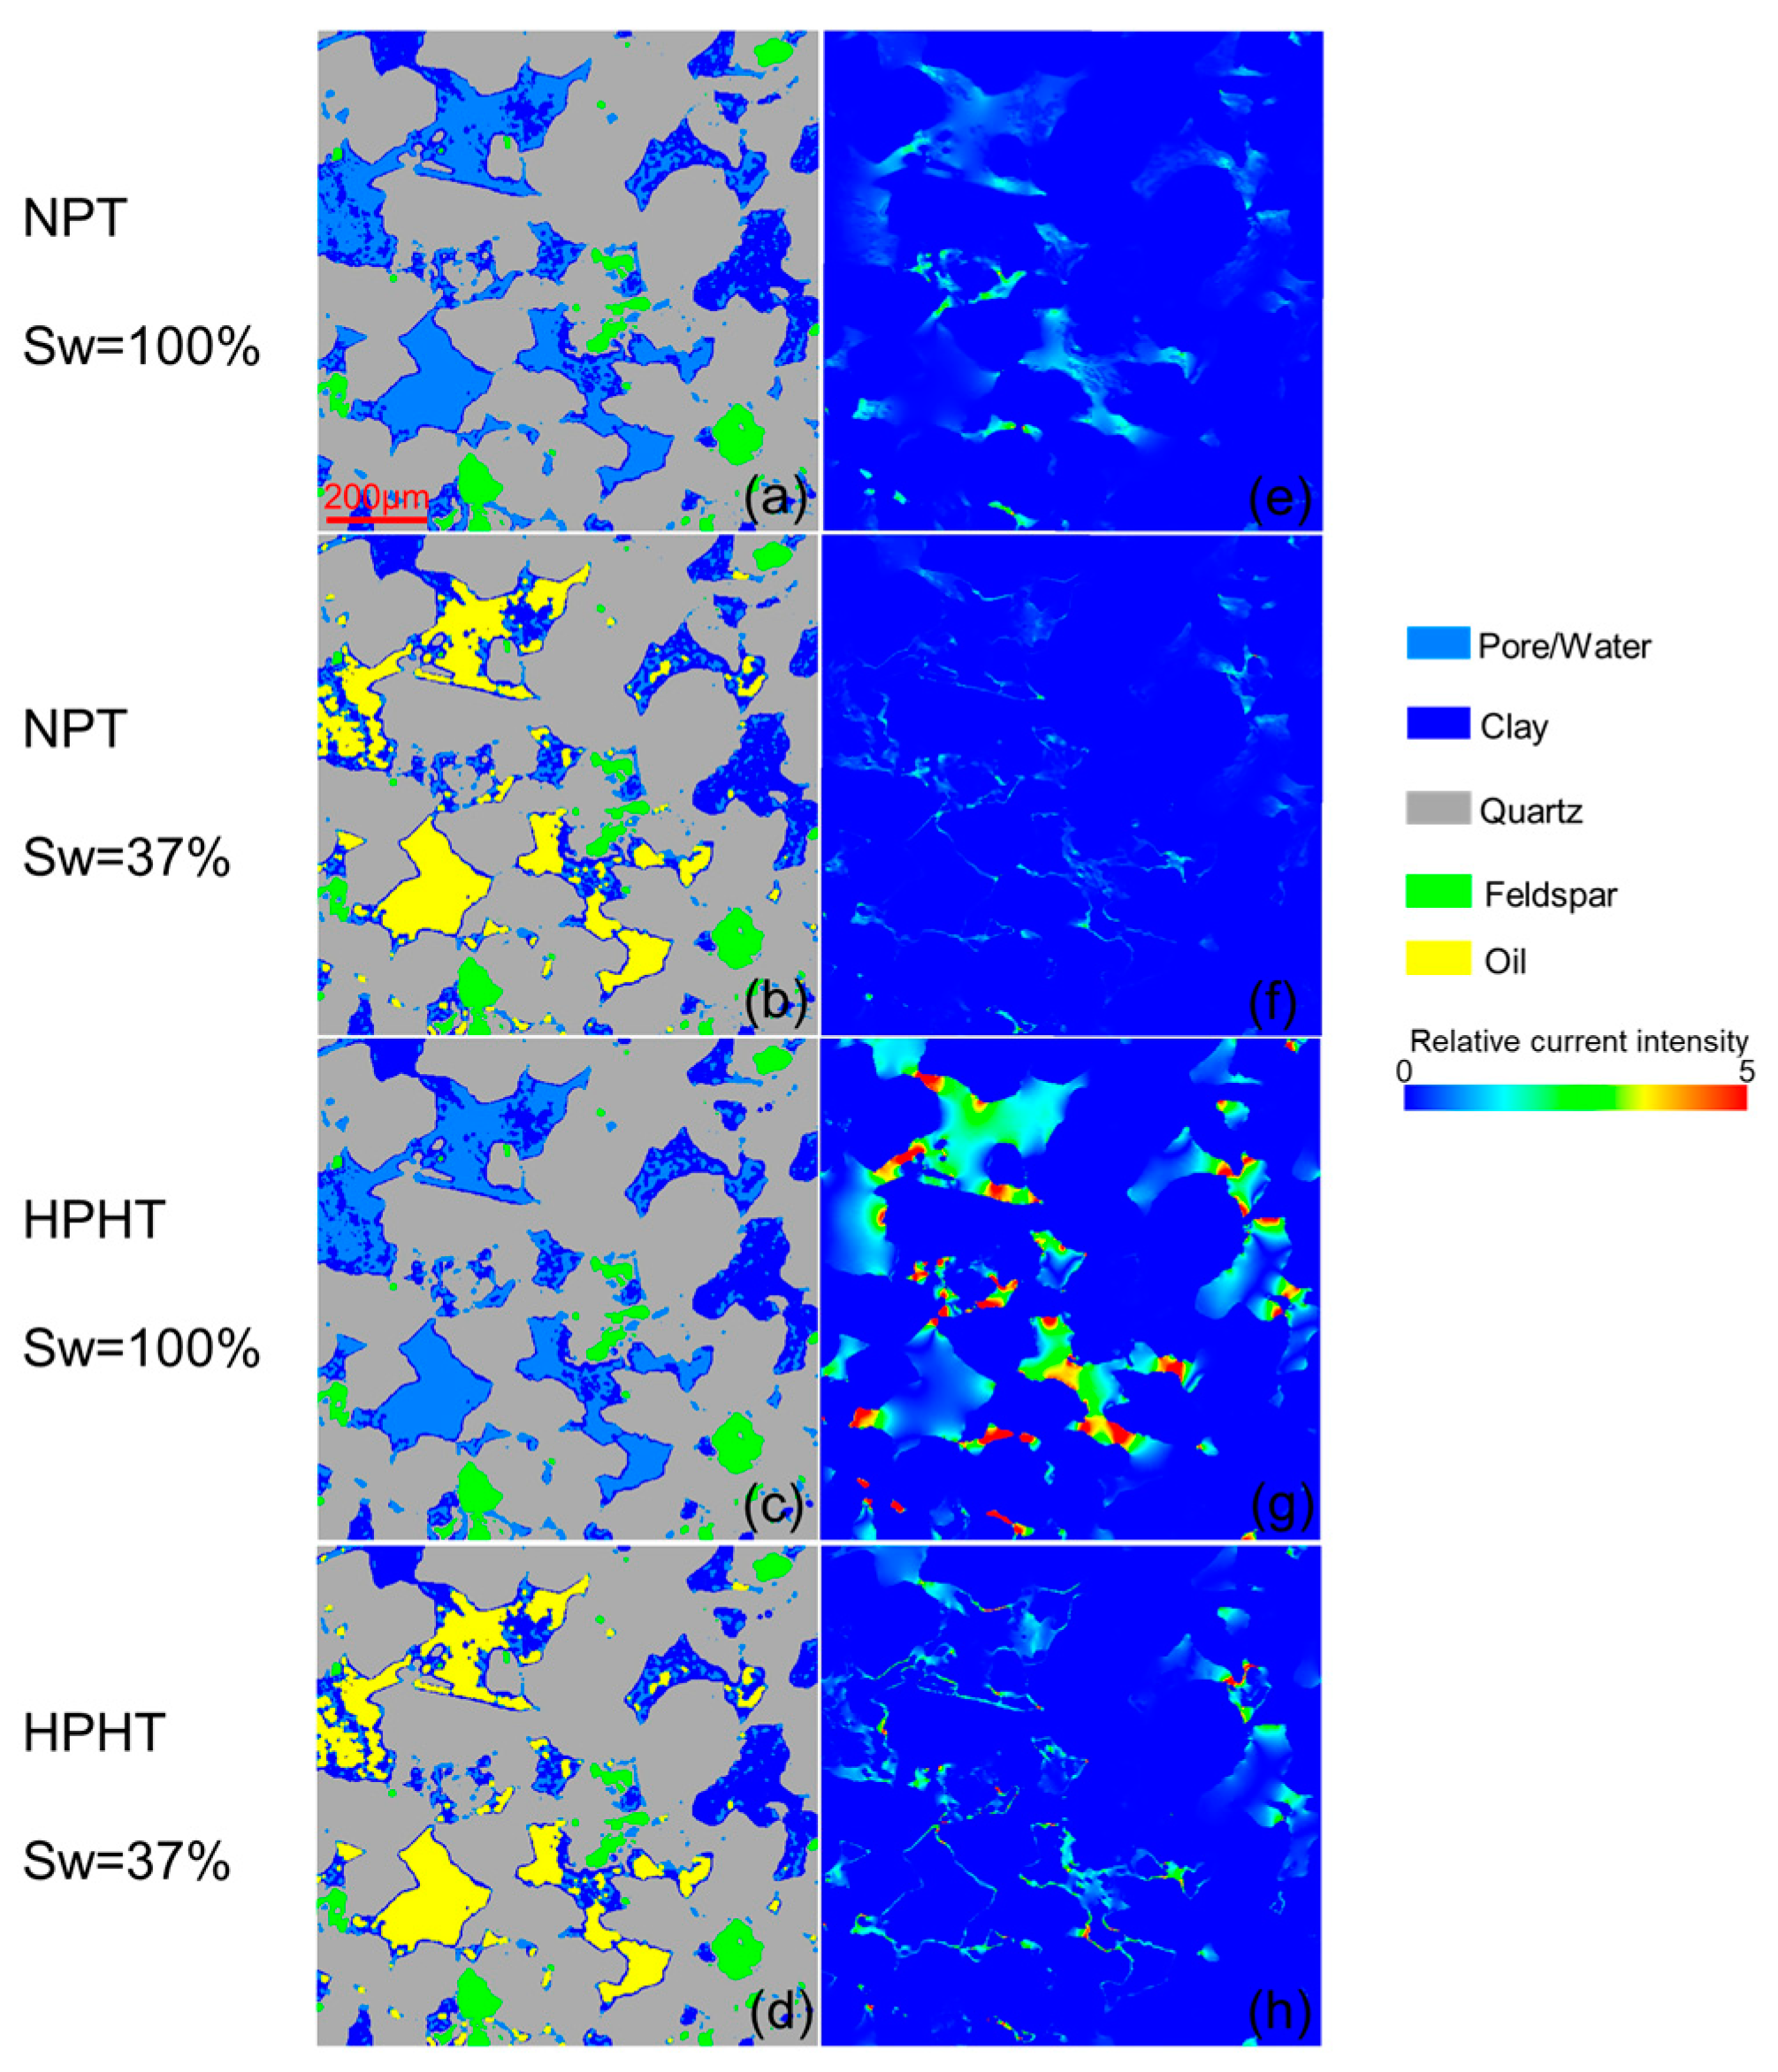
2.3. Numerical Simulation of Rock Electrical Properties

Rock electrical conductivity pathways are controlled by fluid distribution; therefore, determining fluid distribution at different water saturations is crucial for resistivity calculations [39]. Mathematical morphology is an effective method for simulating the process of decreasing water saturation in rocks and involves two basic operations: erosion and dilation. The erosion operation reduces the size of the target region using a structuring element, which results in image boundary contraction. The erosion operation can be expressed as follows:
A B = { x | ( B ) x A } ,
where A and B are both data sets, is the erosion operator.
The dilation operation, on the other hand, enlarges the target region using a structuring element, resulting in image boundary expansion. The dilation operation can be expressed as follows:
A B = { x | ( B ) x A } ,
where A and B are both data sets, is the dilation operator.
For set A, the opening operation involves performing an erosion operation using set B, followed by a dilation operation using the same set B. Based on the different wetting properties, the opening operation can simulate both drainage and imbibition processes. Then, digital rocks at different water saturations can be obtained. The opening operation can be expressed as follows:
A B = ( A B ) B ,
where A and B are both data sets, A B is the opening operation, is the erosion operator, and is the dilation operator. In the wet state, the pores generated by the opening operation are assumed to be occupied by oil, while the remaining pores are occupied by water to simulate the drainage process of rock pores. Therefore, based on the existing low-permeability sandstone digital rocks, an opening operation can be used to simulate the process of decreasing water saturation.
Based on the constructed low-permeability sandstone digital rocks, the FEM was used to calculate the rock’s electrical resistivity [30]. In the FEM, the governing equations for calculating the electrical resistivity of rocks can be expressed using Ohm’s law for electric fields. This equation describes the relationship between current density, electric field strength, and electrical conductivity, and can be written as
j = σ E
where j is the current density vector, E is the electric field strength vector, and σ is the electrical conductivity of the rock, which is inversely related to electrical resistivity. By solving the above governing equation, the distribution of electric field strength and current density within the rock can be calculated, and subsequently, the distribution of electrical resistivity can be derived. This can be achieved by discretizing and solving the electric field equation on a finite element mesh. The data of the digital rock are a matrix composed of a large number of voxels. For a given 3D digital rock, an electric field is applied between any two ends, and the voltage distribution on each voxel ultimately determines the energy of the entire 3D digital rock. According to the variational principle, the calculation problem of voltage distribution can be transformed into a problem of finding the extreme value of the system energy, and the effective electrical conductivity of the digital rock can be determined. For the system energy En to reach a minimum, the partial derivative of the system energy with respect to all nodal voltage variables um should be zero, expressed as follows:
E n u m = 0 .
where En is the system electric energy, and um is the nodal voltage variables.
In the actual numerical simulation process, the partial derivative of energy En with respect to the node voltage can be obtained by the gradient vector square, and when the square sum is within a given error range, the system energy is considered to reach the minimum value, and the system is in a stable state. At this time, Equation (5) can be approximately valid, and the voltage distribution in the digital rock is determined. When the voltage distribution tends to be stable, the resistivity of the digital rock can be obtained. We utilized the program described in reference [30] to simulate the resistivity of 3D digital rock. The program was implemented in Fortran, and the simulation was conducted on hardware with the following specifications: CPU (i7-11700), 80 GB of RAM, and a 1 TB SSD. On average, the computation time for a 3D digital rock model with dimensions of 500 × 500 × 500 voxels was approximately 4 h. A detailed explanation and the limitations of this method can be found in reference [30]. They will not be discussed in detail here.

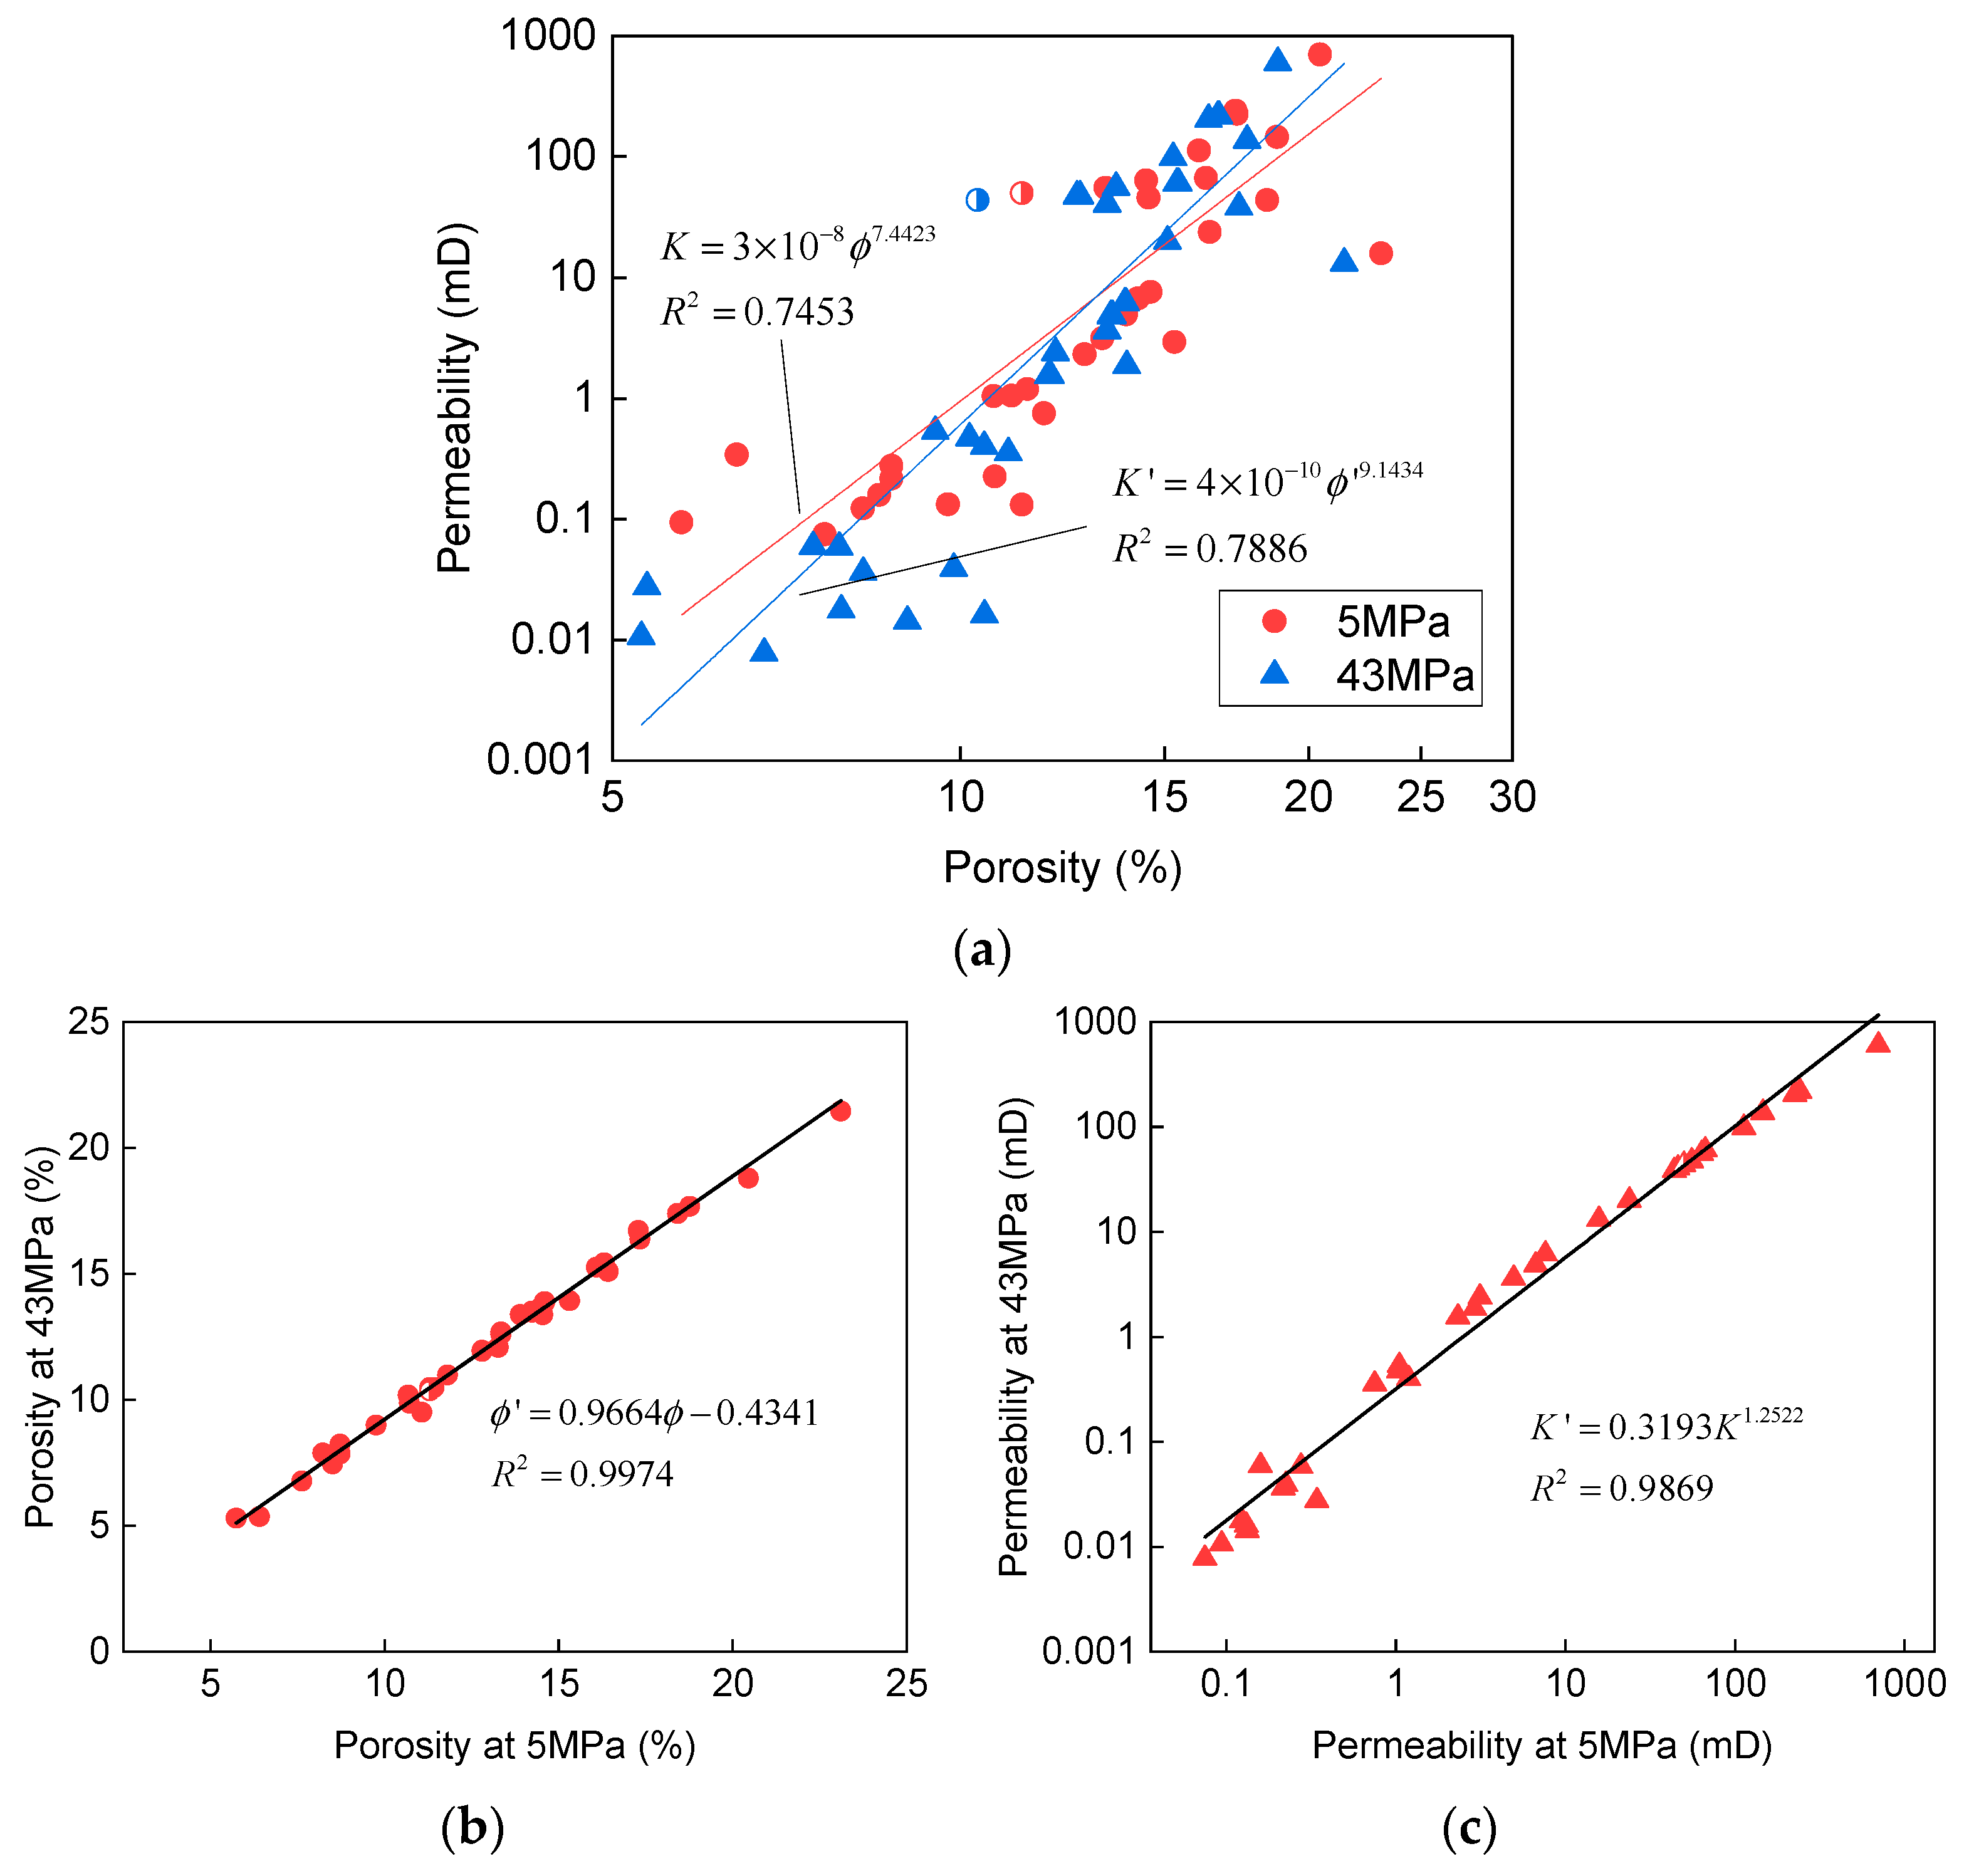
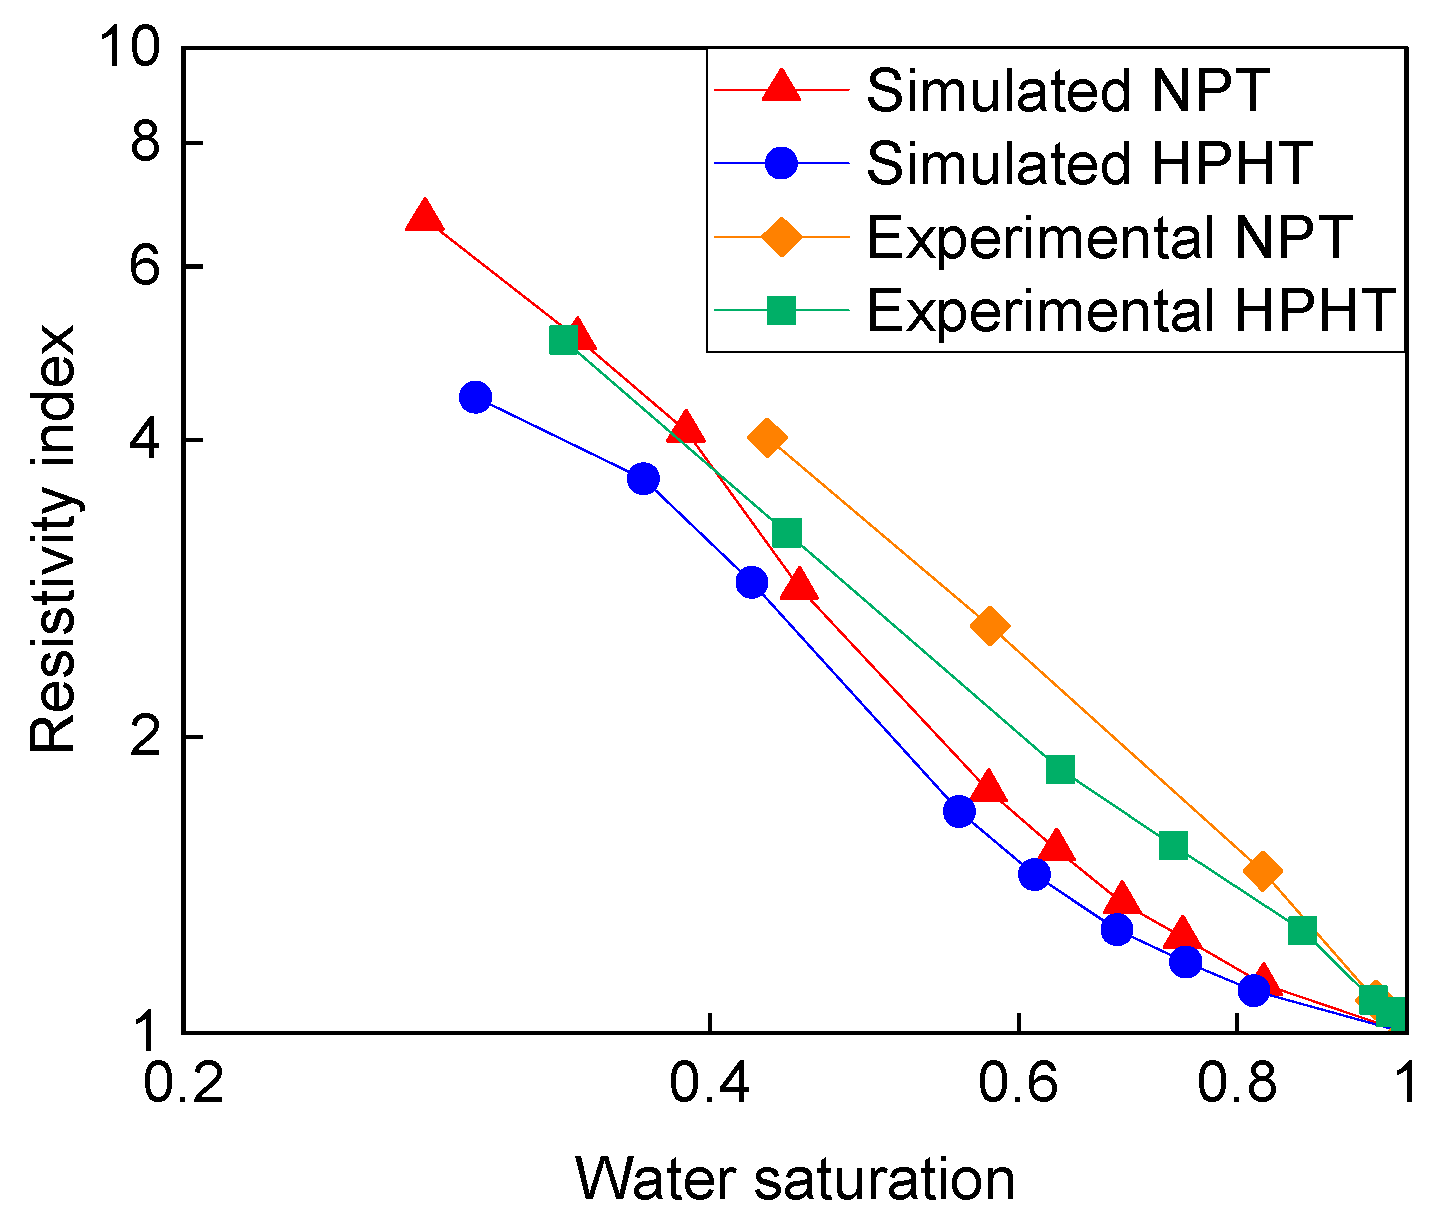
2.4. Correction for Deep Pressure and Temperature

Based on previous experimental results, it is known that pressure primarily affects the structure of rocks, while temperature primarily affects their electrical conductivity. To investigate the changes in rock properties under deep conditions, we collected the overburden pore-permeability data of 41 samples in the study area using the CMS-300 (Core Lab Instruments, Houston, TX, USA) overburden pore permeability system. Figure 4a shows the results of the measurements of porosity and permeability under 5 MPa and 43 MPa pressure conditions. It can be observed that both porosity and permeability decrease as pressure increases. The relationship between the porosity ϕ and permeability K under conventional experimental conditions and the porosity ϕ′ and permeability K′ under deep high-pressure conditions are shown in Figure 4b,c, and can be determined as follows:
ϕ = 0.9664 ϕ 0.4341 , K = 0.3193 K 1.2522 .
The rock properties were corrected for formation pressure based on the relationship between rock properties and pressure. Considering that the compressibility of the pore volume and clay structure under overburden pressure is more significant than that of the rock skeleton deformation, mathematical morphology operations were performed on clay minerals and pores to simulate the equivalent changes in rock structure under overburden conditions. The total volume of clay and pores was eroded to achieve volume compression under high pressure. In this study, we incrementally increased the erosion radius starting from 1 to 3 voxels. The pore was separately eroded to achieve compression of the pore volume under high pressure. The comparison of the 3D digital rock models before and after overburden correction is shown in Figure 5, which shows the compression of micropores and microcracks, as well as the compression and expansion of clay minerals, in accordance with the theoretical changes [16,17]. Porosity decreases as pressure increases. The volume ratio of different rock components before and after overburden correction is shown in Table 1. The lattice Boltzmann method was used to calculate the permeability before and after overburden correction. The variations in porosity and permeability obtained from numerical simulation are in good agreement with the results measured by the experiment (Table 1). Thus, the pressure correction of deep formations was achieved through the abovementioned methods.
To calculate the electrical conductivity of digital rock, the conductivity of each component needs to be incorporated. The conductivities of formation water and clay minerals at different temperatures were calculated to simulate the rock conductivity under actual formation conditions, achieving deep temperature correction. The electrical conductivity of clay minerals was determined using the Waxman-Smits (W-S) model, which was weighted by the content of different clay types [25]:
C c l = B Q v ,
Q v = C E C ( 1 ϕ t ) ρ c l ϕ t ,
where Qv represents the cation exchange capacity, B represents the equivalent conductance of exchange cations on clay particle surfaces, CEC represents the cation exchange capacity of clay minerals, and ρcl represents the average density of clay. The value of B is obtained from the chart proposed by Waxman and Thomas at different temperature conditions [22]. The clay conductivity in the numerical simulation is determined based on the B [22] and CEC of different clay types (Table 2) at different temperature conditions in the W-S model.
The electrical conductivity of formation water is determined by its salinity and temperature. The resistivity of water can be calculated using the following equation [22,25]:
R w 1 = ( 1 2.74 × 10 4 × C w 0.955 + 0.0123 ) × ( 81.77 1.8 T 1 + 38.77 ) ,
R w 2 = R w 1 × 1.8 T 1 + 39 1.8 T 2 + 39 ,
where Cw represents the electric conductivity of the formation water, S/m; Rw1 represents the resistivity of water at temperature T1 (°C), Ω·m; Rw2 represents the resistivity at temperature T2 (°C), Ω·m.

3. Results and Discussion

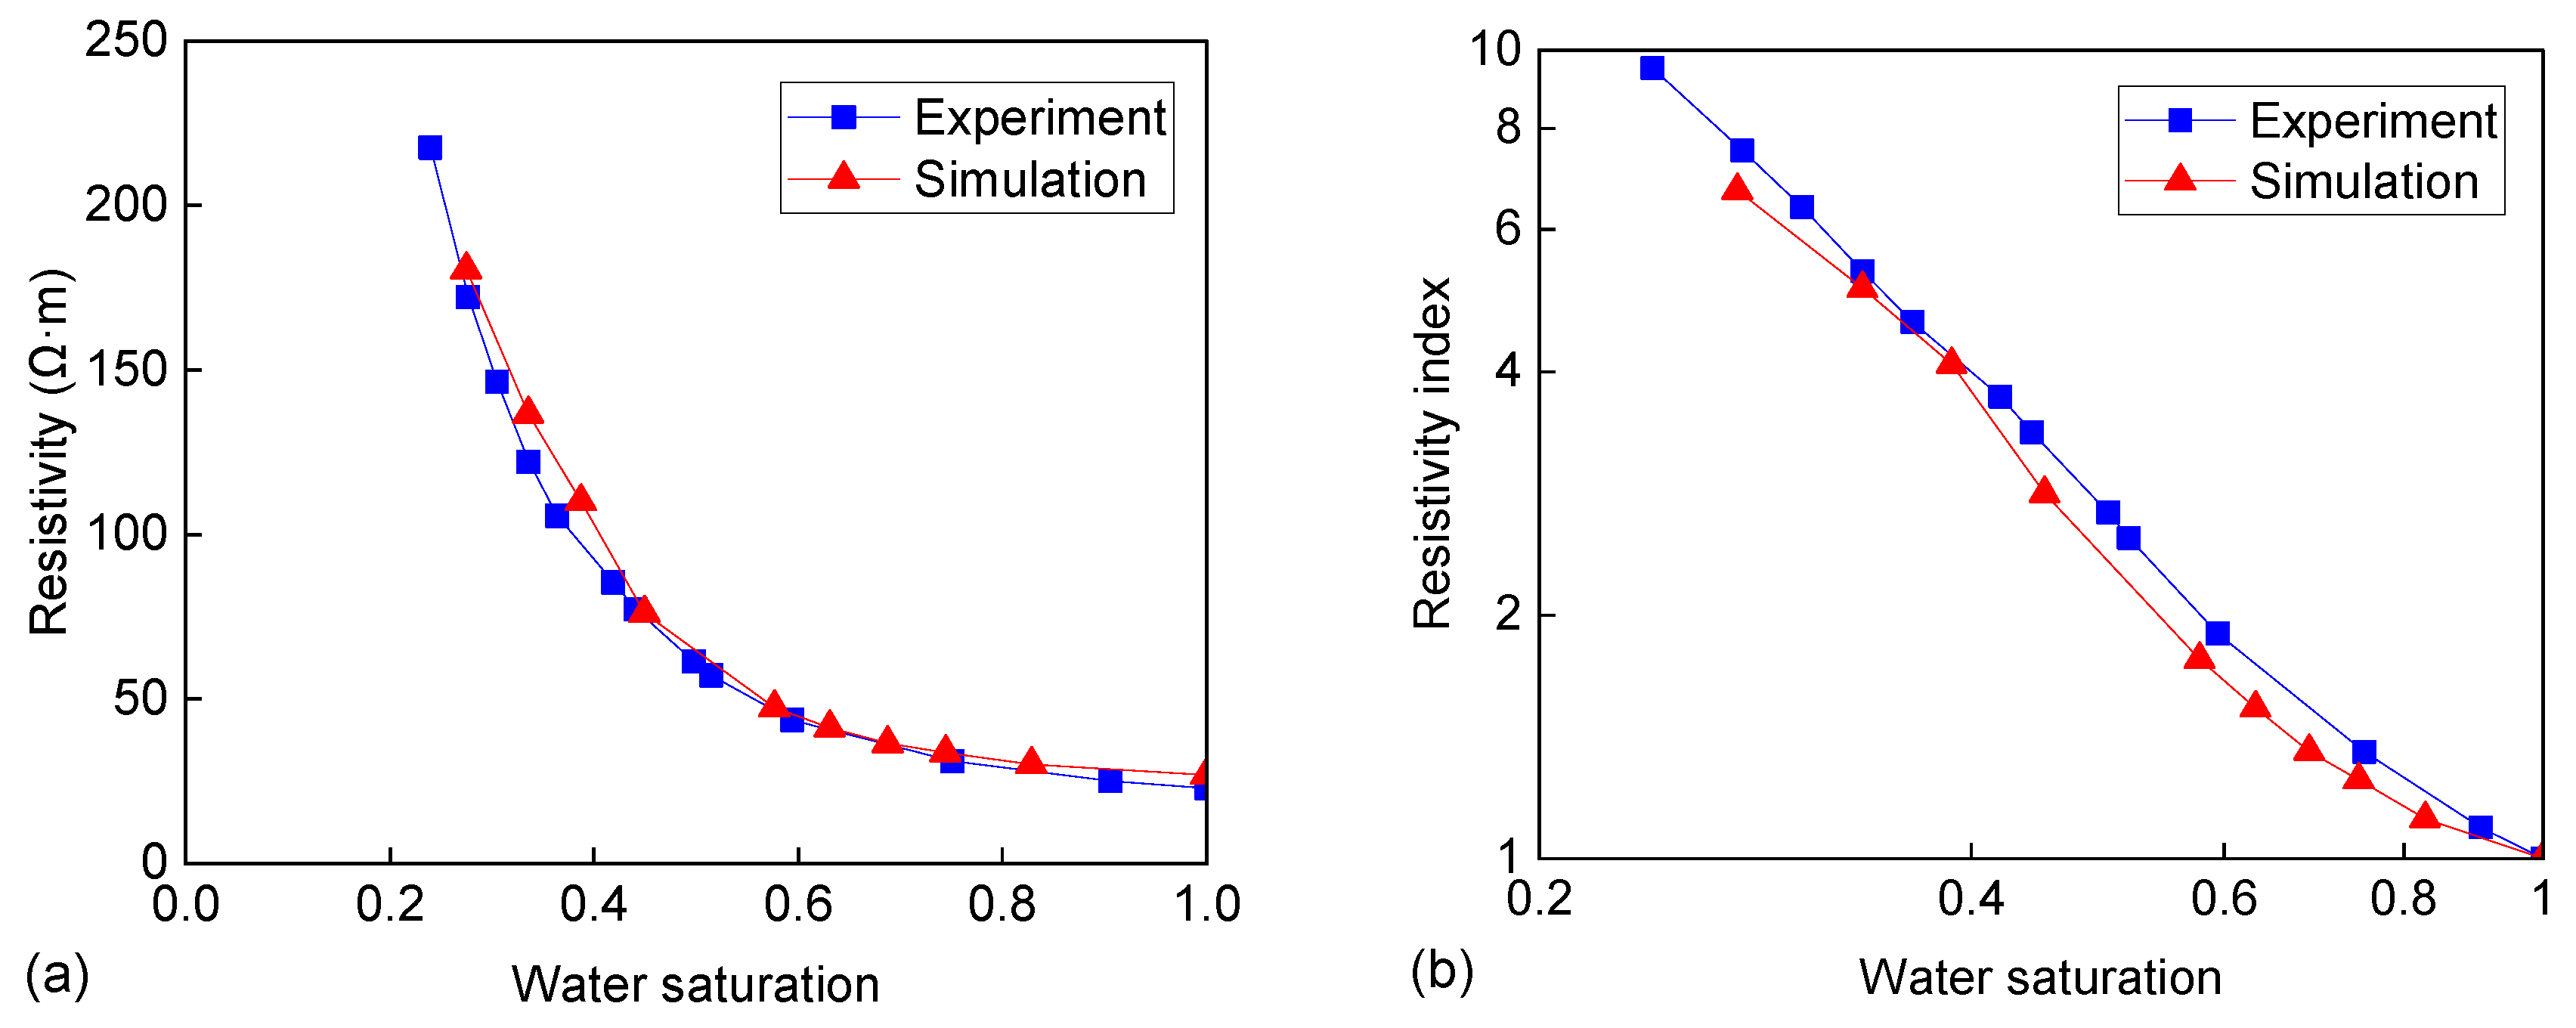
3.1. Verification of Simulation Results Accuracy

Based on the measurements of pore and permeability in the laboratory environment, the total porosity of the selected sample is 15.58%, and after correction for overburden pressure, the total porosity is approximately 14.66%. The visible porosity is 10.35%, and the clay content is 10.96%, with 4.31% of the pores contained in the clay, resulting in an average porosity of 39.28% for the clay. The conductivity of clay minerals is determined by Equations (7) and (8), where the CEC of kaolinite is 0.03 mmol/g and the CEC of illite is 0.2 mmol/g, indicating that illite has stronger conductivity. As shown in Table 1, the corrected clay content is 10.96%. Moreover, the kaolinite content is approximately 8.25%, and the illite content is approximately 2.71%. Since it is difficult to separate different clay minerals, the conductivity of clay is directly calculated using the aforementioned proportions in the numerical simulation. Under the aforementioned conditions, laboratory experiments and numerical simulations were performed, with a model size of 500 × 500 × 500 voxels in numerical simulation. According to Equations (9) and (10), the electrical conductivity of formation water is related to factors such as salinity and temperature. In the laboratory, the salinity of the salt solution (NaCl equivalent) was 8000 mg/L, and the temperature was 25 °C, resulting in a solution electrical conductivity of approximately 1.47 S/m. Similarly, in the numerical simulation at the same temperature, formation water was endowed with the same properties as in the laboratory experiment. Based on the aforementioned conditions, the experimental measurements and simulation results of rock electrical properties at the NPT were studied, where the resistivity index was calculated by the Archie equation, revealing the relationship between rock resistivity and water saturation [40]:
R I = R t R 0 = b S w n ,
where Rt is the resistivity of the oil-bearing rock, R0 is the resistivity of the water-saturated rock, b is a coefficient, Sw is the water saturation, and n is the saturation exponent.
The HPHT electrical experiments were conducted using the SCMS-E High-Temperature and High-Pressure Rock Core Multi-Parameter Measurement System (Center for Well Completion & Logging Lab, Chengdu, China). A 10,000 mg/L NaCl solution was used. The NTP conditions were set at a temperature of 141 °C, pressure of 52 MPa, formation water resistivity of 0.158 Ω·m, and rock porosity of 7.3%. The HPHT conditions were set at a temperature of 26 °C, pressure of 3 MPa, formation water resistivity of 0.539 Ω·m, and rock porosity of 5.6%. Figure 6 shows the comparison between the experimental measurements and numerical simulation results. By using Equation (11) and analyzing the curve in Figure 6, we calculated that the saturation exponent was 1.56 for the experimental data and 1.46 for the simulation data, resulting in a relative error of 6.41%. This result serves to validate the accuracy of our simulation method. As there was no rock electrical conductivity experiment conducted under HPHT for the selected sample, the experiment from an adjacent well was chosen for comparison. Figure 7 shows the comparison of HPHT experiments and numerical simulations. The simulations were conducted under HPHT at 140 °C, and the conductivity of the formation water was at 5.10 S/m. The experimental and simulation results both show a decrease in the saturation index n under HPHT, which is consistent with previous research results, validating the accuracy of the numerical simulation results under HPHT. The main reason for the discrepancy between the experimental and simulated results in Figure 7 is that different rock samples were used. The difference in pore structure between the two samples resulted in different resistivity values. The comparisons aim to illustrate the trend of the resistivity index with variations in temperature and pressure. The consistency of these trends indicates the reliability of our simulated conclusions. Figure 8 shows the current field cross-section of the simulation results. Figure 8a–d show the current field of the digital rock with 100% water saturation and 37% water saturation at the NPT, respectively. Figure 8e–h show the corresponding results under HPHT. In the state of low water saturation, water mainly exists in pore corners, micropores, and clay, which are the main conductivity pathways at low water saturation. For formation water, generally, its electrical conductivity tends to increase with increasing temperature. This is because higher temperatures enhance the molecular motion of water and the activity of ions, thereby facilitating conductivity. Regarding clay minerals, in general, the conductivity of clay minerals tends to increase with temperature due to enhanced ion diffusion within the mineral lattice. The discussion on the effect of temperature on the conductivity of the formation water and clay can be found in the reference [41]. Under high pressure, the electrical resistivity of water and clay generally decreases. This is because high pressure causes water molecules or clay electrons to become more closely packed, increasing the frequency of electron collisions and, consequently, conductivity. Therefore, compared with NPT, the conductivity of the formation water and clay are higher under HPHT, leading to a stronger current intensity.

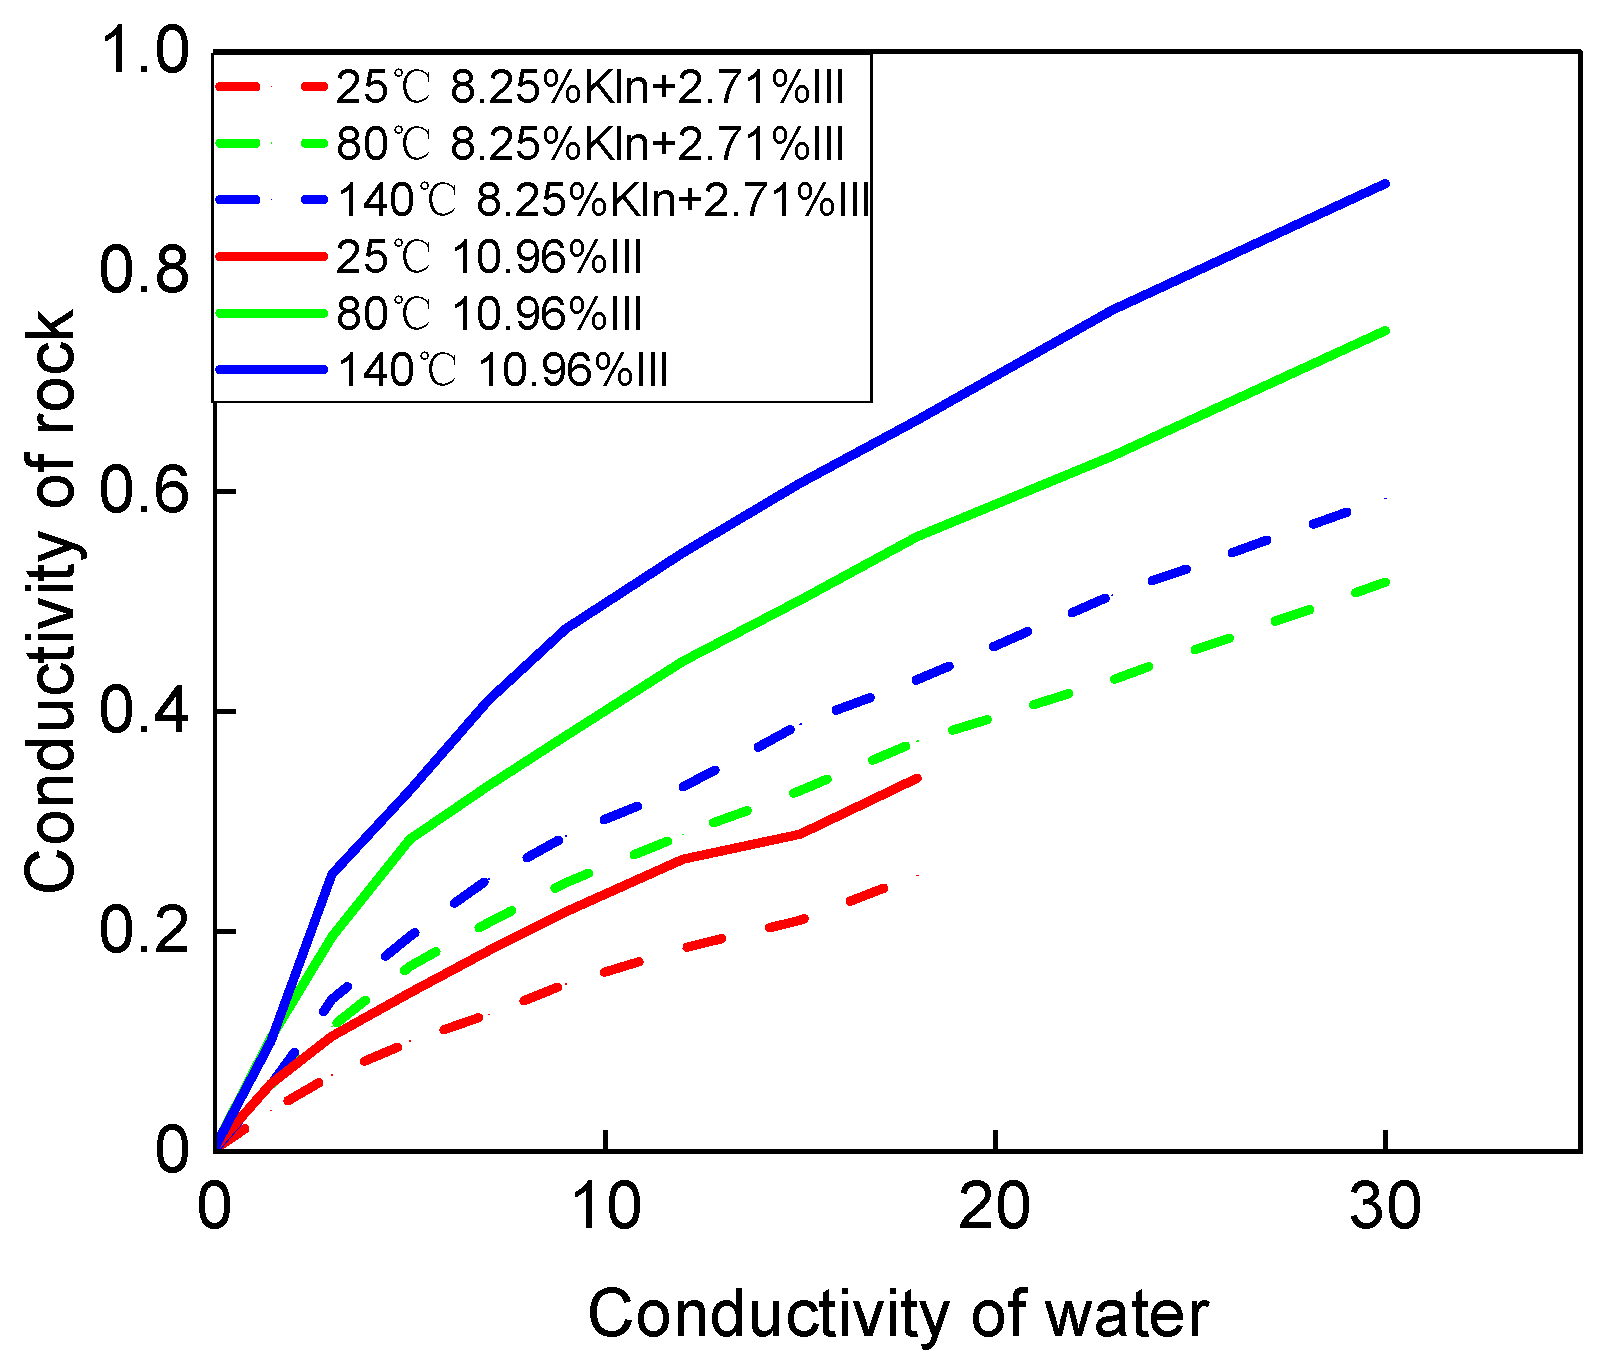
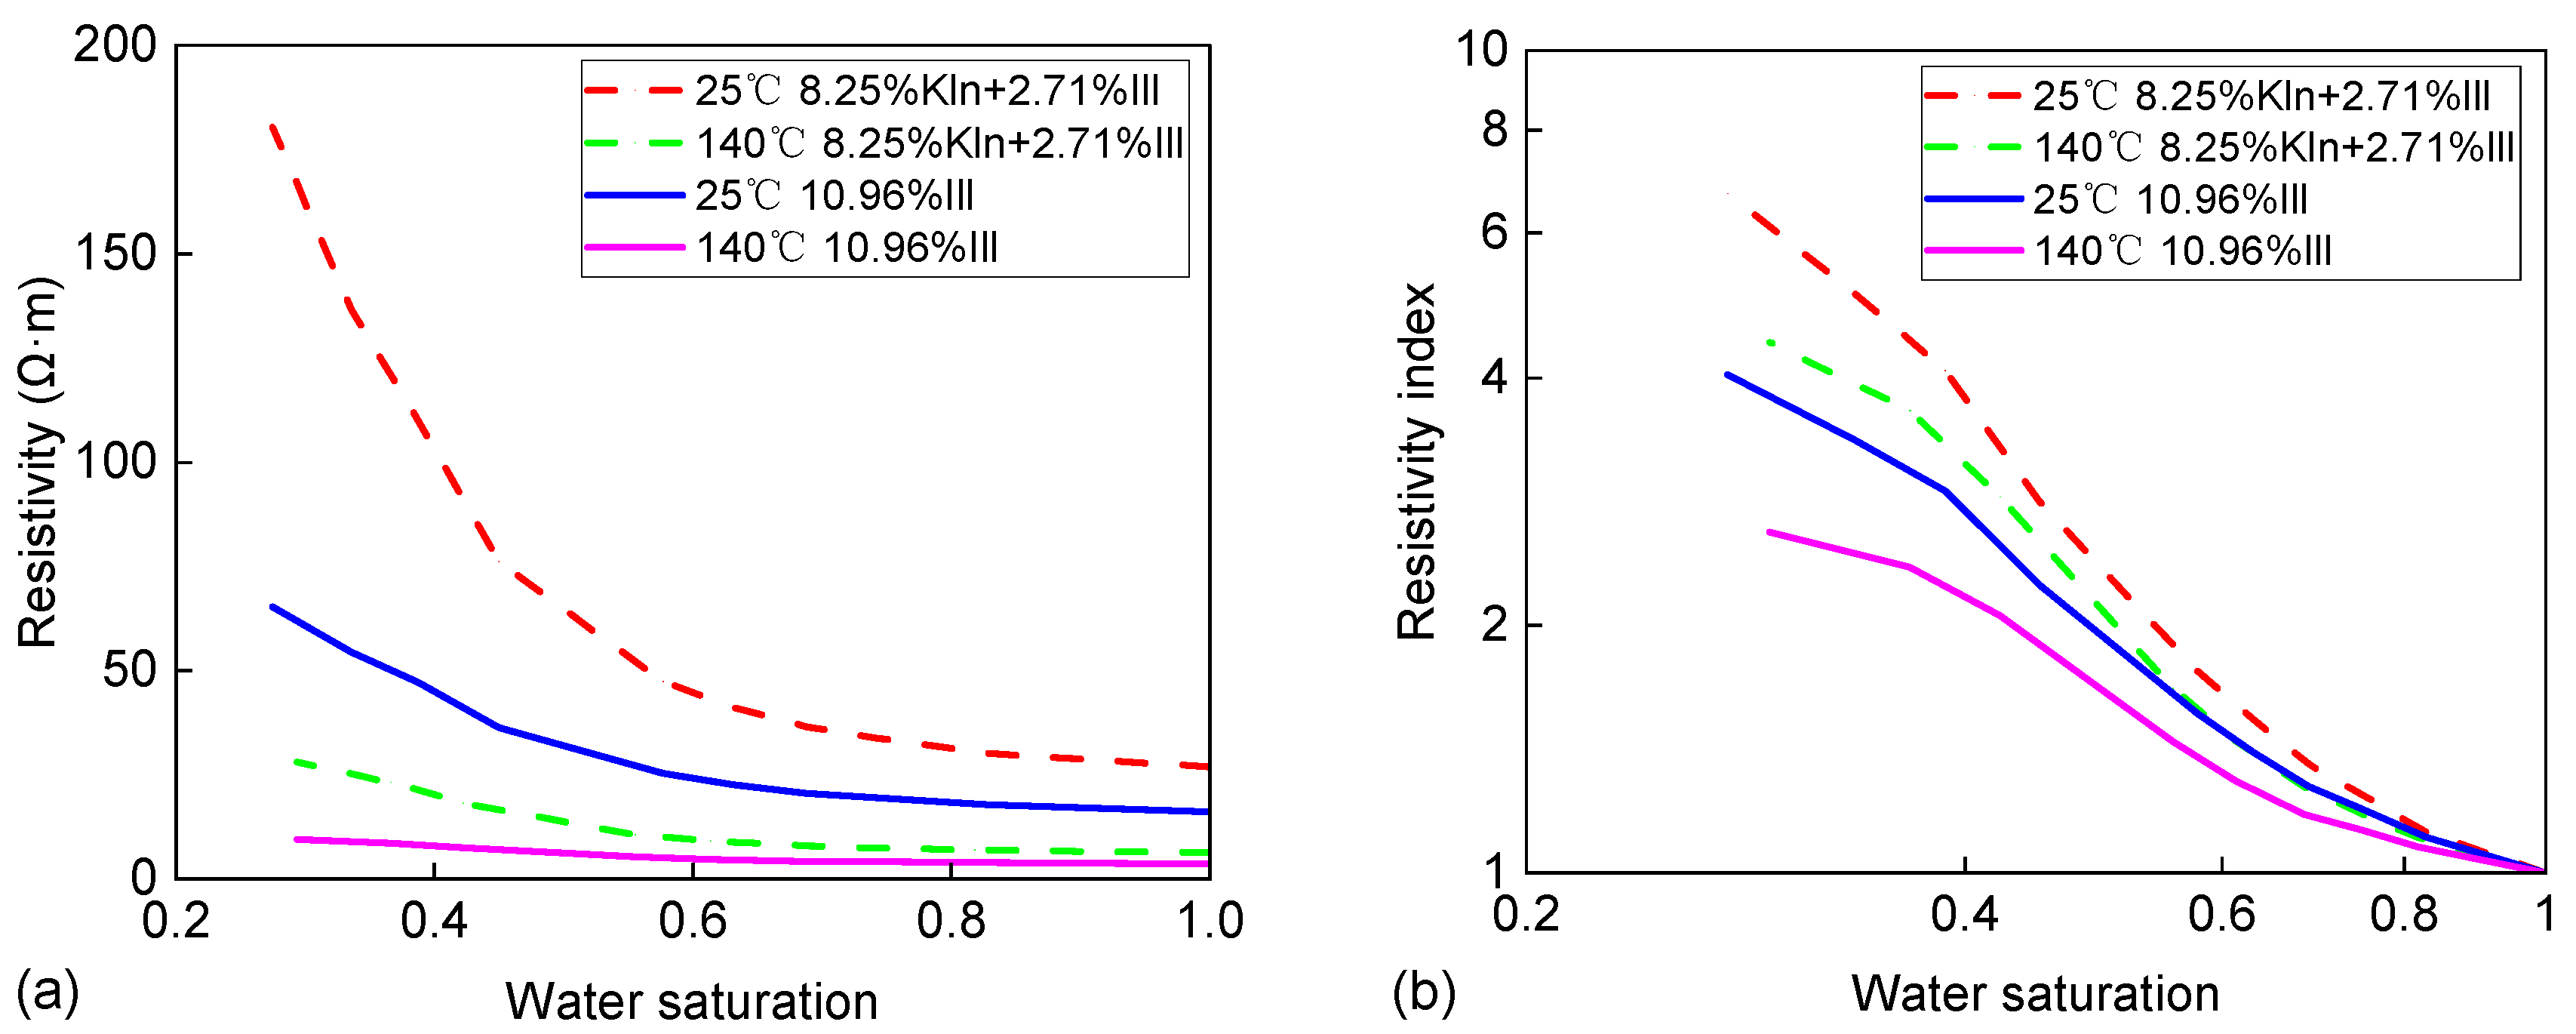
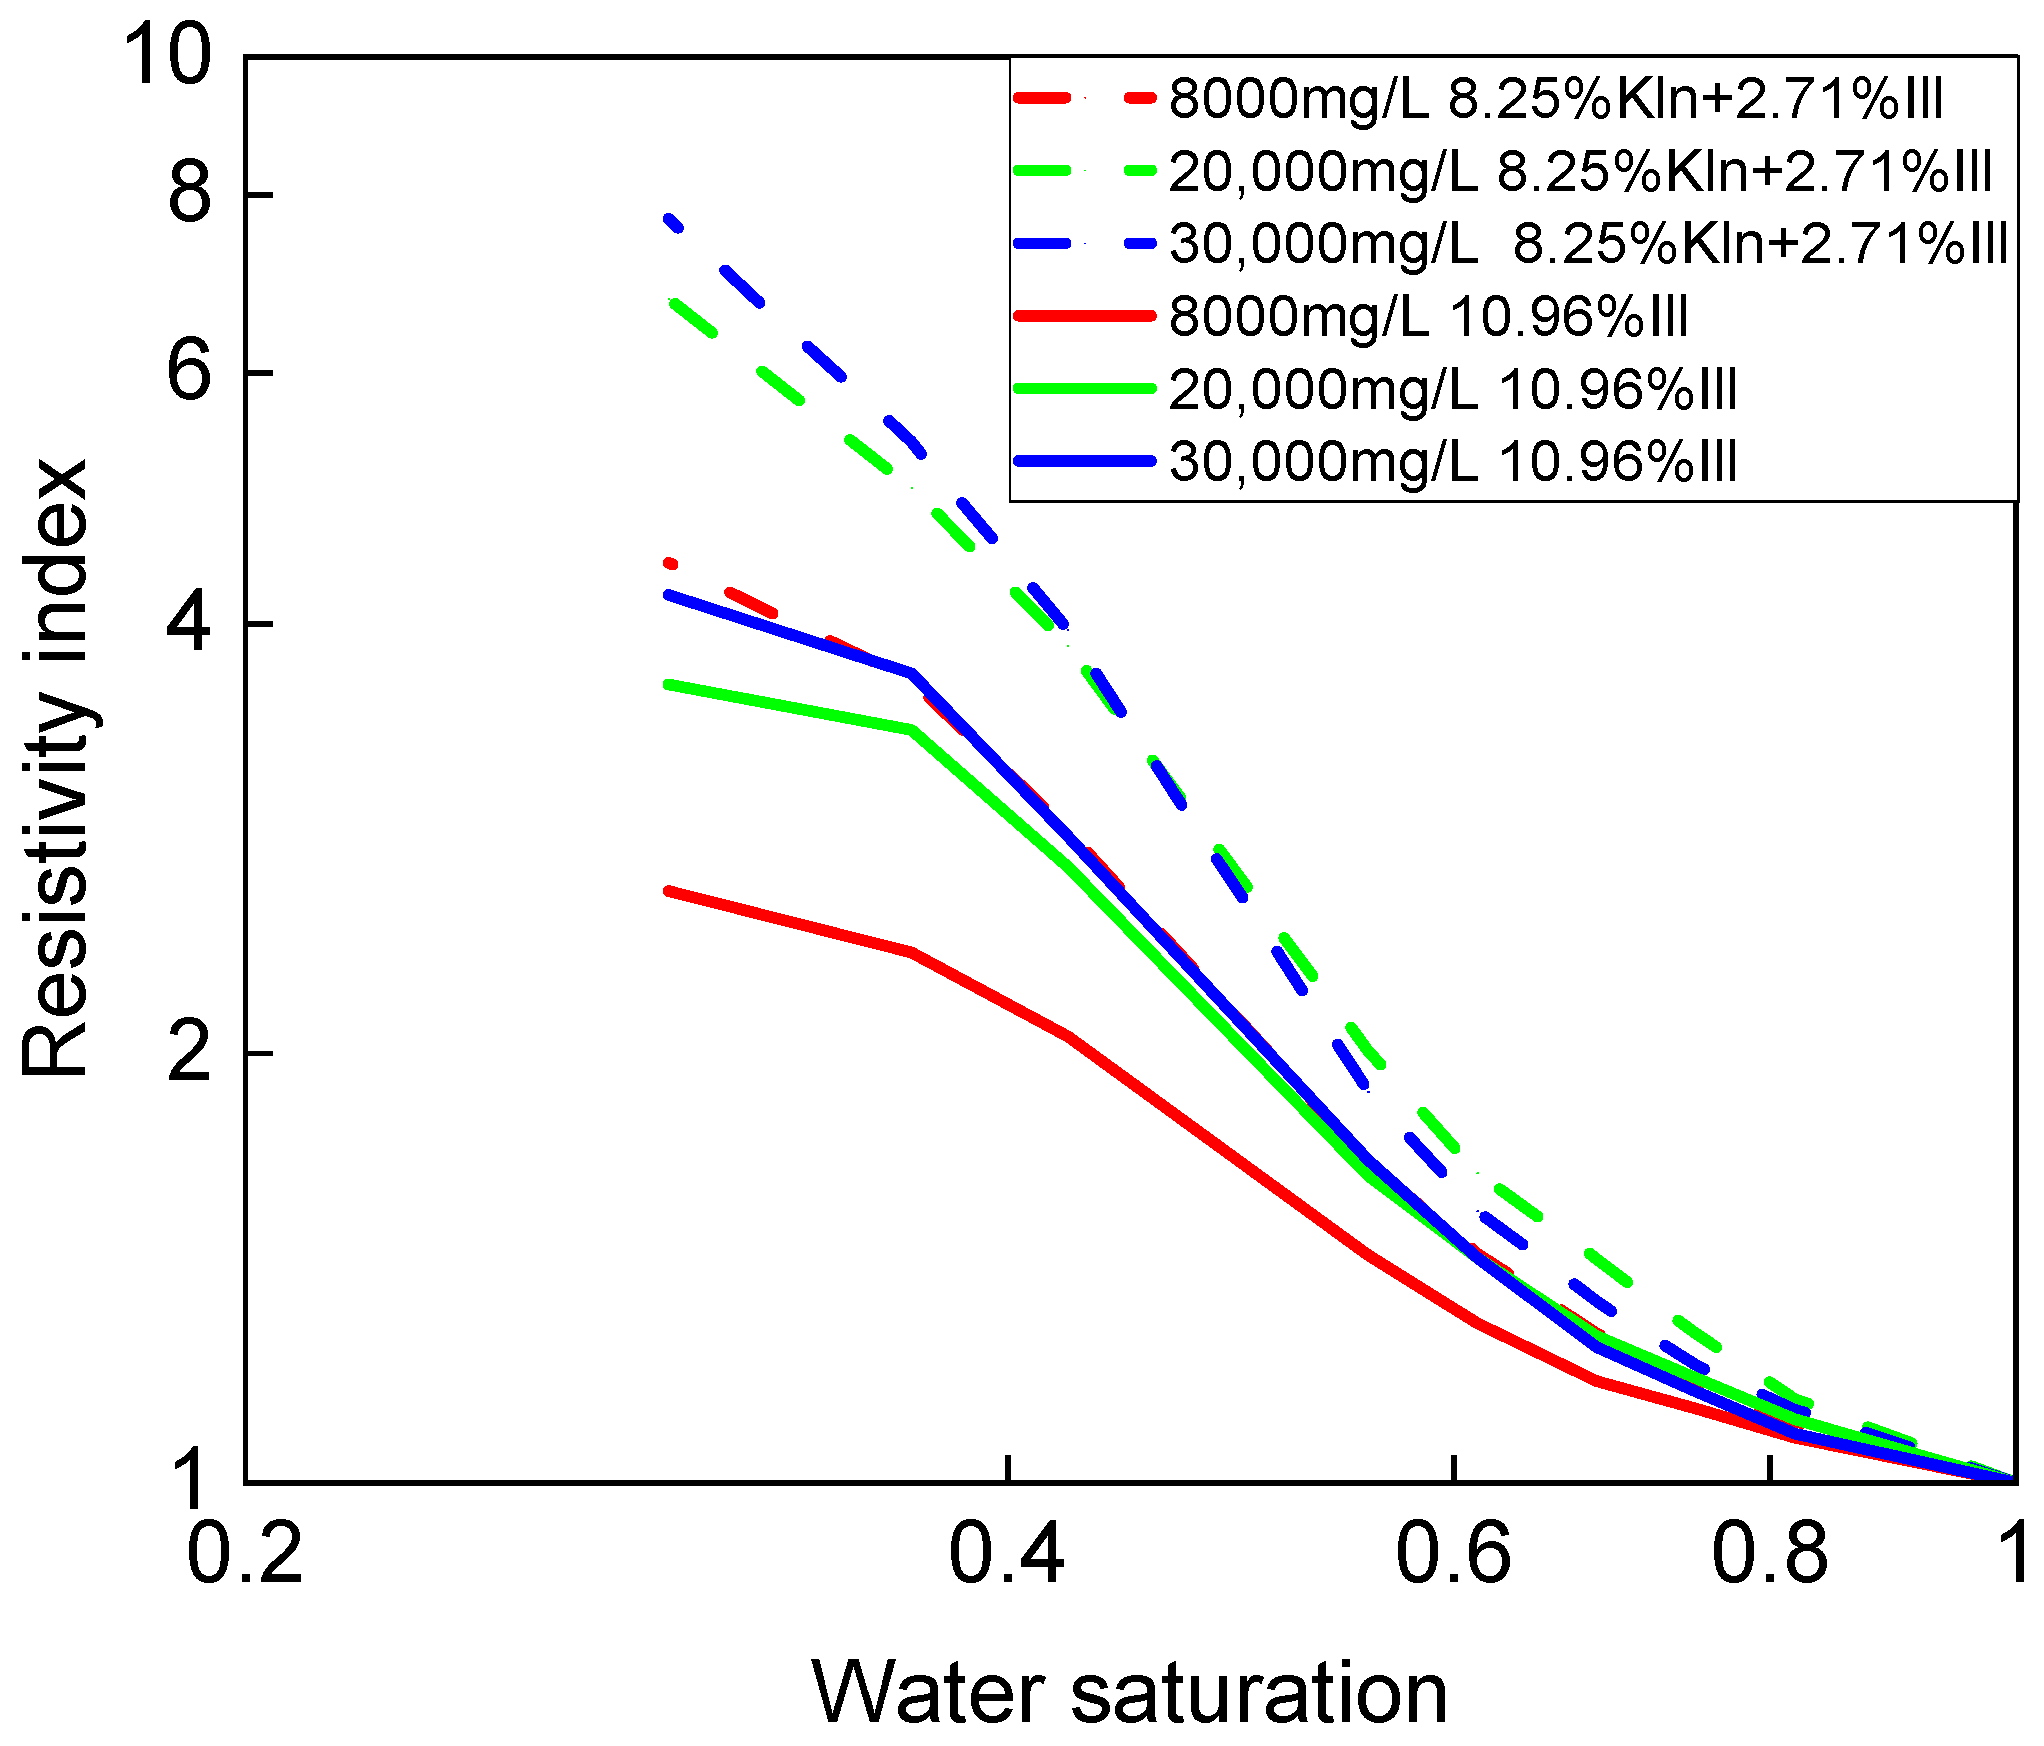
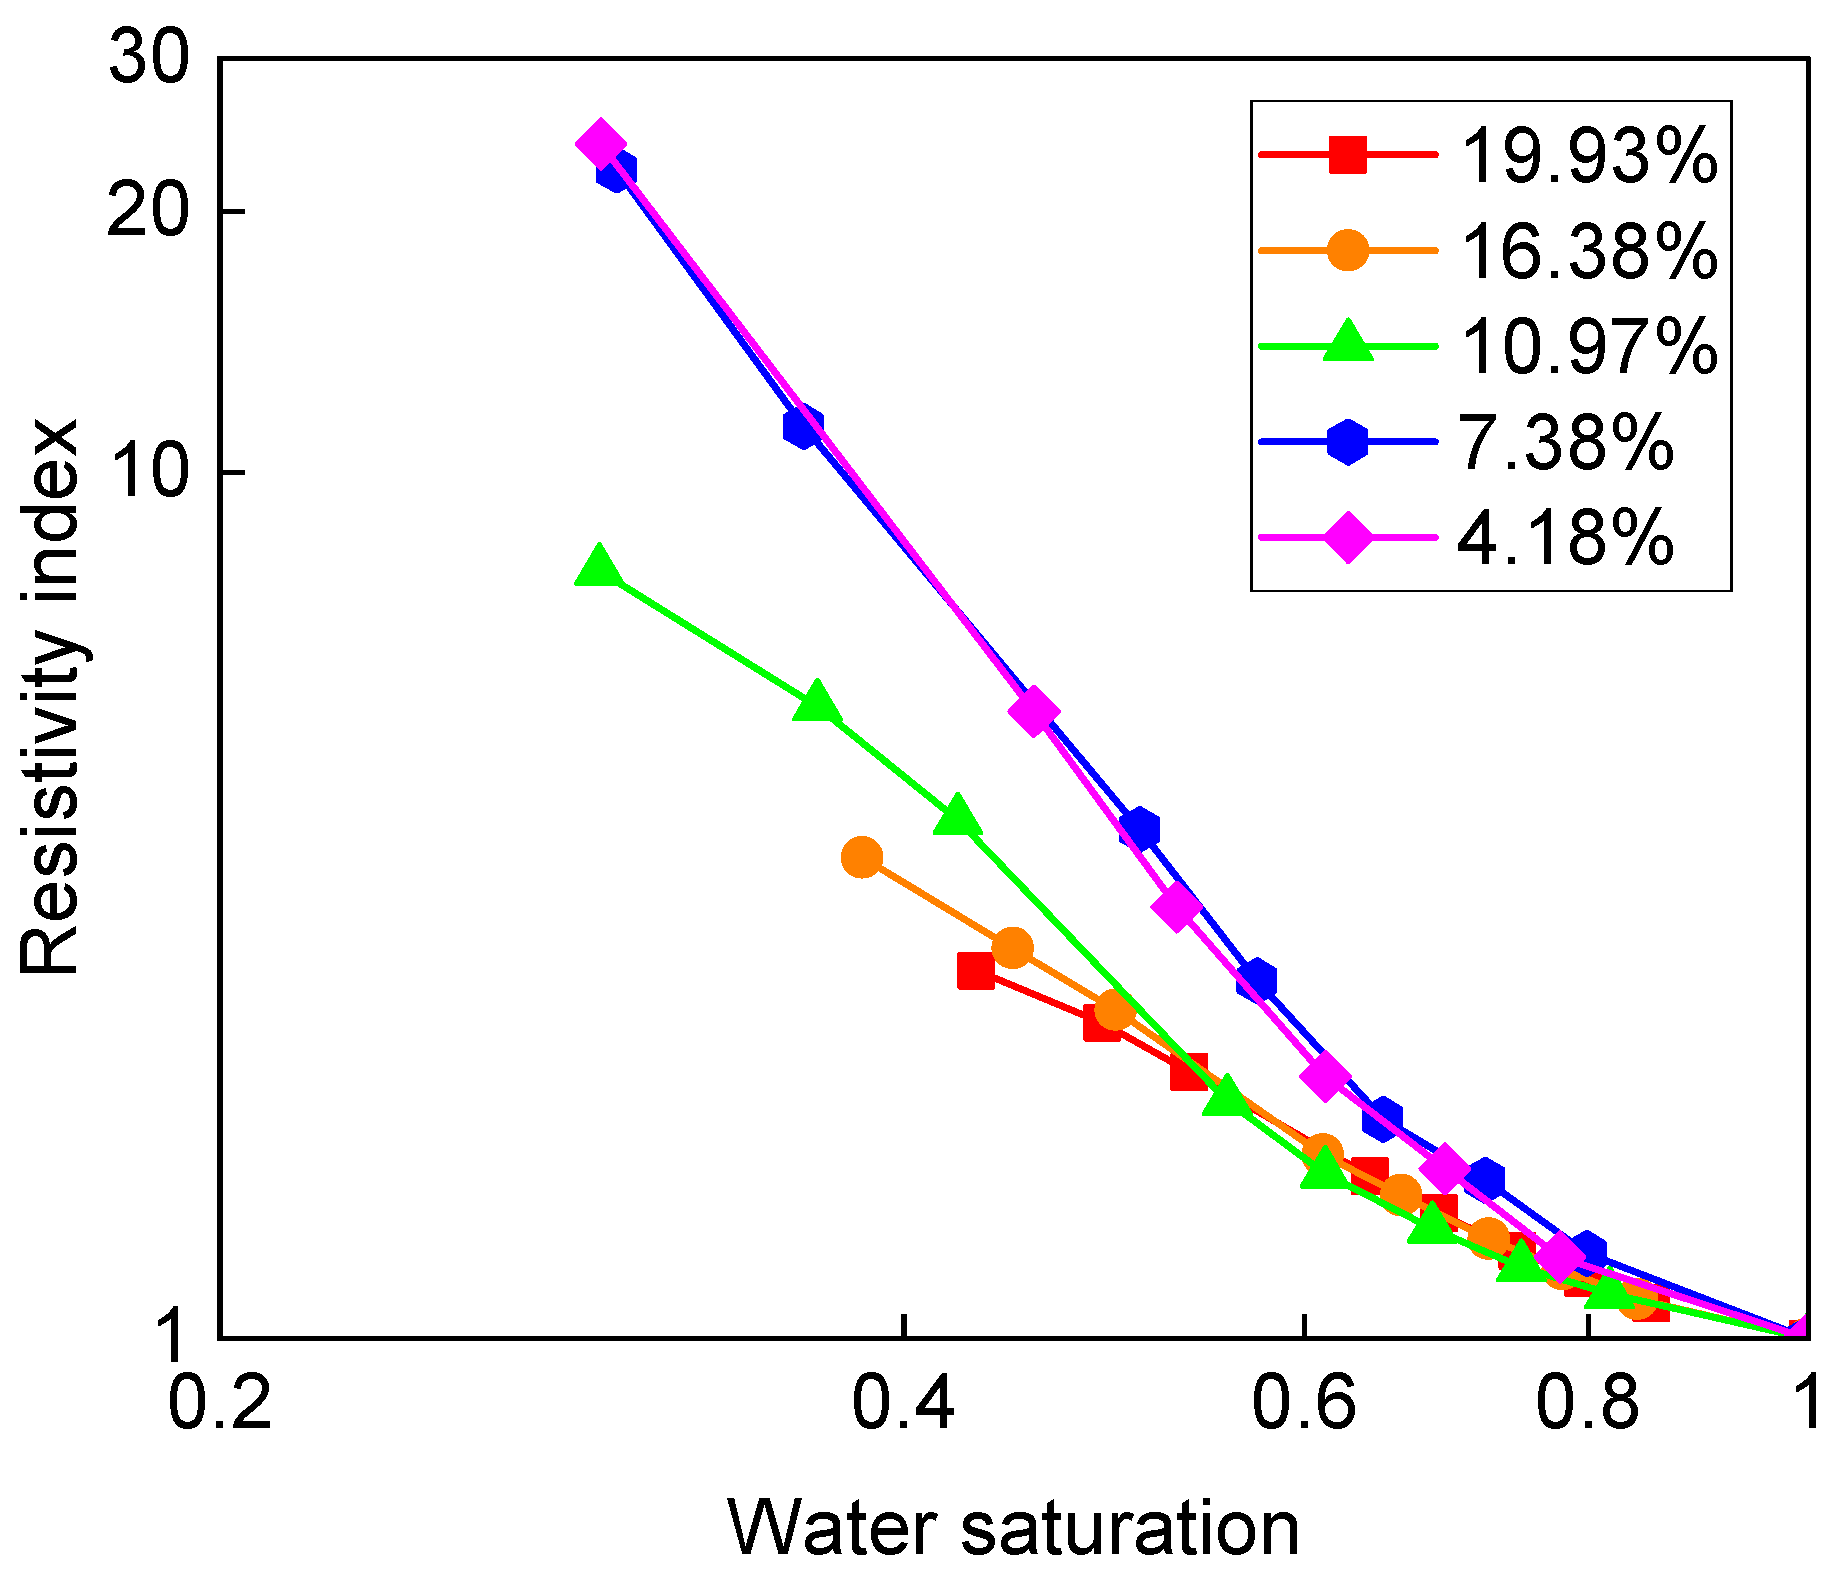
3.2. Factors Affecting the Electrical Properties of Sandstone

The electrical conductivity of sandstone is affected by factors such as the conductivity of formation water, temperature, and clay minerals. The conductivity of formation water increases with increasing salinity and temperature. The effects of temperature and formation water conductivity on the conductivity of water-saturated rock were simulated separately for real clay mineral proportions (8.25% kaolinite and 2.71% illite) and pure illite (10.96% illite). The simulation results are shown in Figure 9, which indicate that the rock conductivity increased with increasing formation water conductivity, temperature, and conductivity of clay minerals. The dashed line represents the relationship between the conductivity of rock and water saturation under actual conditions (8.25% kaolinite and 2.71% illite), while the solid line represents the relationship when all 10.96% of the clay minerals are illite. Kln and Ill are abbreviations for kaolinite and illite, respectively. From Figure 9, it can be observed that when the solution conductivity was low, the rock conductivity increased rapidly with the solution conductivity, and the rate of increase of the rock conductivity was greater than that of the solution conductivity. When the solution conductivity further increased, the rock conductivity increased linearly, and the boundary point was approximately 5 S/m of solution conductivity. According to the W-S model, at a certain temperature, when the solution salinity reached a certain value, B tended to a stable value, and the conductivity of clay minerals hardly increased anymore. The higher the solution conductivity, that is, the higher the salinity, the lower the impact of additional clay conductivity on the total rock conductivity. The B value increased with temperature, and under the same salinity, the increase in temperature led to an increase in both solution conductivity and clay additional conductivity.
To further investigate the influence of temperature, formation water salinity, and clay conductivity on rock electrical properties, we simulated the effects of temperature and clay conductivity on rock conductivity separately. The trends of different clay types and rock conductivity were found to be similar. Therefore, only two cases were considered: the real clay proportion and pure illite, and the temperatures were chosen to be 25 °C and 140 °C. The simulation results showed that when the salinity was 8000 mg/L and 30,000 mg/L, similar results were obtained. Based on the comparative analysis at different temperatures, it was observed that as the temperature increased, the electrical resistivity decreased. This indicated a negative correlation between temperature and electrical resistivity, suggesting that higher temperatures promoted lower electrical resistance. Furthermore, in the comparative study across different clay types, it was noted that as the conductivity of the clay increased, the electrical resistivity decreased. This implied a direct relationship between clay conductivity and electrical resistivity, suggesting that higher conductivity in clay led to reduced electrical resistance. Thus, only the results for a salinity of 8000 mg/L are presented in Figure 10. The rock resistivity decreased with increasing temperature and enhanced clay conductivity, especially at low water saturation. As the water saturation decreased, the difference between the resistivity curves increased gradually. The distance between the curves in the figure showed that the influence of temperature on the rock resistivity was more significant than that of clay conductivity, as the clay conductivity also varied with temperature. Conversely, the influence of clay conductivity on the resistivity index was more significant.
According to Equation (11), the resistivity index of pure sandstone was independent of the formation water conductivity. Thus, although there was a large temperature difference between the surface and the subsurface, the Archie equation parameters calculated from laboratory experiments could be used for downhole situations. However, the resistivity index of clayey sandstone was affected by clay conductivity, that is, it depended on the ratio of clay conductivity to formation water conductivity. The larger the ratio is, the flatter the shape of the curve. This indicates that the relationship between clay conductivity and formation water conductivity under HPHT affects the saturation index n of the Archie equation.
Based on the previous discussion, it can be inferred that the saturation index n in the Archie equation is primarily determined by the relationship between clay conductivity and formation water conductivity. Numerical simulation results can be used to directly calculate n under deep conditions. Simulations were conducted to investigate the effect of formation water salinity on rock resistivity, considering both the actual clay mineral proportions and pure illite. The simulation temperature was set at 140 °C, and the conductivity of clay was found to be similar for salinities ranging from 8000 to 30,000 mg/L, with the same contribution from clay conductivity at salinities of 20,000 and 30,000 mg/L. As shown in Figure 11, the curve of the rock resistivity index became steeper with increasing formation water salinity. When the formation water salinity was high, especially with a water saturation above 40%, the curve of the resistivity index basically overlapped. When the water saturation was low, clay became the main conductive pathway, and the curve of the resistivity index showed a downward bend. Therefore, for clay-bearing rocks, the saturation index n increased with increasing formation water salinity.
Using mathematical morphology methods of erosion and dilation operations, digital rocks with varying clay contents were constructed, as shown in Figure 12. The influence of clay content on rock resistivity under deep conditions was simulated, and the results are shown in Figure 13. As the clay content increased, the resistivity index decreased. The impact of clay content on the resistivity index was mainly reflected at low water saturation, with little difference in the resistivity index at high water saturation. As the saturation decreased, the pore water was no longer connected, leading to a significant increase in the resistivity index. When the clay content was low, the change in clay content had little effect on the resistivity index. Therefore, the clay content is also a factor to consider in practical applications.
In conclusion, rock conductivity is affected by factors such as formation water, temperature, and clay content. Temperature and salinity are the key factors that determine rock conductivity. As salinity increases, both the conductivity of the formation water and clay increase, but the clay conductivity will tend toward a certain extreme value, meaning that the higher the salinity is, the less significant the contribution of clay conductivity. As the temperature increases, both the conductivity of the formation water and the additional conductivity of clay increase. Considering the influence of temperature, salinity, and clay type, the saturation index n of the rock depends on the ratio of the clay conductivity to the formation water conductivity. The larger the ratio is, the smaller the value of n. The clay content is also a factor to consider, with n decreasing as the clay content increases at low water saturation.
Pressure has a significant impact on the electrical conductivity of rocks. In our study, mathematical morphology was used to simulate the overburden correction under high-pressure conditions. As pressure increases, the electrical conductivity of rocks tends to decrease. This is primarily attributed to the reduction in pore volume and the closure of interconnected pathways for fluid flow within the rock matrix. The reduction in pore volume leads to a decrease in the amount of conductive fluid present in the rock, resulting in a decrease in electrical conductivity. Additionally, under high-pressure conditions, the closure of microfractures and the compaction of the rock matrix can further restrict the movement of charged particles, reducing the overall conductivity. In 1965, Brace et al. [12] measured the electrical resistivity of eight igneous rocks and two crystalline limestones under different pressure. They found that with the increase of pressure, the resistivity of each rock increased, suggesting that some passages together with the conductive surface films were completely cut off. Subsequently, an increasing number of findings support this discovery. Jing et al. [16] conducted experimental measurements on sandstone under reservoir conditions and found that the rock conductivity decreases with increasing pressure and temperature. They attributed the changes in rock conductivity with pressure to rock deformation and compaction. Mahmood et al. [17] performed experimental measurements by varying pressure and observed a slight decrease in rock conductivity with increased confining pressure. Malekimostaghim et al. [42] investigated the variation of shale resistivity with increasing pressure and found there was a steady increase in the resistance of the samples as the confining pressure increased. It could be linked to the closure of the micro/nano pore space which increases the resistivity. To investigate the effect of pressure on rock’s resistivity, Kolah-kaj et al. [43] studied 39 limestone samples under seven different effective pressures and obtained similar conclusions. They believed that the tortuosity factor of the samples increased with effective pressure due to pore compaction. Therefore, the significant impact of pressure on the resistivity of rocks mainly arises from the changes in the rock pore structure.

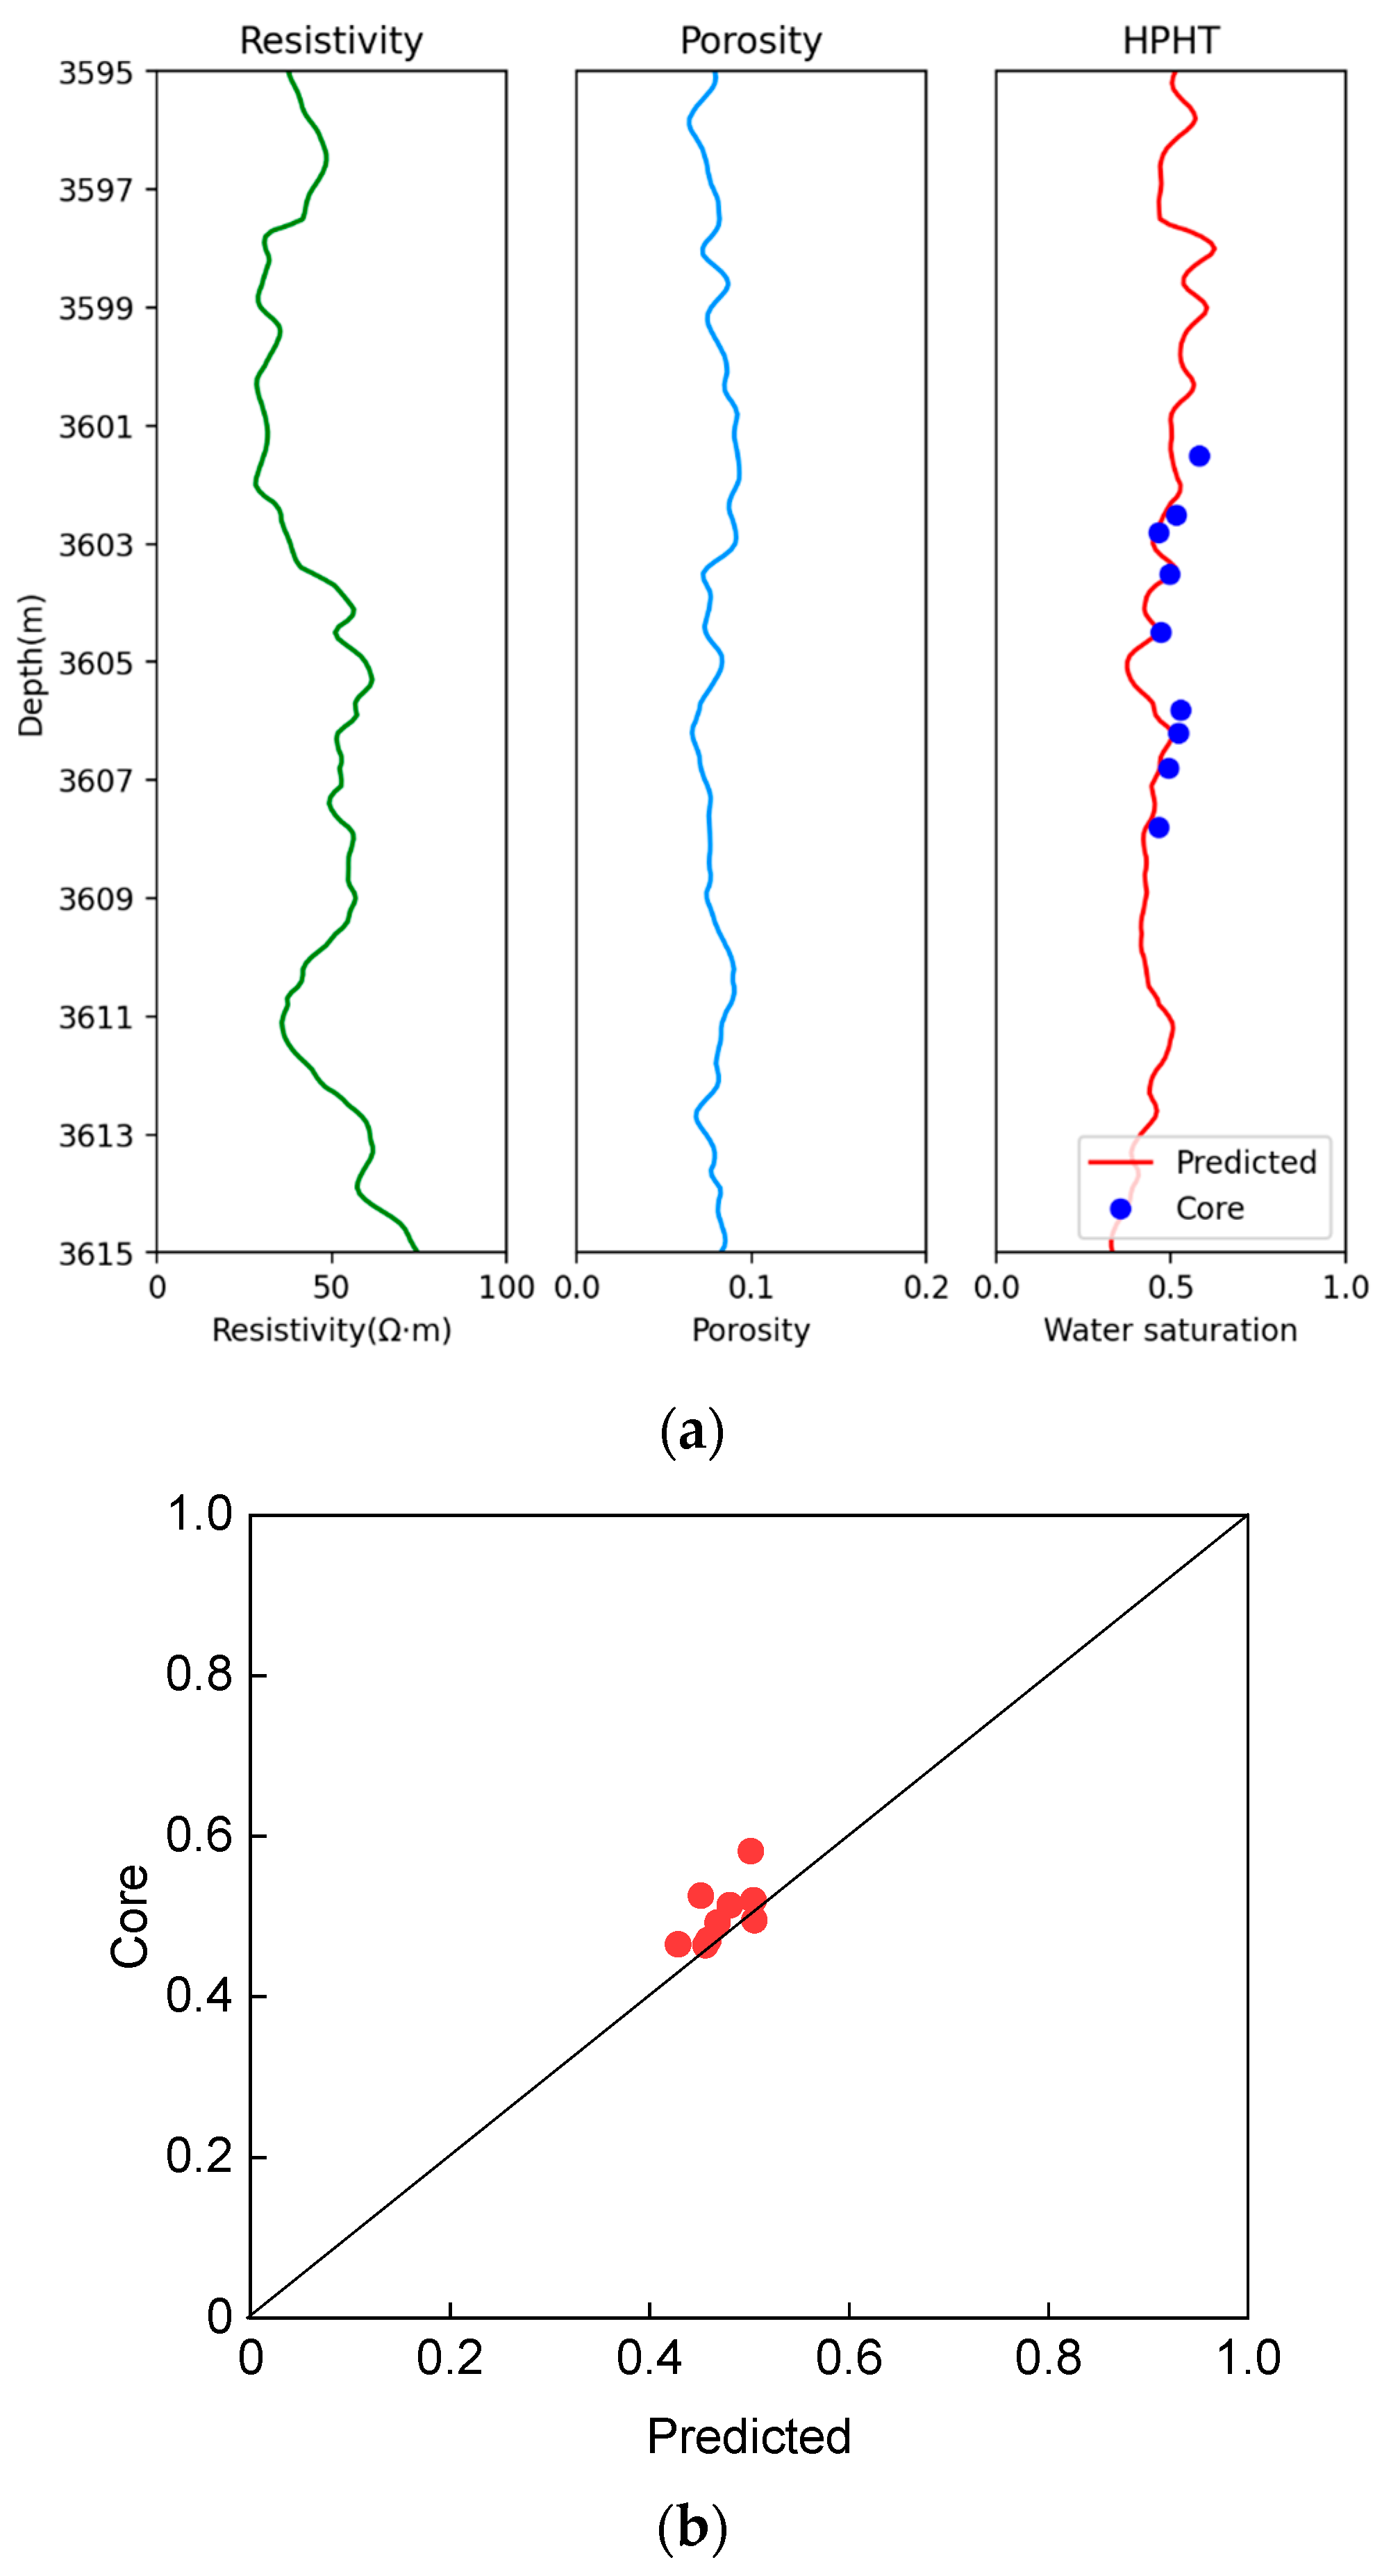
3.3. Well Logging Interpretations

According to the influence of different factors on rock conductivity, the numerical simulation under HPHT conditions was further applied to reservoir evaluation. The simulation results showed that for the selected formation, under HPHT conditions, m = 1.61, and n = 1.74. The formation water salinity was approximately 8000 mg/L, and the average clay content was 7.1%. The rock electrical parameters under HPHT conditions were then used in the Archie equation to calculate the water saturation of the reservoir. The calculation results are shown in Figure 14a, where the first curve is the resistivity, the second curve is the porosity, and the third curve is the comparison of the water saturation calculated under HPHT conditions with that obtained from the sealed coring analysis. The calculated water saturation under HPHT conditions agrees well with the sealed coring analysis (Figure 14b), with an average relative error of 6.8%. This indicates that the rock electrical parameters under HPHT conditions were more suitable for the local area.

4. Conclusions

The existing digital rock simulation methods for electrical properties are applicable under normal temperature and pressure conditions, and they cannot be directly applied to simulate the electrical characteristics of rocks in deep hydrocarbon reservoirs. Therefore, this study innovatively proposed a digital rock simulation workflow for high-temperature and high-pressure conditions, which was applied to resistivity well logging evaluation in deep hydrocarbon reservoirs. Based on the present research, we obtained the following conclusions:
(1) Using CT scanning, 3D multi-component digital rocks were constructed. Mathematical morphology methods were employed to correct the overburden effect of rock permeability measurements. Based on the variation in formation water and clay mineral conductivity under HPHT conditions, the conductivity of rock components was determined. A deep HPHT numerical simulation was established, and the electrical simulation of deep reservoirs was carried out using the in-house FEM code [30]. The simulation results were in good agreement with the experimental measurements, demonstrating the accuracy of the simulation results;
(2) The conductivity of rock is influenced by factors such as formation water, temperature, and clay. The conductivity of formation water and clay increases with increasing salinity, but the contribution of clay gradually tends toward a certain maximum. The conductivity of formation water and the additional conductivity of clay both increase with increasing temperature. The saturation index n of the rock decreases with an increasing ratio of clay conductivity to formation water conductivity and with increasing clay content;
(3) The numerical simulation results under HPHT conditions were applied to calculate the water saturation from well logging data. The average relative error between the predicted water saturation under HPHT conditions and the sealed coring analysis was 6.8%. This work effectively simulated the pressure and temperature environment of deep reservoirs, reveals the electrical conductivity mechanism of sandstone under formation pressure and temperature conditions, and has good potential in the applied research of rock physical properties and quantitative evaluation of well logging data in deep reservoirs.

Author Contributions

Conceptualization, S.S. and W.Y.; methodology, S.S., Q.G., Y.C. and P.W.; software, P.W., Z.Z. and P.C.; validation, S.S., P.W., Z.Z. and Y.Y.; investigation, S.S. and Q.G.; resources, S.S., W.Y. and P.C.; data curation, S.S. and Y.Y.; writing—original draft preparation, S.S.; writing—review and editing, Q.G., W.Y. and P.C.; supervision, W.Y. and P.C.; project administration, W.Y.; funding acquisition, S.S. and W.Y. All authors have read and agreed to the published version of the manuscript.

Funding

This research work was funded by the National Natural Science Foundation of China (No. 42004098, No. 52074251, No. 42121005, and No. 92058211), Shandong Provincial Natural Science Foundation of China (No. ZR2020QD054), Fundamental Research Funds for the Central Universities (No. 862201013140), and 111 project (No. B20048).

Data Availability Statement

All data are included in the study.

Acknowledgments

The authors thank the anonymous reviewers for their valuable comments and suggestions, and the scholars for their guidance on the paper.

Conflicts of Interest

The authors declare no conflict of interest.

References

  1. Li, H. The analysis of temperature, pressure, salinity, and saturation effects on the electrical conductivity of soaked sandstone for geothermal exploration. In Proceedings of the 2016 SEG International Exposition and Annual Meeting, Dallas, TX, USA, 16–21 October 2016. [Google Scholar]
  2. Berg, C.F.; Kennedy, W.D.; Herrick, D.C. Conductivity in partially saturated porous media described by porosity, electrolyte saturation and saturation-dependent tortuosity and constriction factor. Geophys. Prospect. 2022, 70, 400–420. [Google Scholar] [CrossRef]
  3. Zhao, P.; Qin, R.; Pan, H.; Ostadhassan, M.; Wu, Y. Study on array laterolog response simulation and mud-filtrate invasion correction. Adv. Geo-Energy Res. 2019, 3, 175–186. [Google Scholar] [CrossRef]
  4. Cai, J.; Zhao, L.; Zhang, F.; Wei, W. Advances in multiscale rock physics for unconventional reservoirs. Adv. Geo-Energy Res. 2022, 6, 271–275. [Google Scholar] [CrossRef]
  5. Gao, L.; Xie, R.; Xiao, L.; Wang, S.; Xu, C. Identification of low-resistivity-low-contrast pay zones in the feature space with a multi-layer perceptron based on conventional well log data. Pet. Sci. 2022, 19, 570–580. [Google Scholar] [CrossRef]
  6. Sifré, D.; Hashim, L.; Gaillard, F. Effects of temperature, pressure and chemical compositions on the electrical conductivity of carbonated melts and its relationship with viscosity. Chem. Geol. 2015, 418, 189–197. [Google Scholar] [CrossRef] [Green Version]
  7. Ali, N.; Chen, J.; Fu, X.; Hussain, W.; Ali, M.; Hussain, M.; Anees, A.; Rashid, M.; Thanh, H.V. Prediction of Cretaceous reservoir zone through petrophysical modeling: Insights from Kadanwari gas field, Middle Indus Basin. Geosyst. Geoenviron. 2022, 1, 100058. [Google Scholar] [CrossRef]
  8. Aghli, G.; Moussavi-Harami, R.; Mohammadian, R. Reservoir heterogeneity and fracture parameter determination using electrical image logs and petrophysical data (a case study, carbonate Asmari Formation, Zagros Basin, SW Iran). Pet. Sci. 2020, 17, 51–69. [Google Scholar] [CrossRef] [Green Version]
  9. Guo, X.; Li, B.; Ni, H.; Mao, Z. Electrical conductivity of hydrous andesitic melts pertinent to subduction zones. J. Geophys. Res. Solid Earth 2017, 122, 1777–1788. [Google Scholar] [CrossRef] [Green Version]
  10. Zhu, L.; Zhang, C.; Zhang, Z.; Zhou, X. High-precision calculation of gas saturation in organic shale pores using an intelligent fusion algorithm and a multi-mineral model. Adv. Geo-Energy Res. 2020, 4, 135–151. [Google Scholar] [CrossRef]
  11. Hussain, W.H.; Ali, N.; Sadaf, R.; Hu, C.; Nykilla, E.E.; Ullah, A.; Iqbal, S.M.; Hussain, A.; Hussain, S. Petrophysical analysis and hydrocarbon potential of the lower Cretaceous Yageliemu Formation in Yakela gas condensate field, Kuqa Depression of Tarim Basin, China. Geosyst. Geoenviron. 2022, 1, 1001006. [Google Scholar] [CrossRef]
  12. Brace, W.F.; Orange, A.S.; Madden, T.R. The effect of pressure on the electrical resistivity of water-saturated crystalline rocks. J. Geophys. Res. 1965, 70, 5669–5678. [Google Scholar] [CrossRef]
  13. Yokoyama, H.; Nakatsuka, K.; Abe, M.; Watanabe, K. Temperature dependency of electrical resistivity of water saturated rocks and the possibility of underground temperature estimation. J. Geotherm. Res. Soc. JPN 1983, 5, 103–120. [Google Scholar]
  14. Longeron, D.G.; Argaud, M.J.; Bouvier, L. Resistivity index and capillary pressure measurements under reservoir conditions using crude oil. In Proceedings of the 1989 SPE Annual Technical Conference and Exhibition, San Antonio, TX, USA, 8–11 October 1989. [Google Scholar]
  15. Aboujafar, S.M.; Amara, M.A. A comparison between capillary and electrical properties of rock samples obtained at ambient conditions and reservoir conditions. In Proceedings of the 2013 North Africa Technical Conference and Exhibition, Cairo, Egypt, 15–17 April 2013. [Google Scholar]
  16. Jing, X.D.; Daltaban, T.S.; Archer, J.S. Experimental measurements on the effects of pressure and temperature on electric properties of natural and synthetic rocks. In Proceedings of the 1989 ISRM International Symposium, Pau, France, 30 August–2 September 1989. [Google Scholar]
  17. Mahmood, S.M.; Maerefat, N.L.; Chang, M.M. Laboratory measurements of electrical resistivity at reservoir conditions. SPE Form. Eval. 1991, 6, 291–300. [Google Scholar] [CrossRef]
  18. Liu, J.; Chai, X.; Yang, H.; Gu, D.; Wang, L. Measurement of Rock Electrical Parameters and Analysis of Influencing Factors of Quaternary Mudstone Biogas Reservoirs in Qaidam Basin. Energies 2022, 15, 9100. [Google Scholar] [CrossRef]
  19. Trantham, J.C.; Clampitt, R.L. Determination of oil saturation after waterflooding in an oil-wet reservoir the North Burbank Unit, Tract 97 Project. J. Pet. Technol. 1977, 29, 491–500. [Google Scholar] [CrossRef]
  20. Zhang, G.; Huang, C.; Hirasaki, G. Intepretation of wettability in sandstones with NMR analysis. Petrophysics 2000, 41, 223–233. [Google Scholar]
  21. Waxman, M.H.; Smits, L.J.M. Electrical conductivities in oil-bearing shaly sands. Soc. Petrol. Eng. J. 1968, 8, 107–122. [Google Scholar] [CrossRef]
  22. Waxman, M.H.; Thomas, E.C. Electrical conductivities in Shaly Sands-I. The relation between hydrocarbon saturation and resistivity index; II. The temperature coefficient of electrical conductivity. In Proceedings of the 1972 Fall Meeting of the Society of Petroleum Engineers of AIME, San Antonio, TX, USA, 8–11 October 1972. [Google Scholar]
  23. Andhumoudine, A.B.; Nie, X.; Zhou, Q.; Yu, J.; Kane, O.I.; Jin, L.; Djaroun, R.R. Investigation of coal elastic properties based on digital core technology and finite element method. Adv. Geo-Energy Res. 2021, 5, 53–63. [Google Scholar] [CrossRef]
  24. Yang, Y.; Wang, K.; Lv, Q.; Askari, R.; Mei, Q.; Yao, J.; Hou, J.; Zhang, K.; Li, A.; Wang, C. Flow simulation considering adsorption boundary layer based on digital rock and finite element method. Pet. Sci. 2021, 18, 183–194. [Google Scholar] [CrossRef]
  25. Zhao, J.; Chen, H.; Zhang, J.; Zhang, W.; Chen, G. Quantitative characterization of organic and inorganic pores in shale based on FIB-SEM. Front. Earth Sci. 2022, 10, 994312. [Google Scholar] [CrossRef]
  26. Tang, J.; Vincent-Bonnieu, S.; Rossen, W.R. CT Coreflood Study of Foam Flow for Enhanced Oil Recovery: The Effect of Oil Type and Saturation. Energy 2019, 188, 116022. [Google Scholar] [CrossRef]
  27. Gärttner, S.; Alpak, F.O.; Meier, A.; Ray, N.; Frank, F. Correction to: Estimating permeability of 3D micro-CT images by physics-informed CNNs based on DNS. Comput. Geosci. 2023, 27, 263. [Google Scholar] [CrossRef]
  28. Jacob, A.; Enzmann, F.; Hinz, C.; Kersten, M. Analysis of Variance of Porosity and Heterogeneity of Permeability at the Pore Scale. Transp. Porous. Med. 2019, 130, 867–887. [Google Scholar] [CrossRef]
  29. Hümbert, M.; Rimmel, O.; Grießer, A. Analysis of Fibers, Pores, and Mechanical Properties in μCT-scan of a Long Fiber-Reinforced Thermoplastic. Microsc. Microanal. 2022, 28 (Suppl. S1), 262–264. [Google Scholar] [CrossRef]
  30. Garboczi, E.J. Finite Element and Finite Difference Programs for Computing the Linear Electric and Elastic Properties of Digital Images of Random Materials; NIST Interagency/Internal Report (NISTIR); National Institute of Standards and Technology: Gaithersburg, MD, USA, 1998.
  31. Knackstedt, M.A.; Arns, C.H.; Sheppard, A.P.; Senden, T.J.; Sok, R.M.; Cinar, Y.; Padhy, G.S. Archie’s exponents in complex lithologies derived from 3D digital core analysis. In Proceedings of the SPWLA 48th Annual Logging Symposium, Austin, TX, USA, 10–14 June 2007. [Google Scholar]
  32. Jiang, L.; Sun, J.; Liu, X.; Wang, H. Study of different factors affecting the electrical properties of natural gas reservoir rocks based on digital cores. J. Geophys. Eng. 2011, 8, 366–371. [Google Scholar] [CrossRef]
  33. Nie, X.; Zou, C.; Li, Z.; Meng, X.; Qi, X. Numerical simulation of the electrical properties of shale gas reservoir rock based on digital core. J. Geophys. Eng. 2016, 13, 481–490. [Google Scholar]
  34. Yan, W.; Sun, J.; Zhang, J.; Yuan, W.; Zhang, L.; Cui, L.; Dong, H. Studies of electrical properties of low-resistivity sandstones based on digital rock technology. J. Geophys. Eng. 2018, 15, 153–163. [Google Scholar] [CrossRef] [Green Version]
  35. Fan, Y.; Pan, B.; Guo, Y.; Lei, J. Effects of Clay Minerals and Pore-Water Conductivity on Saturation Exponent of Clay-Bearing Sandstones Based on Digital Rock. Petrophysics 2020, 61, 352–362. [Google Scholar] [CrossRef]
  36. Wu, Y.; Lin, C.; Yan, W.; Liu, Q.; Zhao, P.; Ren, L. Pore-scale simulations of electrical and elastic properties of shale samples based on multicomponent and multiscale digital rocks. Mar. Petrol. Geol. 2020, 117, 104369. [Google Scholar] [CrossRef]
  37. Liu, X.; Yan, J.; Zhang, X.; Zhang, L.; Ni, H.; Zhou, W.; Fu, L.Y. Numerical upscaling of multi-mineral digital rocks: Electrical conductivities of tight sandstones. J. Petrol. Sci. Eng. 2021, 201, 108530. [Google Scholar] [CrossRef]
  38. Linden, S.; Cvjetkovic, T.; Glatt, E.; Wiegmann, A. An integrated approach to compute physical properties of core samples. In Proceedings of the International Symposium of the Society of Core Analysts, Avignon, France, 8–11 September 2014. [Google Scholar]
  39. Liu, X.; Sun, J.; Wang, H. Numerical simulation of rock electrical properties based on digital cores. Appl. Geophys. 2009, 6, 1–7. [Google Scholar] [CrossRef]
  40. Archie, G.E. The electrical resistivity log as an aid in determining some reservoir characteristics. Trans. AIME 1942, 146, 54–62. [Google Scholar] [CrossRef]
  41. Sen, P.N.; Goode, P.A. Influence of temperature on electrical conductivity on shaly sands. Geophysics 1992, 57, 89–96. [Google Scholar] [CrossRef]
  42. Malekimostaghim, E.; Gholami, R.; Rezaee, R.; Asef, M.R.; Zhong, Z.; Sarmadivaleh, M. A laboratory-based approach to determine Archie’s cementation factor for shale reservoirs. J. Pet. Sci. Eng. 2019, 183, 106399. [Google Scholar] [CrossRef]
  43. Kolah-kaj, P.; Kord, S.; Soleymanzadeh, A. The effect of pressure on electrical rock typing, formation resistivity factor, and cementation factor. J. Pet. Sci. Eng. 2021, 204, 108757. [Google Scholar] [CrossRef]
Figure 1. QEMSCAN image and major component segmentation. (a) Original image, (b) pore (9.80%), (c) quartz (66.95%), (d) feldspar (7.26%), (e) illite (4.99%), (f) kaolinite (10.09%), and (g) chlorite (0.91%).
Processes 11 01758 g001
Figure 2. Comparison of image processing methods. (a) Original image, (b) filtered image, (c) segmentation of pores after filtering, (d) direct segmentation of pores.
Processes 11 01758 g002
Figure 3. Original 3D CT image and reconstructed 3D multi-component digital rock. (a) Original 3D CT image, (b) 3D multi-component digital rock.
Processes 11 01758 g003
Figure 4. Results of the overburden pore-pressure permeability experiment. (a) The porosity-permeability relationship under different pressures, (b) the porosity relationship under different pressures, (c) the permeability relationship under different pressures.
Processes 11 01758 g004
Figure 5. Comparison of the results before and after pressure correction, the red boxes highlight the changes in the image. (a) Before correction, (b) after correction.
Processes 11 01758 g005
Figure 6. Comparison of laboratory experiments and numerical simulations for the selected sample. (a) The relationship between resistivity and water saturation, and (b) the relationship between resistivity index and water saturation.
Processes 11 01758 g006
Figure 7. Comparison of HPHT experiments and numerical simulations.
Processes 11 01758 g007
Figure 8. Cross-section of simulation results. (ad): Digital rocks with 100% water saturation and 37% water saturation at NPT and HPHT. (eh): The corresponding current fields of digital rocks.
Processes 11 01758 g008
Figure 9. Relationship between rock conductivity and solution conductivity at different temperatures.
Processes 11 01758 g009
Figure 10. The influence of temperature and clay conductivity on rock conductivity. (a) The relationship between resistivity and water saturation, and (b) the relationship between resistivity index and water saturation.
Processes 11 01758 g010
Figure 11. The impact of formation water salinity on rock conductivity.
Processes 11 01758 g011
Figure 12. Digital rocks with varying clay contents. (a) Clay contents 2.20%, (b) clay contents 4.18%, (c) clay contents 7.38%, (d) clay contents 10.97%, (e) clay contents 16.38%, (f) clay contents 19.93%.
Processes 11 01758 g012
Figure 13. The influence of clay content on rock conductivity.
Processes 11 01758 g013
Figure 14. Prediction of the water saturation of a well in the study area. (a) Calculation result, (b) cross-plot of calculation results and core data.
Processes 11 01758 g014
Table 1. Digital rock components before and after correction.
ComponentPore
(%)
Clay
(%)
Quartz
(%)
Feldspar
(%)
Absolute Permeability (mD)
Original11.3010.9070.727.0850.06
Corrected10.3510.9671.617.0843.72
Table 2. CEC of each clay mineral.
Clay MineralMean CEC (mol/100 g)
Illite20
Kaolinite3
Disclaimer/Publisher’s Note: The statements, opinions and data contained in all publications are solely those of the individual author(s) and contributor(s) and not of MDPI and/or the editor(s). MDPI and/or the editor(s) disclaim responsibility for any injury to people or property resulting from any ideas, methods, instructions or products referred to in the content.

