Article

An Investigation on Optimized Performance of Voluteless Centrifugal Fans by a Class and Shape Transformation Function

1
School of Intelligent Manufacturing, Taizhou University, Taizhou 318000, China
2
School of Electronic and Information Engineering, Dalian Jiaotong University, Dalian 116028, China
3
Zhejiang Yilida Ventilator Co., Ltd., Taizhou 318056, China
*
Authors to whom correspondence should be addressed.
Processes 2023, 11(6), 1751; https://doi.org/10.3390/pr11061751
Submission received: 12 May 2023 / Revised: 1 June 2023 / Accepted: 6 June 2023 / Published: 8 June 2023
(This article belongs to the Special Issue Design and Optimization Method of Pumps)

Abstract

:
Class and shape transformation functions are proposed to carry out the parametric design of the blade profiles because fan efficiency is closely related to the shape of blade profiles. An optimization with the objectives of fan efficiency and static pressure based on the Kriging models was established, and numerical simulation data were applied to construct the Kriging models. The dissipation function was used to analyze the fan energy loss. The prediction results show that the maximum accuracy error between the Kriging model and the experimental data is approximately 0.81%. Compared with the prototype fan, the optimized fan was able to ameliorate the distribution of the flow field pressure and velocity; the outlet static pressure increased by 9.03%, and the efficiency increased by 2.35%. The dissipation function is advantageous because it can intuitively indicate the location and amount of energy loss in the fan, while effectively obtaining the total energy loss as well. The situation of energy loss was mutually validated with the density of the static pressure contours and the streamline distribution. The flow fields at the leading edge of the optimized fans were improved by analysis of the dissipation function, and the leading edges of the three impellers selected from the Pareto front were narrower and flatter than those of the prototype fan.

1. Introduction

Multi-blade centrifugal fans have been widely utilized in the system of heating, ventilation and air conditioning equipment because of their smaller size, larger flow rate and higher pressure. However, the efficiency of voluteless centrifugal fans is usually not high without the diffusion effect of the volute, which have been focused on in recent yours.
It is well-known that the performance of a centrifugal fan is closely determined by the blade shape. The Bezier curve [1], B-spline curve [2] and NURBS curve [3,4] are usually applied to the parametric design of the fan blades in terms of this point. However, with the growing demand for high-rotation or high-curvature blade shapes, low-order splines are incapable of fitting curves. Class-shape-transformation (CST) is a high-precision parameterization method proposed by Kulfan [5], which can obtain high-precision shape design with fewer variables and is widely applied in airfoil optimization [6], compressor blade design [7], aircraft design [8], and other aeronautic field applications. This method is also beneficial for the parametric design of fan blades [9]. Despite the fact that numerical simulation costs a lot of time, if the three-dimensional fan numerical results are taken as an optimization object, surrogate models can be used for assisting the optimization design. Jin Kim et al. applied fourth-order Bezier curves combined with radial basis neural networks and response surface methods to optimize the single-channel axial flow fan [10] and the forward-curved blades centrifugal fan, respectively [2]. Sung Kim et al. made use of a 2k full factorial test and response surface methods to analyze the flow rate and total efficiency of the mixed flow pump [11]. Zhang et al. used the steepest descent method to optimize the total pressure efficiency at the high-flow rate of a backward non-volute fan [12]. Zhou et al. used Hicks–Henne functions with Kriging models followed by the non-dominated sorting genetic algorithm (NSGA-II) to optimize the flow rate and total pressure efficiency of centrifugal fans [13], and the results showed that the number of leading-edge vortices in the blade inlet area decreased after optimization and the aerodynamic noise in this region reduced as well.
Regarding lower-order nonlinear problems in a smaller database, Kriging models can provide a sufficient accuracy strategy by reducing the number of needed parameters in comparison with polynomial response surfaces or radial basis functions. Gradient-enhanced Kriging models provide more accurate predictions by adding derivative information to the correlation matrix, resulting in much more complexity of the model and lengthier parameter estimation [14]. Unlike neural networks, the equations of Kriging models are directly coupled with the database. The optimization process usually makes use of the Kriging model to restart the neural network when the process stagnates. Co-Kriging can establish a reasonable prediction model by using cheap data that comes from the empirical equations or simplified theory and expensive data that comes from the computational fluid dynamics or experimental tests. Li pointed out that the polynomial response surfaces can be used to accesses the lower-order nonlinear problems, while the Kriging models should be used for lower-order nonlinear problems in high-dimensional design spaces, and neural network should be used for higher-order nonlinear problems [15]. In regard to the fan blade optimization problems, the response order of the performance to design parameters is lower and variable numbers are fewer. Therefore, Kriging models are the best optimization approach for fan blades.
The flow loss can be measured using the total efficiency, total pressure loss, entropy production and dissipation function [16]. Compared with entropy production and dissipation functions, the total efficiency and total pressure loss mainly figured out the evaluation of the overall performance and could not disclose the specific loss location and loss accumulation process in the flow field. Meanwhile, entropy production can demonstrate the quantity and position of flow losses caused by heat exchange or viscosity, leading to the good applications in centrifugal compressors [17,18] and turbines [19,20]. However, for a low-speed viscous flow with negligible temperature change, the work performed by the viscous force is the only source of energy loss. For this reason, dissipation function is more suitably applied to evaluate the performance of fans.
In this paper, an optimization of the blade shape within a three-dimensional centrifugal fan was performed. Expeiments were carried out to validate the numerical simulations and the surrogate models. A dissipation function was employed to assess the performance of the fans. The CST method in combination with Kriging models followed by the NSGA-II algorithm [21] was used to conduct a parametric optimization design of the blades. The difference between the optimized fan and the original fan was investigated, and the flow loss location and quantity of the fan flow fields were examined. The improvement rules for the blade shape have been summarized and discussed in detail.

2. Parametric Optimization Design of Fan Blades

2.1. Blades Shape Parametric Design

The coordinate system of the blade profile is X O Y , and the fan axis coordinate system is X O Y . It is assumed that the origin coordinate of X O Y is ( a , b ) in X O Y , and the axis of O X and O Y has a counterclockwise rotation angle θ relative to the axis of O X and O Y . There is the following relationship between the blade profile discrete point coordinates ( x , y ) in the coordinate system X O Y and ( x , y ) in the X O Y :
x = x cos θ y sin θ + a y = x sin θ + y cos θ + b
The principle of the CST method is to use a class function and a shape function to describe the blade geometric shape. The blade profile expressed by the CST method is as follows:
ζ ( ψ ) = C N 2 N 1 ( ψ ) S ( ψ ) + ψ Δ ζ ¯ T E
where ψ = x / c ,   c is the chord length of blade profiles, and Δ ζ ¯ T E is the percentage of the thickness of the blade profile trailing edge relative to the chord length, namely, Δ ζ ¯ T E = Δ ζ T E / c . C N 2 N 1 ( ψ ) is the class function, and S ( ψ ) is the shape function, both of which are expressed as follows:
C N 2 N 1 ( ψ ) = ψ N 1 ( 1 ψ ) N 2
S ( x ) = ζ ( x ) ψ Δ ζ ¯ T E ψ ( 1 ψ ) = i = 0 n A i ψ i
where N1, N2 defines the basic geometric shapes of different classes, N1 = 0.5 and N2 = 1.0 are suggested to fit the National Advisory Committee for Aeronautics (NACA) airfoils with round noses and pointed tails [5]. S ( x ) controls the shape variation from the leading edge to the trailing edge, and Bernstein polynomials are generally used to replace it, which can be expressed as:
B P i , n ( ψ ) = K i ψ i ( 1 ψ ) n i
K i n i = n ! i ! ( n i ) !
where n is the order of the Bernstein polynomial, K i is the combinatorial number of the shape function. Therefore, the shape function for any blade profile can be expressed as follows:
S ( x ) = i = 0 n A i B P i , n ( ψ )
A i can be obtained by fitting the initial blade profile coordinates with the least squares method.
A total of 100 points were taken uniformly from the upper and lower surfaces of the original blade profile, respectively, and 3rd to 5th order Bernstein polynomials were used to fit the curves. The results showed that when the upper surface adopted the 3rd order and the lower surface adopted the 4th order, the average relative error between the fitted points and the original points was 0.5% and 0.9%, respectively. Considering the errors were much lower than the errors of numerical simulations. Therefore, these orders were selected using the CST method in this study. The fitting effect is shown in Figure 1.

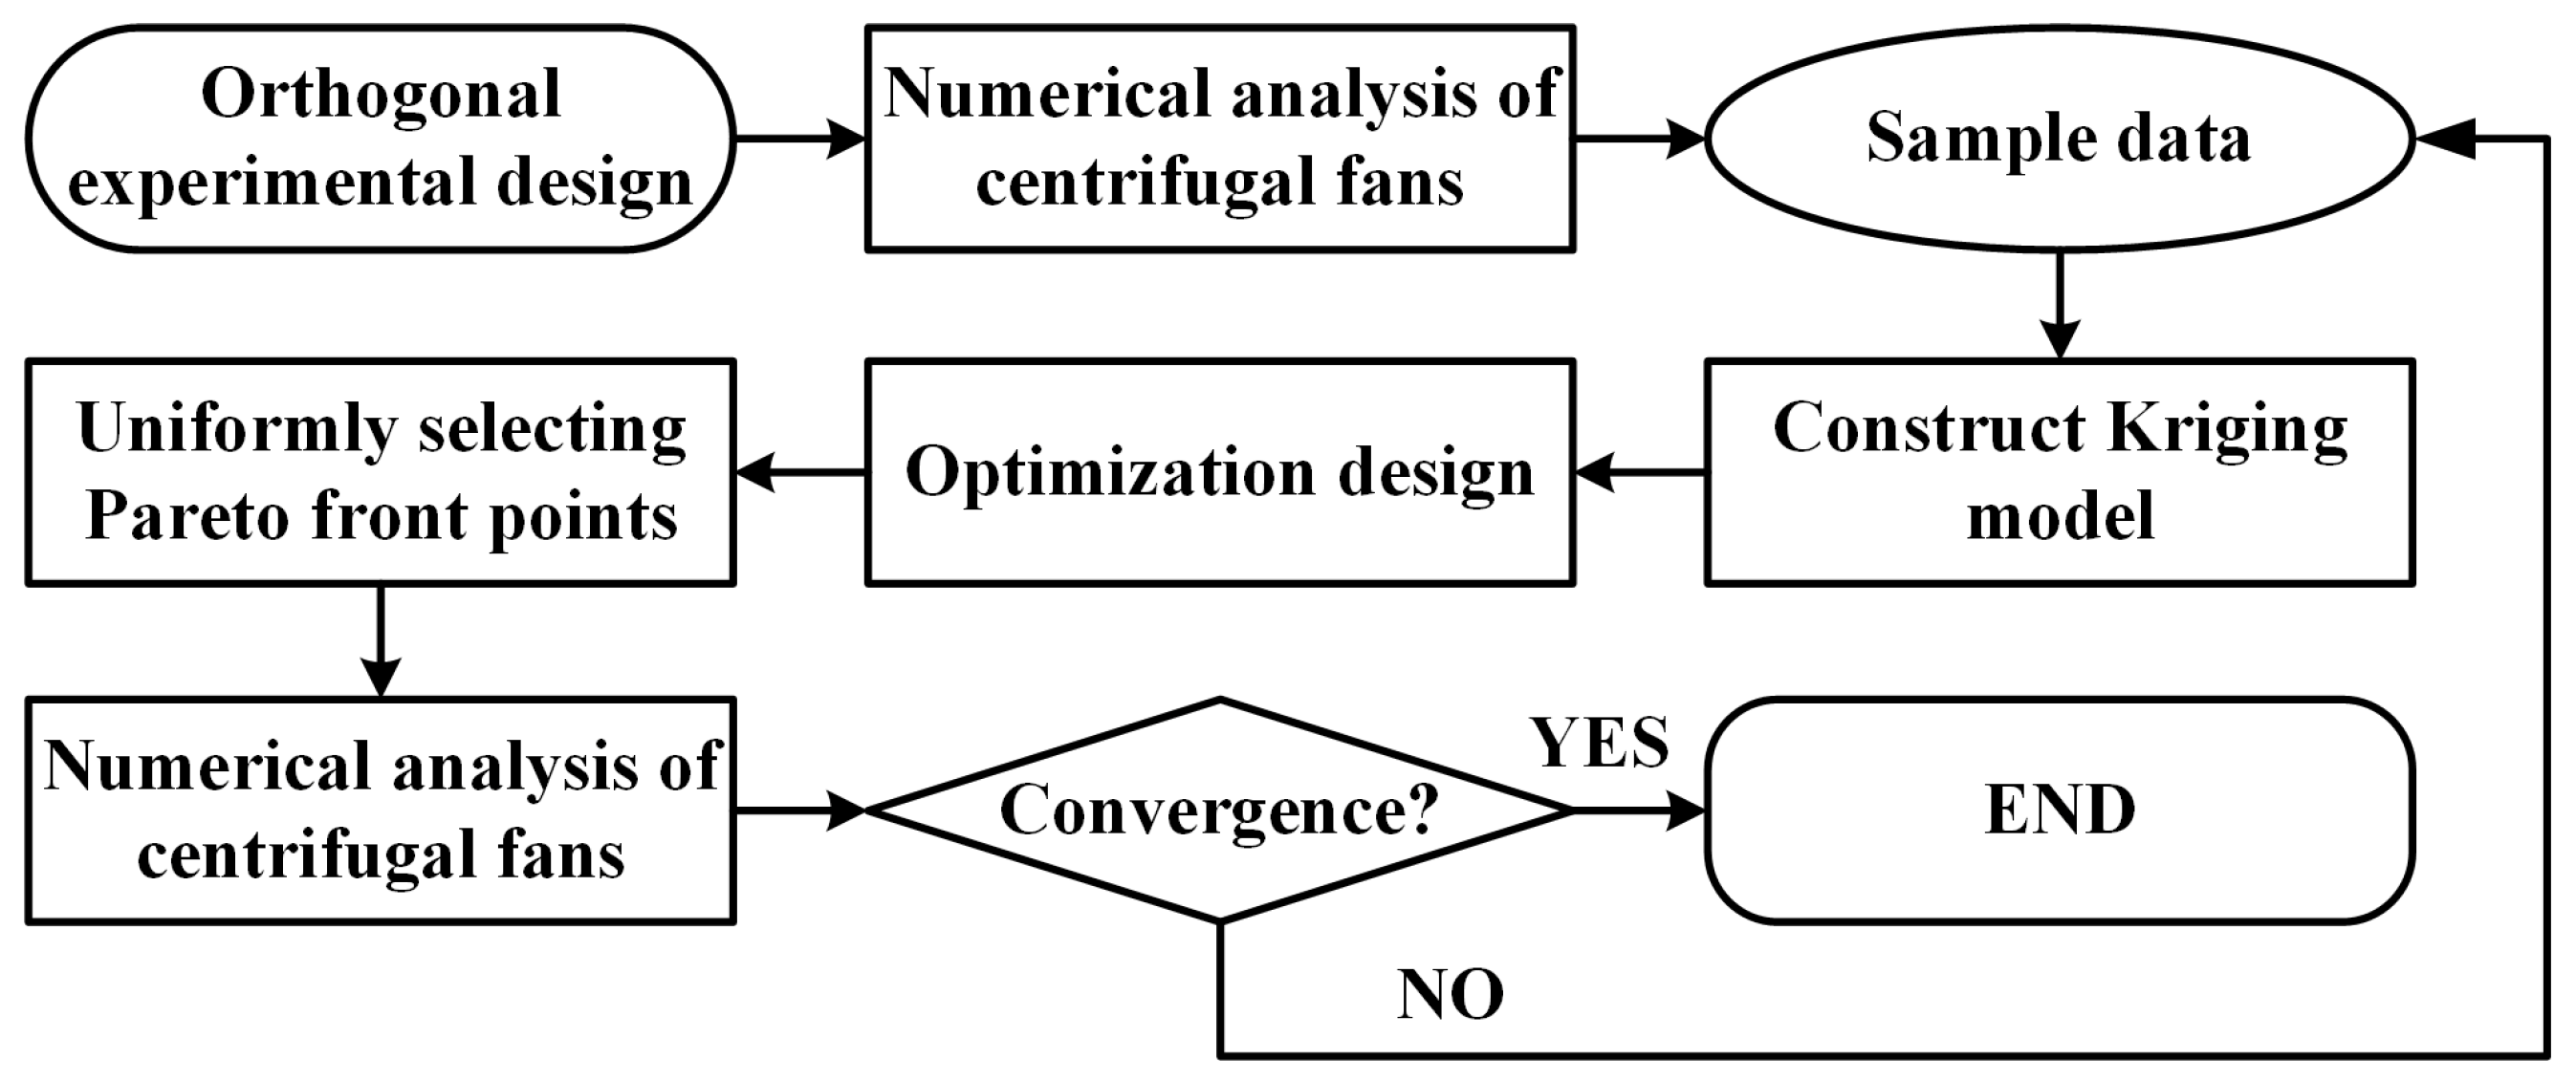
2.2. Optimization Schemes

The optimization scheme of the centrifugal fan is shown in Figure 2. Firstly, the orthogonal array testing was used to parametrically design 9 weighting factors from the shape function of the upper and lower blade profiles. The initial values of the weighting factors derived from the original blade profile are as follows: [0.507470; 0.389548; 0.397595; 0.156650; 0.290452; 0.427293; −0.065773; 0.159676; and −0.169225]. 9 factors and 3 levels of orthogonal tests were applied to fill the design space, and the range of the variables’ fluctuation was ±0.1. The new blade profiles were used to produce new three-dimensional fans with the other components unchanged. Numerical simulations were conducted on the new fans, and the results were taken to construct the Kriging model. An iterative process of the Kriging model was conducted by adding the Pareto front optimal points created by the optimization algorithm to the sample data. The NSGA-Ⅱ algorithm was adopted to optimize the blade profile. The number of initial population size was 20 and the number of evolutionary steps was 300 generations. Ten sample points were used for the cross-validation.
As a result, the root-mean-square error of the first-generation Kriging model constructed was 0.08931, and the second-generation error was 0.07541. The maximum error of the static pressure between the numerical results and the Kriging model for the 11 points, picked up evenly from the first-generation Pareto front, was 4.38%, while the maximum error of efficiency was 2.18%. For the 23 points on the second-generation Pareto front, the maximum pressure error became 0.81%, while the maximum efficiency error was 0.63%. These errors meet the convergence conditions, and the optimization is over.

3. Numerical Analysis and Experiment Test System

3.1. Geometric Parameters and Performance Indicators

The prototype fan model is shown in Figure 3, and the geometric parameters are shown in Table 1. The rated flow rate of the fan was 1.63 m3/s and the rotating speed was 2450 r/min. The fan blades were straight blades with a vector of [0.1382; 0.0932; 09860] relative to the fan coordinate system.
The fan pressure coefficient and flow coefficient are defined as follows:
ϑ = P s 1 2 ρ u 2
ϕ = Q m π 4 D 2 2 u 2
where ϑ is the pressure coefficient, ϕ is the flow coefficient, P s is the static pressure, Q m is the flow rate, D 2 is the impeller outlet diameter and u 2 is the tangential velocity of the impeller outlet. The dissipation function Φ is expressed as follows:
Φ = τ : S = μ e f f 2 S 2 3 ( · V ) I : S = μ e f f ( v x y + v y x ) 2 + ( v y z + v z y ) 2 + ( v x z + v z x ) 2 + 2 3 μ e f f ( v x x v y y ) 2 + ( v z z v x x ) 2 + ( v y y v z z ) 2
where τ is the stress tensor proportional to the viscosity, S is the strain rate tensor, I is the third-order identity matrix, and V is the velocity vector. μ e f f is the effective viscosity coefficient. According to the Boussinesq’s hypothesis, the turbulent shear stress is locally linearly correlation to the mean rate of strain, and the effective viscosity coefficient is approximately equal to the sum of the turbulent viscosity coefficient μ τ and the laminar flow viscosity coefficient μ [22].

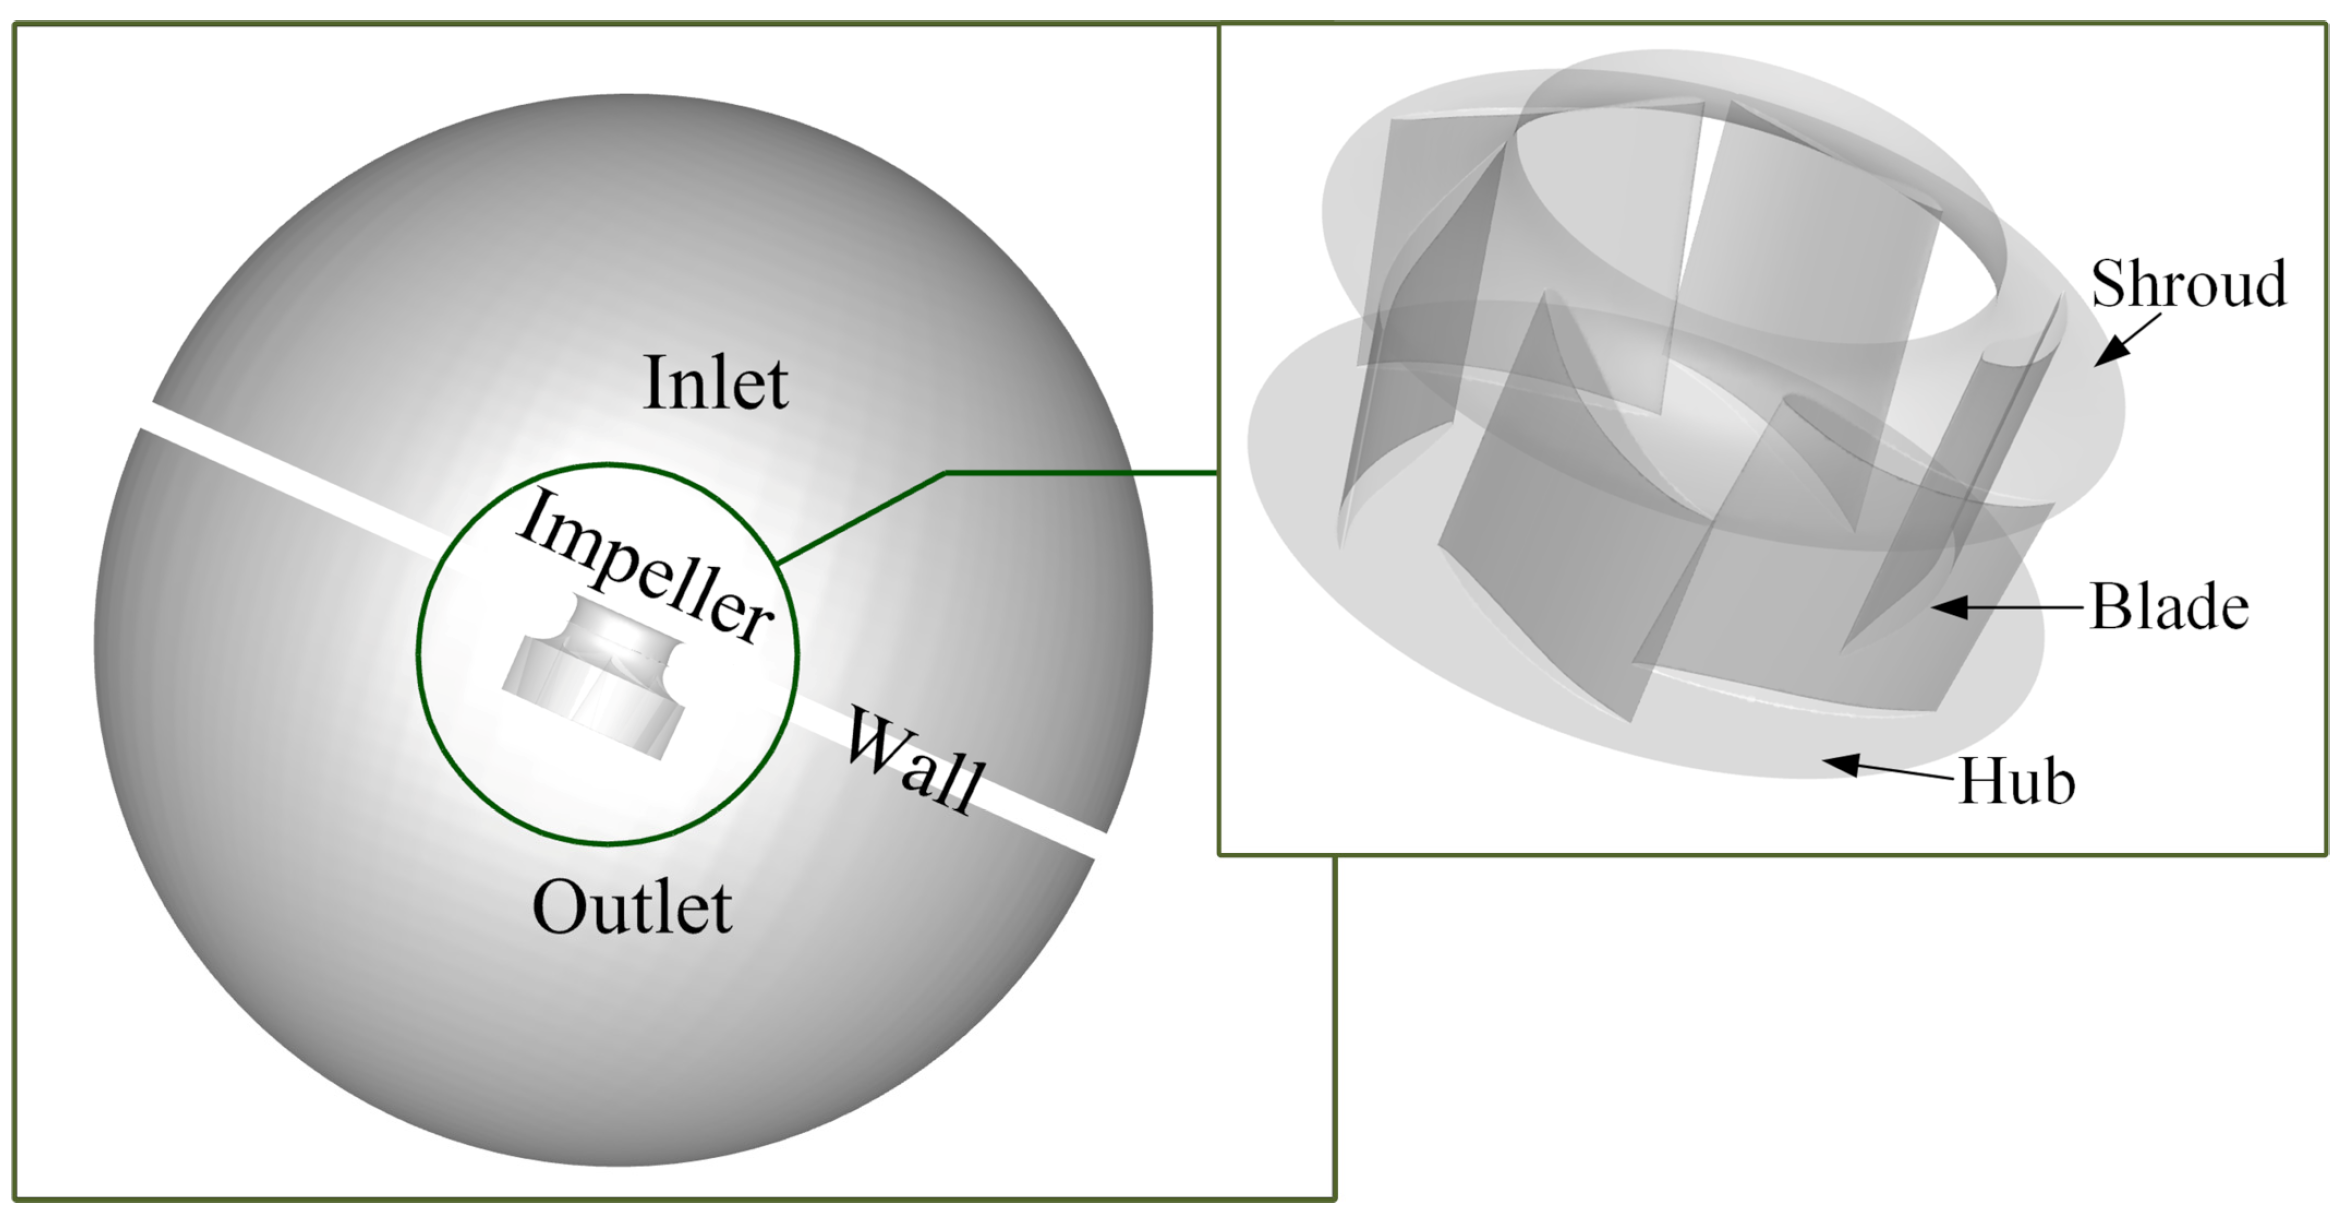
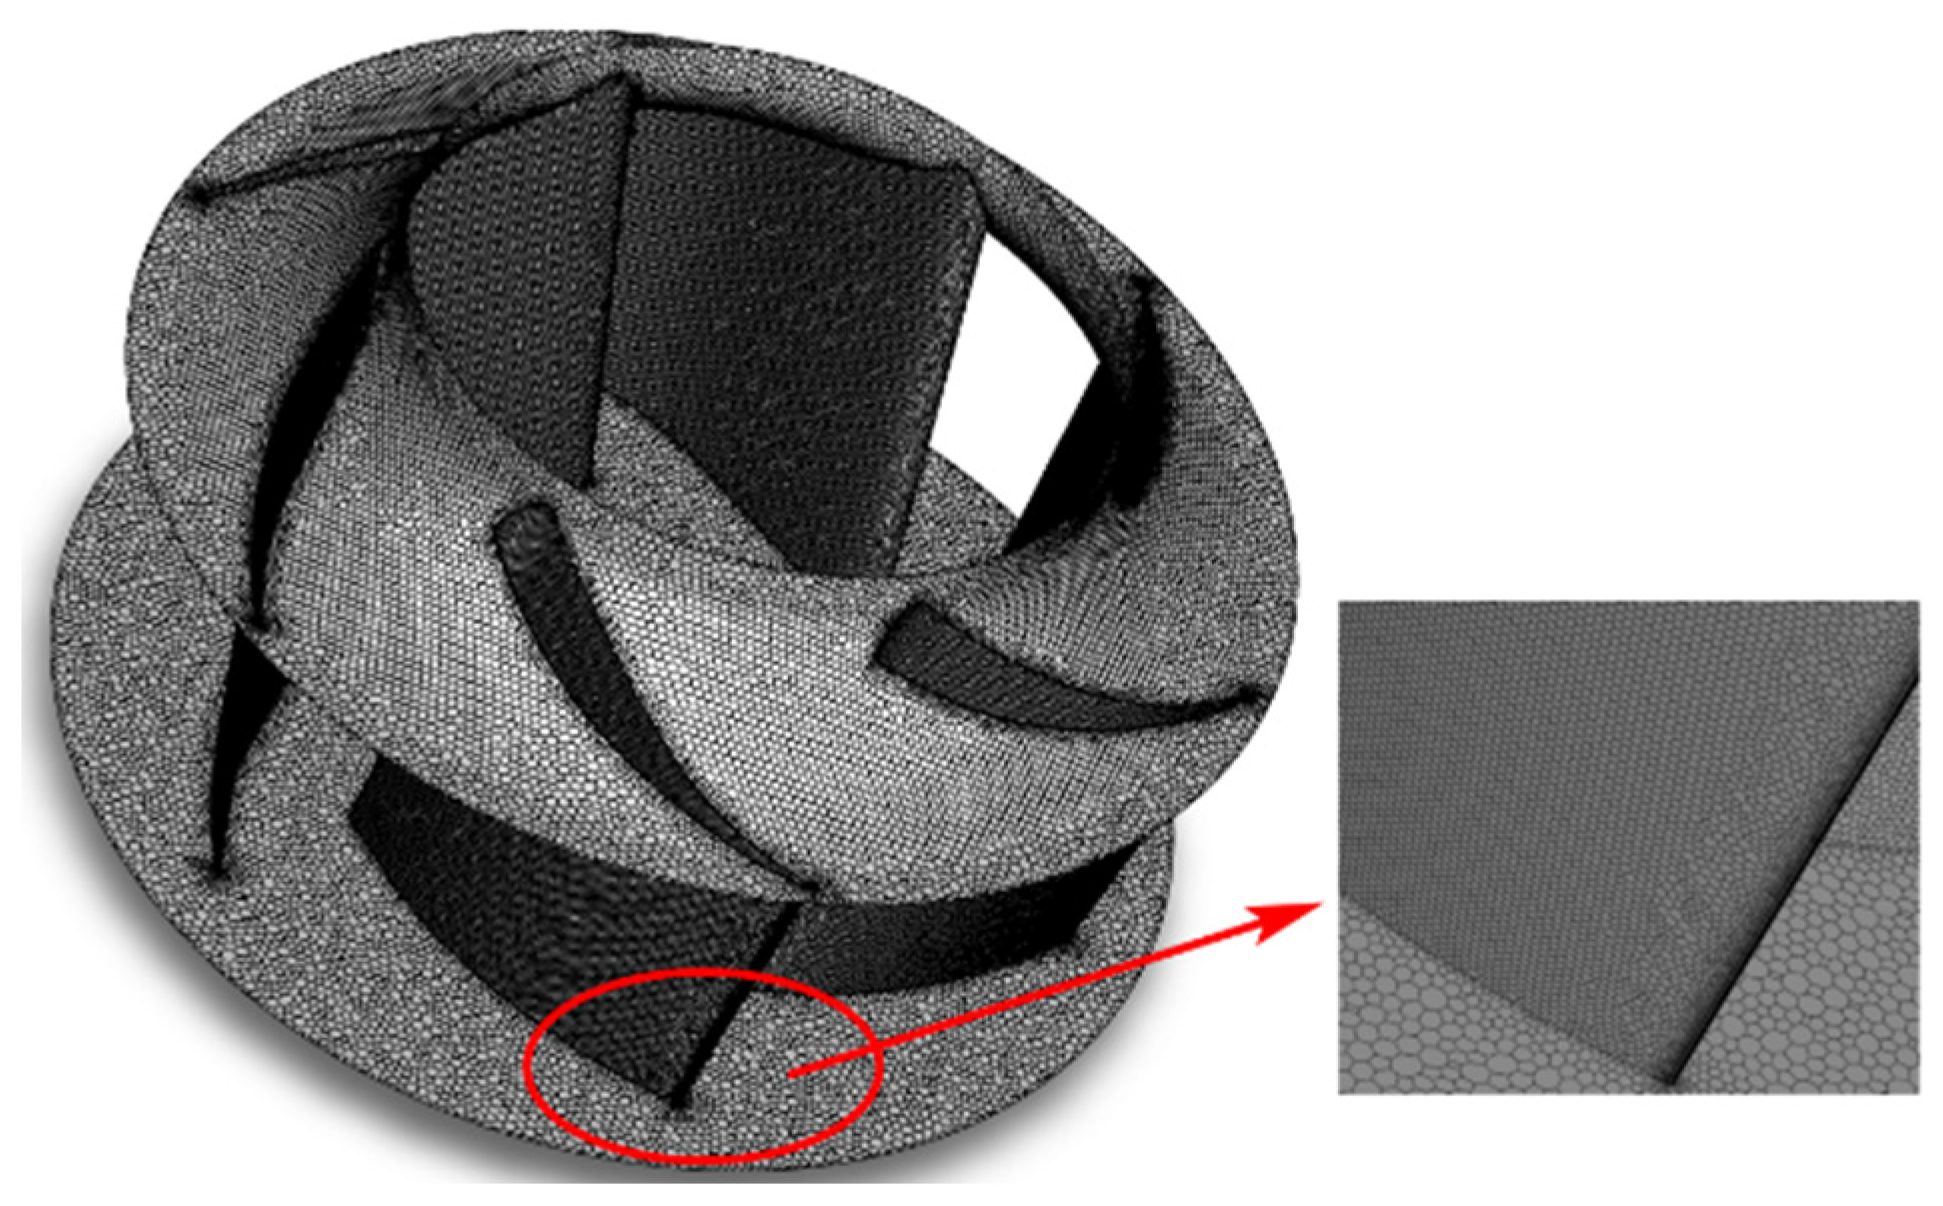
3.2. Numerical Method and Boundary Conditions

In this study, the commercial software CFX was used to analyze three-dimensional centrifugal fans. The fluid computing domain is shown in Figure 3, including the inlet zone, outlet zone and impeller zone. The boundary condition of the fan inlet was adopted as the mass flow inlet, with a flow rate of 2.256 kg/s, corresponding to a volume flow rate of 1.88 m3/s of the experimental data in Table 2. The fan outlet was set to the pressure outlet with atmospheric pressure. The blades, hub and shroud were set as rotation walls, and the rotation speed was 2450 r/min. The wind-guiding circle and other walls were set as stationary walls. The rotating part and the non-rotating part of the fan used a pair of dynamic and static interfaces to complete the data exchange.
The turbulence model uses the standard k ε model, and the near wall was treated with a standard wall function. The convection term was discretized using the second-order upwind scheme, and the diffusion term adopted the second-order central difference scheme, while the coupling of velocity and pressure adopted the SIMPLE algorithm. This simulation method has been applied to design a squirrel cage centrifugal fan with double arc blades [23] and to study vortex characteristics of a centrifugal fan near the volute outlet region [24] by Li et al.
Figure 4 shows that the static pressure varied with the number of grids. It can be found that the difference in static pressure between the 3 million grids and 12 million grids is 0.65%. In this paper, the number of grids chosen for the numerical simulation is about 7 million in the middle range. As the polyhedral grid has certain advantages in reducing the number of grids and improving the quality of the grid, the grids are finally transformed into a polyhedral grid, as shown in Figure 5.

3.3. Experimental Test

The aerodynamic performance test of the centrifugal fan was carried out in the wind tunnel laboratory of Zhejiang Yilida Ventilator Co., Ltd in Taizhou, China. The test system was mainly composed of a test fan, auxiliary fan, nozzle, pressure sensor and data acquisition system, as shown in Figure 6. The static pressure of the fan was measured using the pressure difference between the positive and negative pressure chambers measured with the pressure sensor, and the flow rate is calculated using the nozzle geometric parameters and the pressure difference between the front and rear of the nozzle.

4. Results and Discussion

4.1. Experimental Verification

The experimental verification of the pressure coefficient and efficiency under the four volume flow rates is shown in Table 2. The predictions were in good agreement with the experimental results at the rated operating conditions, with a maximum error of 5%. However, it becomes serious when the points are away from the rated conditions, especially in the pressure coefficient. This is due to the fact that inlet and outlet boundary conditions of numerical simulations are close to the ideal state, leading to a significant difference from the nonuniform airfield caused by the installation error of the inlet and outlet pipelines in the actual experimental facility.

4.2. Pareto Front Optimization Design

The Pareto front can be calculated from the two-objective optimization of the efficiency and outlet pressure of fans. A total of 250 points were obtained that formed the Pareto optimal solution. It can be observed that the performance of all the points on the Pareto front is superior to that of the prototype fan (the prototype fan has a static pressure of 1052 Pa and an efficiency of 73.63%), as shown in Figure 7. Three cases tended to capture the highest pressure, highest efficiency and moderate pressure, and the efficiency was extracted.
Comparisons between the Kriging model data and the simulation results are given in Table 3. Case zero is extracted from the first-generation optimization results, while case one, case two and case three are extracted from the second one. It can be noticed that the Kriging model data are very close to the numerical results, and the model error of second-generation Kriging is less than 1%, indicating that the Kriging model is very suitable for the fan blade optimization. Compared with the prototype fan with the optimized fan of case zero, the static pressure increased by 9.03%, and efficiency increased by 2.35%.
The blade profiles of the prototype and the three optimized fans are shown in Figure 8. The shape of the leading edge of the optimized fans was narrower and flatter than those of the prototype fan. The higher the efficiency of the fan, from case one to case three, the smaller the thickness of the front half of the blade profile. Fans with a higher static pressure, from case three to case one, reduce the curvature of the rear half of the blade profile.

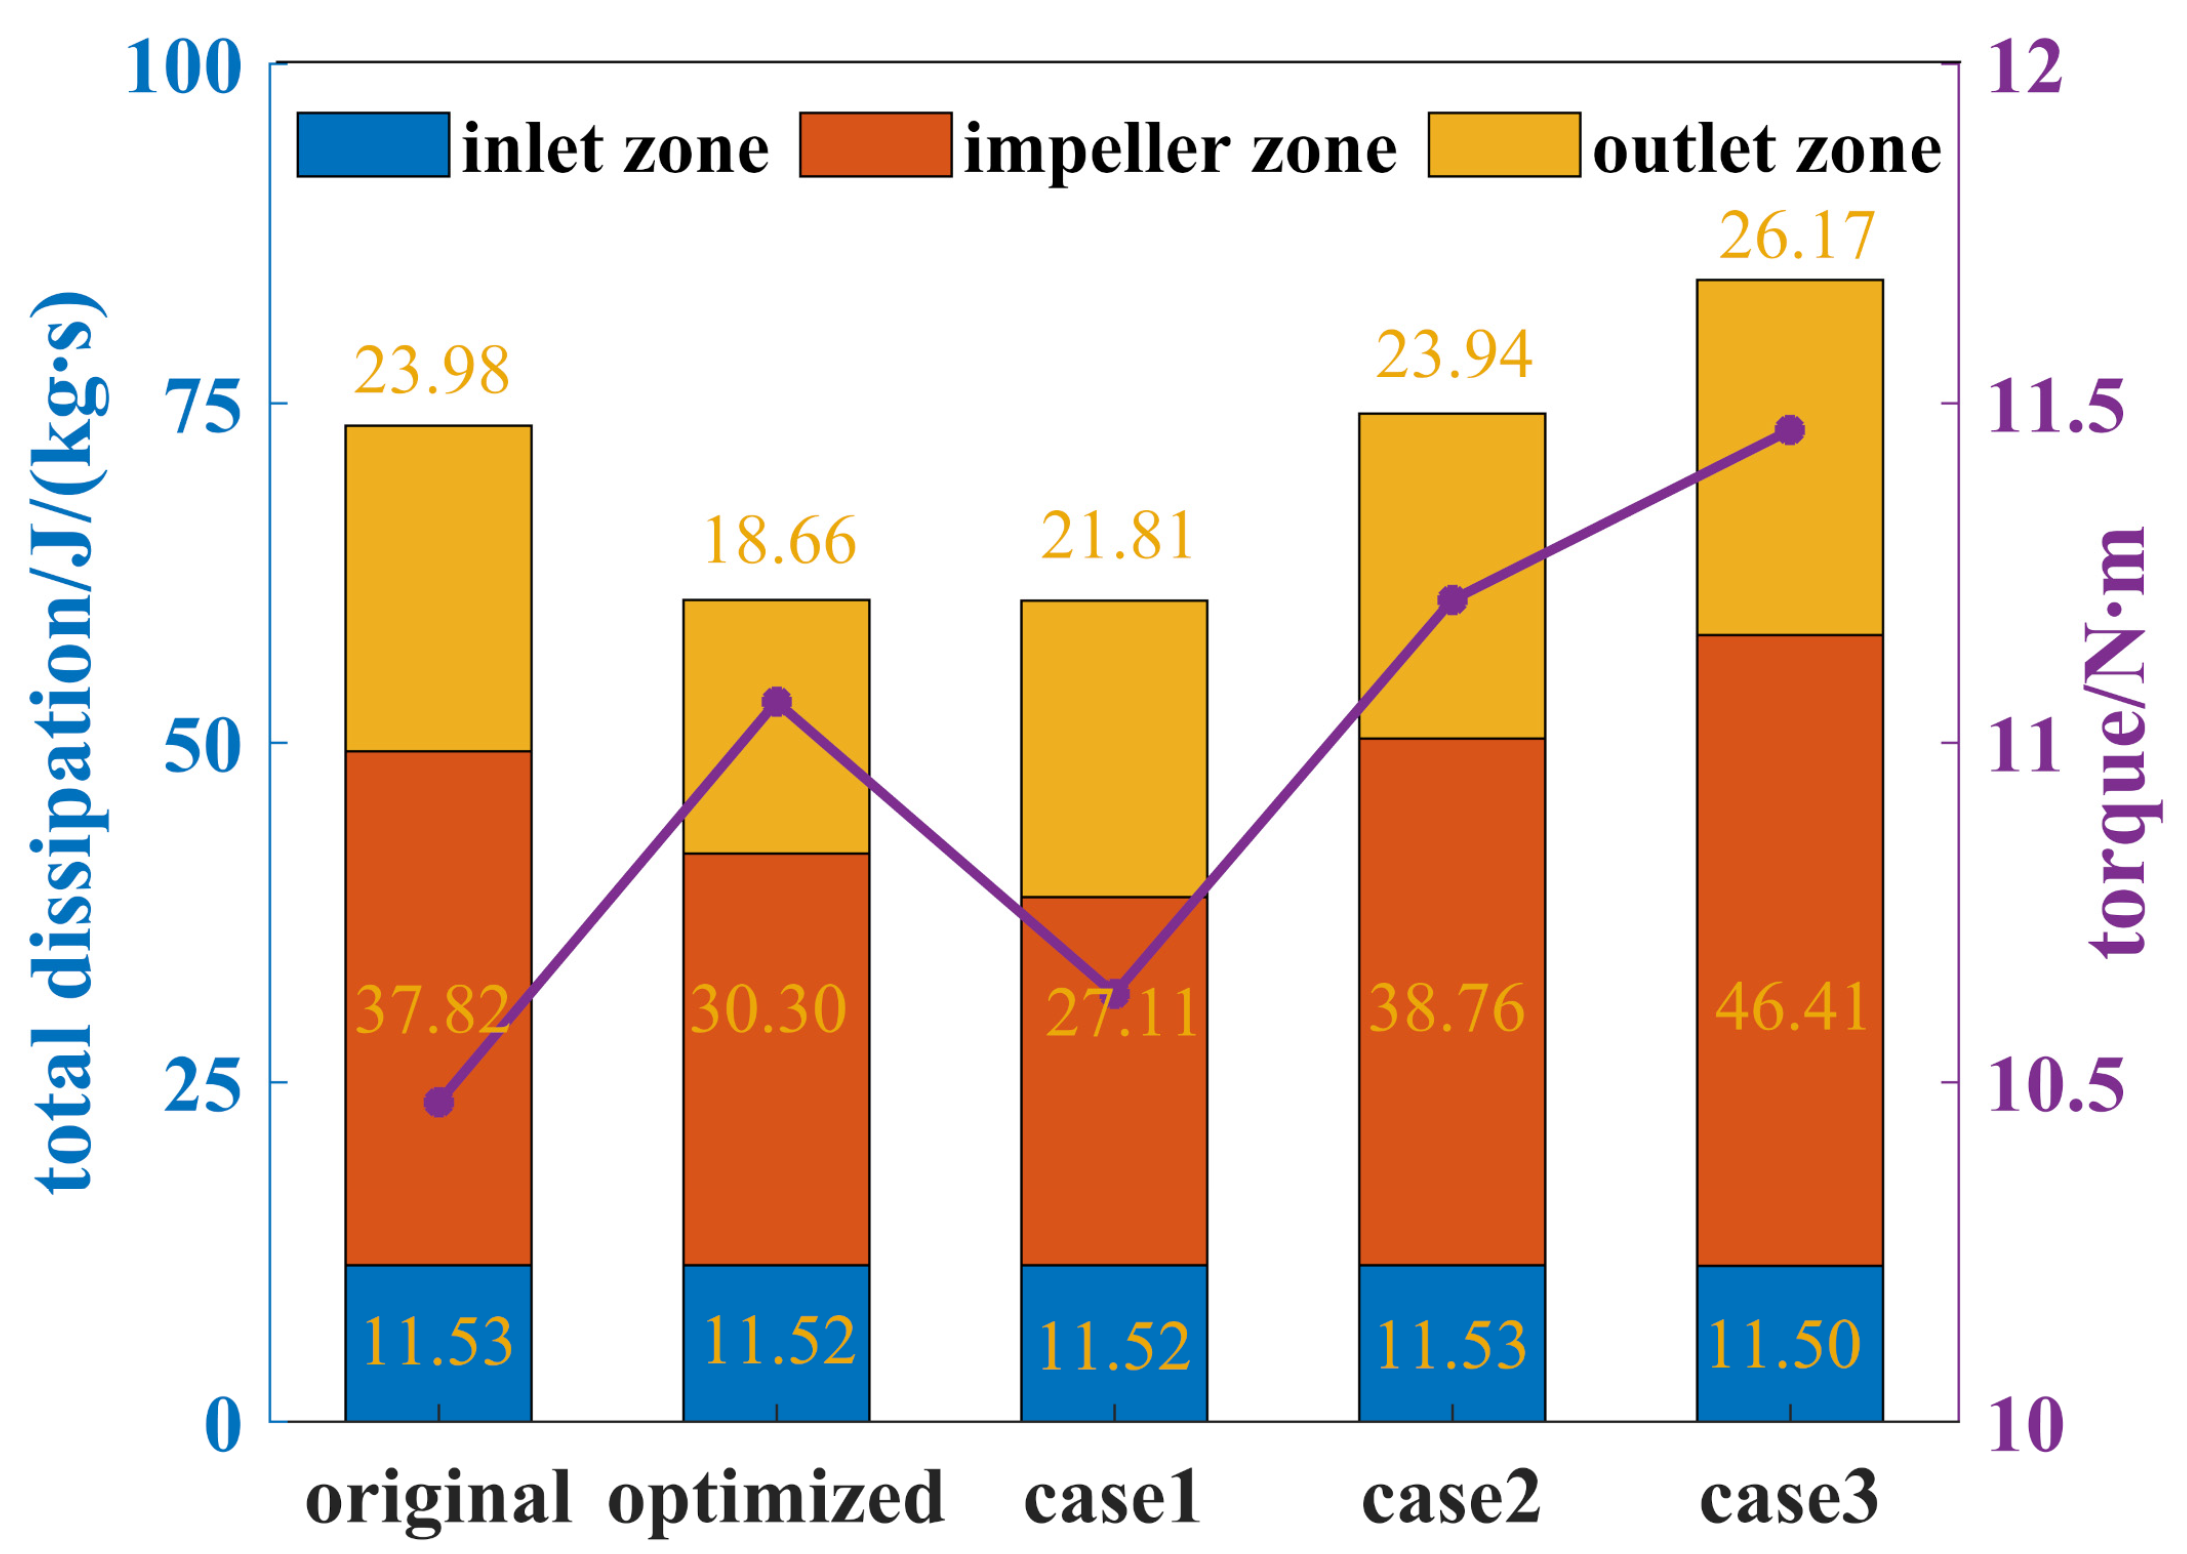
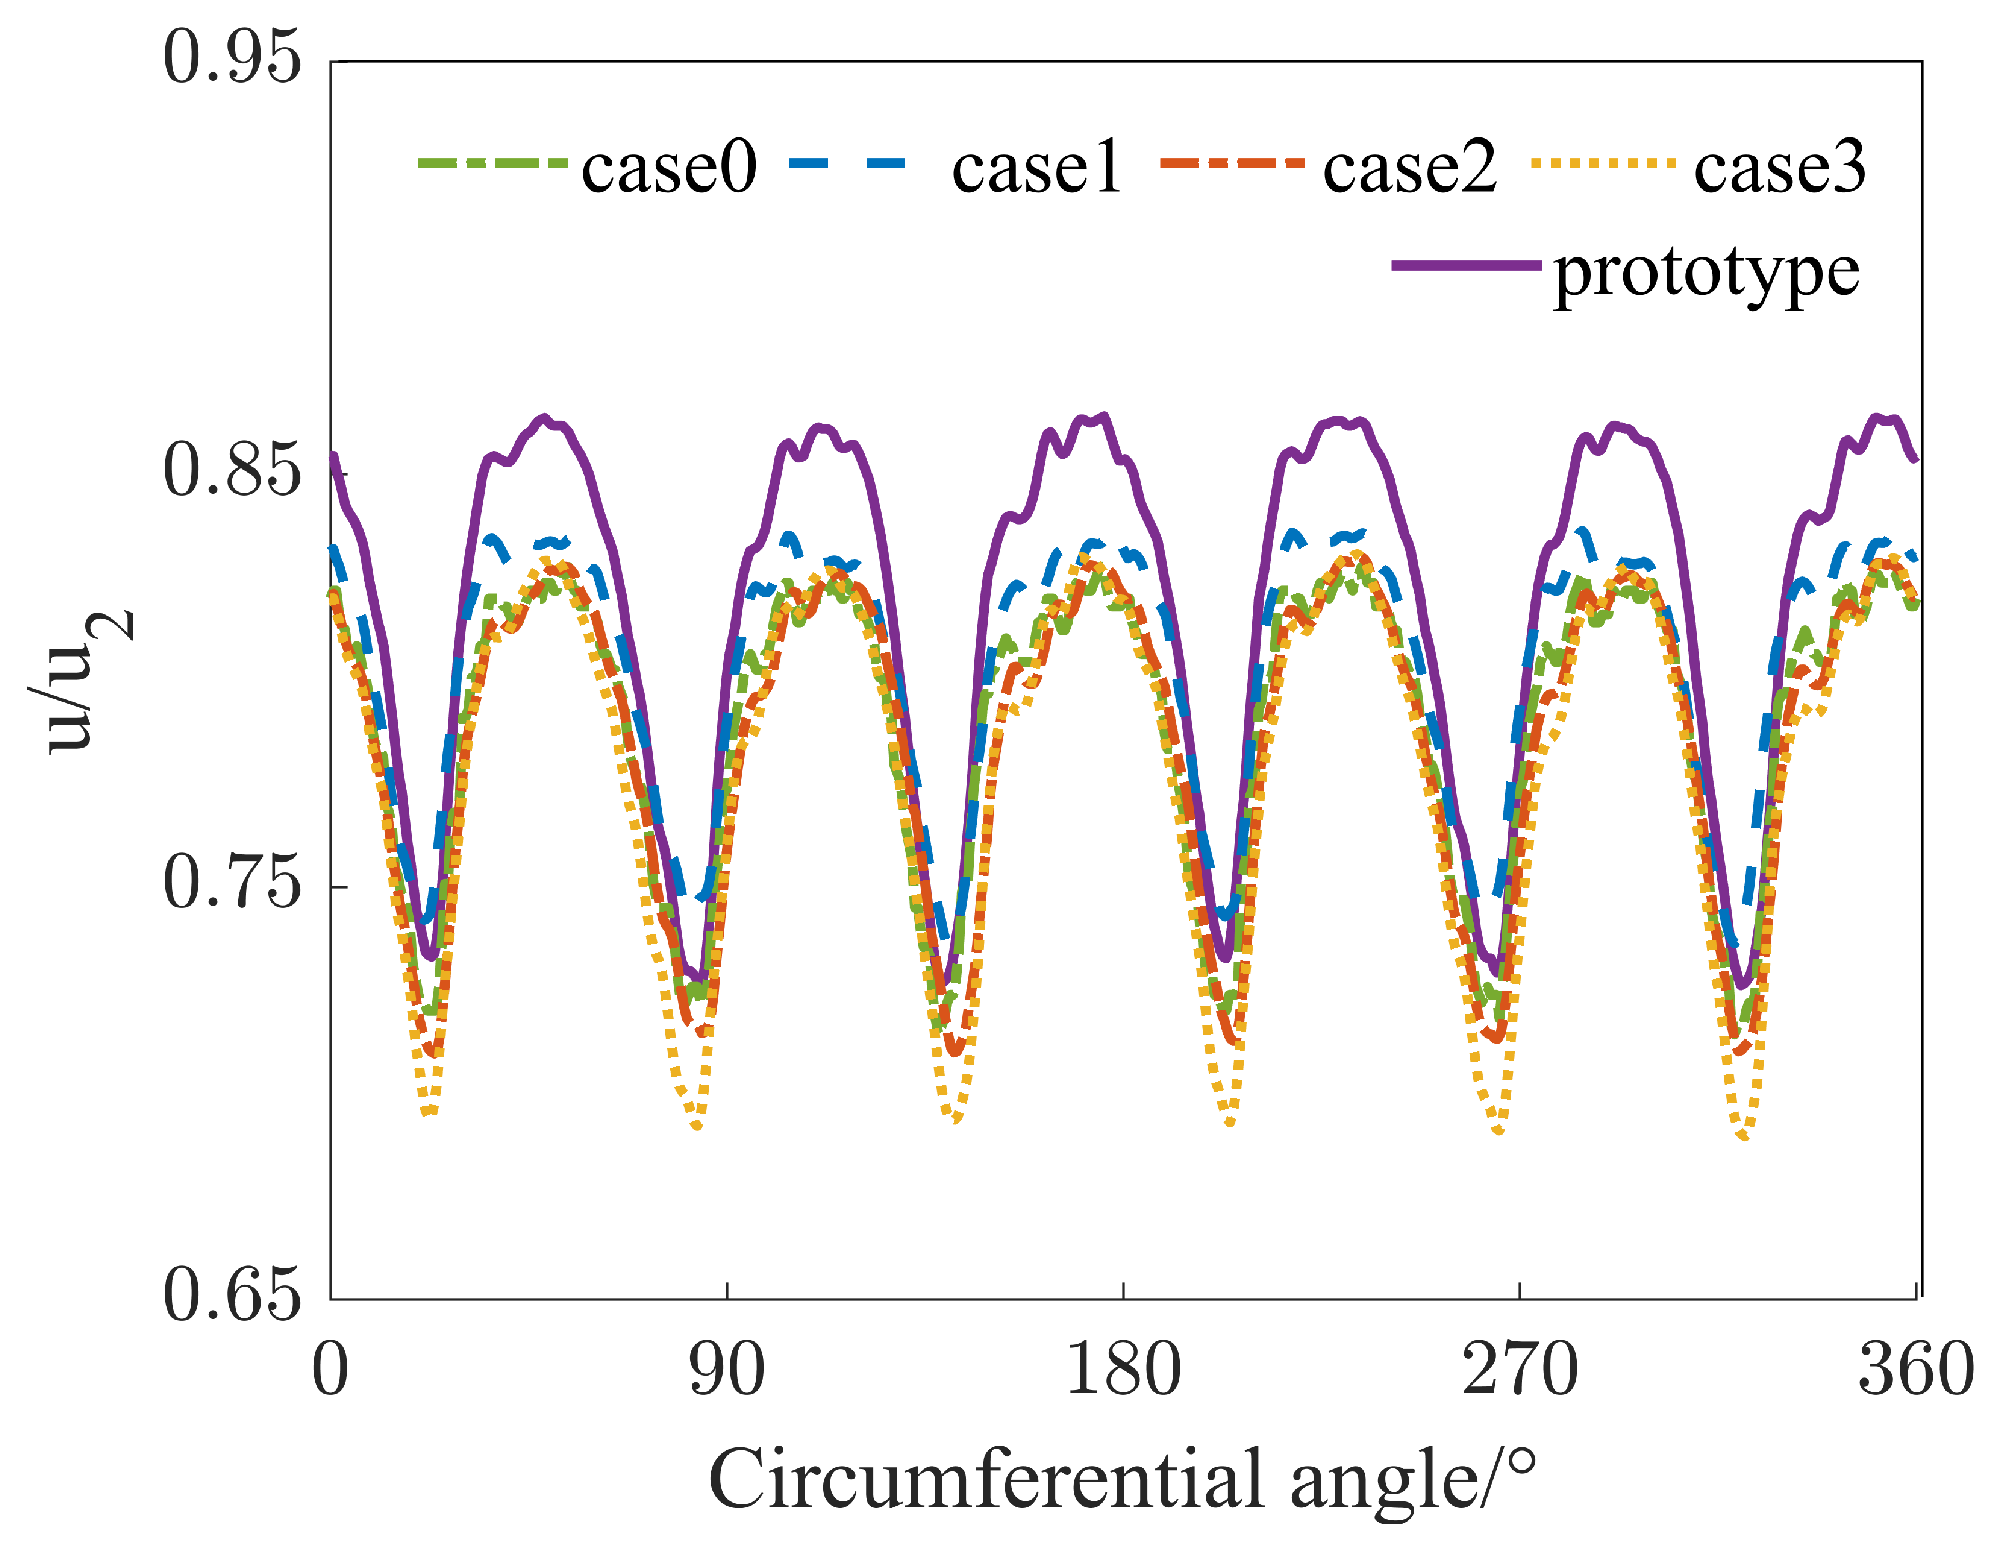
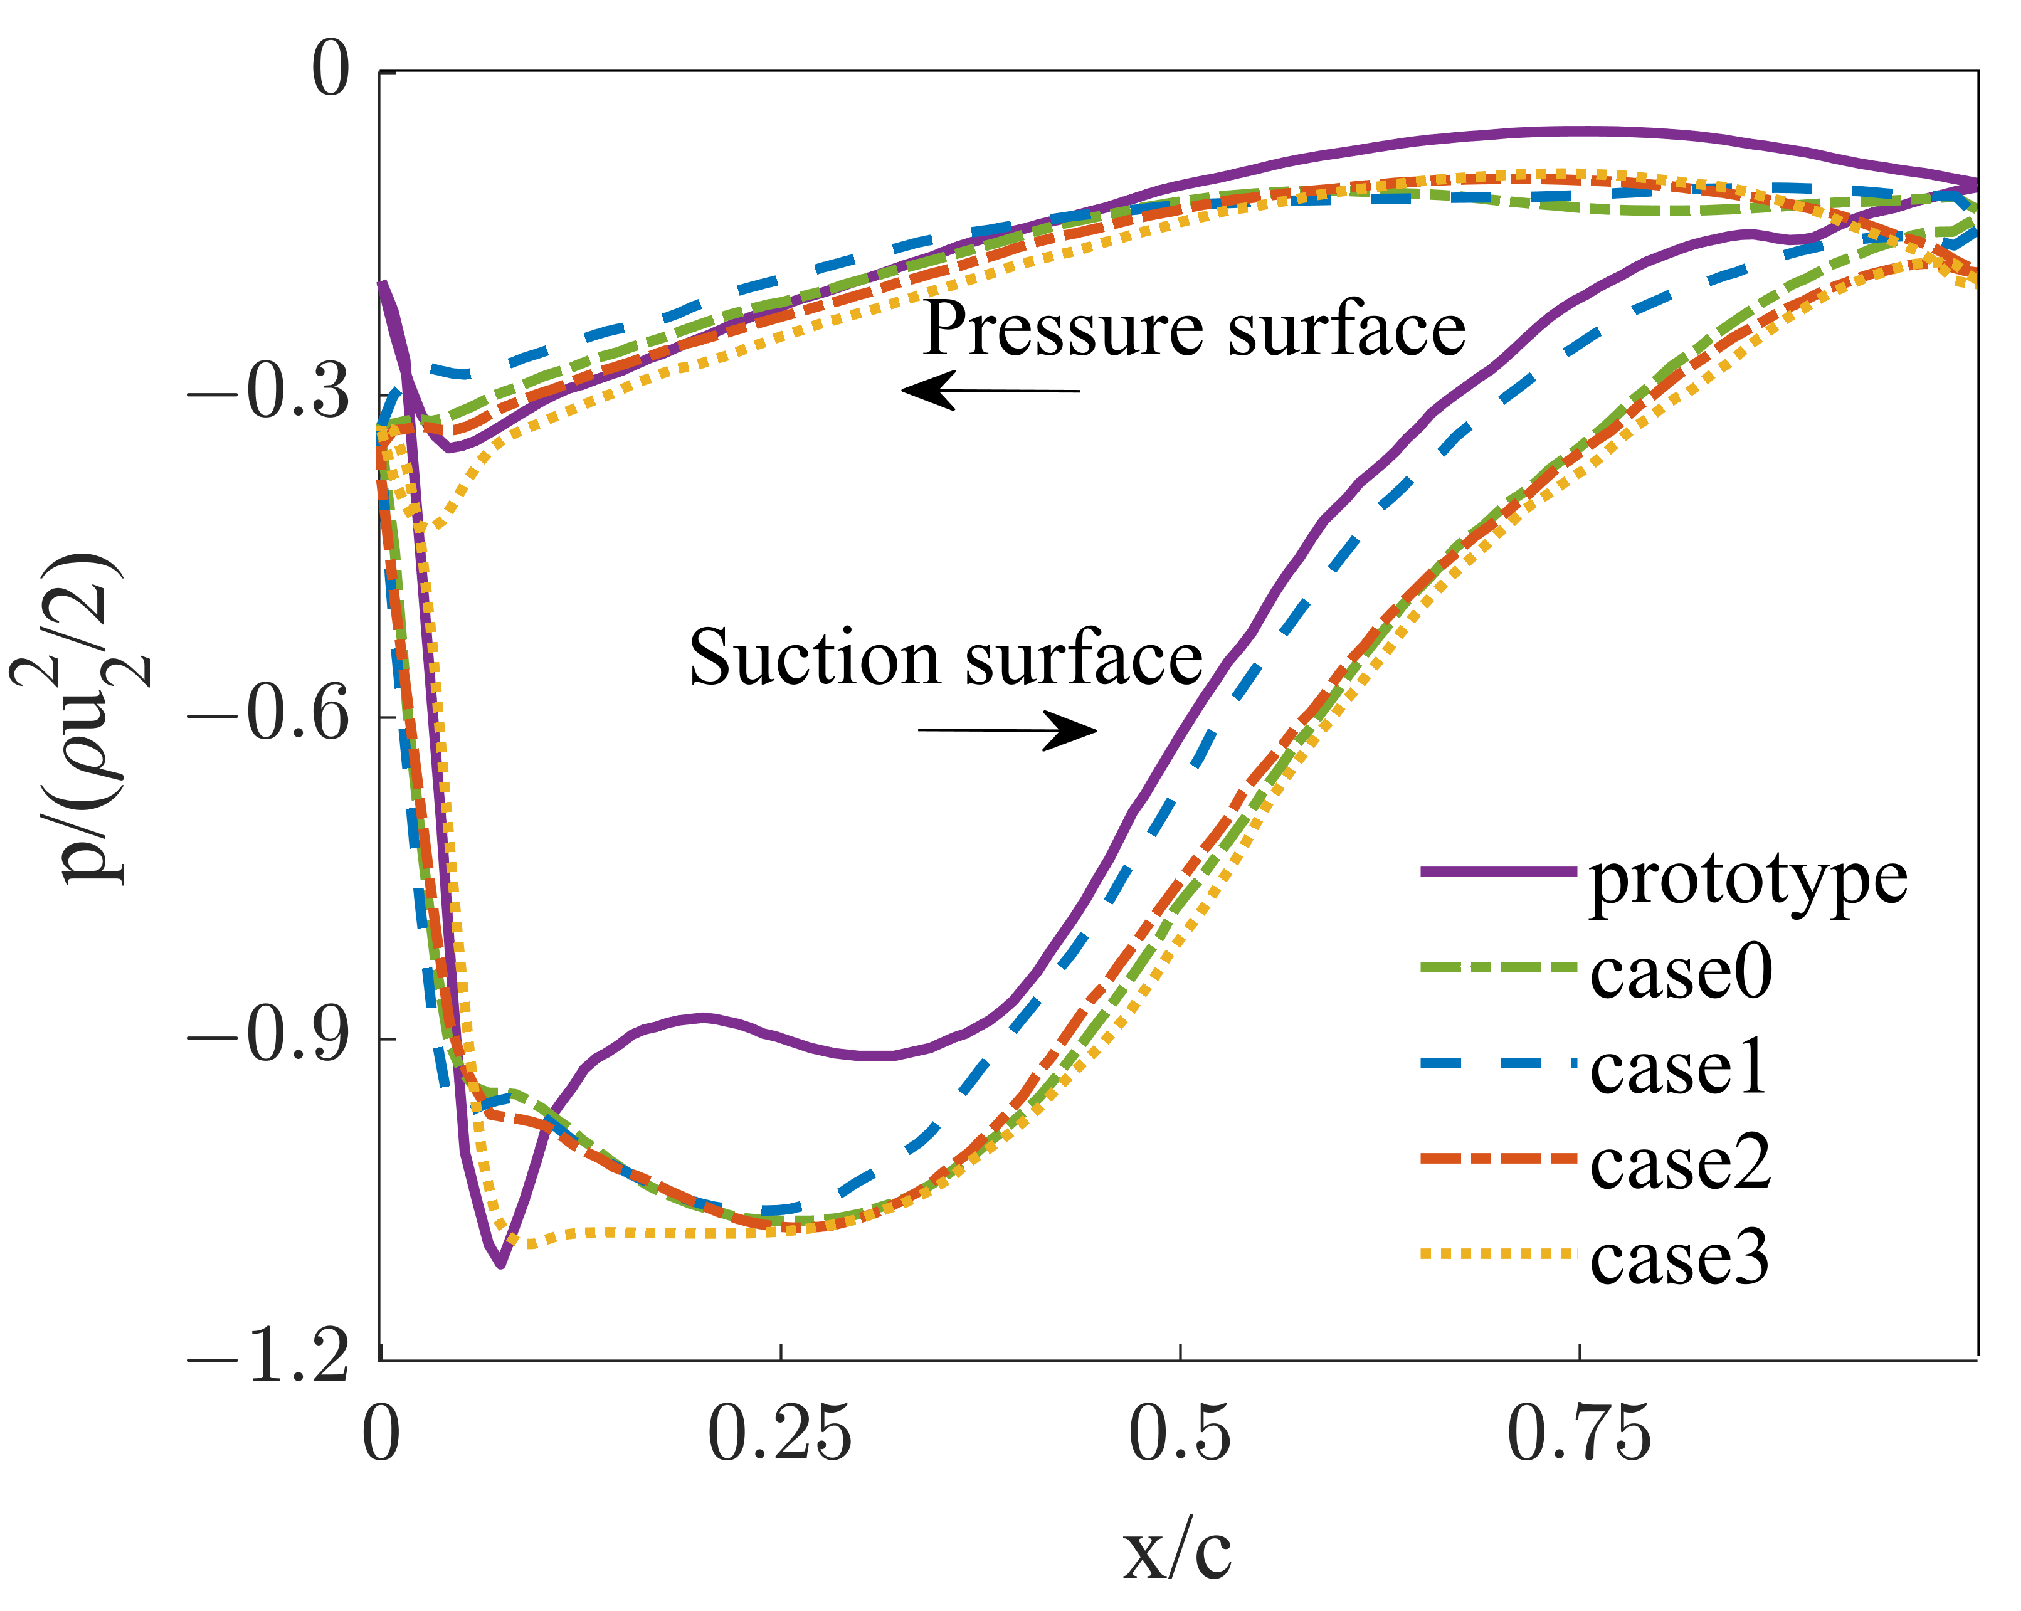
4.3. Flow Field Analysis

There was no significant difference in the pressure distributions in the meridian plane of the prototype fan and the optimized fan, as shown in Figure 9. However, the streamlines located at the impeller outlet near the fan shroud of the prototype fan were unreasonable. The direction of the airflow is mainly characterized by the axial velocity instead of the radial velocity, as illustrated in the red circle. Starting from fan shroud points to the fan hub implies the direction of the axis velocity, resulting in a non-negligible flow shear loss approaching the direction of impeller outlet airflow.
In addition, there is a low-pressure zone at the suction surface near the fan shroud of the prototype fan, which is prone to producing a higher airflow shear loss, as shown in Figure 10a. Meanwhile, the lower-pressure zone was seriously weakened at the same position of the optimized fan, as presented in Figure 10b. This was helpful for the improvement of airflow entering the blade channel from the leading edge of the blade.
The distribution of the dissipation function represents the energy loss inside the fan. Five slices were made in the axial z direction and radial y direction, respectively. The z = 0.10 slice is taken to intersect at the y direction slices, as shown in Figure 11. The energy dissipation of the fan is mainly located at the regions of the blade leading and trailing edge, while the losses in other regions, including the middle part of the blade, are relatively smaller. Compared with the original fan, the energy loss state around the blade leading edge was improved under the condition that the shape of the optimized blade leading edge became flatter, as illustrated by the circle in the axial slices.
In the trailing edge at slices of z = 0.14 m and z = 0.10 m, the phenomenon of rotating stall was found in both prototype and optimized fans, viscosity loss produced in the optimized fan is more obvious. Two vortices were generated at the slices of z = 0.10 m, as well as in radial slices of y = −0.2 m.
Furthermore, the total dissipation function in different regions inside the fan was integrated, and their corresponding torques are illustrated in Figure 12. As can be seen that energy dissipation of the entire fan flow field is mainly generated in the impeller zone, as shown in the middle red block in Figure 10. Followed by this is the energy loss in the outlet zone, which varies with the values in the impeller zone. However, as there is no interference in the inlet zone, the energy loss in this zone is basically equal, as shown in the bottom blue block. Higher efficiency of the optimized fans is prone to producing a smaller total dissipation function and input torque. Whereas the higher static pressure is in favor of generating a larger total dissipation function and input torque, leading to a lower total efficiency compared to the prototype fan.
The results based on the dissipation function are interpreted by the static pressure contours (see Figure 13), which fail to indicate the quantity and the location of the energy loss. It is assumed that the density of pressure contours represents the magnitude of the pressure gradient in the same flow, and a larger pressure gradient refers to a larger velocity gradient in the incompressible flow, resulting in significant viscosity shear loss. Thus, density of contours can be serviced as indicators of the flow loss. The distributions of contours at the leading edge of the optimized impeller were sparser than those of the prototype fan as a result of the reduced viscosity loss in the flow field, as analyzed by dissipation function.
The contours at the trailing edge had a high-pressure center with an obvious pressure gradient, which confirmed the phenomenon of rotating stall. Besides, the center-asymmetric effect of the optimized fan’s flow field was exacerbated. The rest of energy losses observed from dissipation function analysis can also be found in the corresponding position of the pressure contours, such as areas marked in the slices of y = −0.2 m, y = −0.11 m and y = −0.07 m.
Compared to the circumferential velocity at the impeller outlet of the optimized fans with the prototype fan, the maximum and minimum values of the three optimized fan outlet velocities were lower than those of the prototype fan, as shown in Figure 14. As the static pressure of the optimized fans gradually increases, minimum outlet velocity gradually decreases, while the maximum outlet velocity remains to be unchanged.
As the fan efficiency gradual increases, the span of the absolute value of the velocity becomes smaller, and the phenomenon of jet wake at the outlet is weakened. At the same flow rate, more uniform distributions of the axial velocity and smaller flow losses were observed.
As seen from the comparison of the pressure coefficient curve on the blade surface in Figure 15, the pressure coefficient of the optimized blade at the leading edge changes more smoothly and is favorable for the formation of a uniform flow field. Therefore, the total pressure loss caused by pressure fluctuations reduces the dissipation function at the leading edge.

5. Conclusions

Blades are important components in voluteless centrifugal fans and significantly affect the efficiency and static pressure of fans. It is essential to design an appropriate shape for blade profiles to obtain maximum aerodynamic efficiency. A CST method combined with Kriging models and the NSGA-II algorithm were employed to optimize blade profiles in three-dimensional centrifugal fans. The optimization objectives were fan efficiency and outlet static pressure. The results showed that the outlet static pressure and efficiency increased by 9.03% and 2.35% for an optimized fan, compared with those of the prototype fans.
The dissipation function was applied to analyze energy loss in the fans. It can be found that the dissipation function can intuitively indicate the location and amount of energy loss, while obtaining the total energy loss as well. The situation of flow energy losses were well proven by the density of the static pressure contours. The locations of the relatively dense contours imply that a significant viscosity shear loss was produced. Based on the analysis of the dissipation function, the designed fan optimized the flow fields at the leading edge and reduced energy loss. However, the flow fields at the trailing edge failed to be optimized, and further research in this area is required. The dissipation function in combination with the Kriging-based optimization approach assisted by CST methods offers a potential way to discover the structural design issues and energy losses in existing fans and improve fan performance.

Author Contributions

Conceptualization, M.Z. and Z.L.; methodology, M.Z.; software, M.Z. and Z.L.; validation, M.Z., Z.L. and X.Y.; formal analysis, M.Z. and Z.C.; formal analysis, M.Z.; writing—original draft preparation, M.Z. and Z.L.; writing—review and editing, Y.L. and G.L.; funding acquisition, N.L. All authors have read and agreed to the published version of the manuscript.

Funding

This work was supported by Zhejiang Provincial Natural Science Foundation of China (Project No. LQ20E050011).

Data Availability Statement

Not applicable.

Conflicts of Interest

The authors declare no conflict of interest.

References

  1. Ding, Y.; Wang, J.; Jiang, B.; Li, Z.; Xiao, Q.; Wu, L.; Xie, B. Multi-objective optimization for the radial bending and twisting law of axial fan blades. Processes 2022, 10, 753. [Google Scholar] [CrossRef]
  2. Heo, M.W.; Kim, J.H.; Seo, T.W.; Kim, K.Y. Aerodynamic and aeroacoustic optimization for design of a forward-curved blades centrifugal fan. Proc. Inst. Mech. Eng. Part A J. Power Energy 2016, 230, 154–174. [Google Scholar] [CrossRef]
  3. Xiao, Q.; Wang, J.; Jiang, B.; Yang, W.; Yang, X. Multi-objective optimization of squirrel cage fan for range hood based on Kriging model. Proc. Inst. Mech. Eng. Part C J. Mech. Eng. Sci. 2022, 236, 219–232. [Google Scholar] [CrossRef]
  4. Gan, X.; Pei, J.; Wang, W.; Yuan, S.; Lin, B. Application of a modified MOPSO algorithm and multi-layer artificial neural network in centrifugal pump optimization. Eng. Optim. 2023, 55, 580–598. [Google Scholar] [CrossRef]
  5. Kulfan, B.M. Universal parametric geometry representation method. J. Aircr. 2008, 45, 142–158. [Google Scholar] [CrossRef]
  6. Akram, M.T.; Kim, M.H. CFD analysis and shape optimization of airfoils using class shape transformation and genetic algorithm—Part, I. Appl. Sci. 2021, 11, 3791. [Google Scholar] [CrossRef]
  7. Huang, S.; Lu, X.; Han, G.; Zhao, S.; Zhou, C.; Yang, C. Research on aerodynamic optimization design method and flow mechanism of a high-subsonic compressor cascade. Eng. Appl. Comp. Fluid Mech. 2022, 16, 316–334. [Google Scholar] [CrossRef]
  8. Liu, C.; Duan, Y.; Cai, J.; Wang, J. Application of the 3D multi-block CST method to hypersonic aircraft optimization. Aerosp. Sci. Technol. 2016, 50, 295–303. [Google Scholar] [CrossRef]
  9. Zhou, S.; Yang, K.; Zhang, W.; Zhang, K.; Wang, C.; Jin, W. Optimization of multi-blade centrifugal fan blade design for ventilation and air-conditioning system based on disturbance CST function. Appl. Sci. 2021, 11, 7784. [Google Scholar] [CrossRef]
  10. Kim, J.H.; Ovgor, B.; Cha, K.; Kim, J.H.; Lee, S.; Kim, K.Y. Optimization of the aerodynamic and aeroacoustic performance of an axial-flow fan. AIAA J. 2014, 52, 2032–2044. [Google Scholar] [CrossRef]
  11. Kim, S.; Lee, K.Y.; Kim, J.H.; Yoon, J.Y.; Choi, Y.S. Design of mixed-flow pump for Ns475 based on optimum design database. J. Fluid Mech. 2018, 11, 123–128. [Google Scholar] [CrossRef]
  12. Zhang, H.; Wang, Z.; Yang, H.; Zhu, Z.; Wei, Y. Blade shape optimization and internal-flow characteristics of the backward non-volute centrifugal fan. Proc. Inst. Mech. Eng. Part A J. Power Energy 2022, 236, 673–688. [Google Scholar] [CrossRef]
  13. Zhou, S.; Zhou, H.; Yang, K.; Dong, H.; Gao, Z. Research on blade design method of multi-blade centrifugal fan for building efficient ventilation based on Hicks-Henne function. Sustain. Energy Technol. Assess. 2021, 43, 100971. [Google Scholar] [CrossRef]
  14. Forrester, A.; Sobester, A.; Keane, A. Engineering Design via Surrogate Modelling: A Practical Guide; John Wiley & Sons, Ltd.: New York, NY, USA, 2008; pp. 155–165. [Google Scholar]
  15. Li, Z.; Zheng, X. Review of design optimization methods for turbomachinery aerodynamics. Prog. Aeosp. Sci. 2017, 93, 1–23. [Google Scholar] [CrossRef]
  16. Zhou, L.; Hang, J.; Bai, L.; Krzemianowski, Z.; Yasser, E.; El-Emam, M.A.; Agarwal, R. Application of entropy production theory for energy losses and other investigation in pumps and turbines: A review. Appl. Energy 2022, 318, 119211. [Google Scholar] [CrossRef]
  17. Liang, Z.; Xiang, L.; Wei, X.; Chen, S.; Liu, J.; Hao, Z. Numerical study on the flow characteristics of centrifugal compressor impeller with crack damage. Adv. Mech. Eng. 2021, 13, 16878140211034622. [Google Scholar] [CrossRef]
  18. Zamiri, A.; Choi, M.; Chung, T. Effect of blade squealer tips on aerodynamic performance and stall margin in a transonic centrifugal compressor with vaned diffuser. Aerosp. Sci. Technol. 2022, 123, 107504. [Google Scholar] [CrossRef]
  19. Wang, Z.; Xie, B.; Xia, X.; Yang, H.; Zuo, Q.; Liu, Z. Energy loss of radial inflow turbine for organic Rankine cycle using mixture based on entropy production method. Energy 2022, 245, 123312. [Google Scholar] [CrossRef]
  20. Wang, C.; Zhang, Y.; Yuan, Z.; Yuan, Z.; Ji, K. Development and application of the entropy production diagnostic model to the cavitation flow of a pump-turbine in pump mode. Renew. Energy 2020, 154, 774–785. [Google Scholar] [CrossRef]
  21. Deb, K.; Pratap, A.; Agarwal, S.; Meyarivan, T. A fast and elitist multiobjective genetic algorithm: NSGA-II. IEEE Trans. Evol. Comput. 2002, 6, 182–197. [Google Scholar] [CrossRef] [Green Version]
  22. Blazek, J. Computational Fluid Dynamics: Principles and Applications, 3rd ed.; Elsevier: Oxford, UK, 2015; pp. 225–265. [Google Scholar]
  23. Li, Z.; Dou, H.; Lin, P.; Wei, Y.; Chen, Y.; Lin, L.; Ye, X. Design for a squirrel cage fan with double arc blade. J. Appl. Fluid. Mech. 2020, 13, 881–891. [Google Scholar] [CrossRef]
  24. Li, Z.; Ye, X.; Wei, Y. Investigation on vortex characteristics of a multi-blade centrifugal fan near volute outlet region. Processes 2020, 8, 1240. [Google Scholar] [CrossRef]
Figure 1. Prototype blade profile and CST method blade profile.
Processes 11 01751 g001
Figure 2. Optimization schemes of centrifugal fans.
Processes 11 01751 g002
Figure 3. Structure and computational domain of the centrifugal fan.
Processes 11 01751 g003
Figure 4. Grid-independence verification.
Processes 11 01751 g004
Figure 5. Polyhedral grid of fans.
Processes 11 01751 g005
Figure 6. Experimental system. (a) Outlet of fans. (b) Schematic diagram of the testing system.
Processes 11 01751 g006
Figure 7. Pareto front and optimized fans.
Processes 11 01751 g007
Figure 8. Profiles of the prototype blade and three optimized blades.
Processes 11 01751 g008
Figure 9. Pressure contours and streamlines on the meridian plane. (a) Prototype fan. (b) Optimized fan.
Processes 11 01751 g009
Figure 10. Pressure contours of the blades. (a) Prototype fan. (b) Optimized fan.
Processes 11 01751 g010
Figure 11. Dissipation function on the slices of impeller.
Processes 11 01751 g011
Figure 12. Total values of the dissipation function.
Processes 11 01751 g012
Figure 13. Static pressure contours on the slices of impeller.
Processes 11 01751 g013
Figure 14. Circumferential velocity distribution at impeller outlet (z = 0.077 m).
Processes 11 01751 g014
Figure 15. Pressure coefficient curve of the blades.
Processes 11 01751 g015
Table 1. Main geometric parameters of the prototype impeller.
ParametersValue
Impeller inside diameter (mm)266
Impeller outside diameter (mm)460
Blade inlet angle (deg.)8
Blade outlet angle (deg.)28
Number of blades6
Impeller width (mm)160
Table 2. Differences between numerical data (N) and experimental results (E).
Volumetric Flow Rate/m3 s−1Pressure Coefficient (N)Pressure Coefficient (E)Efficiency (N)Efficiency (E)Errors
1.310.730.6360.1460.861.20%
1.630.630.5862.564.643.42%
1.880.530.5362.264.363.47%
2.20.380.4458.1660.764.47%
Table 3. Comparison between Kriging data (K) and numerical data (N).
CasePressure/Pa
(K)
Pressure/Pa
(N)
Pressure ErrorsEfficiency
(K)
Efficiency
(N)
Efficiency
Errors
prototype-1052--73.63-
case 01132.591147−1.26%75.8377.52−2.18%
case 11098.921101−0.19%76.0275.910.15%
case 21150.801156−0.45%75.8875.570.42%
case 31174.5211730.15%75.1875.020.23%
Disclaimer/Publisher’s Note: The statements, opinions and data contained in all publications are solely those of the individual author(s) and contributor(s) and not of MDPI and/or the editor(s). MDPI and/or the editor(s) disclaim responsibility for any injury to people or property resulting from any ideas, methods, instructions or products referred to in the content.

