Article

The Suppression of Hump Instability inside a Pump Turbine in Pump Mode Using Water Injection Control

1
School of Energy and Power Engineering, University of Shanghai for Science and Technology, Shanghai 200093, China
2
School of Aeronautics and Astronautics, Shanghai Jiao Tong University, Shanghai 200240, China
3
Key Laboratory (Fluid Machinery and Engineering Research Base) of Sichuan Province, Xihua University, Chengdu 610039, China
*
Author to whom correspondence should be addressed.
Processes 2023, 11(6), 1647; https://doi.org/10.3390/pr11061647
Submission received: 4 May 2023 / Revised: 21 May 2023 / Accepted: 24 May 2023 / Published: 28 May 2023
(This article belongs to the Special Issue Design and Optimization Method of Pumps)

Abstract

:
The occurrence of hump instability in pump mode within a pump turbine poses a significant challenge to the safe and stable operation of Pumped Storage Power Plants (PSPP). To achieve more precise numerical simulations, this paper establishes a weakly compressible model of water based on the Tait equation. Using this model, it is discovered that the onset of hump instability is closely linked to an increase in hydraulic losses induced by stalled rotation within the diffuser. Then, a flow control approach employing water injection into the guide vanes of a pump turbine is proposed in order to suppress flow instabilities and optimize the hump region. The findings reveal that the water injection approach can mitigate hydraulic losses, suppress unstable structures, and diminish the pulsation amplitude within the diffuser, ultimately delaying the emergence of the hump region to lower flow mass conditions. This study is helpful in widening the range of the safe and stable operation of pump turbines in pump mode.

1. Introduction

Pumped storage energy is widely considered to be one of the most mature, economical, and large-scale, green, low-carbon, flexible adjustment technologies in power systems [1]. In addition, pump-as-turbine (PAT) technology holds significant promise for the advancement of small-scale hydroelectric power systems, particularly in regions lacking access to large-scale power plants [2].
Therefore, Pumped Storage Power Plants (PSPP) are expected to play an important role in the transition towards low-carbon energy and the realization of the “carbon peak” and “carbon neutrality” [3].
In traditional studies of pump turbines, the flow compressibility of water is generally neglected, i.e., the water is assumed to have incompressible flow, because the specific speed is slow, and the head of the pump is small. Nowadays, the reversible pump turbine, which is a key component of energy conversion in PSPP, is undergoing development towards having a large head, high specific speed, and high capacity [4], where the internal fluid velocity and pressure are aggravated, and the effect of the compressibility of water on the operation stability of pump turbine cannot be ignored.
Several researchers have explored the water compressibility of hydraulic machinery via experimental and simulation comparative studies. In numerical simulations, using an incompressible model can capture unstable flow phenomena, but there is a significant discrepancy between the calculated and actual results [5,6,7].
Zhang et al. [7] reported notable enhancements in the accuracy of head and efficiency predictions for pump turbine following the incorporation of a weakly compressible model of water in numerical simulations. They emphasized the significance of accounting for weak compressibility in improving the precision of numerical simulations for hydraulic machinery from the perspective of flow field characteristics, hydraulic loss, and entropy generation.
Trivedi et al. [5] performed a comparative investigation involving incompressible and compressible numerical simulations to analyze the pressure pulsations induced by rotor–stator interactions in the vaneless space of a large-headed hydraulic turbine. The findings from the compressible flow simulation revealed that the average pressure pulsation and amplitude exhibited an increment of 0.5–3% in comparison to those of the incompressible flow case, thus approaching values that closely aligned with the experimental observations.
Wang et al. [8] conducted a comprehensive comparative examination, employing large eddy simulation (LES) to assess the calculation outcomes of pressure pulsations within the dynamic and static interference region of a centrifugal pump for both compressible and incompressible flow conditions. The obtained results demonstrated that the inclusion of compressibility yielded performance curves, pulse amplitudes, and trends of the monitoring points that were similar to the experimental values, particularly when lower flow rates were used.
Yang et al. [9] employed the Tait equation to establish a weakly compressible model, thereby investigating the influence of water compressibility on pressure and velocity fields within a centrifugal pump. The findings revealed that under non-design conditions, the compressibility of water exhibited a more pronounced impact on pulsations within the flow field.
The abovementioned literature review demonstrates that for hydraulic machinery, considering fluid compressibility is essential to obtain more accurate numerical simulation results and capture additional flow details.
Therefore, there is a pressing need for high-precision numerical simulations that account for the compressibility of the working medium in the internal flow field of pump turbines, which is in contrast to conventional numerical simulations of hydraulic machinery, which employ incompressible computational models.
When they are operating under a partial load in pump mode, pump turbines are prone to flow unstable structures, such as stalled rotation, secondary flow, and rotor–stator interaction [10], which can induce hump instability, cause severe pressure pulsation, unit vibration, and compromise the safe and stable operation of the PSPP.
The occurrence and development of hump regions has also been intensively studied by various scholars at home and abroad, including experiments and numerical simulations [11,12,13], and some scholars are committed to improving this unstable phenomenon.
Recently, the concept of optimized design based on computational fluid dynamics (CFD) has been gradually applied to the design of pump turbines. The instability of the pump turbine is somewhat ameliorated by adjusting the geometrical factors to modify the external profile of the runner or guide vanes.
P Xue et al. [14], based on CFD analyses and model test results, created an optimized geometric dimension design of a runner with fewer blades and a large blade wrap angle, θ. They found that the performances, such as efficiency, hump safety margin, cavitation, and stability, were improved compared to those of the original runner.
Li et al. [15] proposed two optimization strategies for the high-pressure edge shape of runner blades. One strategy was to increase the exit angle near the shroud, and the other one was to increase the radius near the shroud. It was found that optimization of the runner–outlet geometry can effectively reduce pressure fluctuations in the hump region.
Yang et al. [16] designed a pump turbine by using a genetic algorithm to select the optimal solution from the previously generated optimal target domain and compared the optimized runners after multi-objective inverse design, which significantly increased the hump safety margin of the pump mode.
The optimization scheme described above belongs to the category of passive control techniques. Passive techniques encompass methods such as geometric shaping to manipulate the pressure gradient, the utilization of fixed mechanical vortex generators for separation control, and the implementation of longitudinal grooves or riblets on a surface to reduce drag [17]. These techniques bring about flow modifications, without requiring an external energy input. Passive control methods have the capacity to mitigate draft tube surges across a wide range of operating regimes, exhibiting advantages, such as the absence of additional volumetric losses and self-regulation. However, they are associated with the drawback of inducing additional local hydraulic losses, rendering them effective only within limited operating regimes [18,19]. Correspondingly, active flow control methods typically involve the injection of either air or water and rely on an external energy source. These methods have the capability to reduce draft tube surge across a wide range of operating regimes. However, it is important to note that they also result in additional volumetric losses [17,20,21]. Kougias et al. [22] performed in-depth analysis of the advantages and disadvantages of active and passive control methods.
Although passive control techniques can lead to notable enhancements in the turbine performance of far-off-design regimes, their components cannot be removed once their presence is no longer required. This leads to unnecessary hydraulic losses and unanticipated pressure fluctuations under different operating regimes [22]. In contrast, active control techniques (including water injection and air admission) are typically applied only when they are required and do not interfere with the flow regime otherwise [23].
The water injection optimization method has attracted the attention of numerous scholars due to its capability to directly stimulate the low-momentum fluid region to a certain extent, thereby reducing the probability of flow separation and inhibiting the development of various unstable flows during the operation of pump turbines.
Sabri Deniz et al. [24,25,26] performed experimental and numerical investigations to examine the impact of various injection parameters, such as size, number, distribution, angle, and the direction of nozzles via implementing flow control techniques with water injection in the vaneless space and guide vanes near the leading edge. They demonstrated that pump turbine flow instabilities in the turbine mode in the S-shaped region can be suppressed by improving the performance curve as the fluid is injected in the vaneless space. Furthermore, flow injection through the guide vanes not only hindered the buildup of vortices in the guide vane channels, but also improved the flow in the runner channels.
Subodh Khullar et al. [27] numerically analyzed water jet injection in the draft tube of a Francis turbine under three different partial load conditions. The effect of water injection on the velocity and pressure fields in the draft tube was investigated. It has been shown that optimal water injection increased the axial momentum and alleviated the backflow regime, leading to a decrease in the number of vortices in the draft cone. However, the amount of water jet should be cautiously controlled, as higher water jet injection may deteriorate the performance by impacting the bend.
Moona Mohammadi et al. [28] investigated the effect of water, air, and their combined injection from two different injection points to reduce the vorticity effects in a draft tube of prototype turbine working at three operating points. They found that air injection is considerably more effective than water injection or a combination of air and water injection is in most operating ranges. However, in the operating range below 70% of the turbine design flow rate, either water or air injection was not suitable, but a combination of both fluids can improve the system’s performance.
Lewis [29] demonstrated the method of adding water jets to the trailing edge of the guide vanes for improving the Francis hydroturbine performance during off-design operation by adjusting the runner inlet swirl angle. When it is properly tuned, altering the flow angle results in a significant improvement in turbine efficiency during off-design operation.
The pressure pulsations induced using vortex ropes in the draft tube of the Francis turbine due to off-design operating conditions can be mitigated by using active water jet injection control [23,30,31].
The literature review indicates that water injection can be employed as an effective method to alleviate and control flow instability and pressure pulsation, and the appearance of a hump region is closely related to these factors.
However, there has been a limited number of investigations into the suppression or delay of the emergence of the hump region from a fluid injection perspective. A previous study [32] highlighted that the emergence of the hump region is closely linked to the high energy loss induced via stalled rotation in the diffuser. To address this, the present paper proposes an active water injection control method aimed at improving the unsteady flow structure in the diffuser and optimizing hump instability, with the goal of offering insights that could potentially extend the safe and stable operation range of pump turbines.
The paper is structured as follows: Firstly, Section 1 furnishes an overview of the existing research status pertaining to compressibility, hump instability, and water injection optimization in pump turbines. Then, in Section 2, numerical simulations with and without considering the compressibility of water are conducted to simulate the effect of hump instability on the performance curve in pump turbine in pump mode. Subsequently, in Section 3, to address the hump instability phenomenon observed on the performance curve, an optimization control method for injection in the guide vanes is proposed, which entails the determination of the injection position, quantity, and velocity. Furthermore, the underlying mechanism responsible for the delayed formation of the hump region is elucidated from the perspectives of flow field characteristics, hydraulic losses, and frequency domain analysis. Lastly, conclusions and the future research directions are summarized in Section 4.

2. Numerical Simulation and Validation

2.1. Pump Turbine Model

The numerical model studied in this paper is presented in Figure 1. The numerical simulation of computational domain consists of five parts: the draft tube, impeller, guide vanes, stay vanes, and spiral casing.
In pump mode, the pump turbine operates as follows: The impeller is set into motion via counterclockwise rotation driven by an external power source. The draft tube allows the smooth entry of water into the pump turbine and flows into the impeller; the rotation of the impeller imparts centrifugal force, accelerating the water’s movement. Then, it is guided by guide vanes and stay vanes arranged in a double-row cascade configuration. These guide vanes direct the water smoothly towards the spiral casing. The spiral casing converts the fluid’s kinetic energy into static pressure energy, pumping the water back to the upstream reservoir [33].
The specific parameters of the pump turbine in pump mode are listed in Table 1.

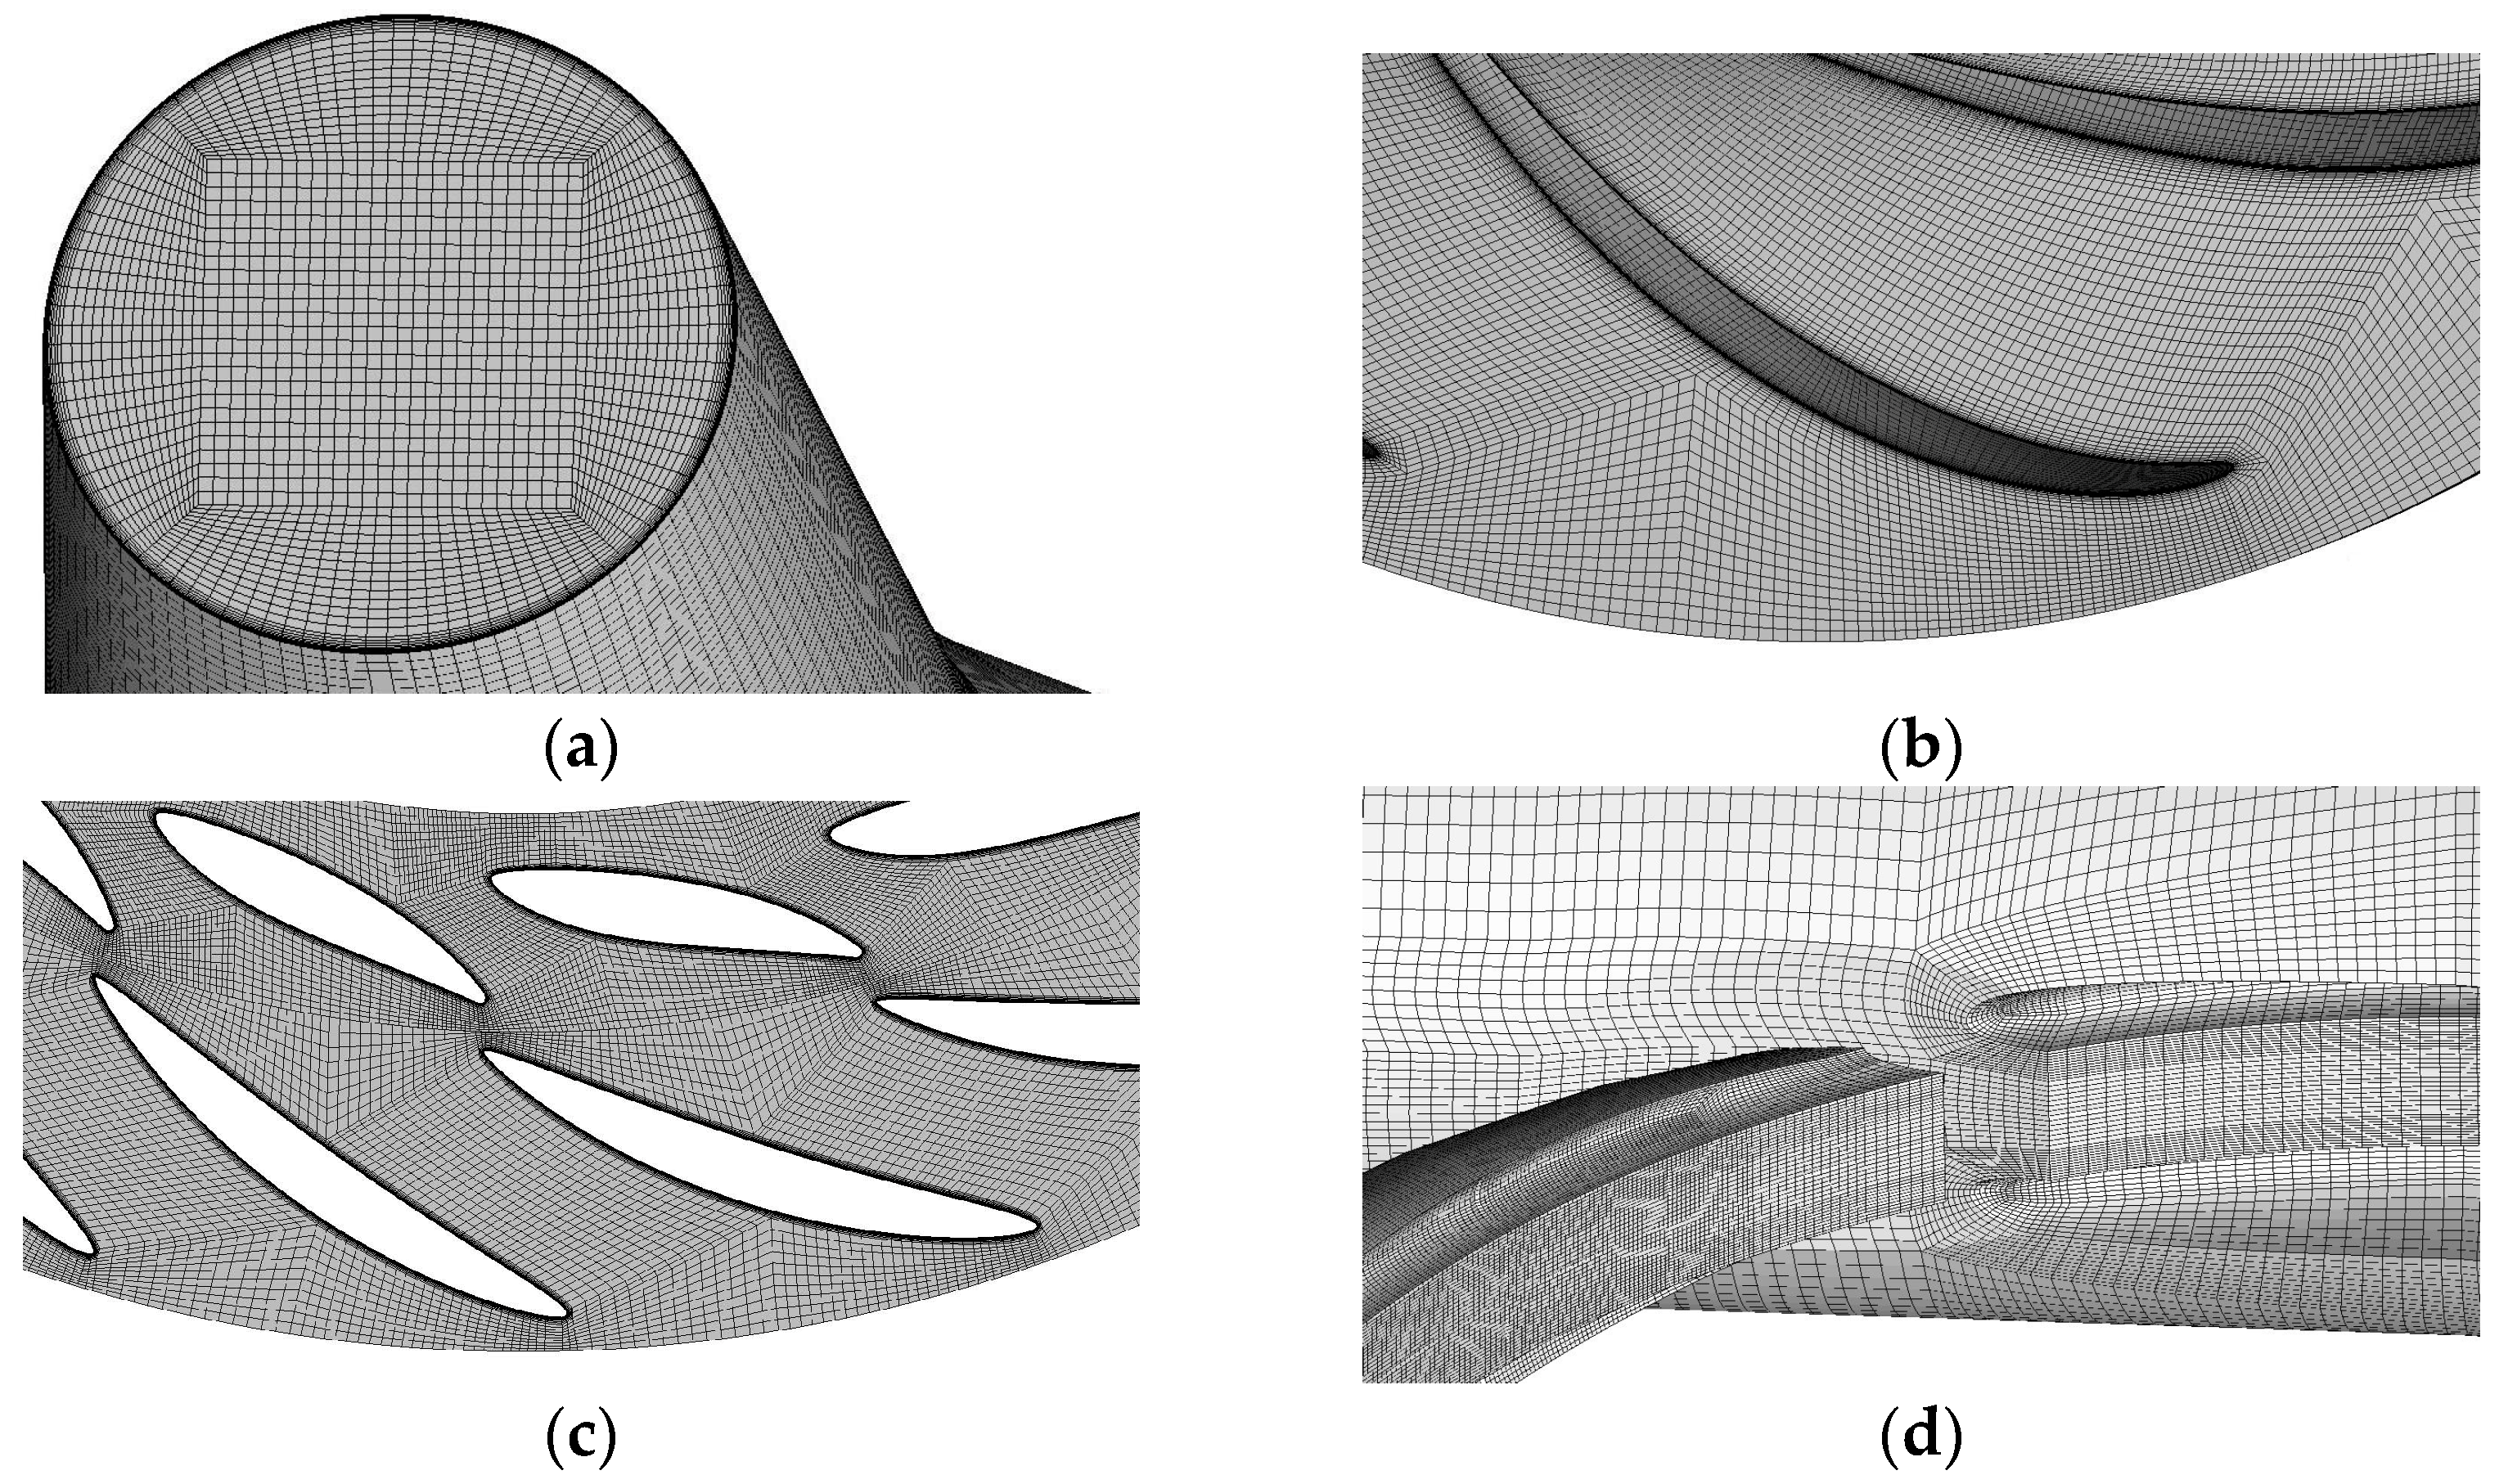
2.2. Validation of Grid Independency

Three sets of structured grids were generated via ANSYS ICEM to verify that the grid densities can reasonably predict the external characteristics of pump turbine within a certain error range. The head coefficient defined by Equation (1) under designed conditions was selected for verification, and its relative error was obtained according to Equation (2).
φ = H / ( u 2 2 / 2 g )
where u2 denotes the circumferential velocity of the impeller outlet, H represents the head, and g is the gravitational acceleration.
γ = ( φ exp φ s i m ) / φ exp × 100 %
where γ is the relative error, φexp is the experimental head coefficient, and φsim is the numerical simulation head coefficient.
Grid information and independence verification analysis data are listed in Table 2. It is found that as the number of grids increases to 12.96 million, the head coefficient exhibits greater proximity to experimental results, with an error of approximately 4%, in comparison to 6.19 million and 8.92 million grids. Considering the improved accuracy and richer flow field information, a grid size of 12.96 million was ultimately selected for the numerical simulations. Figure 2 depicts the local details of this grid set, including the division of the wall boundary layer. The maximum y+ value on the impeller surface is less than 40, while that of the guide vanes and stay vanes surface is less than 10. Previous investigations on pump turbines have shown that the current y+ value is acceptable under the wall function [34,35].

2.3. Numerical Settings and Boundary Conditions

Commercial software, ANSYS CFX, was employed to perform the numerical simulation. The Shear Stress Transport (SST) k-w turbulence model combines the benefits of both the k-ε and k-ω models, making it well suited to a wide range of flow conditions, and it has been extensively validated and proven to perform well across the wide range of operating conditions in pump turbines [36,37,38]. Therefore, the SST k-w turbulence model was used for steady simulation, and Detached Eddy Simulation (DES) was used in the unsteady simulation. The interface between the rotating domain and stationary domain was called the Frozen Rotor in the steady calculation, and the Transient Rotor was used for the unsteady calculation. To expedite the convergence speed of unsteady simulation, the steady result was utilized as the calculation initial value. The time step was set as 0.00025 s (equivalent to the impeller rotates 1.5 degrees), with a total unsteady simulation time of 0.6 s, corresponding to the duration required for the impeller to complete ten revolutions.
The mass flow rate at the inlet of the draft tube was determined according to the experimental conditions in pump mode. Notably, when we were conducting the water injection study, four symmetrically distributed water injection holes of the guide vanes were set as the second inlet boundary conditions, with the water injection flow velocity being specified. The average static pressure at the outlet of the spiral casing is provided, and the relative pressure was set as 0 Pa. No-slip boundary conditions were prescribed on a solid wall. The convergence criteria, Root Mean Square (RMS) was set as 10−5. A high-resolution scheme was applied to the convective term, and the second-order backward Euler scheme was used for the transient terms.

2.4. Establishment of a Weakly Compressible Model for Water

The weakly compressible model applied in this paper is based on the Tait equation of water. Given the negligible fluctuations in the operating temperature of the pump turbine, it is considered to be a constant parameter. Under isothermal conditions, the nonlinear relationship between pressure and density was established, and the density was transformed from a function of pressure and temperature to a function of pressure only [9]. The specific expression is shown in Equation (3).
ρ = ρ 0 × ( 1 + n ( p p 0 ) k 0 ) 1 n
where p0 is the reference pressure (absolute pressure) at 25 °C; ρ0 is the reference density of water at reference pressure; k0 is the volume modulus at reference pressure, and the value is 2.2 × 10⁹ Pa; n is the density index, and the value is 7.15; p is the pressure of water (absolute pressure); ρ is the density of water under pressure, p.
To incorporate the density variation of water during the operation process into the numerical simulation, Equation (3) was employed, which accounts for the weak compressibility of water.

2.5. Feasibility Verification of the Numerical Simulation

Figure 3 presents the comparison of the head coefficient between the compressible and incompressible numerical calculations and the experimental results, and the corresponding relative errors are also summarized in Table 3. The results depicted in Figure 3 show that the hump region occurs between 0.68QDes and 0.80QDes, where the head coefficient does not continue to increase as the flow decreases. Both incompressible and compressible models demonstrate favorable agreement with the performance curve, but compared with incompressible one, the head coefficient of compressible calculation results is found to be more similar to the experimental value, with a smaller error of less than 2.5%. Therefore, the compressible numerical simulation was deemed to be reliable for further study.

3. Water Injection Optimization Scheme and Result Analysis

3.1. Determination of Water Injection Position and Number

Figure 4 illustrates the hydraulic loss and proportion of each component of the compressible numerical simulation. When the initial working condition (0.80QDes) in the hump region was approached, a sharp increase in loss was observed in the diffuser, and the loss ratio was also the largest, reaching 44.62%. This finding is significant as it contributes to the emergence of the positive slope on the performance curve and is, therefore, a crucial consideration for water injection in diffusers.
Figure 5 depicts the streamline distribution in the diffuser with different spanwise directions at 0.80QDes. It was found that the unsteady flow phenomenon is mainly concentrated near the out of the shroud of the guide vanes. The animation streamlines at various times indicate the presence of four stall cells in the diffuser. Therefore, in this paper, four symmetrically distributed 2 mm holes were arranged in the flow separation area of the shroud, and water with a certain flow rate was injected to block the development of the stall cells, as shown in Figure 6.

3.2. Water Injection Results on the Performance Curve in Pump Mode

Regarding the choice of injection velocity, the streamline distribution presented in Figure 5 reveals that the peak flow velocity within the diffuser reaches approximately 20 m/s. Therefore, a preliminary decision was made to set the injection velocity at 20 m/s.
Figure 7 illustrates the comparison of performance curves without and with water injections, and the relative error of head coefficient is presented in Table 4. The outcomes demonstrate that water injection can successfully delay the formation of the hump region under a reduced flow condition at a water velocity of 20 m/s. Despite us observing a slight decrease in the head values under certain working conditions, it is noteworthy that this approach can expand the operating range of the pump turbine. Furthermore, the relative error of the head coefficient before and after the water injection is approximately 5%, and the utilization of water injection can effectively optimize the hump instability; so, it can be considered as a feasible approach.

3.3. Analysis of Hydraulic Loss in the Hump Region without and with Water Injection

Drawing upon the analysis conducted in Section 3.1 and Section 3.2, it is inferred that the onset of the hump region is primarily attributed to the hydraulic loss of the diffuser, and the application of water injection can postpone the occurrence of this phenomenon. Therefore, it can be hypothesized that the delay of the emergence of the hump region is linked to the reduction of hydraulic losses in the diffuser after water injection, as substantiated in the subsequent analysis. A comparison of hydraulic losses in different parts in the hump region without and with water injection is shown in Figure 8.
For 0.75QDes, water injection results in the diminution of hydraulic loss in the diffuser, as evidenced by a decline in loss ratio from 64.36% to 32.99%. Nevertheless, the losses incurred by the upstream (i.e., impeller and draft tube) and downstream (i.e., spiral casing) components increase, thereby augmenting the total loss by roughly 49.34% and leading to a 0.4% decrease in the size of the head.
With regards to 0.68QDes, water injection engenders a decline in loss for all components, except the impeller. Notably, the diffuser’s loss decreases the most, with its loss ratio decreasing from 34.87% to 26.24%, and the overall loss decreases by about 12.33%. As a result, the size of the head increases by approximately 3.23% as compared to that of the scenario without water injection.
Consequently, it can be concluded that water injection is capable of mitigating flow loss in diffusers. It is precisely this change that prevents the head from falling at the hump valley point (i.e., 0.68QDes), thus delaying the formation of the hump region and expanding the stable range of unit operation.

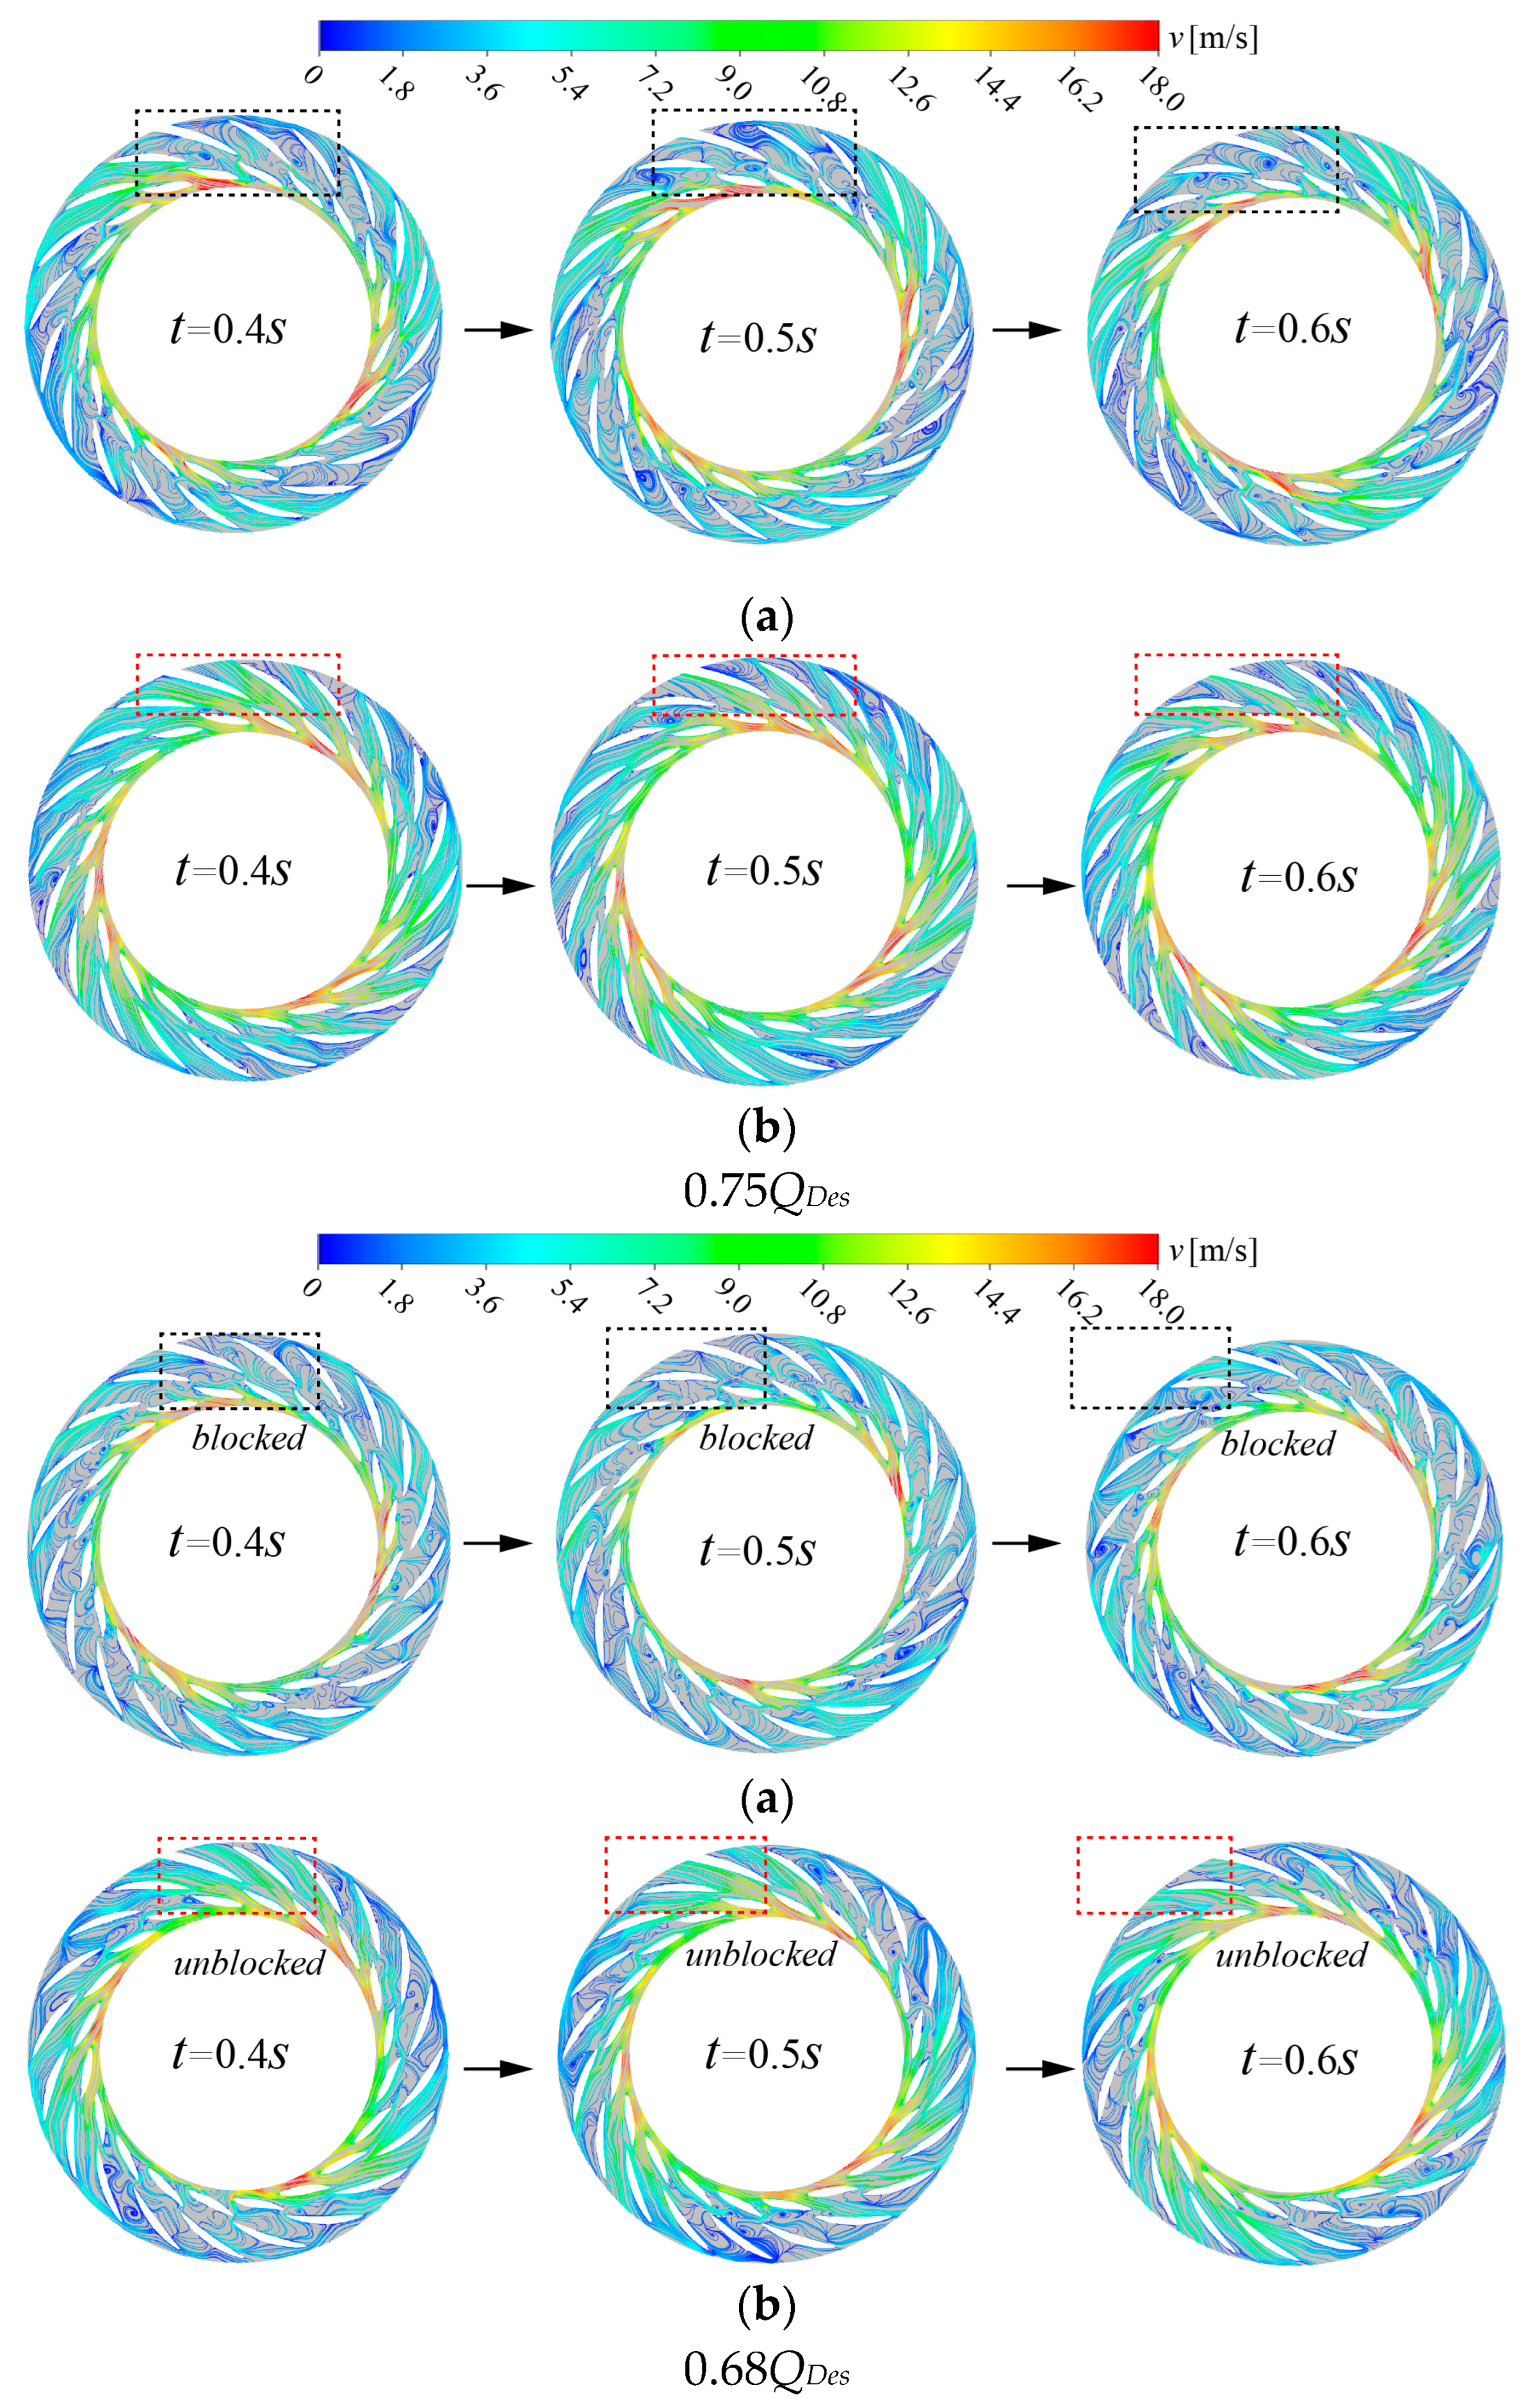
3.4. Analysis of the Streamline Distribution in the Diffuser without and with Water Injection

Given that water injection leads to a reduction in hydraulic loss in the diffuser, it is imperative to acquire a comprehensive understanding of the flow characteristics within it. In this study, a particular emphasis is placed on the flow field in the guide vanes near the shroud where water is injected. The velocity streamline distribution at different times near the shroud (90% Span) without and without water injection is plotted in Figure 9.
For operating point 0.75QDes, in the absence of water injection, three discernible stall cells blocking the diffuser passages are observable, with the flow separation region primarily concentrated at the guide vanes outlet and within the stay vanes channel. After water injection, though three stall cells can still be observed, not only does the range of the three stall cells become smaller, but also, the streamlines at the exit of the guide vanes become relatively stable. This outcome can be attributed to the mitigated risk of flow separation resulting from the water injection stimulus applied to the guide vanes, and the occurrence and development of various unstable flows in the diffuser are suppressed.
For operating point 0.68QDes, the flow field becomes increasingly complex, with a considerable area of vortices, and the flow separation region expanding across almost the entire flow channel. Similarly, thanks to excitation due to the water injection, the growth of the vortex is controlled, and the nearly completely blocked flow passage turns into three distinct stall cells and three corresponding regions with better flow condition, thus reducing energy loss in the diffuser.

3.5. Analysis of the Frequency in the Guide Vanes without and with Water Injection

The foregoing analysis suggests that water injection into the guide vanes not only delays the formation of the hump region, but it also improves the unstable flow in the diffuser. Numerous studies have demonstrated that unstable flows in the hump region are associated with high-amplitude low-frequency fluctuations. In this part, the velocity pulsation spectrum values of the monitoring points in the guide vanes without and with water injection are obtained via quantitative analysis of Fast Fourier Transform (FFT) data to confirm that the unstable low-frequency pulsation observed in the hump region is indeed mitigated due to water injection.
The velocity coefficient, C v , calculated using Equation (4) is used for dimensionless processing of transient velocity fluctuations.
C v = v v ¯ v ¯
where v represents the instantaneous velocity value of the monitoring point, and v ¯ is the average velocity of for a while.
The spectrum is plotted as a function of a dimensionless frequency, Strouhal number (St) [39], which is defined as Equation (5).
S t = π D 2 Z f u 2 = f f B P F
where D2 is the outlet diameter of the impeller, Z is the number of impeller blades, u2 is the circumferential velocity of the impeller outlet, f is the frequency, and fBPF is the blade passing frequency.
Figure 10 portrays the results of the velocity spectrum in guide vanes of the monitoring points, GV1. In the case without water injection at 0.75QDes, a dominant frequency peak at St0.0222 can be observed. Apparently, the high-amplitude low-frequency pulsation intensity obtained at GV1 is significantly suppressed due to water injection, with an amplitude reduction of about 86%. At the operating point 0.68QDes, the dominant peak is still St0.0222; although, the water injection effect on the velocity fluctuations at GV1 is slightly less pronounced than it is in the case of 0.75QDes, but the amplitude is still reduced by about 20%.

4. Conclusions

Based on the Tait equation, in this paper, a weakly compressible model of water was used for numerical simulations in order to obtain more accurate results. On this basis, in view of the hump phenomenon observed on the performance curve in pump mode, the method of injecting water into the guide vanes to suppress the development of unstable flow is put forward, aiming to delay the formation of hump instability. Several conclusions are obtained as follows:
  • In this study, it was found that hydraulic loss in the diffuser is a significant contributing factor to the hump region, with instability perturbations primarily occurring at the outlet of the guide vanes near the shroud. Injecting water into this area at a specific flow rate is shown to successfully delay the formation of the hump region, thereby confirming the effectiveness of the water injection control method for suppressing unsteady flow in the pump turbine.
  • For the wave peak point of 0.75QDes in the hump region, water injection not only reduces the area of vortices formed by flow separation, but it also slows down the pulsation amplitude responsible for the unsteady flow structure. However, water injection concurrently increases the hydraulic losses of other flow components besides the diffuser, resulting in a rise in the total hydraulic loss, thus causing a minor decline in the head value at this operating point. For the valley point of 0.68QDes in the hump region, in addition to a slight increase in the hydraulic loss of the impeller, the hydraulic loss in the diffuser is significantly reduced due to water injection, as well as the losses in the draft tube and spiral casing. As a result, the total loss is reduced, which facilitates the increase in the size of the head at this operating condition point, and the formation of the hump region is suppressed. In addition, after water injection, the risk of flow separation in the diffuser is reduced, and the pulsation amplitude is also reduced.
  • In this paper, based on the velocity streamline in the diffuser, a water injection velocity of 20 m/s was preliminarily determined, and the effect of 20 m/s water injection velocity on the hump instability of the performance curve was analyzed, which has certain limitations. The optimal water injection velocity needs to be further determined. In the future, a comparative study will be conducted to investigate the impact of various injection water velocities on the hump region on the performance curve, aiming to identify the optimal injection velocity. Subsequently, utilizing the determined optimal injection velocity, the examination of the feasibility of different injection pore sizes will be undertaken to mitigate stalled rotation and optimize the hump region.

Author Contributions

Conceptualization, J.Y. and X.F.; methodology, X.F., J.Y. and Z.W.; software, X.F., Z.C. and T.P.; validation, J.Y., X.L. and X.F.; formal analysis, X.F. and J.Y.; investigation, X.F. and Z.W.; resources, T.P. and Z.C.; data curation, X.F., T.P. and Z.C.; writing—original draft preparation, X.F.; writing—review and editing, X.F., J.Y. and X.L.; visualization, X.F. and T.P.; supervision, J.Y. and X.L.; project administration, J.Y. and X.L.; funding acquisition, J.Y. and X.L. All authors have read and agreed to the published version of the manuscript.

Funding

This work was supported by the National Natural Science Foundation of China (Grant No. 51976125 and No. 51976116), and the Open Research Subject of Key Laboratory (Fluid Machinery and Engineering Research Base) in Sichuan Province (Grant No. szjj2019-022).

Institutional Review Board Statement

Not applicable.

Informed Consent Statement

Not applicable.

Data Availability Statement

Not applicable.

Conflicts of Interest

The authors declare no conflict of interest.

Nomenclature

BoHeight of guide vanes (m)
CvVelocity coefficient
D1Diameter of impeller inlet (m)
D2Diameter of impeller outlet (m)
fFrequency (Hz)
fBPFBlade passing frequency (Hz)
fRImpeller rotating frequency (Hz)
GVOGuide vanes opening (m)
gGravitational acceleration (m2/s)
HHead (m)
nRotational speed of the impeller (r/min)
NsSpecific speed
p0Reference pressure at absolute pressure at 25 °C (Pa)
pAbsolute pressure of water (Pa)
QDesDesigned flow rate (kg/s)
StStrouhal number
u2Circumferential velocity of the impeller outlet (m/s)
vVelocity (m/s)
v ¯ The average velocity of for a while (m/s)
ZNumber of the impeller blades
ZgNumber of guide vanes
ZsNumber of stay vanes
ρDensity of the water (kg/m3)
ρ0Reference density of water at reference pressure (kg/m3)
k0Reference volume modulus at reference pressure (Pa)
φHead coefficient
φsimNumerical simulation head coefficient
φexpExperimental head coefficient
γRelative error (%)

Abbreviation

CFDComputational Fluid Dynamics
DESDetached Eddy Simulation
FFTFast Fourier Transform
LESLarge Eddy Simulation
PSPPPumped Storage Power Plant
PATPump as Turbine
SSTShear Stress Transport

References

  1. Xi, F.; Yan, R.; Shi, J.; Zhang, J.; Wang, R. Pumped storage power station using abandoned mine in the Yellow River basin: A feasibility analysis under the perspective of carbon neutrality. Front. Environ. Sci. 2022, 10, 983319. [Google Scholar] [CrossRef]
  2. Ansari, B.; Aligholami, M.; Khosroshahi, A.R. An experimental and numerical investigation into using hydropower plant on oil transmission lines. Energy Sci. Eng. 2022, 10, 4397–4410. [Google Scholar] [CrossRef]
  3. Feng, J.S.; Bo, Y.; Wu, S.Y.; Zhang, F.Q.; Hao, W.H. Research on the function orientation of pumped-storage plant in China. IOP Conf. Ser. Earth Environ. Sci. 2017, 52, 012043. [Google Scholar] [CrossRef]
  4. Xin, Z.; Haijun, L.; Jianchu, S.; Jie, Z. Research on Selection of Different Speed Units for Super High Water Head and Large Capicity Pumped Storage Power Station. IOP Conf. Ser. Earth Environ. Sci. 2022, 1037, 012041. [Google Scholar] [CrossRef]
  5. Trivedi, C. Investigations of compressible turbulent flow in a high-head Francis turbine. J. Fluids Eng. 2018, 140, 011101. [Google Scholar] [CrossRef]
  6. Yan, J.; Koutnik, J.; Seidel, U.; Hübner, B. Compressible simulation of rotor-stator interaction in pump-turbines. Int. J. Fluid Mach. Syst. 2010, 3, 315–323. [Google Scholar] [CrossRef]
  7. Zhang, F.; Li, N.; Zhu, D.; Xiao, R.; Liu, W.; Tao, R. Influence of Weak Compressibility on the Hydrodynamic Performance Evaluation of Pump Turbines in the Pump Mode. Sci. Technol. Nucl. Install. 2022, 2022, 3544436. [Google Scholar] [CrossRef]
  8. Wang, S.; Chen, X.; Li, X.; Cui, B.; Zhu, Z. Weak compressibility effects on the pressure fluctuation at RSI in a highspeed centrifugal pump. J. Mech. Sci. Technol. 2022, 36, 5047–5057. [Google Scholar] [CrossRef]
  9. Yang, J.; Liu, J.; Liu, X.; Xie, T. Numerical Study of Pressure Pulsation of Centrifugal Pumps with the Compressible Mode. J. Therm. Sci. 2019, 28, 106–114. [Google Scholar] [CrossRef]
  10. Li, D.; Zuo, Z.; Wang, H.; Liu, S.; Wei, X.; Qin, D. Review of positive slopes on pump performance characteristics of pump-turbines. Renew. Sustain. Energy Rev. 2019, 112, 901–916. [Google Scholar] [CrossRef]
  11. Yang, J.; Feng, X.; Liao, Z.; Pan, K.; Liu, X. Analysis on the Mechanism of Rotating Stall Inner a Pump Turbine in Pump Mode Based on the Proper Orthogonal Decomposition. J. Fluids Eng. 2023, 145, 091202. [Google Scholar] [CrossRef]
  12. Yang, J.; Pavesi, G.; Liu, X.; Xie, T.; Liu, J. Unsteady flow characteristics regarding hump instability in the first stage of a multistage pump-turbine in pump mode. Renew. Energy 2018, 127, 377–385. [Google Scholar] [CrossRef]
  13. Yang, J.; Pavesi, G.; Yuan, S.; Cavazzini, G.; Ardizzon, G. Experimental Characterization of a Pump–Turbine in Pump Mode at Hump Instability Region. J. Fluids Eng. 2015, 137, 051109. [Google Scholar] [CrossRef]
  14. Xue, P.; Liu, Z.P.; Lu, L.; Tian, Y.J.; Wang, X.; Chen, R. Research and optimization of performances of a pump turbine in pump mode. IOP Conf. Ser. Earth Environ. Sci. 2019, 240, 072012. [Google Scholar] [CrossRef]
  15. Li, D.; Qin, Y.; Wang, J.; Zhu, Y.; Wang, H.; Wei, X. Optimization of blade high-pressure edge to reduce pressure fluctuations in pump-turbine hump region. Renew. Energy 2021, 181, 24–38. [Google Scholar] [CrossRef]
  16. Yang, W.; Xiao, R. Multiobjective Optimization Design of a Pump–Turbine Impeller Based on an Inverse Design Using a Combination Optimization Strategy. J. Fluids Eng. 2013, 136, 014501. [Google Scholar] [CrossRef]
  17. Kral, D. Active Flow Control Technology; Washington University: St. Louis, MO, USA, 1999. [Google Scholar]
  18. Gogstad, P.J.; Dahlhaug, O.G. Evaluation of runner cone extension to dampen pressure pulsations in a Francis model turbine. IOP Conf. Ser. Earth Environ. Sci. 2016, 49, 082019. [Google Scholar] [CrossRef]
  19. Kurokawa, J.; Imamura, H.; Choi, Y.-D. Effect of J-Groove on the Suppression of Swirl Flow in a Conical Diffuser. J. Fluids Eng. 2010, 132, 071101. [Google Scholar] [CrossRef]
  20. Muntean, S.; Resiga, R.; Câmpian, V.; Dumbrava, C.; Adrian, C. In situ unsteady pressure measurements on the draft tube cone of the Francis turbine with air injection over an extended operating range. UPB Sci. Bull., Ser. D 2013, 76, 173–180. [Google Scholar]
  21. Adolfsson, S. Expanding Operation Ranges Using Active Flow Control in Francis Turbines. Bachelor’s Thesis, Umea University, Umea, Sweden, 2014. [Google Scholar]
  22. Kougias, I.; Aggidis, G.; Avellan, F.; Deniz, S.; Lundin, U.; Moro, A.; Muntean, S.; Novara, D.; Pérez-Díaz, J.I.; Quaranta, E.; et al. Analysis of emerging technologies in the hydropower sector. Renew. Sustain. Energy Rev. 2019, 113, 109257. [Google Scholar] [CrossRef]
  23. Jafarzadeh Juposhti, H.; Maddahian, R.; Cervantes, M.J. Optimization of axial water injection to mitigate the Rotating Vortex Rope in a Francis turbine. Renew. Energy 2021, 175, 214–231. [Google Scholar] [CrossRef]
  24. Deniz, S.; von Burg, M.; Tiefenthaler, M. Investigation of the Flow Instabilities of a Low Specific Speed Pump Turbine Part 2: Flow Control With Fluid Injection. J. Fluids Eng. 2022, 144, 071210. [Google Scholar] [CrossRef]
  25. Deniz, S.; Del Rio, A.; von Burg, M.; Tiefenthaler, M. Investigation of the Flow Instabilities of a Low Specific Speed Pump Turbine Part 1: Experimental and Numerical Analysis. J. Fluids Eng. 2022, 144, 071209. [Google Scholar] [CrossRef]
  26. Deniz, S.; Asaro, F. Improvements of Flow Control With Fluid Injection for the Suppression of Flow Instabilities in Pump-Turbines. Fluids Eng. Div. Summer Meet. 2021, 85291, V002T03A025. [Google Scholar] [CrossRef]
  27. Khullar, S.; Singh, K.M.; Cervantes, M.J.; Gandhi, B.K. Numerical Analysis of Water Jet Injection in the Draft Tube of a Francis Turbine at Part Load Operations. J. Fluids Eng. 2022, 144, 111201. [Google Scholar] [CrossRef]
  28. Mohammadi, M.; Hajidavalloo, E.; Behbahani-Nejad, M. Investigation on Combined Air and Water Injection in Francis Turbine Draft Tube to Reduce Vortex Rope Effects. J. Fluids Eng. 2018, 141, 051301. [Google Scholar] [CrossRef]
  29. Lewis, B. Improving Unsteady Hydroturbine Performance during Off-Design Operation by Injecting Water from the Trailing Edge of the Wicket Gates; The Pennsylvania State University: State College, PA, USA, 2014. [Google Scholar]
  30. Resiga, R.; Vu, T.; Muntean, S.; Ciocan, G.; Nennemann, B. Jet Control of the Draft Tube Vortex Rope in Francis Turbines at Partial Discharge. In Proceedings of the 23rd IAHR Symposium Conference, Gdansk, Poland, 12–14 September 2022; pp. 67–80. [Google Scholar]
  31. Muntean, S.; Resiga, R.; Bosioc, A. 3D Numerical Analysis of Unsteady Pressure Fluctuations in a Swirling Flow without and with Axial Water Jet Control. In Proceedings of the 14th International Conference on Fluid Flow Technologies (CMFF’09), Budapest, Hungary, 9–12 September 2009; Volume 2, pp. 510–518. [Google Scholar]
  32. Deng, X. Influence of Compressible on Internal Flow Structure of Pump-Turbine in Hump Area. Master’s Thesis, University of Shanghai for Science and Technology, Shanghai, China, 2022. [Google Scholar]
  33. Song, H.; Zhang, J.; Huang, P.; Cai, H.; Hu, B. Analysis of Rotor-Stator Interaction of a Pump-Turbine with Splitter Blades in a Pump Mode. Mathematics 2020, 8, 1465. [Google Scholar] [CrossRef]
  34. Li, Z.; Wang, Z.; Wei, X.; Qin, D. Flow Similarity in the Rotor–Stator Interaction Affected Region in Prototype and Model Francis Pump-Turbines in Generating Mode. J. Fluids Eng. 2016, 138, 061201. [Google Scholar] [CrossRef]
  35. Li, W.; Ji, L.; Li, E.; Shi, W.; Agarwal, R.; Zhou, L. Numerical investigation of energy loss mechanism of mixed-flow pump under stall condition. Renew. Energy 2021, 167, 740–760. [Google Scholar] [CrossRef]
  36. Liu, H.; Pan, H. The Influence of Turbulence Model Selection and Leakage Considerations on CFD Simulation Results for a Centrifugal Pump. Adv. Mater. Res. 2012, 594–597, 1940–1944. [Google Scholar] [CrossRef]
  37. Al-Obaidi, A.R. Effects of Different Turbulence Models on Three-Dimensional Unsteady Cavitating Flows in the Centrifugal Pump and Performance Prediction. Int. J. Nonlinear Sci. Numer. Simul. 2019, 20, 487–509. [Google Scholar] [CrossRef]
  38. Li, D.; Gong, R.; Wang, H.; Wei, X.; Liu, Z.; Qin, D. Hump Characteristics of Different Guide Vane Openings of Pump Turbines. J. Drain. Irrig. Mach. Eng. 2016, 34, 1–8. [Google Scholar] [CrossRef]
  39. Cavazzini, G. Rotor-Stator Interaction in Radial Turbomachines: Experimental and Numerical Investigation; LAP LAMBERT Academic Publication: Saarland, Germany, 2013. [Google Scholar]
Figure 1. Numerical model of pump turbine.
Processes 11 01647 g001
Figure 2. Local detailed grids of each component of the pump turbine. (a) Draft tube. (b) Impeller. (c) Diffuser (guide/stay vanes). (d) Spiral casing.
Processes 11 01647 g002
Figure 3. Comparison of experimental and numerical on the performance curves.
Processes 11 01647 g003
Figure 4. Hydraulic loss (a) and proportion of each component (b).
Processes 11 01647 g004
Figure 5. Streamline distribution on different spanwise surfaces at 0.80QDes.
Processes 11 01647 g005
Figure 6. Water injection near the outlet of the shroud of the guide vanes.
Processes 11 01647 g006
Figure 7. Comparison of performance curves before and after water injection.
Processes 11 01647 g007
Figure 8. Comparison of hydraulic loss in the hump region. (a) Without water injection. (b) With water injection.
Processes 11 01647 g008
Figure 9. Streamline comparison in the diffuser near the shroud at different times at 0.75QDes and 0.68QDes. (a) Without water injection. (b) With water injection.
Processes 11 01647 g009
Figure 10. Velocity spectrum of GV1 in guide vanes channel in the hump region.
Processes 11 01647 g010
Table 1. Main parameters of the pump turbine.
ParametersSymbolValue
Rotational speed of the impeller (r/min)n1000
Specific speedNs34.01
Number of impeller bladesZ9
Number of guide vanesZg20
Number of stay vanesZs20
Diameter of impeller inlet (m)D10.250
Diameter of impeller outlet (m)D20.488
Height of guide vanes (m)B00.0437
Guide vanes opening (m)GVO0.019
Table 2. Three sets of different meshes and grid independence verification.
1st2nd3rd
Grid parametersSpiral casing1.29 × 1060.74 × 1060.41 × 106
Diffuser4.83 × 1063.32 × 1062.38 × 106
Impeller5.16 × 1064.09 × 1062.98 × 106
Draft tube1.31 × 1060.77 × 1060.42 × 106
Total number12.59 × 1068.92 × 1066.19 × 106
Independent
analysis
φ s i m 0.8180.8150.813
( φ exp φ s i m ) / φ exp 3.3%3.7%3.9%
Table 3. Relative error of head coefficient at different working conditions of performance curve.
Q/QDes (-)0.590.650.680.750.80.890.941.00
γincom (%)4.6593.5513.7073.5053.2163.9962.8062.525
γcom (%)1.2261.2701.1821.3902.1331.2690.3570.576
Table 4. Relative error of head coefficient before and after water injection.
Q/QDes (-)0.590.650.680.750.80.890.941.00
γ (%)4.372463.340973.237090.380780.545244.236683.463633.51266
Disclaimer/Publisher’s Note: The statements, opinions and data contained in all publications are solely those of the individual author(s) and contributor(s) and not of MDPI and/or the editor(s). MDPI and/or the editor(s) disclaim responsibility for any injury to people or property resulting from any ideas, methods, instructions or products referred to in the content.

