Article

Development and Numerical Optimization of a System of Integrated Agents for Serial Production Lines

1
Advanced Manufacturing Institute, King Saud University, Riyadh 11421, Saudi Arabia
2
Department of Mechanical Engineering, Faculty of Engineering, The British University in Egypt (BUE), El-Sherouk City 11837, Egypt
3
Department of Production Engineering and Mechanical Design, Faculty of Engineering, Port Said University, Port Fouad 42526, Egypt
4
Institute for Automation and Applied Informatics, Karlsruhe Institute of Technology, 76344 Eggenstein-Leopoldshafen, Germany
*
Author to whom correspondence should be addressed.
Processes 2023, 11(5), 1578; https://doi.org/10.3390/pr11051578
Submission received: 7 February 2023 / Revised: 20 April 2023 / Accepted: 17 May 2023 / Published: 22 May 2023

Abstract

:
In modern high-volume industries, the serial production line (SPL) is of growing importance due to the inexorable increase in the complexity of manufacturing systems and the associated production costs. Optimal decisions regarding buffer size and the selection of components when designing and implementing an SPL can be difficult, often requiring complex analytical models, which can be difficult to conceive and construct. Here, we propose a model to evaluate and optimize the design of an SPL, integrating numerical simulation with artificial intelligence (AI). Numerous studies relating to the design of SPL systems have been published, but few have considered the simultaneous consideration of a number of decision variables. Indeed, the authors have been unable to locate in the published literature even one work that integrated the selection of components with the optimization of buffer sizes into a single framework. In this research, a System of Integrated Agents Numerical Optimization (SIGN) is developed by which the SPL design can be optimized. A SIGN consists of a components selection system and a decision support system. A SIGN aids the selection of machine tools, buffer sizes, and robots via the integration of AI and simulations. Using a purpose-developed interface, a user inputs the appropriate SPL parameters and settings, selects the decision-making and optimization techniques to use, and then displays output results. It will be implemented in open-source software to broaden the impact of the SIGN and extend its influence in industry and academia. It is expected that the results of this research project will significantly influence open-source manufacturing system design and, consequently, industrial and economic development.

1. Introduction

In the past decades, serial production lines (SPLs) have received much attention and have been considered an important key to organizational success. Many issues related to SPLs are considered in the existing publications, such as scheduling problems, FMS layout design, improved flexibility, throughput maximization, FMS design, etc. [1,2].
In modern mass-production plants, SPLs are a popular means of production. A serial, automated flow or transfer production line consists of a sequence of several or many machine tools with buffers (bays) between for the in-process parts [3]. The buffers’ main purpose is to enable the individual machines comprising the production line to operate relatively independently, which lowers the effect of any interruption of the line, such as a machine failure upstream [4]. The buffers also absorb the variability in the production line due to, for example, the stochastic nature of machine tool production, differences in capacity, or the throughputs at various stages in the process. The provision of such buffers imposes capital costs and occupies floor space in the factory [5]. Thus, for the maximum production efficiency, the buffers’ size must be minimized.
The Buffer Allocation Problem (BAP) has been the subject of significant previous research. Yamamoto et al. [6] simulated the production system using a GA as part of a system to support decision-making that could “improve” decisions regarding buffer allocation. Qudeiri et al. [7] used a GA to optimize workstation capacity and buffer size for both serial and parallel production lines. Qudeiri et al. [8] extended the use of a GA to simulate flexible production systems with sub-systems, which included buffer size, and concluded that production engineers could advantageously use their system when making decisions on the size of buffers for flexible production lines with sub-systems. Zandieh et al. [9] studied the BAP by applying the GA and particle swarm optimization algorithms to solve a special class of problems. Shao et al. [10] suggested another novel means for the simultaneous resolution of the BAP and transfer line balancing problem, which was extended to calculate the production rate.
Kang and Ju [11] determined an optimal maintenance policy for an SPL consisting of a series of machines, with each pair separated by an infinite buffer using Markov decision models. Ouzineb et al. [12] studied the BAP and location of inspection stations for unreliable SPLs. The aim was to fulfill the customer requirements at a minimum cost by optimizing the buffer size and minimizing the number of inspection stations by selecting suitable locations. It was reported that an exact mathematical method had been developed and was able to solve the problem when as many as 30 machine tools were involved. Dolgui et al. [13] used SIBEA and SEMO, commercially available software packages, to investigate a multi-criterial optimization problem concerning the buffer volume required in an SPL, and demonstrated that when such problems contained large dimensions, the proposed method provided an efficient solution. Another study used a simulation-based approach to simultaneously optimize the processing time and buffer level in a real-world problem [14]. The design of experiments (DOE) was used to obtain a mathematical model of this double-objective problem, and a multi-objective GA was then used to optimize the mathematical model. Liberopoulos [15] considered an SPL operating on a buffer allocation policy, whereby if the buffer immediately following a machine is full, the component can be stored in any of the downstream buffers. The line was simulated as a queuing network decomposed with the sum of nested segments equal to the sum of the buffers, with each segment considered a sub-system composed of a buffer, and its two adjoining machines were analyzed in isolation. Modeling each sub-system as a Markov chain, and applying the method to both five- and ten-machine lines showed that the method provided accurate results and was computationally efficient. Xi et al. [16] discussed an optimization problem for unbalanced parallel SPLs with multiple objectives: to optimize the machine selection and optimize the number of parallel lines and buffer capacities to obtain the necessary cycler time and throughput. The method used was to divide a given production line into a number of smaller lines optimized individually and then unify the obtained results via a coordination process. The results of the method were compared with—and showed better efficiency than—simulated annealing and NSGA-II.
Weiss et al. [17] carried out a thorough evaluation of the available publications concerning the BAP in production lines with a view to highlighting future research directions. Kose and Kilincci [18] investigated the buffer allocation in open SPLs, considering two apparently contradictory goals, reducing the buffer size while increasing the production rate, using Elitist NSGA-II, and a unique form of multi-objective simulated annealing. A simulation of discrete events was used to assess the performance of the different SPLs, revealing that the method developed had a considerable possibility for minimizing the aggregate buffer space. Koyuncuoglu and Leyla [19] attempted to maximize the throughput of unreliable production lines as a function of overall buffer size using two algorithms for assessing the BAP. The results showed that the Combat GA algorithm did not perform as well as the Big Bang–Big Crunch. Demir and Koyuncuoglu [20] searched for the BAP in an SPL using a variable neighborhood approach, which they found to be very successful in determining high-quality solutions.
In a research study, an adaptive large neighborhood search was employed to optimize the buffer allocation in unreliable production lines [21]. The suggested algorithm’s performance was evaluated using the current benchmark examples. The research showed the advantages of both the suggested initialization method and the adaptive mechanism built into the algorithm. Duan et al. [22] optimized the multi-stage production line, including the unreliable machines. The theoretical production rate was maximized, and the system state entropy was minimized. An improved vector Universal Generating Function (UGF) technique and composition operators were employed with the Markovian chain. An engine head production line problem was utilized as a case study to show the efficacy of the proposed method. Hernández-Vázquez et al. [23] utilized statistical analysis and a meta-model approach for optimizing the buffer allocation in a footwear manufacturing line. Magnanini et al. [24] proposed a novel algorithm for the buffer capacity optimization in autonomous asynchronous unreliable lines. The results reported that the proposed algorithm performed better than the gradient-based algorithms in limited numbers of iterations. Nahas [25] presented an integrated approach for buffer allocation, equipment selection, and line balancing in unreliable production lines. A method based on the nonlinear threshold accepting algorithm (NLTA) was proposed to solve the optimization problem. The results for various numerical case studies were compared against the great deluge algorithm (GDA), and NLTA gave better results. In another research study, the NSGA-II algorithm was used for the multi-objective optimization of the buffer capacity allocation in multi-product unreliable production lines [26]. Gao [27] presented a bottleneck detection-based tabu search algorithm for optimizing the BAP. Compared to the simple tabu search and adaptive tabu search algorithms, the numerical examples demonstrated that the suggested approach could more quickly find the near-optimal solution.
Previous research into the selection of components for SPLs, reported in the literature, was often limited both by the general assumption that the other components had been previously determined and the lack of simultaneous consideration of more than one decision variable. The authors are unaware of any published work that integrates into a single context the optimization of buffer sizes with component selection. The research proposed here will develop a System of Integrated Agents Numerical Optimization (SIGN), which uses multi-criteria decision-making to optimize selection of buffer sizes via a Buffer Size Optimization module, robots, and machine tools selection via the Components Selection System and Manufacturing Simulator System modules. To determine an optimal design for an SPL, the three modules are combined into a single framework under the control of a user-friendly interface.
The expected contribution of this research can be presented in the following points:
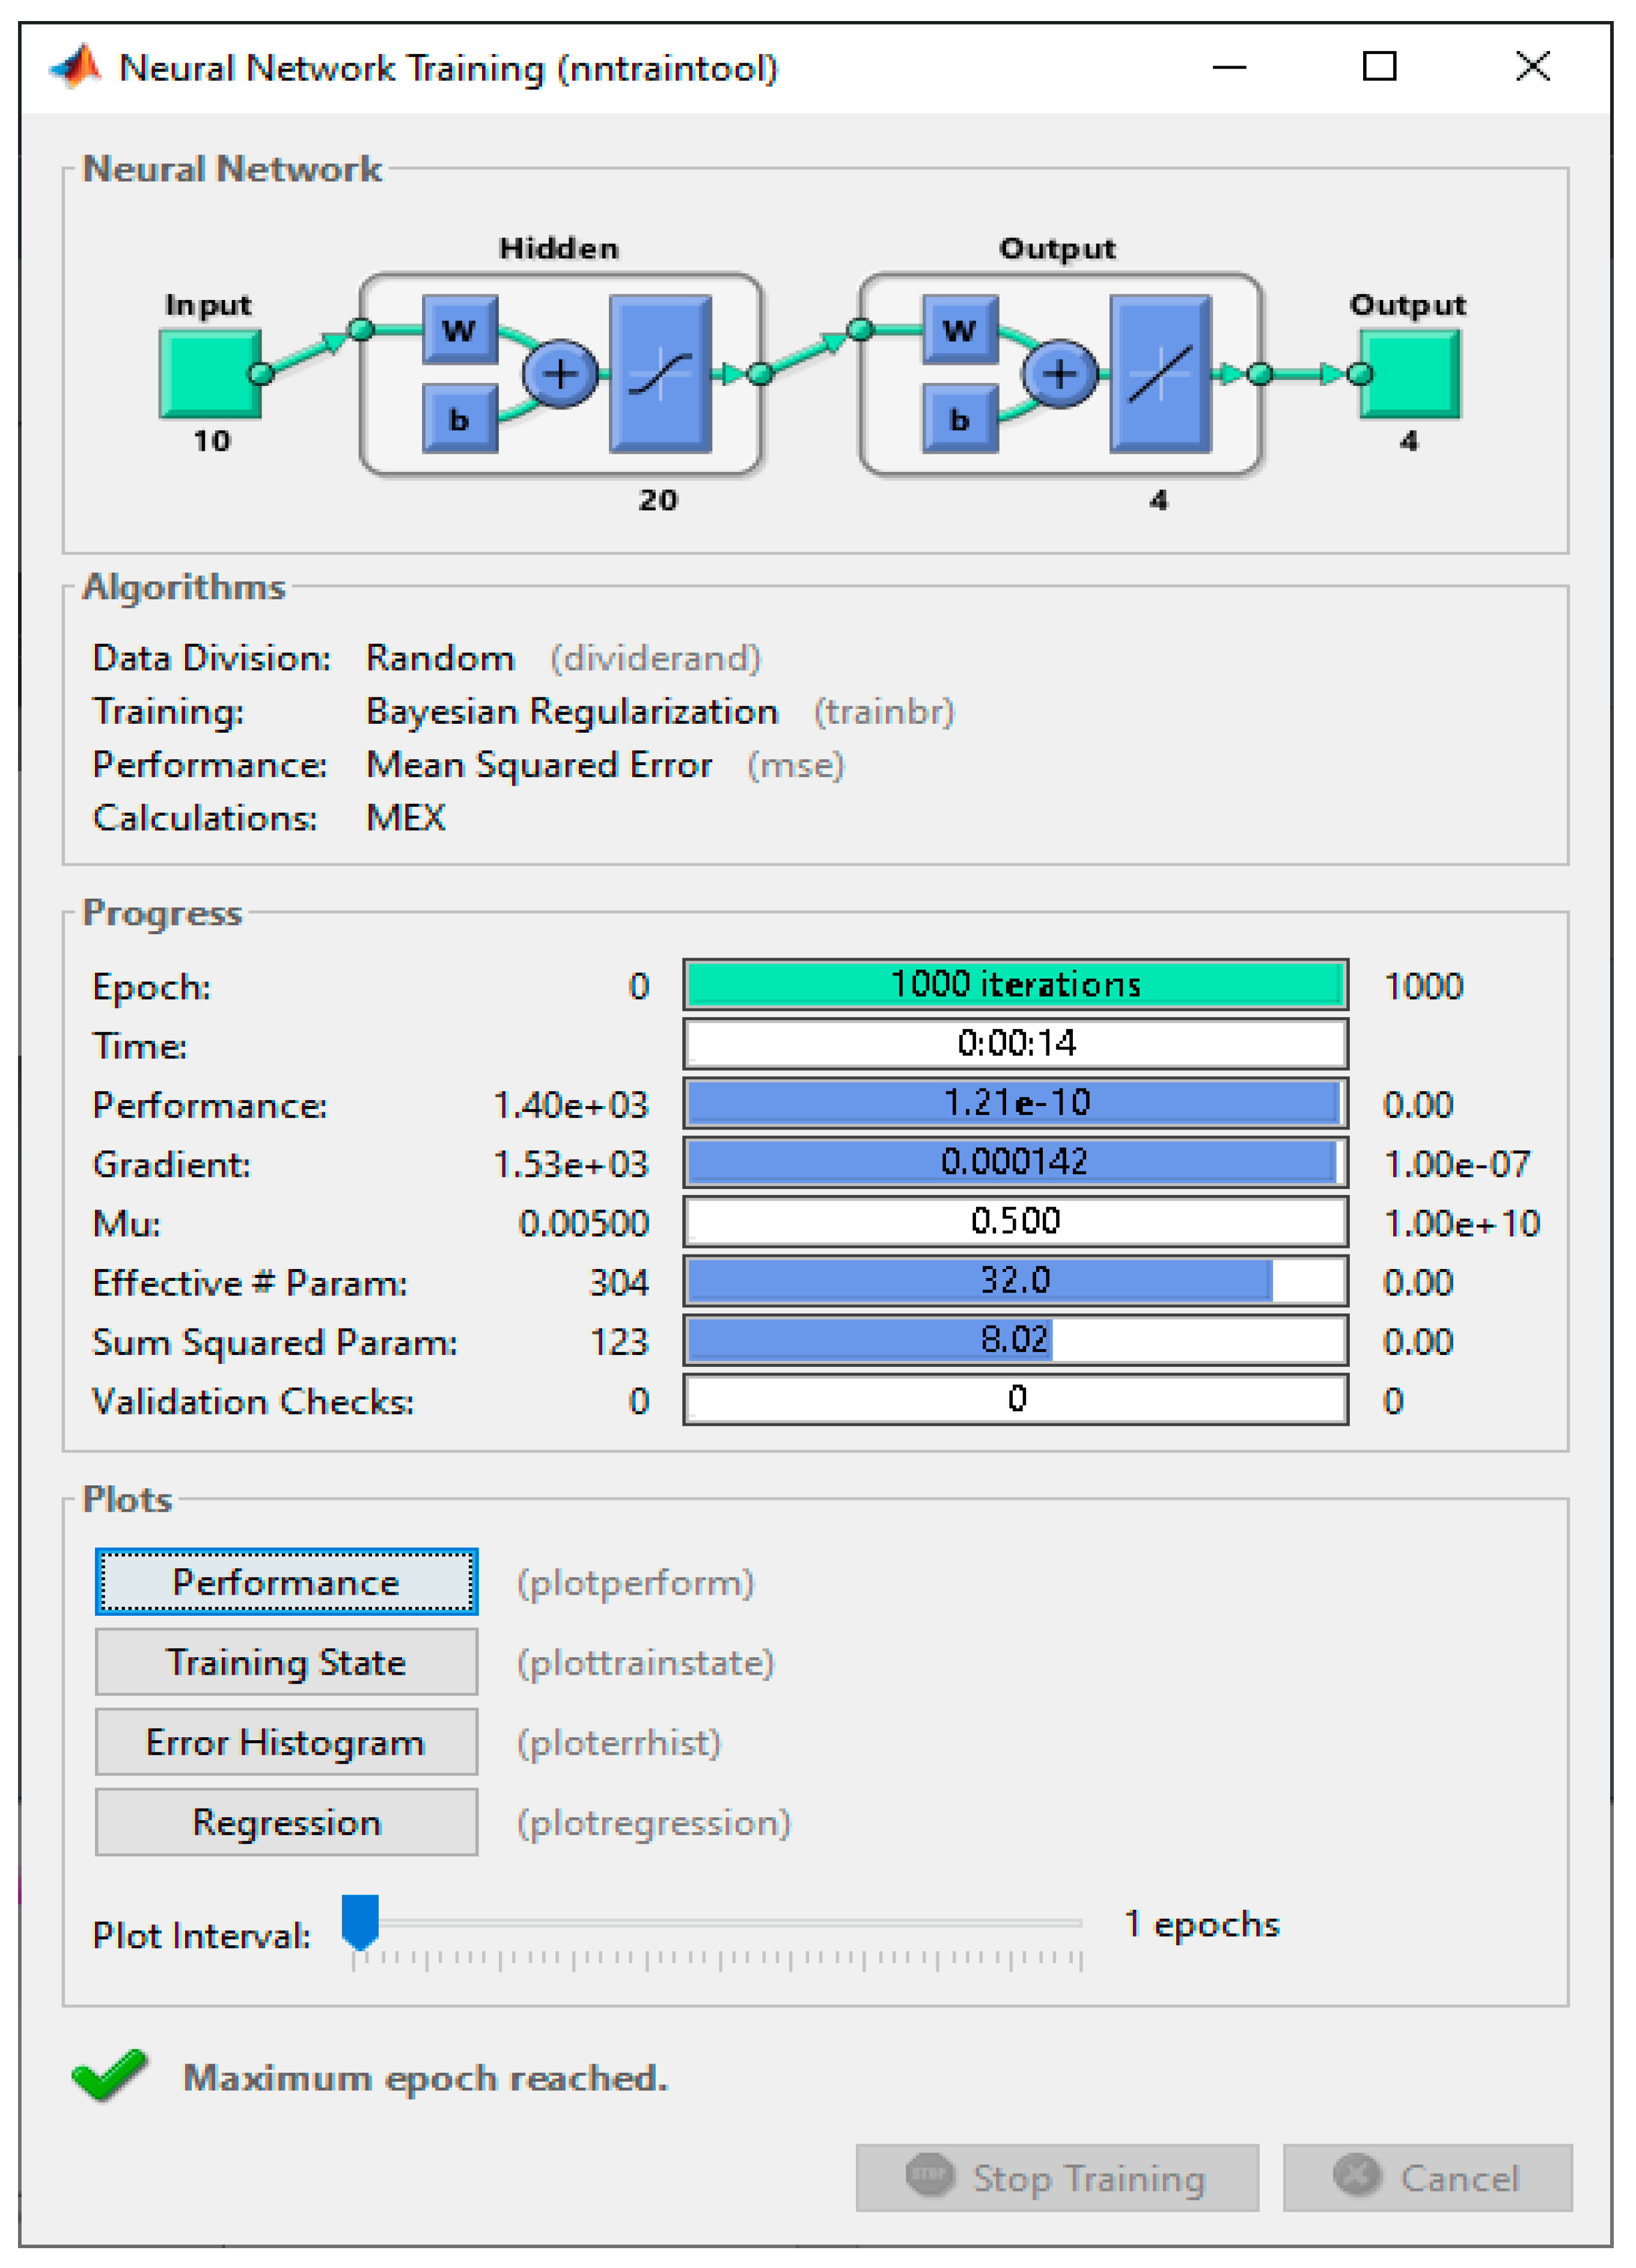
  • With the aid of GA, ANN, AHP, a design, development, and evaluation of an integrated framework for a manufacturing simulation system will be conducted for the buffer size optimization and components selection.
  • The proposed solution will be able to determine the optimal buffer sizes in FMS for different types of production lines such as SPL, which paves the way to deal with more complex systems.
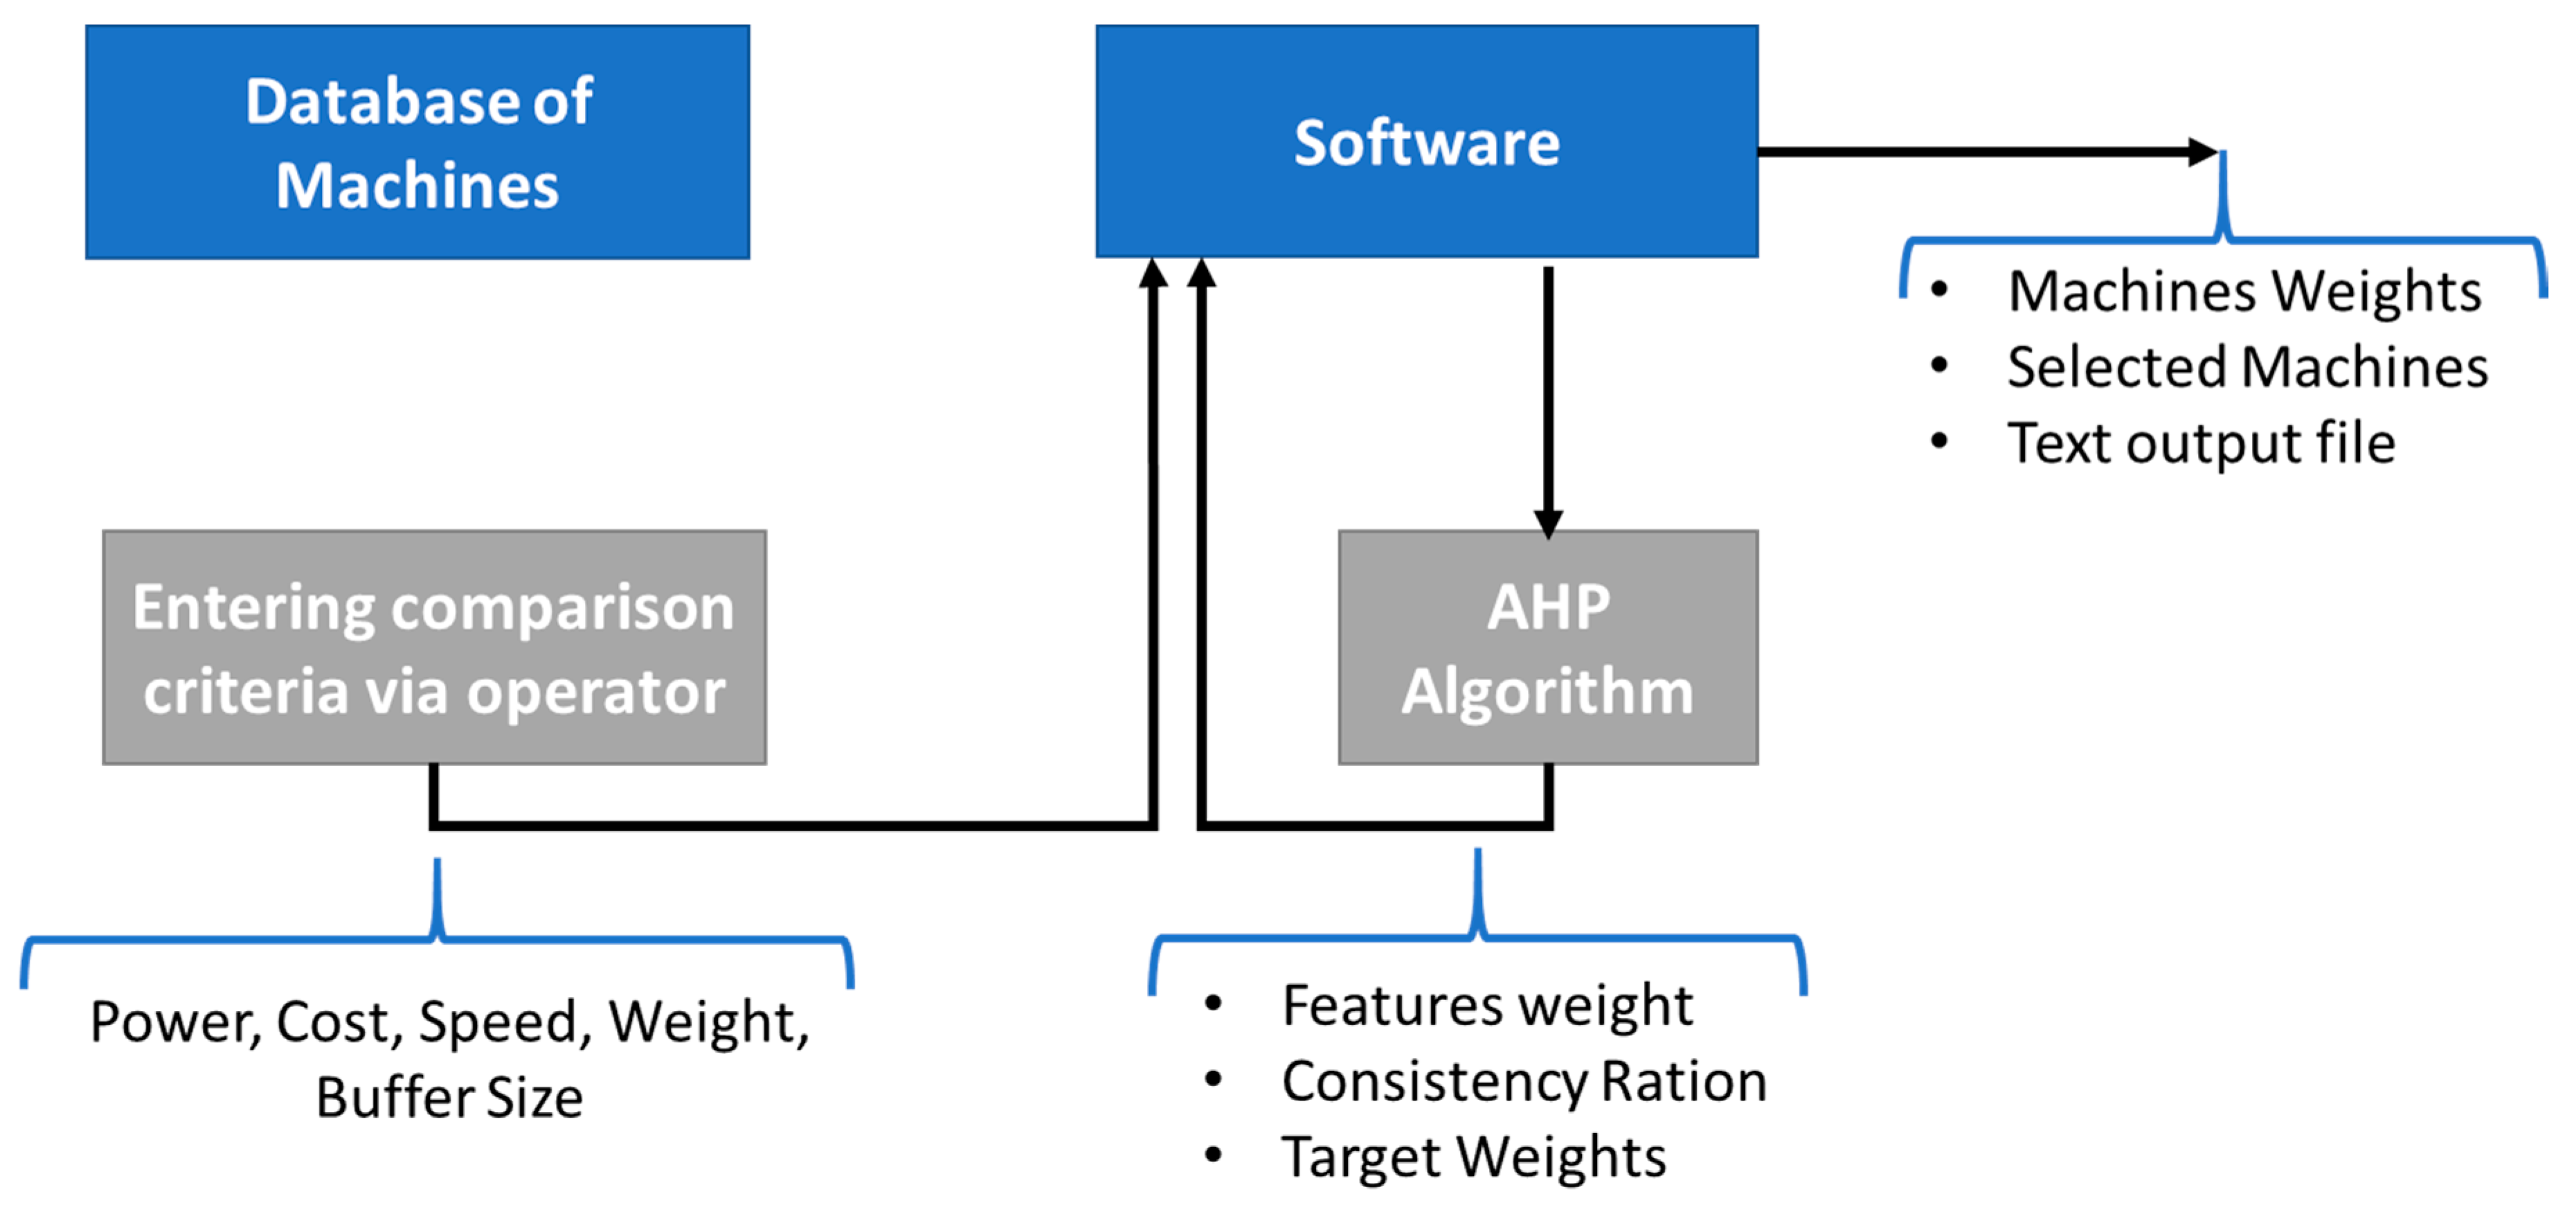
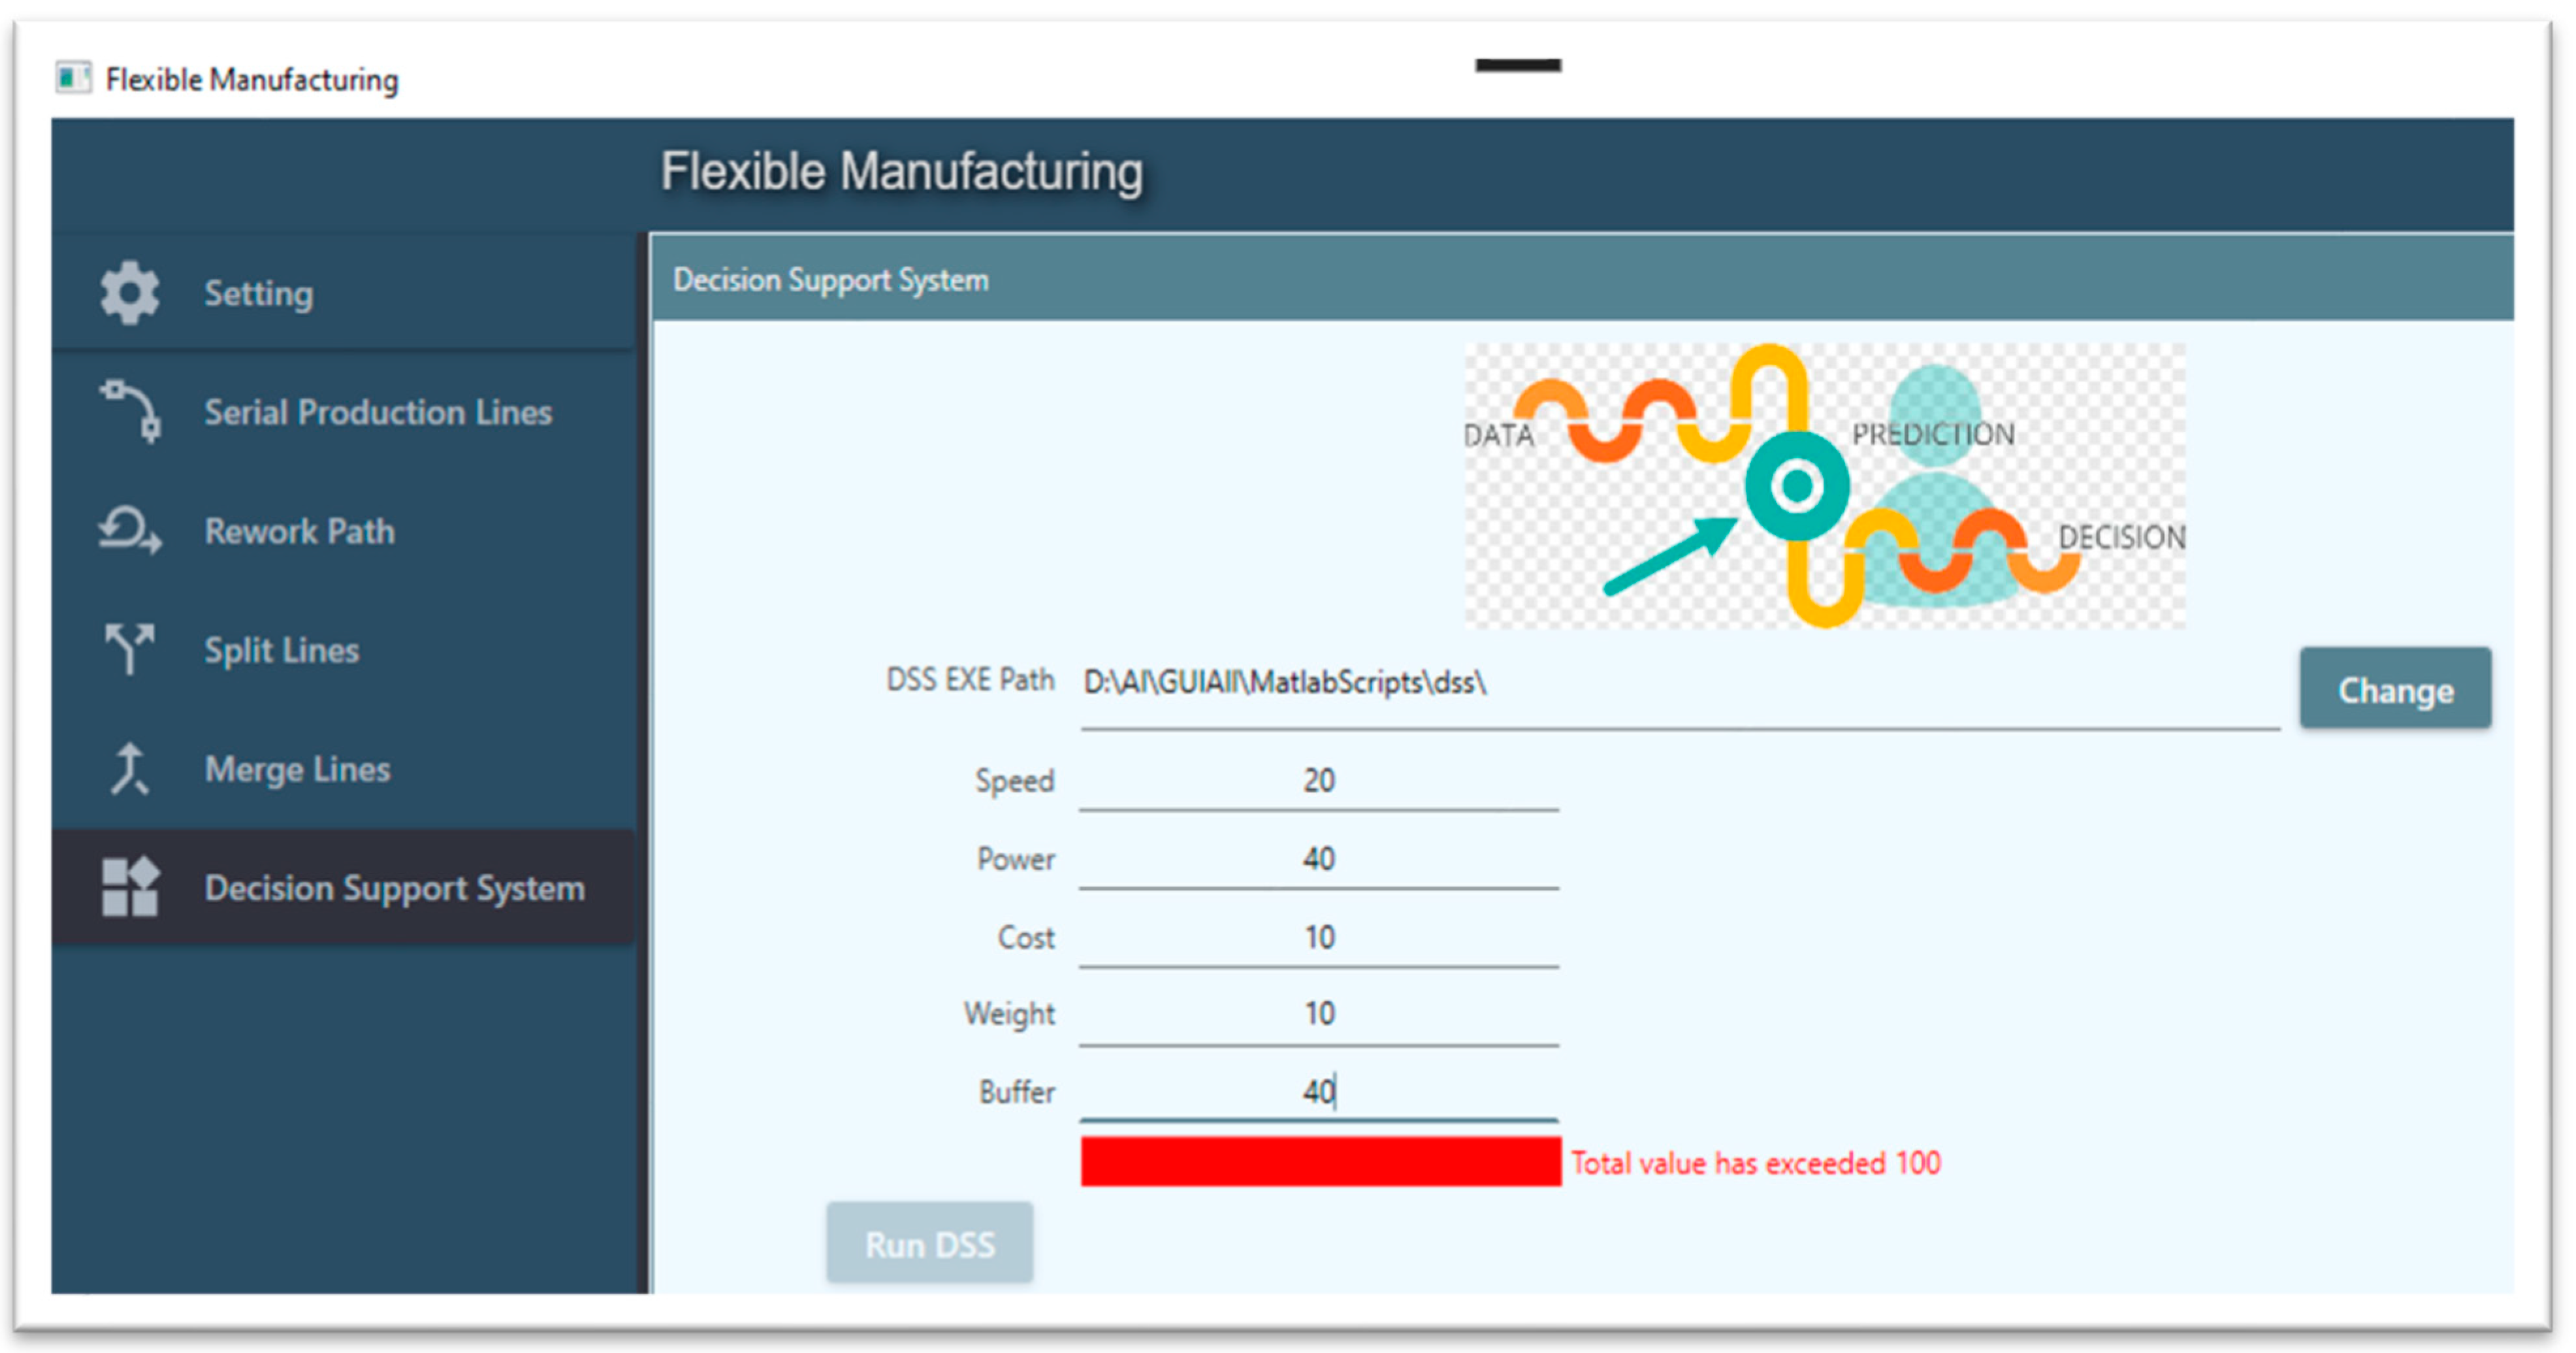
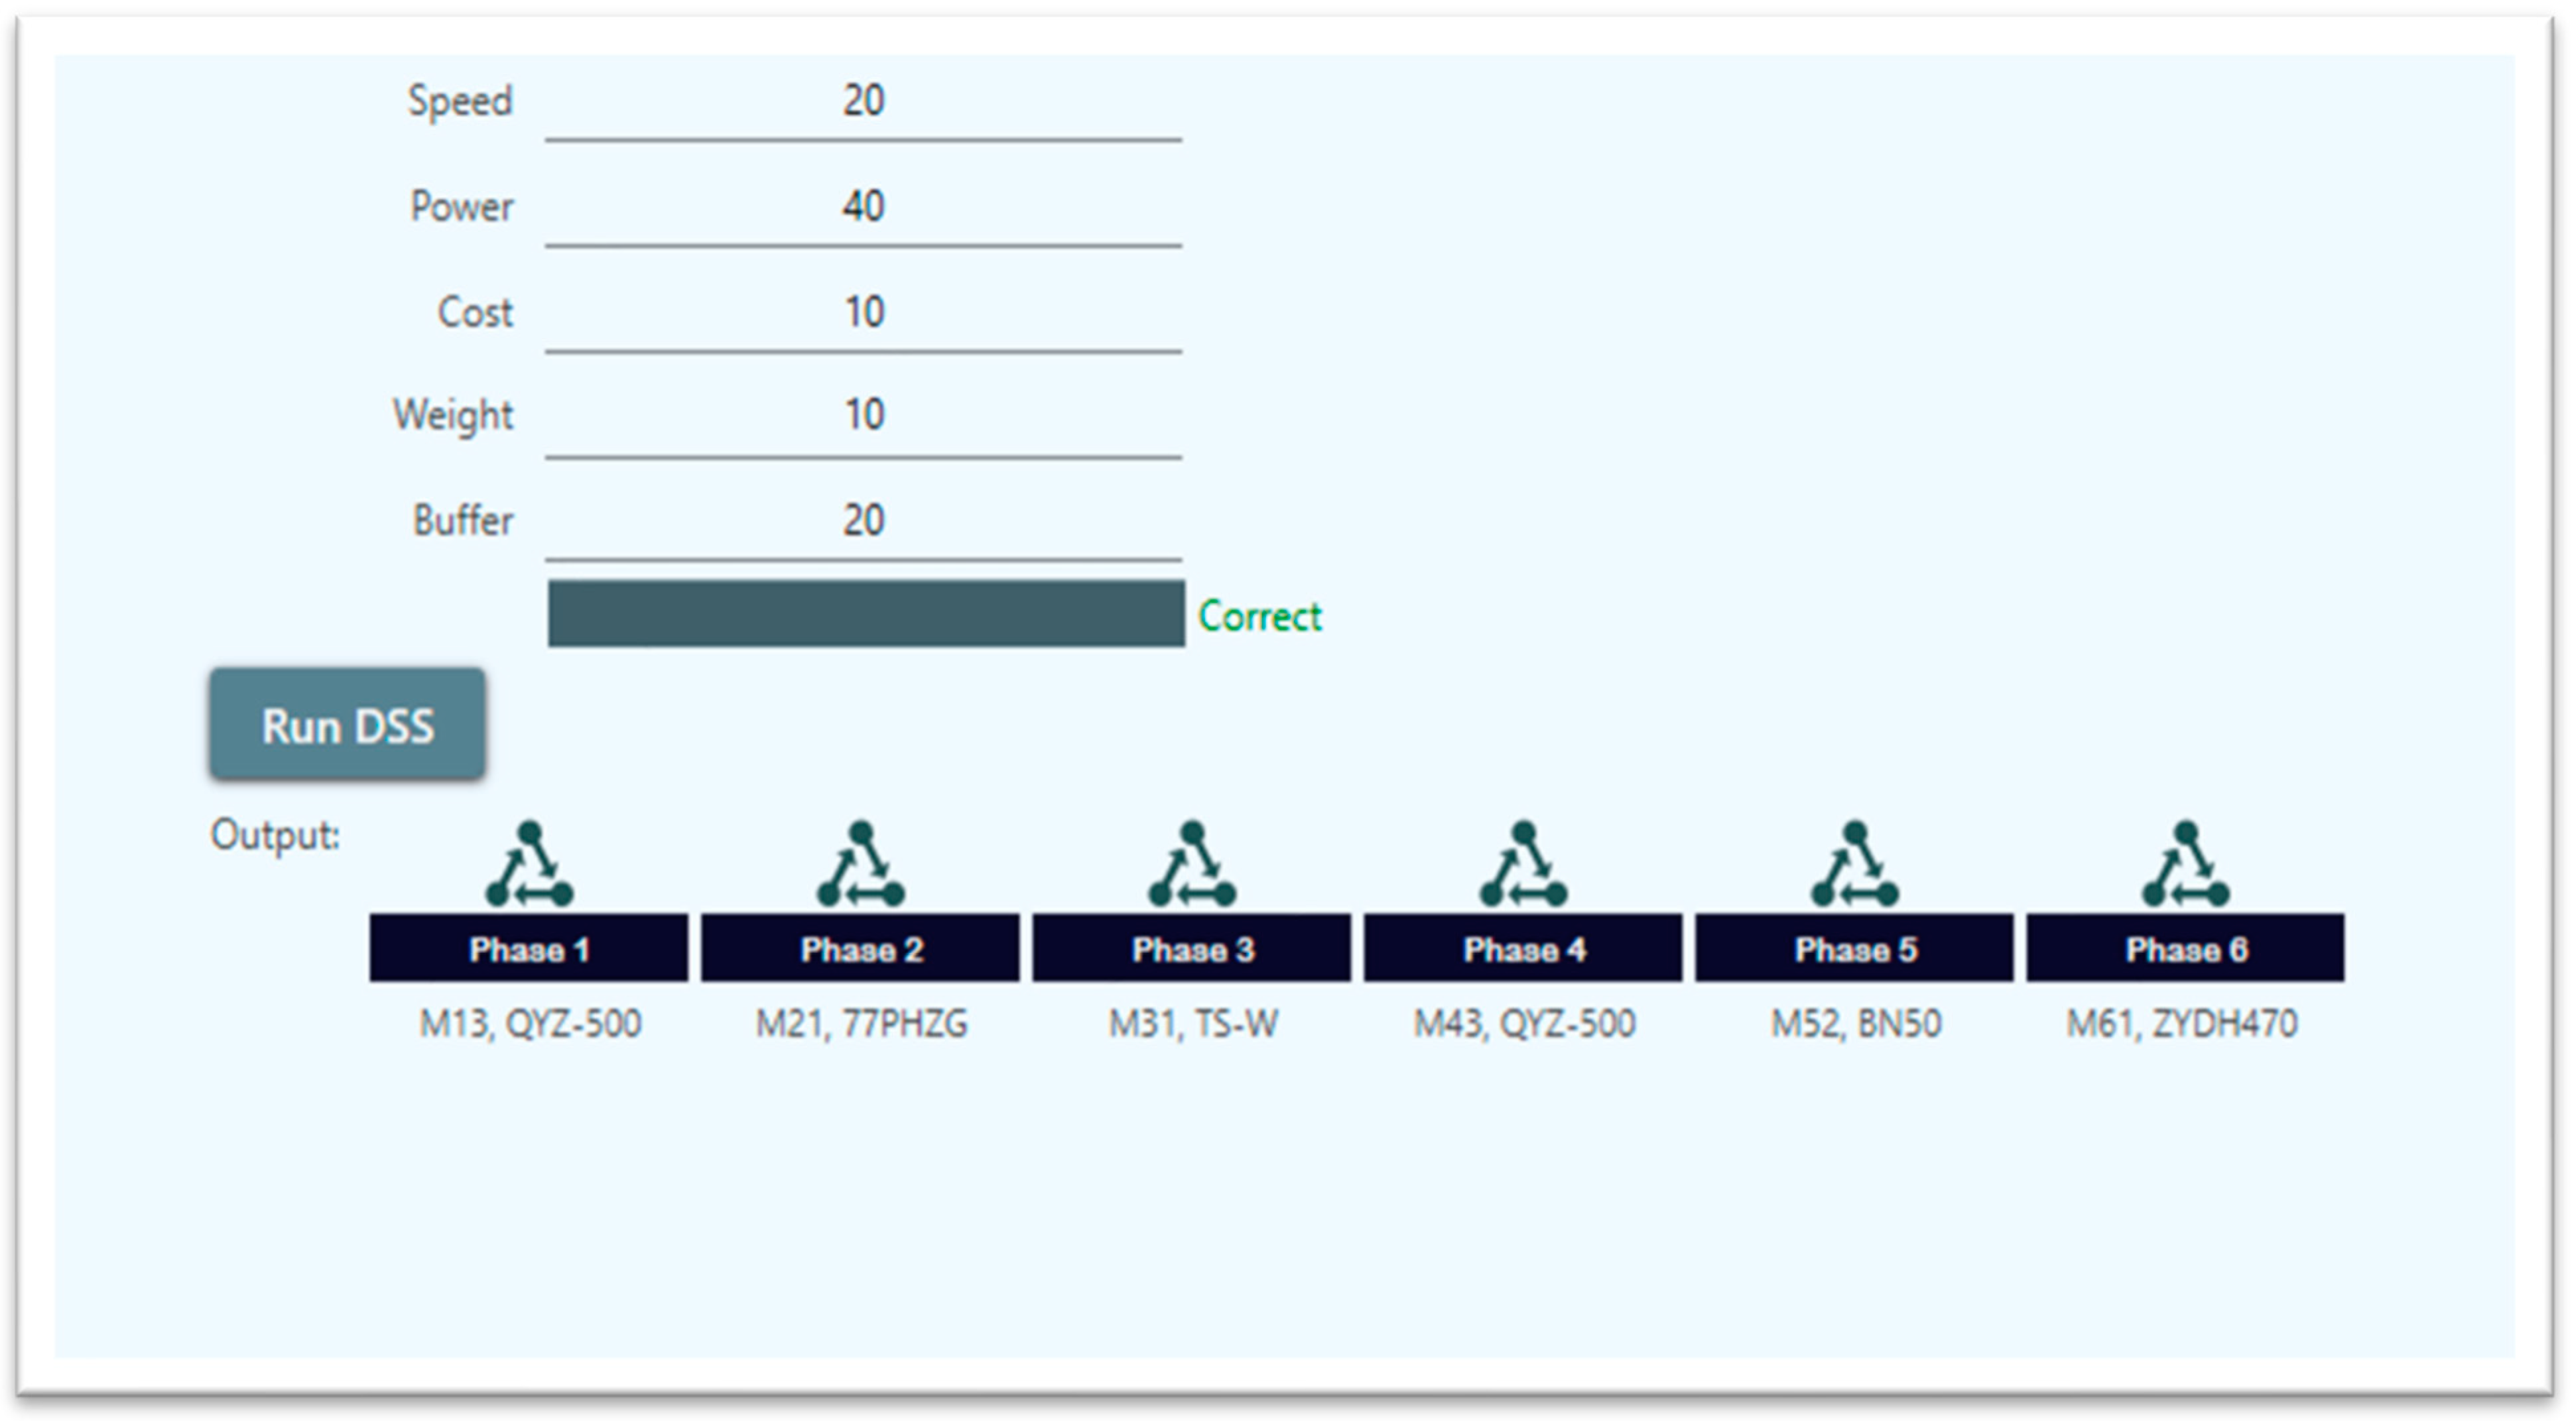
  • A manufacturing decision-support system (DSS) for FMS will be designed, developed, and evaluated.
  • The proposed DSS will be impowered with reliable features that enable users to select the manufacturing system components based on predefined criteria, and tailored datasets of FMS components and their characteristics.

2. Theoretical Background

2.1. Structures of Production Systems

The structure of the flexible manufacturing system studied in this research is an SPL, see Figure 1 [28].
The major assumptions regarding SPL components are [28]:
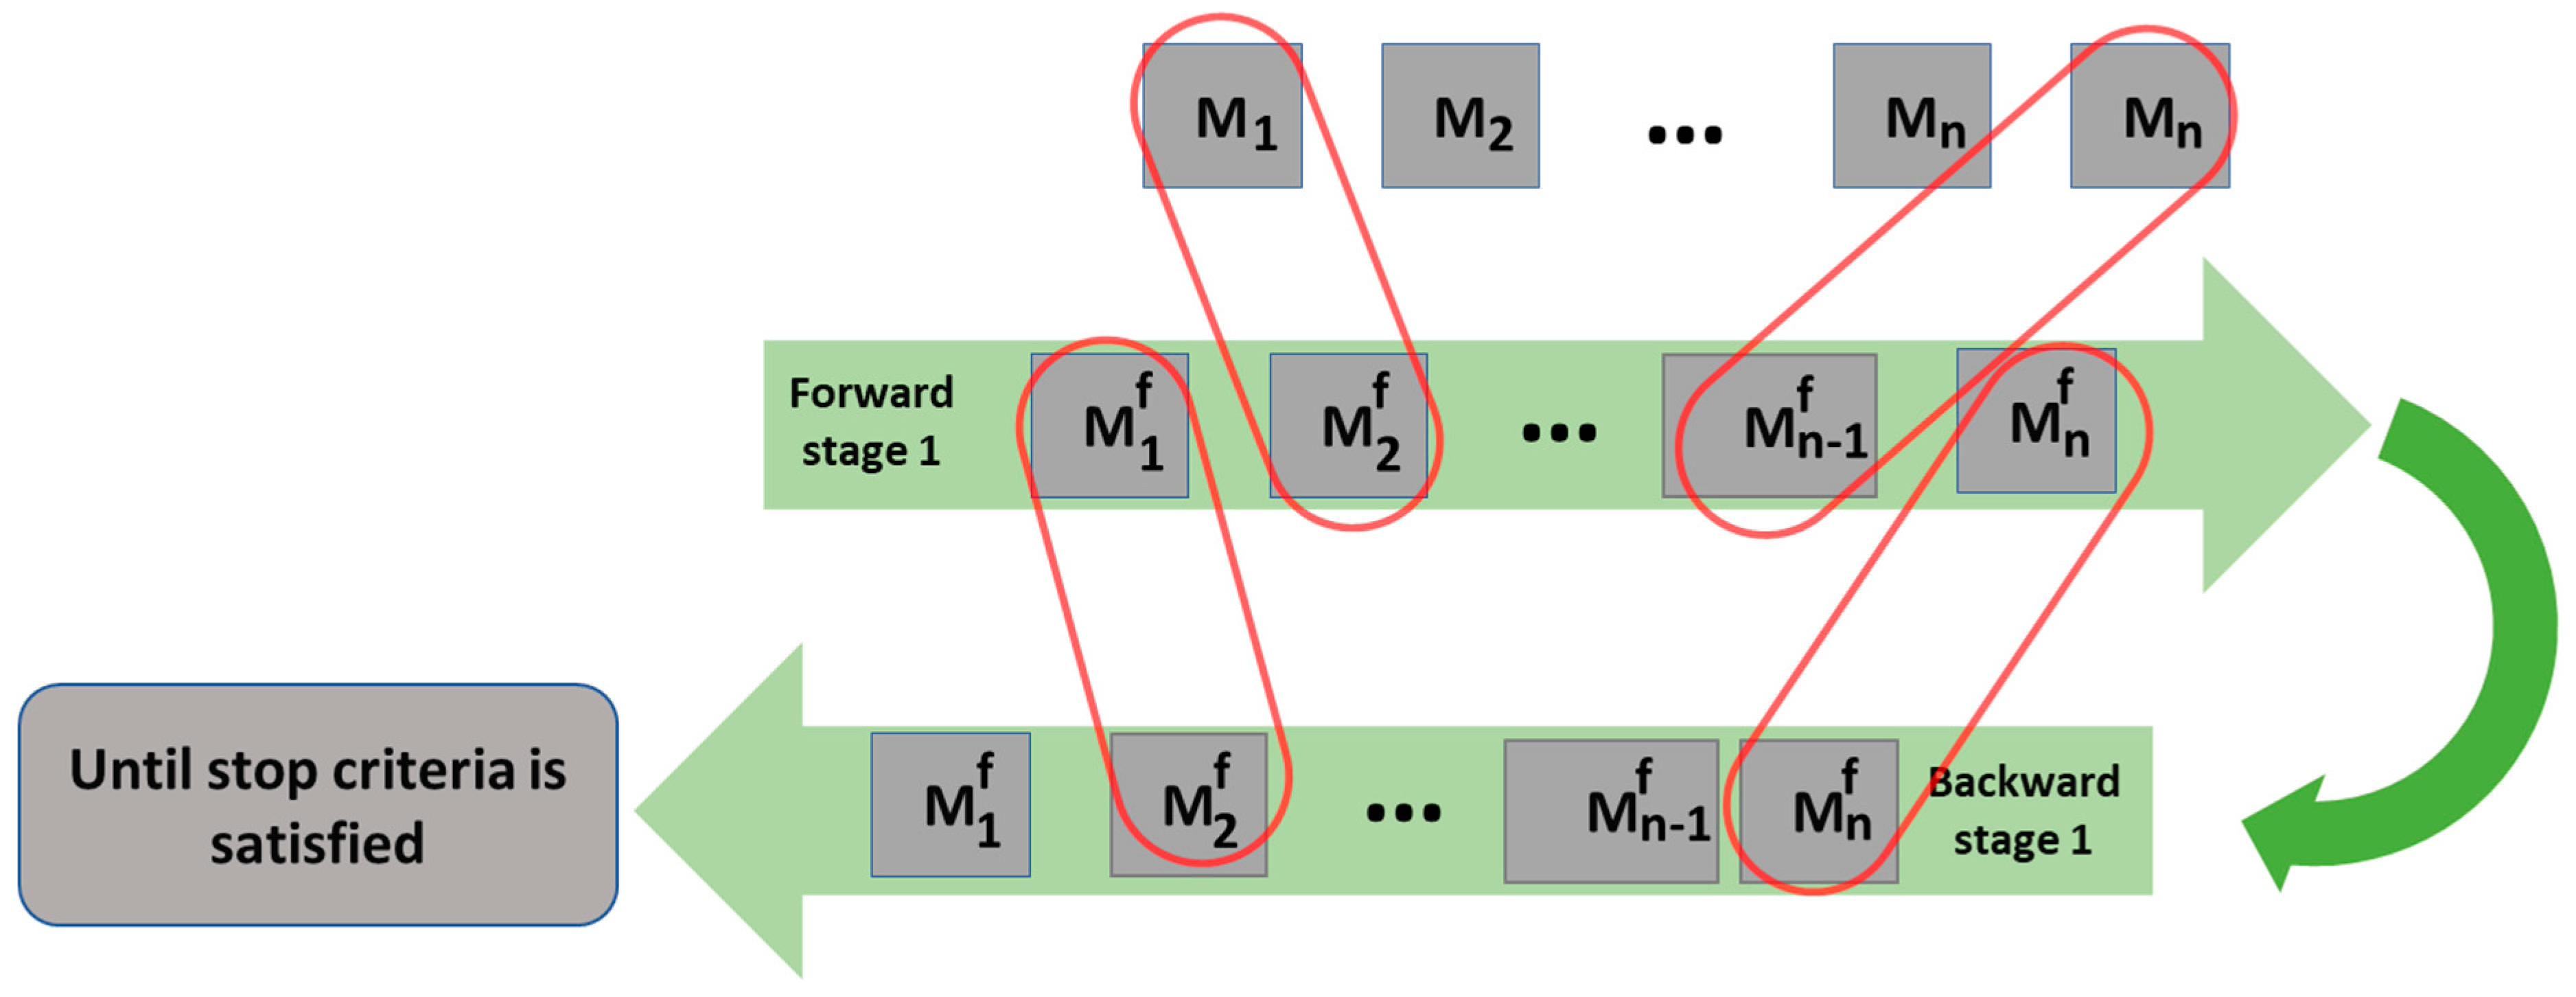
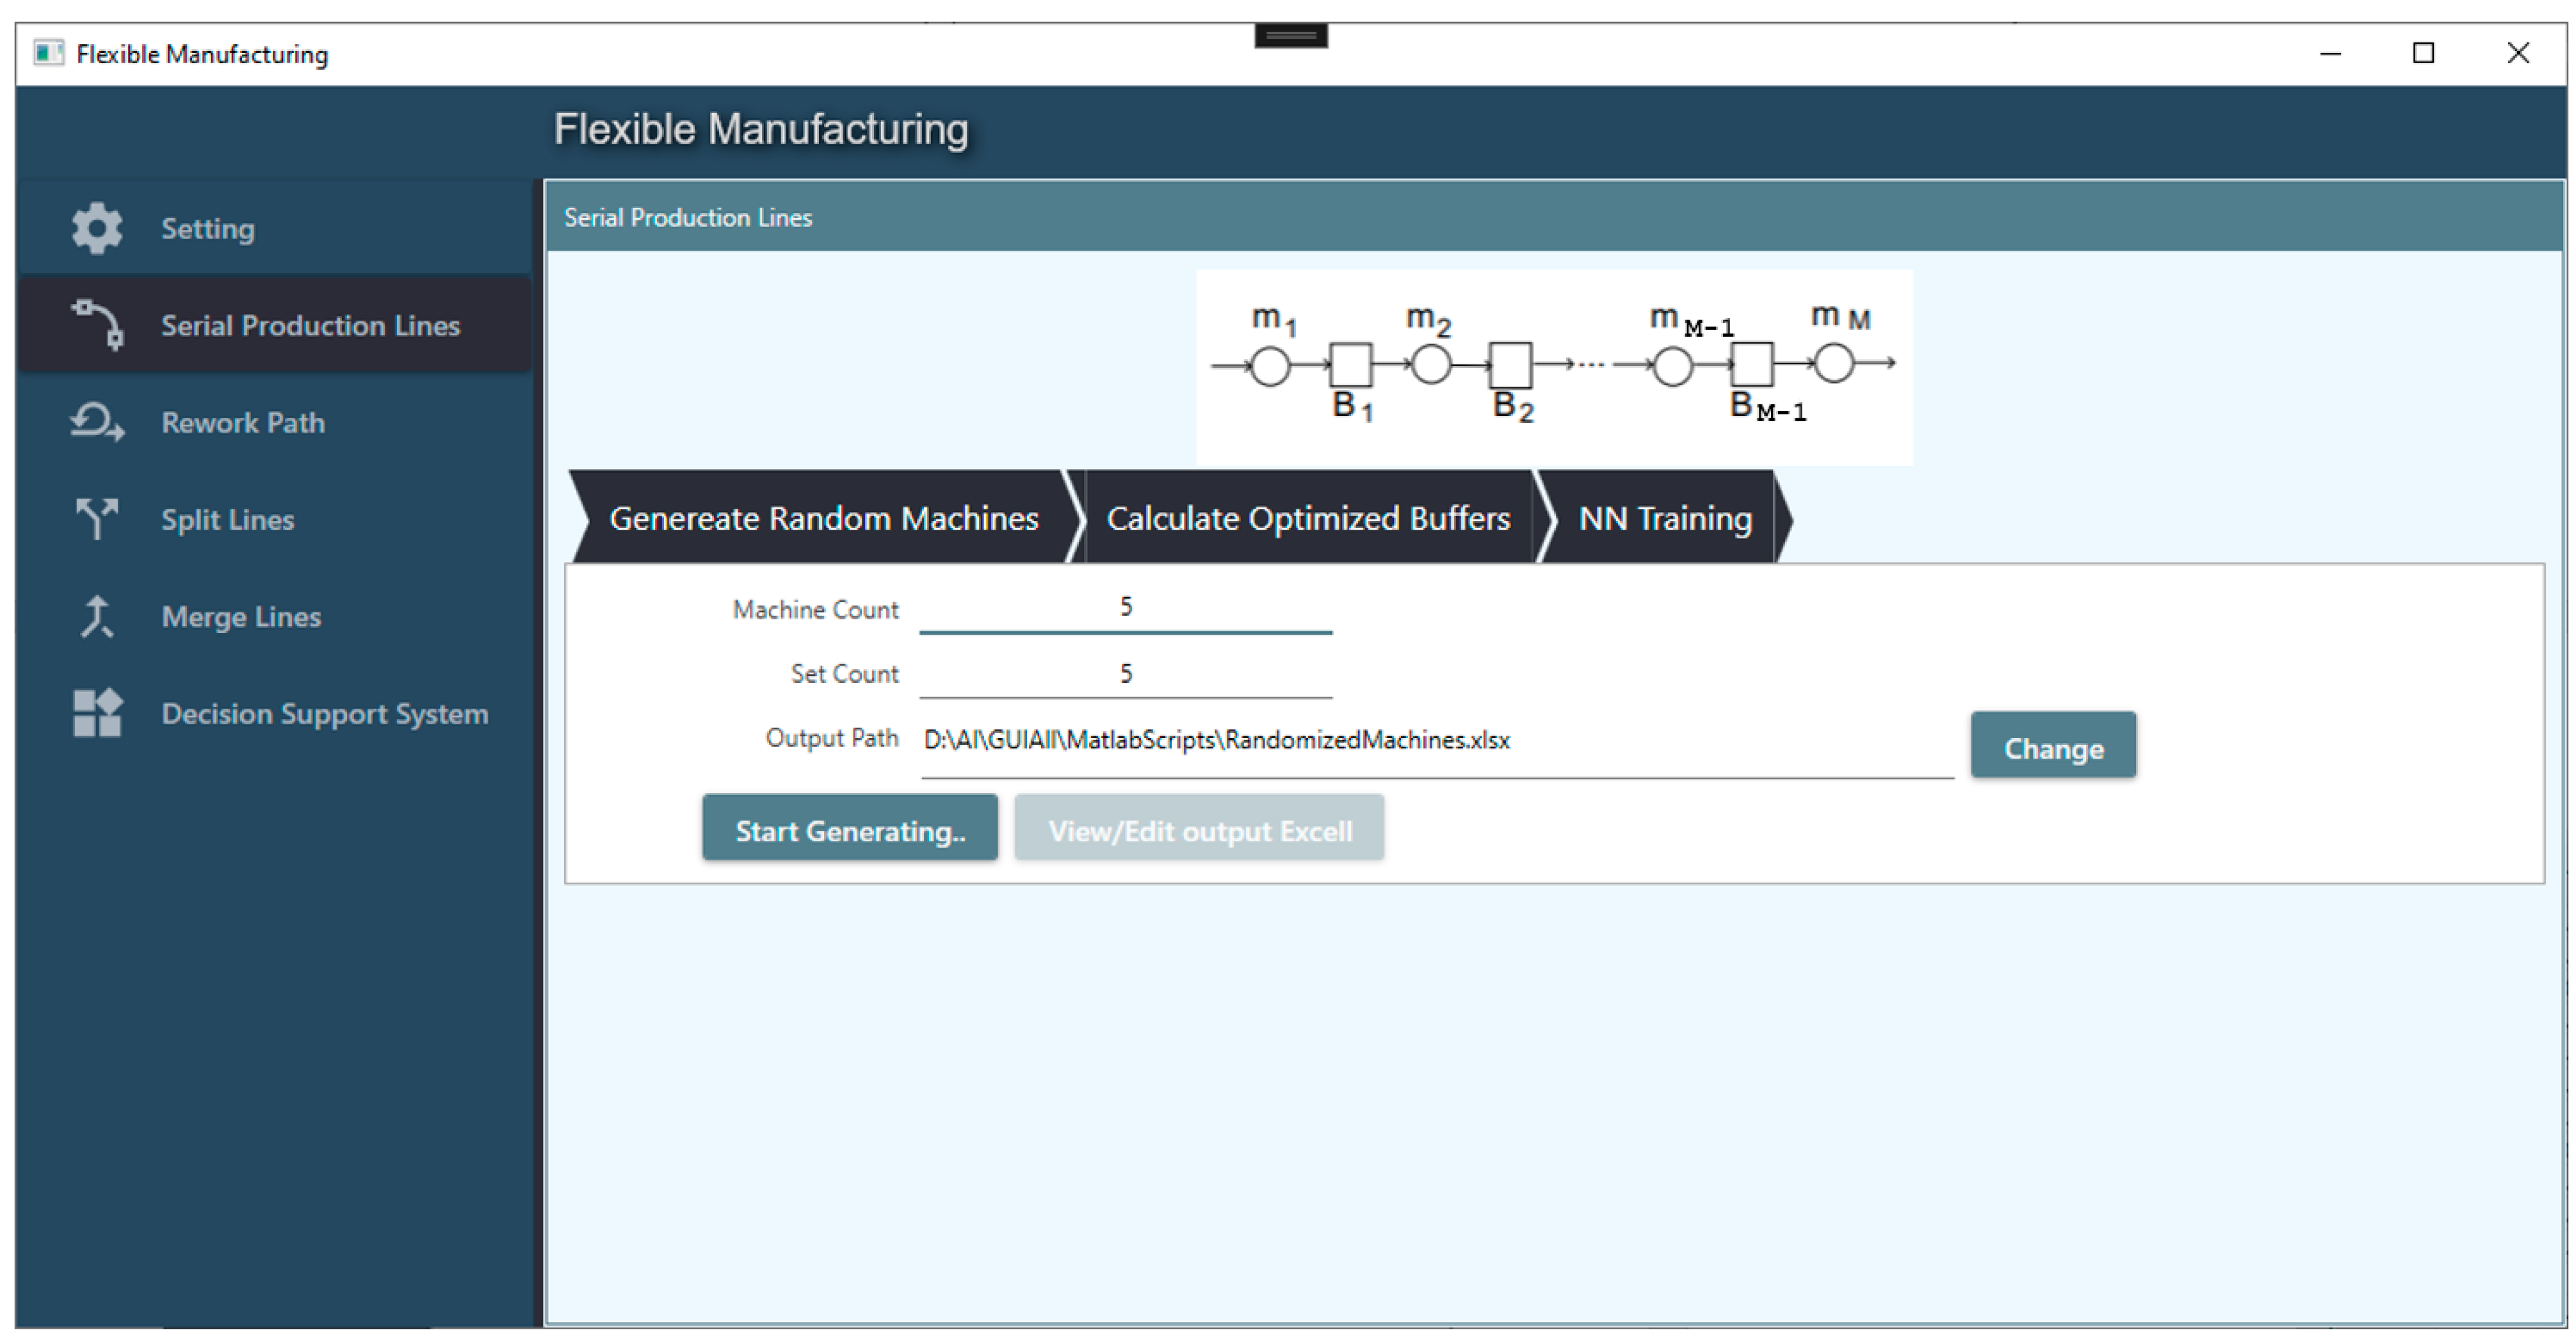
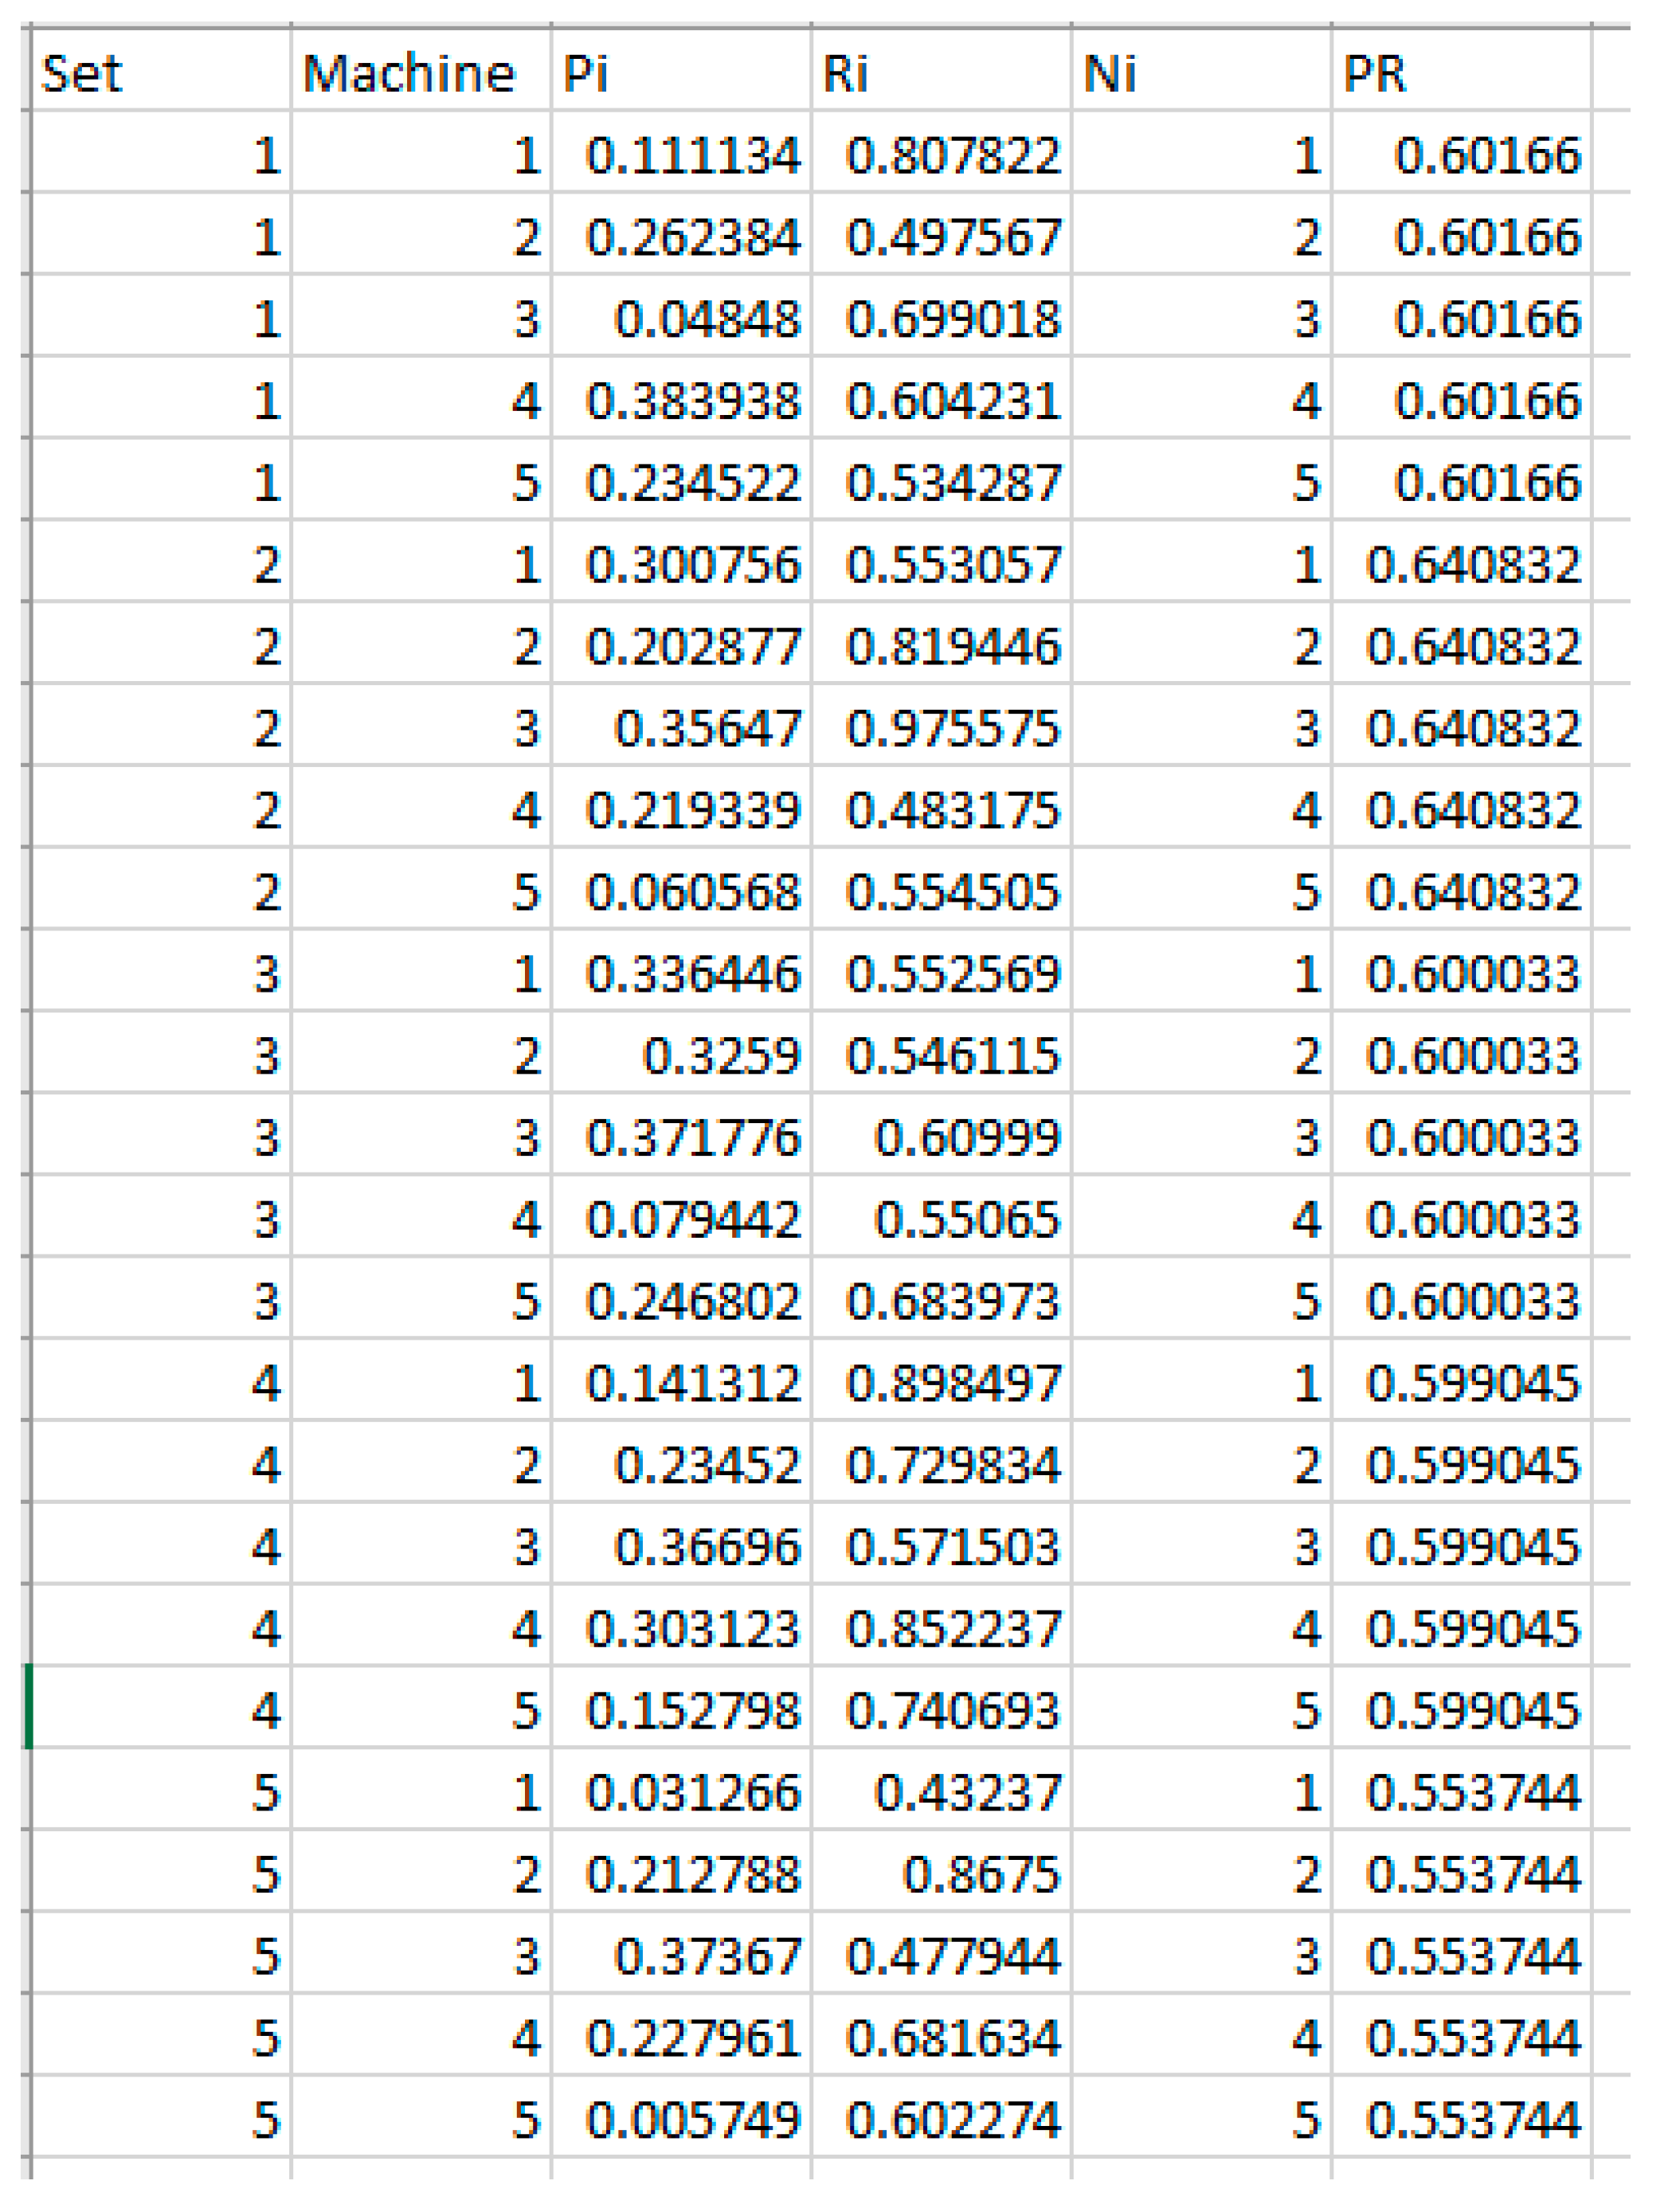
  • The SPL comprises n machine tools (M1, M2, …., Mn) and n − 1 buffers (B1, B2, …., Bn−1). The machine tools are positioned sequentially, see Figure 1, with the corresponding buffers between each successive pair of machine tools.
  • Every machine tool Mi, i = 1, 2, …, n, when in the down state a machine does not produce, when in the up state the machine produces at a rate 1 part per unit time (cycle).
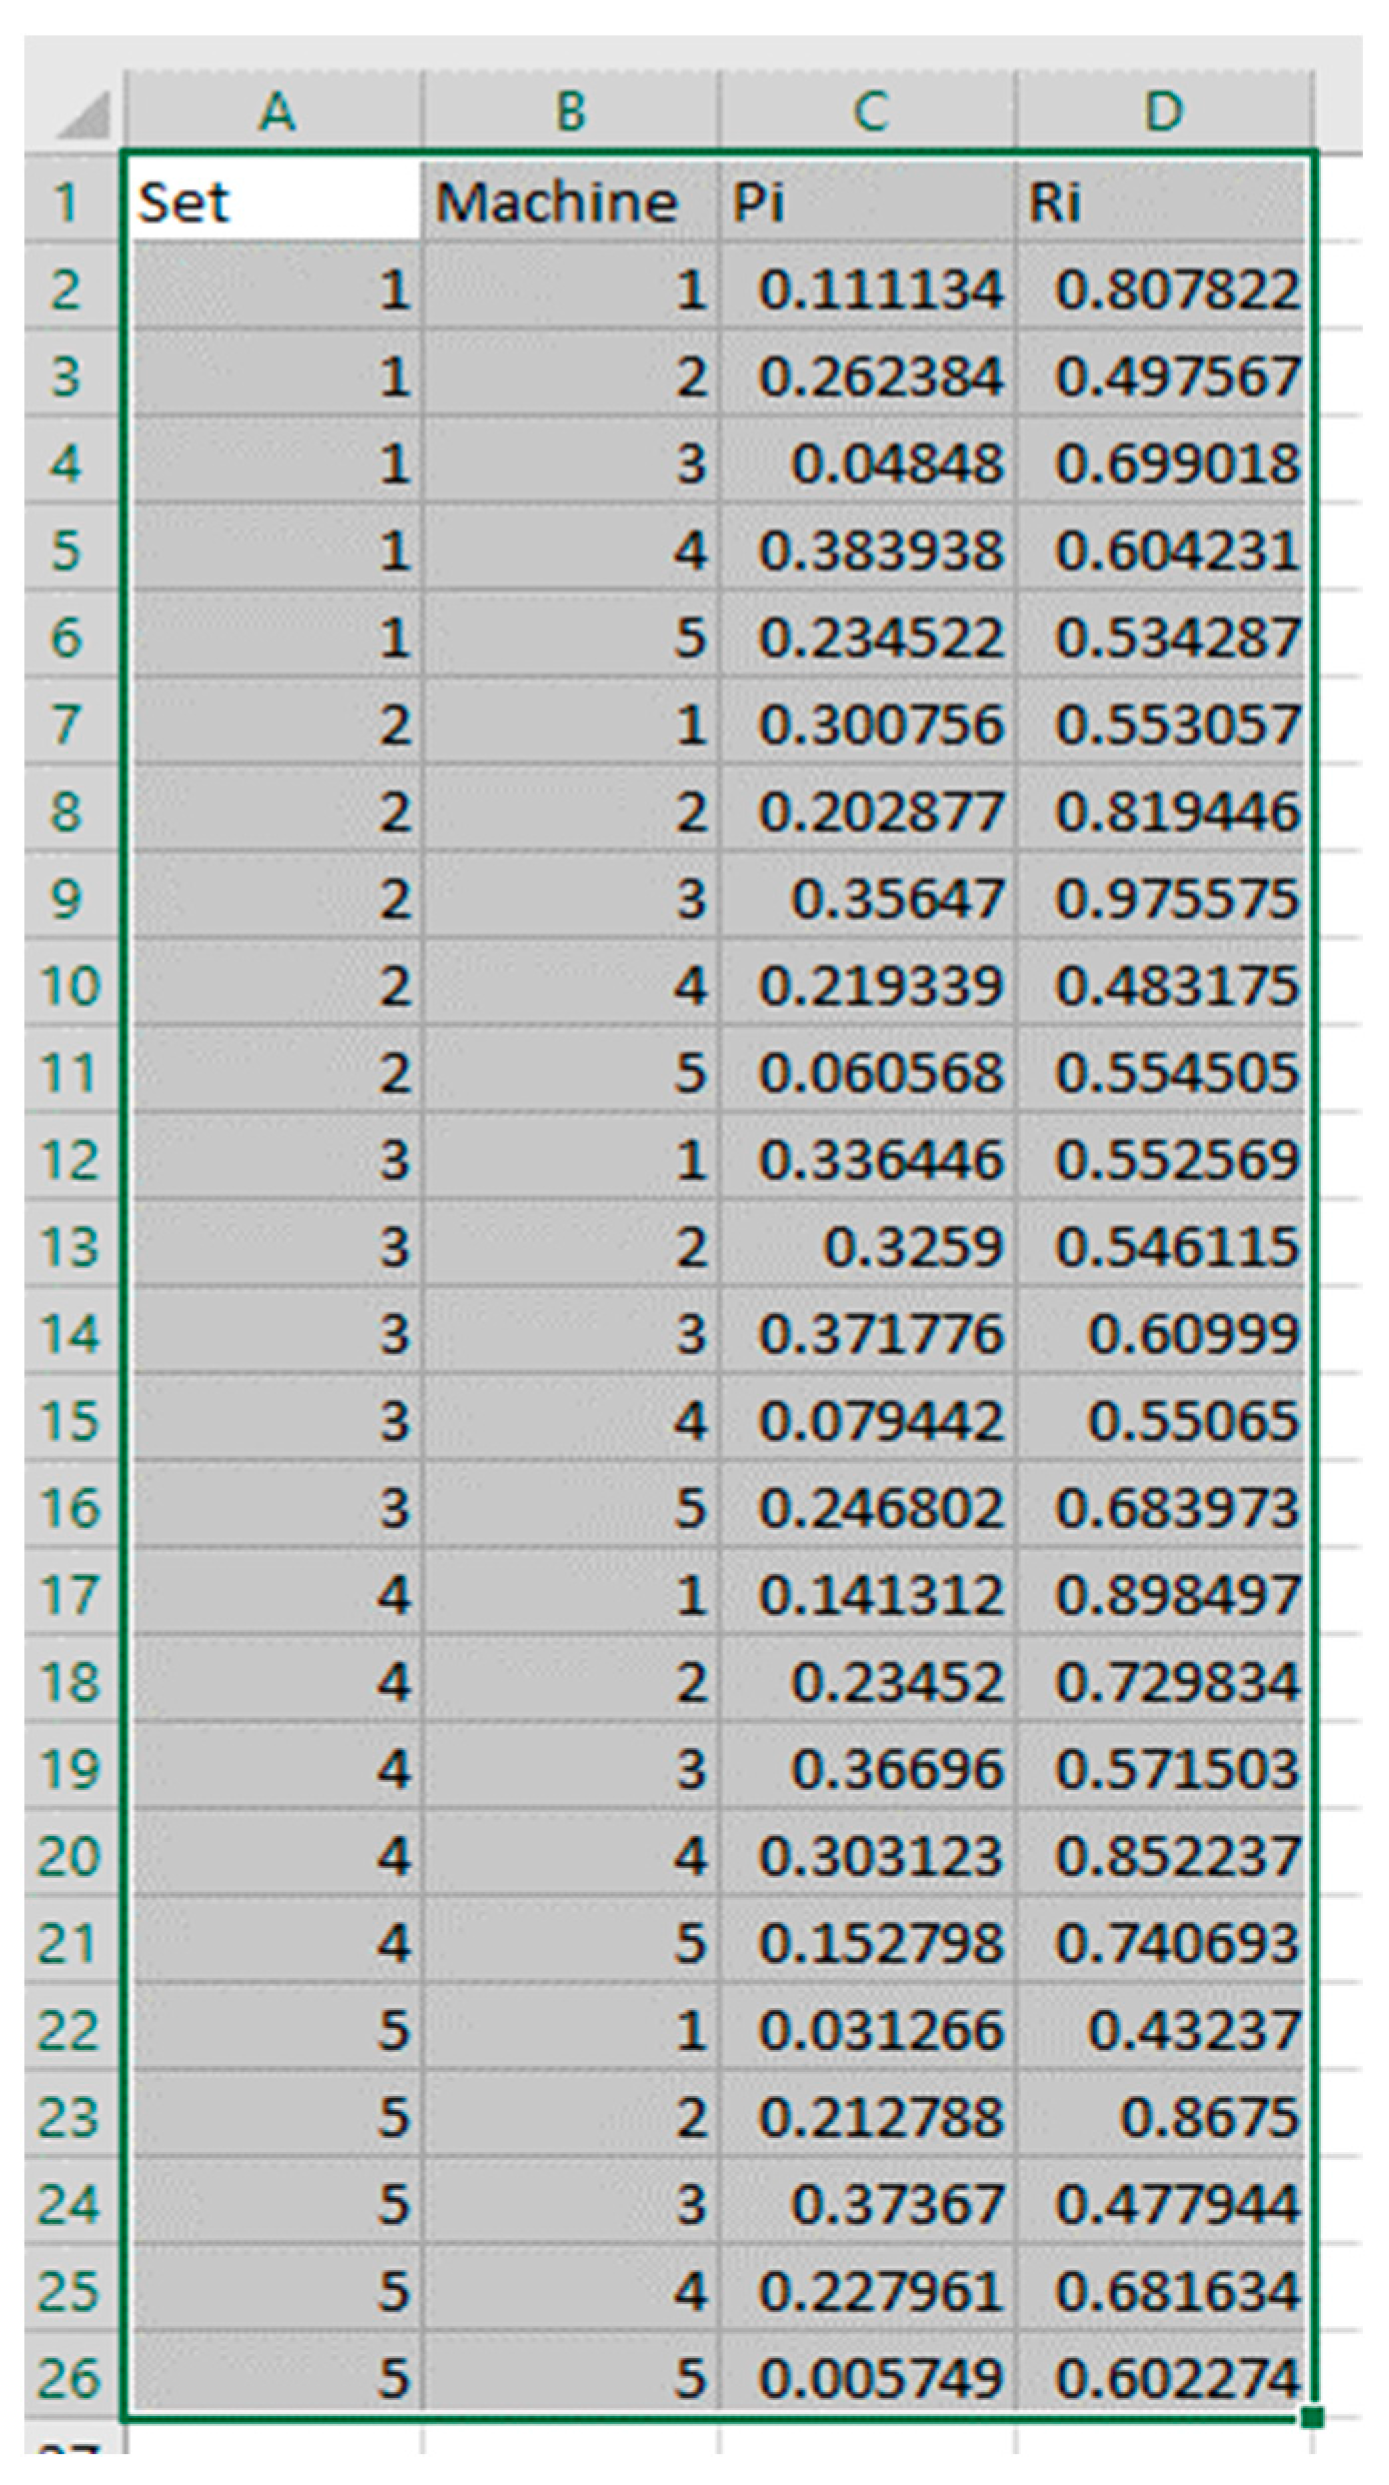
  • Every machine’s down- and uptimes are random variables with an exponential distribution with parameters pi (uptime) and ri (downtime), respectively.
  • Each buffer Bi, i = 1, 2, …, n, is characterized by its capacity, 0 N i < .
  • At time t, if buffer Bi−1 is empty, then machine tool Mi is starved.
  • The first machine M1 is never starved.
  • At time t, if buffer Bi−1 is full then machine tool Mi is blocked.
  • The last machine, Mn, is never blocked.

2.2. Evaluation of Throughput for Serial Production Line

The evaluation of SPLs can be approximated using decomposition and aggregation [29]. Here, we use forward aggregation as proposed in [29,30] to assess the SPL performance at specified buffer sizes and given the up- and downtimes for each and every machine comprising the SPL, in which machines M1 and M2 are combined into one, M 2 f , with up- and downtimes given by:
p 2 f = p 2 + r 2 Q p 1 , r 1 , p 2 , r 2 , N 1
r 2 f = r 2 r 2 Q p 1 , r 1 , p 2 , r 2 , N 1
where Q p 1 , r 1 , p 2 , r 2 , N 1 is the probability that M2 is starved, and specified as [25]:
Q p a , r a , p b , r b , N = 1 e a 1 1 e β N , i f p a r a p b r b p a p a + p b r a + r b p a + r a p a + p b r a + r b + p b r a p a + p b + r a + r b N , i f p a r a = p b r b
And
e i = r i p i + r i , i = a , b , = e a 1 e b e b 1 e a , β = e a p a + p b + r a + r b p a r b p b r a p a + p b r a + r b .
where p a   a n d   r a are the uptime and downtime for machine “a”, respectively.
Next, the forward aggregation proceeds along the production line. The resulting equivalent machine tool, M 2 f defined by p 2 f and r 2 f is combined with M3 to produce M 3 f (defined by p 3 f and r 3 f as given above). The procedure continues until every machine tool is combined into one, M n f (denote as p n f and r n f ). After that, in the backward aggregation, the terminal machine, Mn, is aggregated with M n 1 f to be M n 1 b defined by p n 1 b and r n 1 b and so on until all the machine tools are again aggregated in a single machine, M 1 b defined by p 1 b and r 1 b . The procedure is worked again until the following criteria are achieved.
r n f p n f = r 1 b p 1 b
The procedure is summarized in graphical form in Figure 2, more details about the forward aggregation proceeds can be found in [25].
The process may be presented as [28]:
r i f s + 1 = r i r i Q p i 1 f s + 1 , r i 1 f s + 1 , p i b s + 1 , r i b s + 1 , N i 1 , i = 2 , , n p i f s + 1 = p i + r i Q p i 1 f s + 1 , r i 1 f s + 1 , p i b s + 1 , r i b s + 1 , N i 1 , i = 2 , , n r i b s + 1 = r i r i Q p i + 1 b s + 1 , r i + 1 b s + 1 , p i f s , r i f s , N i , i = 1 , , n 1 p i b s + 1 = p i + r i Q p i + 1 b s + 1 , r i + 1 b s + 1 , p i f s , r i f s , N i , i = 1 , , n 1
Given the initial conditions:
p i f 0 = p i , r i f 0 = r i , i = 2 , , n 1 ,
and the boundary conditions:
p 1 f s = p 1 , r 1 f s = r 1 , p n b s = p n , r n b s = r n , s = 0 , 1 , 2 ,
where Q p a , r a , p b , r b , N is defined in Equation (3).
The approximate production rate for the given SPL is:
P R p 1 , r 1 , , p n , r n , N 1 , , N n 1 = r n f p n f + r n f = r 1 b p 1 b + r 1 b .

3. Flexible Manufacturing Systems: Development of a System of Integrated Agents

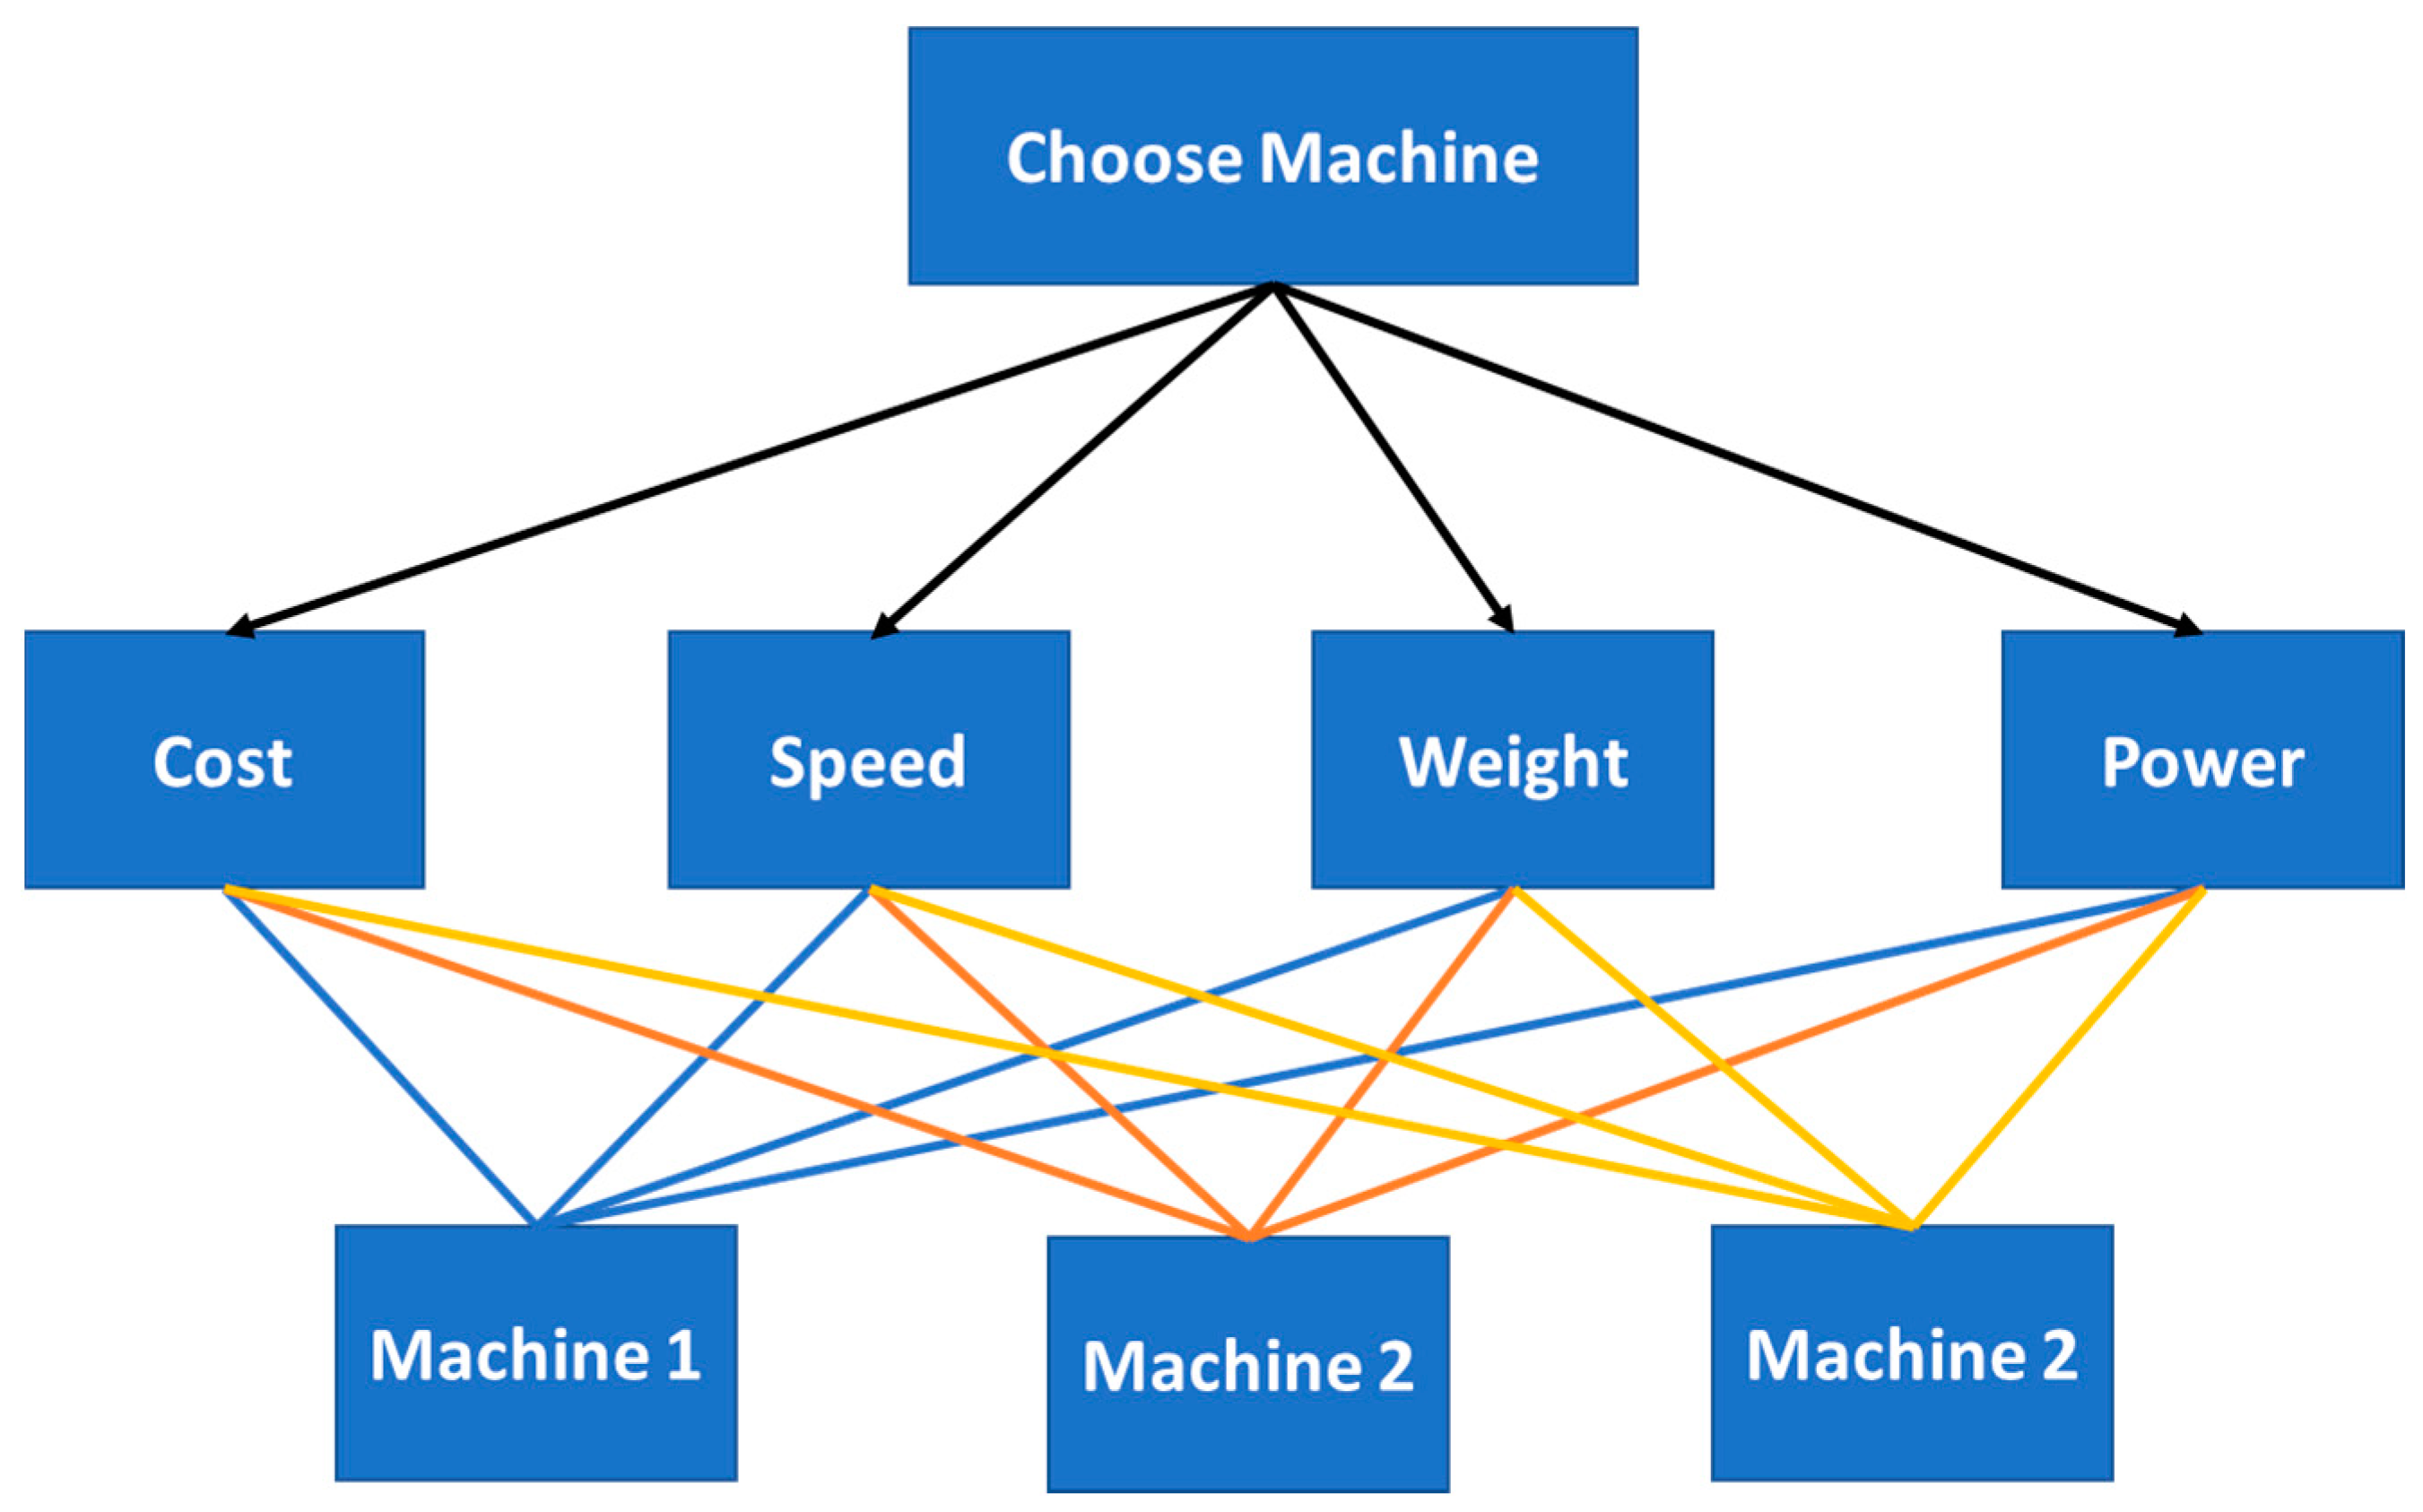
3.1. The Selection of Manufacturing System Components

Different types of production systems and their components are explored at different levels of flexibility as shown in Figure 3.
The components of the production system that will be considered in our study were decided after exploring different types of commonly used production systems in the industry, and these components are shown in Figure 4.
The decision-making system for the selection of SPL components from those commercially available were explored and chosen from those used in previous studies such as multi-attribute utility theory and analytic hierarchy process. In this research, AHP was selected. The decision process for selecting the components is determined according to the requirements of producing palm oil. The commercial evaluation is carried out according to the selection criteria in Table 1. The selection criteria are carried out based on four main categories, each having different requirements. These four main criteria with the corresponding sub-criteria are shown in Table 1.
Table 1 shows the most important criteria employed for SPL machine selection.
In addition to the main criteria mentioned above, some other features, including machine type, maker, cost, etc., could be considered in the components selection system (CSS) when selecting the most appropriate machines.

3.2. Decision Support System for SPLs

The globalization of markets requires rapid changes in product design to remain abreast of consumer demand, and now increasing limitations on resources oblige manufacturers to be more rational in their decision-making. Here, we define a decision as selecting between one or more alternatives. Inappropriate decisions regarding manufacturing can lead directly to increased production costs, which are reflected in increased prices to the consumers. Hence, the selection of the most appropriate machine tools to minimize production costs is essential for product prices that are competitive and profitable.
Machining is used for the manufacture of a wide variety of products because of its flexibility, short lead times, and the quality of products achievable. Thus, a poor decision regarding machine tool selection could result in reduced quality, less flexibility, and lower productivity. Even in those manufacturing procedures where machining is not key, it is used to manufacture tools essential to production, such as molds and dies. When making decisions between alternatives, minimizing doubt and uncertainty enables a more rational choice to be made. The software package proposed by the authors in this report is a fast and accurate algorithm, a robust decision support system for choosing between machine tools.

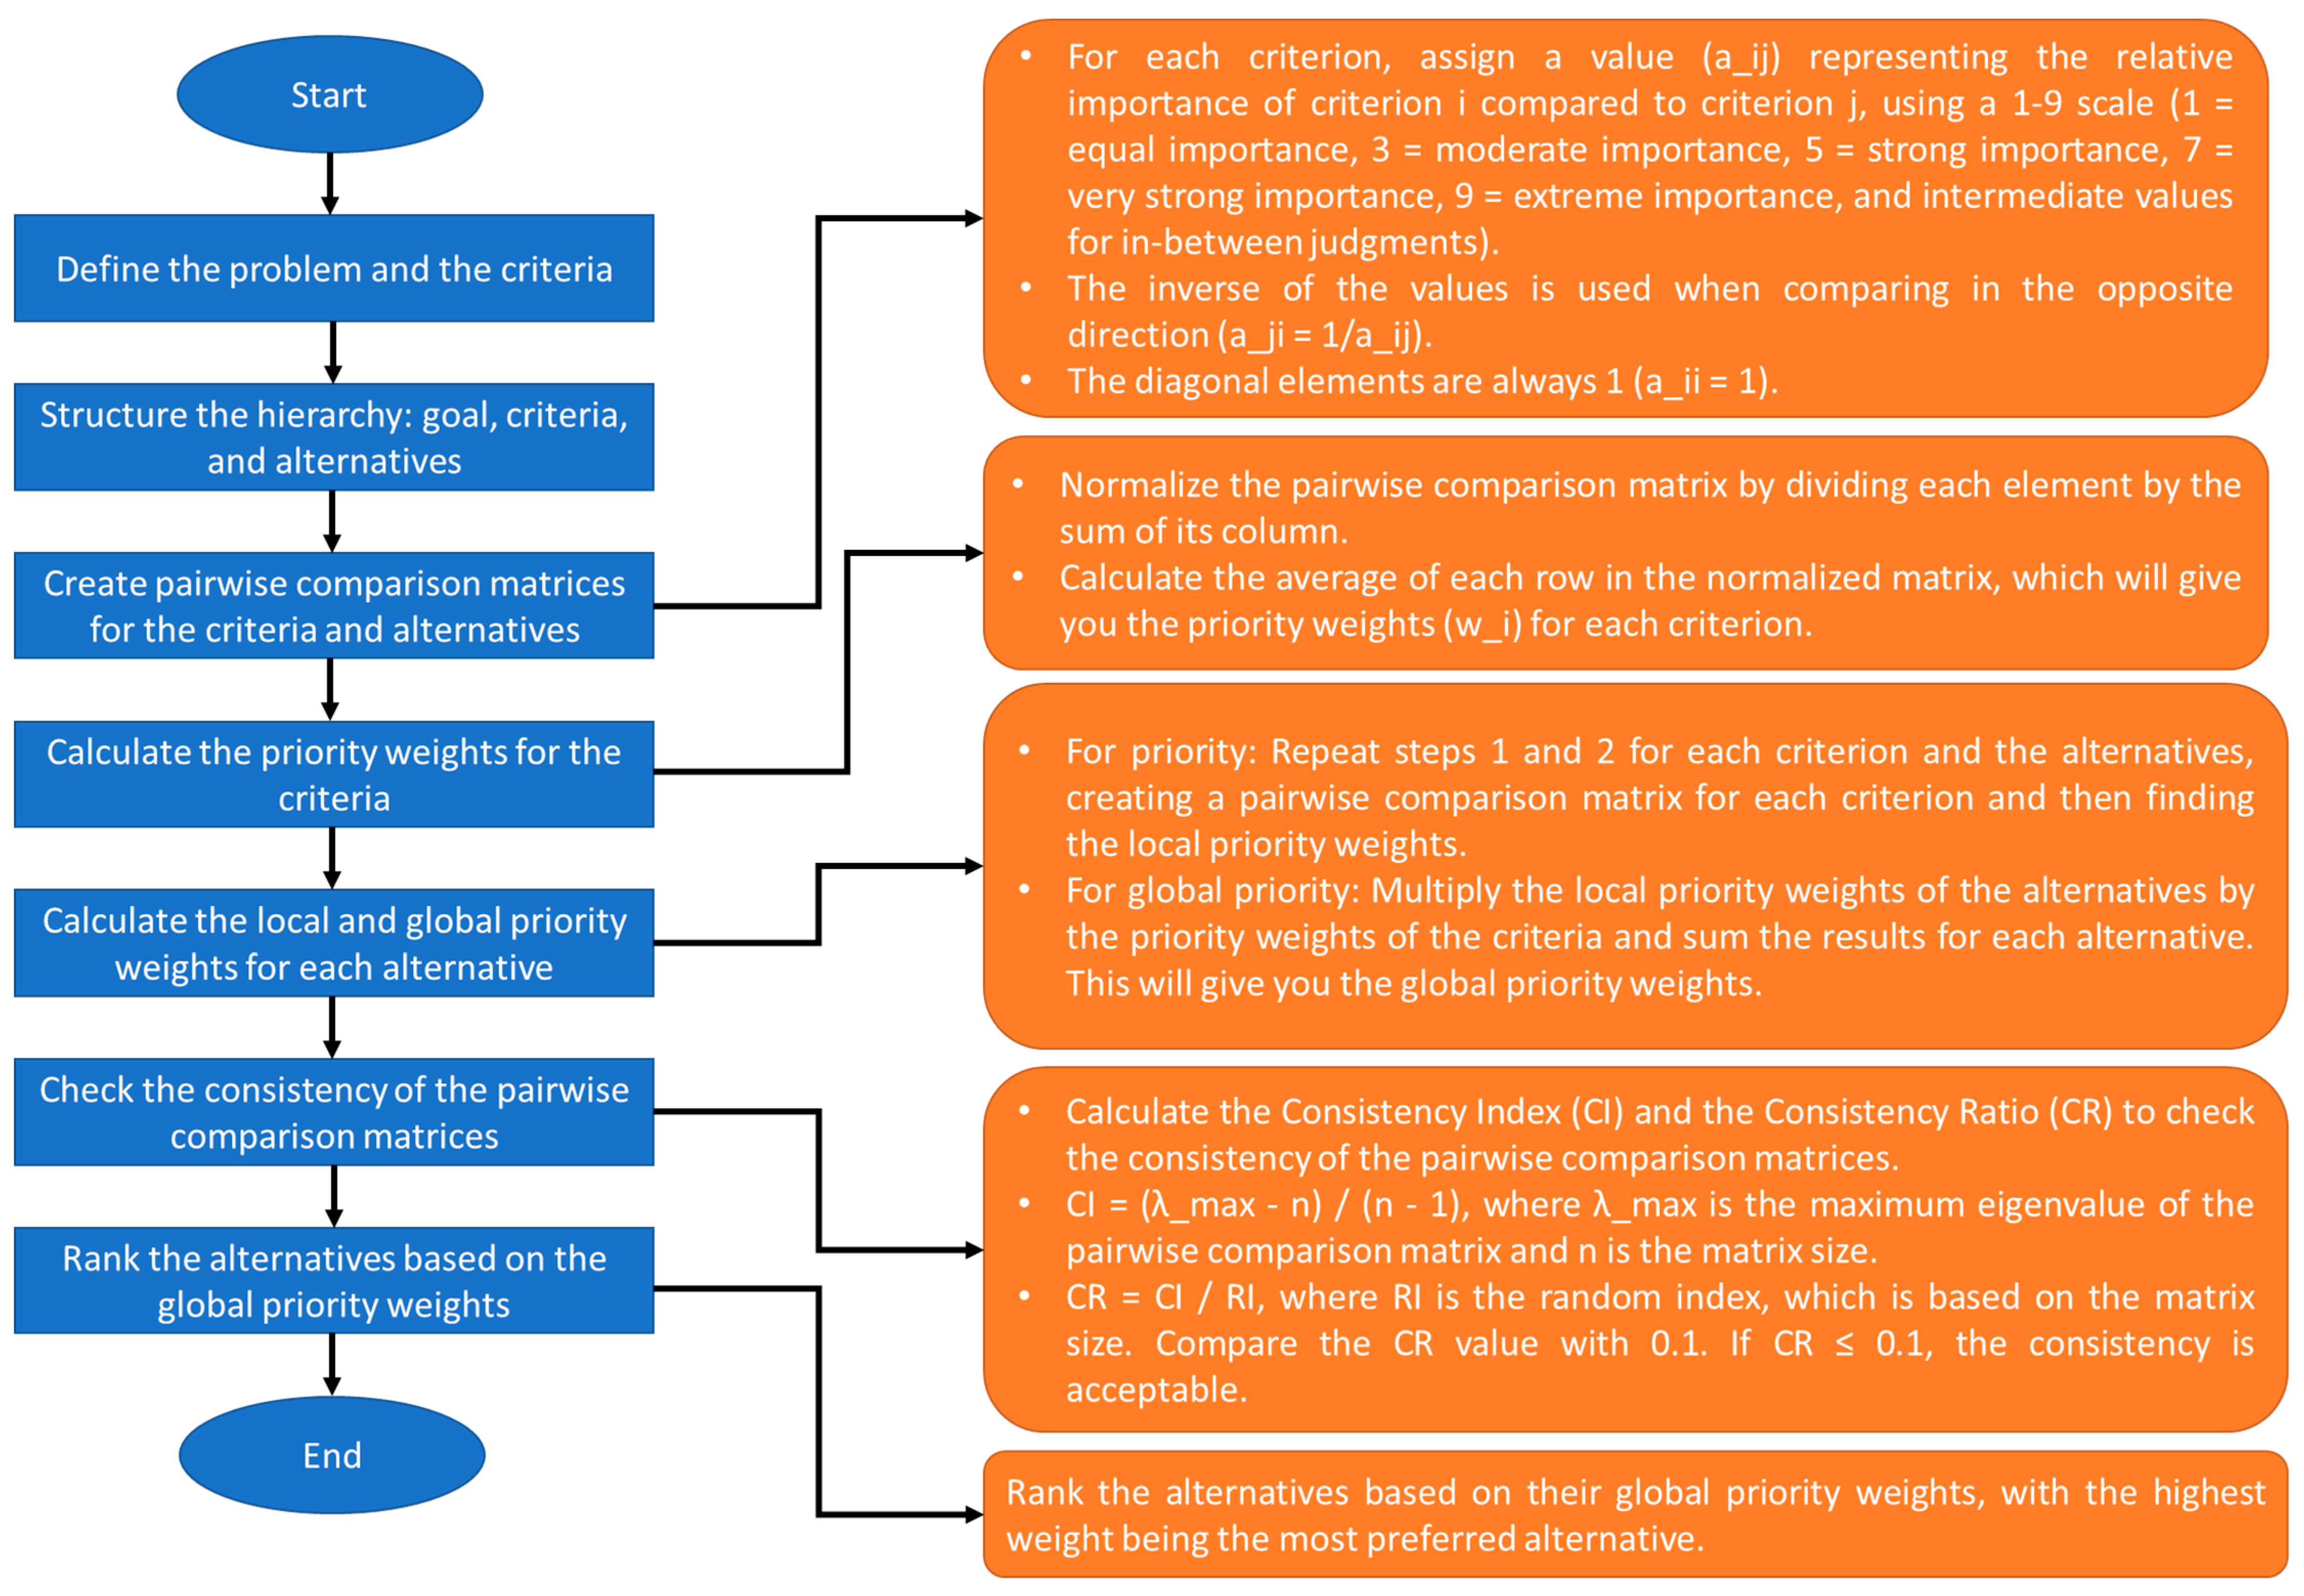
3.3. Problem Criteria and Proposed Solutions

The selection method for the choice of a machine in a production line is both very challenging and very complex due to the many features that must be considered for each machine and the large number of different machines that comprise the required production environment. The software has been developed to optimize the selection between machine tools according to the specifications input by the operator based on AHP, one of the highly effective algorithms in the Decision Support System (DSS), see Figure 5. The software was developed using Python programming language. The authors utilized AHB because it is easy to consider the priorities of factors and it provides a very flexible model architecture for the desired problem. AHB enables the operator to set the criteria weights of every tool in the production line; in addition, AHP offers a very simple and flexible approach [31]. The flexible model helps the operator to update the system according to the constraint changes. However, AHP is a subjective method but it is not a limitation in this paper because the AHP is utilized as a decision support system that will be guided by the operator. The identification of values is very important for the AHP algorithm because it refers to the criteria of selection. In the literature, some studies utilized multi-objective optimization to perform the decision support system, such as a fuzzy multiple-attribute decision-making model, integer programming models, and genetic algorithms (GA). All of these studies were effective but with a limitation on how to be implanted in comparison with the AHP [31].
The workflow of the developed software is shown in Figure 6. The user enters the selection criteria in a comparison style. After that, the software calculates the weights of every feature entered and extracts the suitable machine tools at every step in production. Thus, the user has access to all the machines in the database, but the selection is limited to those tools in the database.
The selection of the most suitable machines and their components is important because it directly affects the product quality, production rate, and product cost. The software algorithm proposed here for selecting a machine via multi-criteria decision-making is a form of AHP algorithm that has four stages, see Figure 7. The first stage systematically decomposes the question into a graded form composed of several integrated dimensions. In the second stage, the decision-maker uses the pairwise comparison of each paired element of the matrices that make up the survey. In the third stage, the consistency is measured to eliminate the inconsistent responses. In the final stage of the decision-making, the relative weights appropriate for the criteria appropriate for a given set of scenarios are scored, and the decision-maker determines a total score.
The values and weights required for the AHP method are derived from the following steps, which involve subjective judgments from the decision-makers in the pairwise comparisons and the subsequent calculations to obtain the priority vectors. These priority vectors represent the weights used to rank the alternatives in the decision-making process.
First are pairwise comparisons, which are made pairwise for each criterion or alternative. These comparisons are typically made by decision-makers who assess the relative importance of one criterion or alternative over the other. This assessment can be carried out using a scale varying between one and nine in which one means equal importance, and nine refers to maximum importance. Second is the comparison matrix, based on the pairwise comparisons, which creates a square matrix for each set of comparisons (i.e., one matrix for each level in the hierarchy). The matrix dimensions are determined by the number of criteria or alternatives being compared. If COST is more important than SPEED and the comparison value is x, the matrix entry for COST vs. SPEED will be x, and the matrix entry for SPEED vs. COST will be 1/x. The components of the matrix are always 1 since they represent the comparison of an element with itself. Third is the calculation of priority vectors: for every comparison matrix, the algorithm has to compute the priority vector, which is an eigenvector corresponding to the largest eigenvalue. The priority vector represents the relative weights or priorities of the elements being compared. To calculate the eigenvector, the logarithmic least squares method was utilized. After that, the normalization of the priority vector is crucial so the sum of its elements has to be one. These priority vectors represent the local weights for each element in the hierarchy. Fourth is the calculation of the consistency ratio, which is carried out by calculating the consistency index (CI) then the consistency ratio (CR). The CI is calculated as (λ_max − n)/(n − 1), where λ_max is the largest eigenvalue and n is the matrix size. To calculate the CR, divide the CI by the average random consistency index (RI) for a matrix of the same size. A CR value of 0.1 or less is generally considered acceptable, indicating that the comparisons are consistent. Finally, there is the aggregation of the priority vectors in order to obtain the global priority vector for the alternatives, the algorithm aggregated the local priority vectors from all levels of the hierarchy. This is carried out by multiplying the local priority vector of each alternative with the corresponding local priority vector of the criteria and sub-criteria (if any), and then summing the results. Finally, normalize the aggregated priority vector so that the sum of its elements is one.

3.4. Economical Aspects of Proposed SPL

In addition to the flexibility and productivity of the designed system, companies need to consider the initial and the operational costs for the designed production system [32]. Accordingly, the manufacturing system planning has to follow a systematic approach entailing a sequence of careful decisions for successful business design and implementation [30]. This study considers the cost of the machines in the production line as one of the criteria to select the machine tool as shown in Figure 5. Maximizing the cost of the production line components such as machine tools will minimize the cost of entire production line.

3.5. Optimization Model

In this research, GA is utilized to obtain the optimal or near-optimal buffer size. GA is one of the well-known meta-heuristic optimization methods, which finds the optimal or near-optimal solution based on natural selection and genetics principles. GA begins with an initial population, including arbitrarily selected solutions known as individuals. After determining the fitness of all individuals in the initial population, the next population can be generated by applying GA operations. These procedures are reiterated to achieve the optimal solution of the problem. The results of the highest fitness will take the role of the candidate solution to the processing problem. It is important to identify the structure of an individual and encode the individual’s elements. In this research, the individual is defined as a vector with n − 1 elements, where n is the number of machine tools in an SPL. Each of these elements denotes one buffer. The GA optimization procedure is illustrated in Figure 8 and further theoretical explanation can be found in [28].

4. Results and Discussion

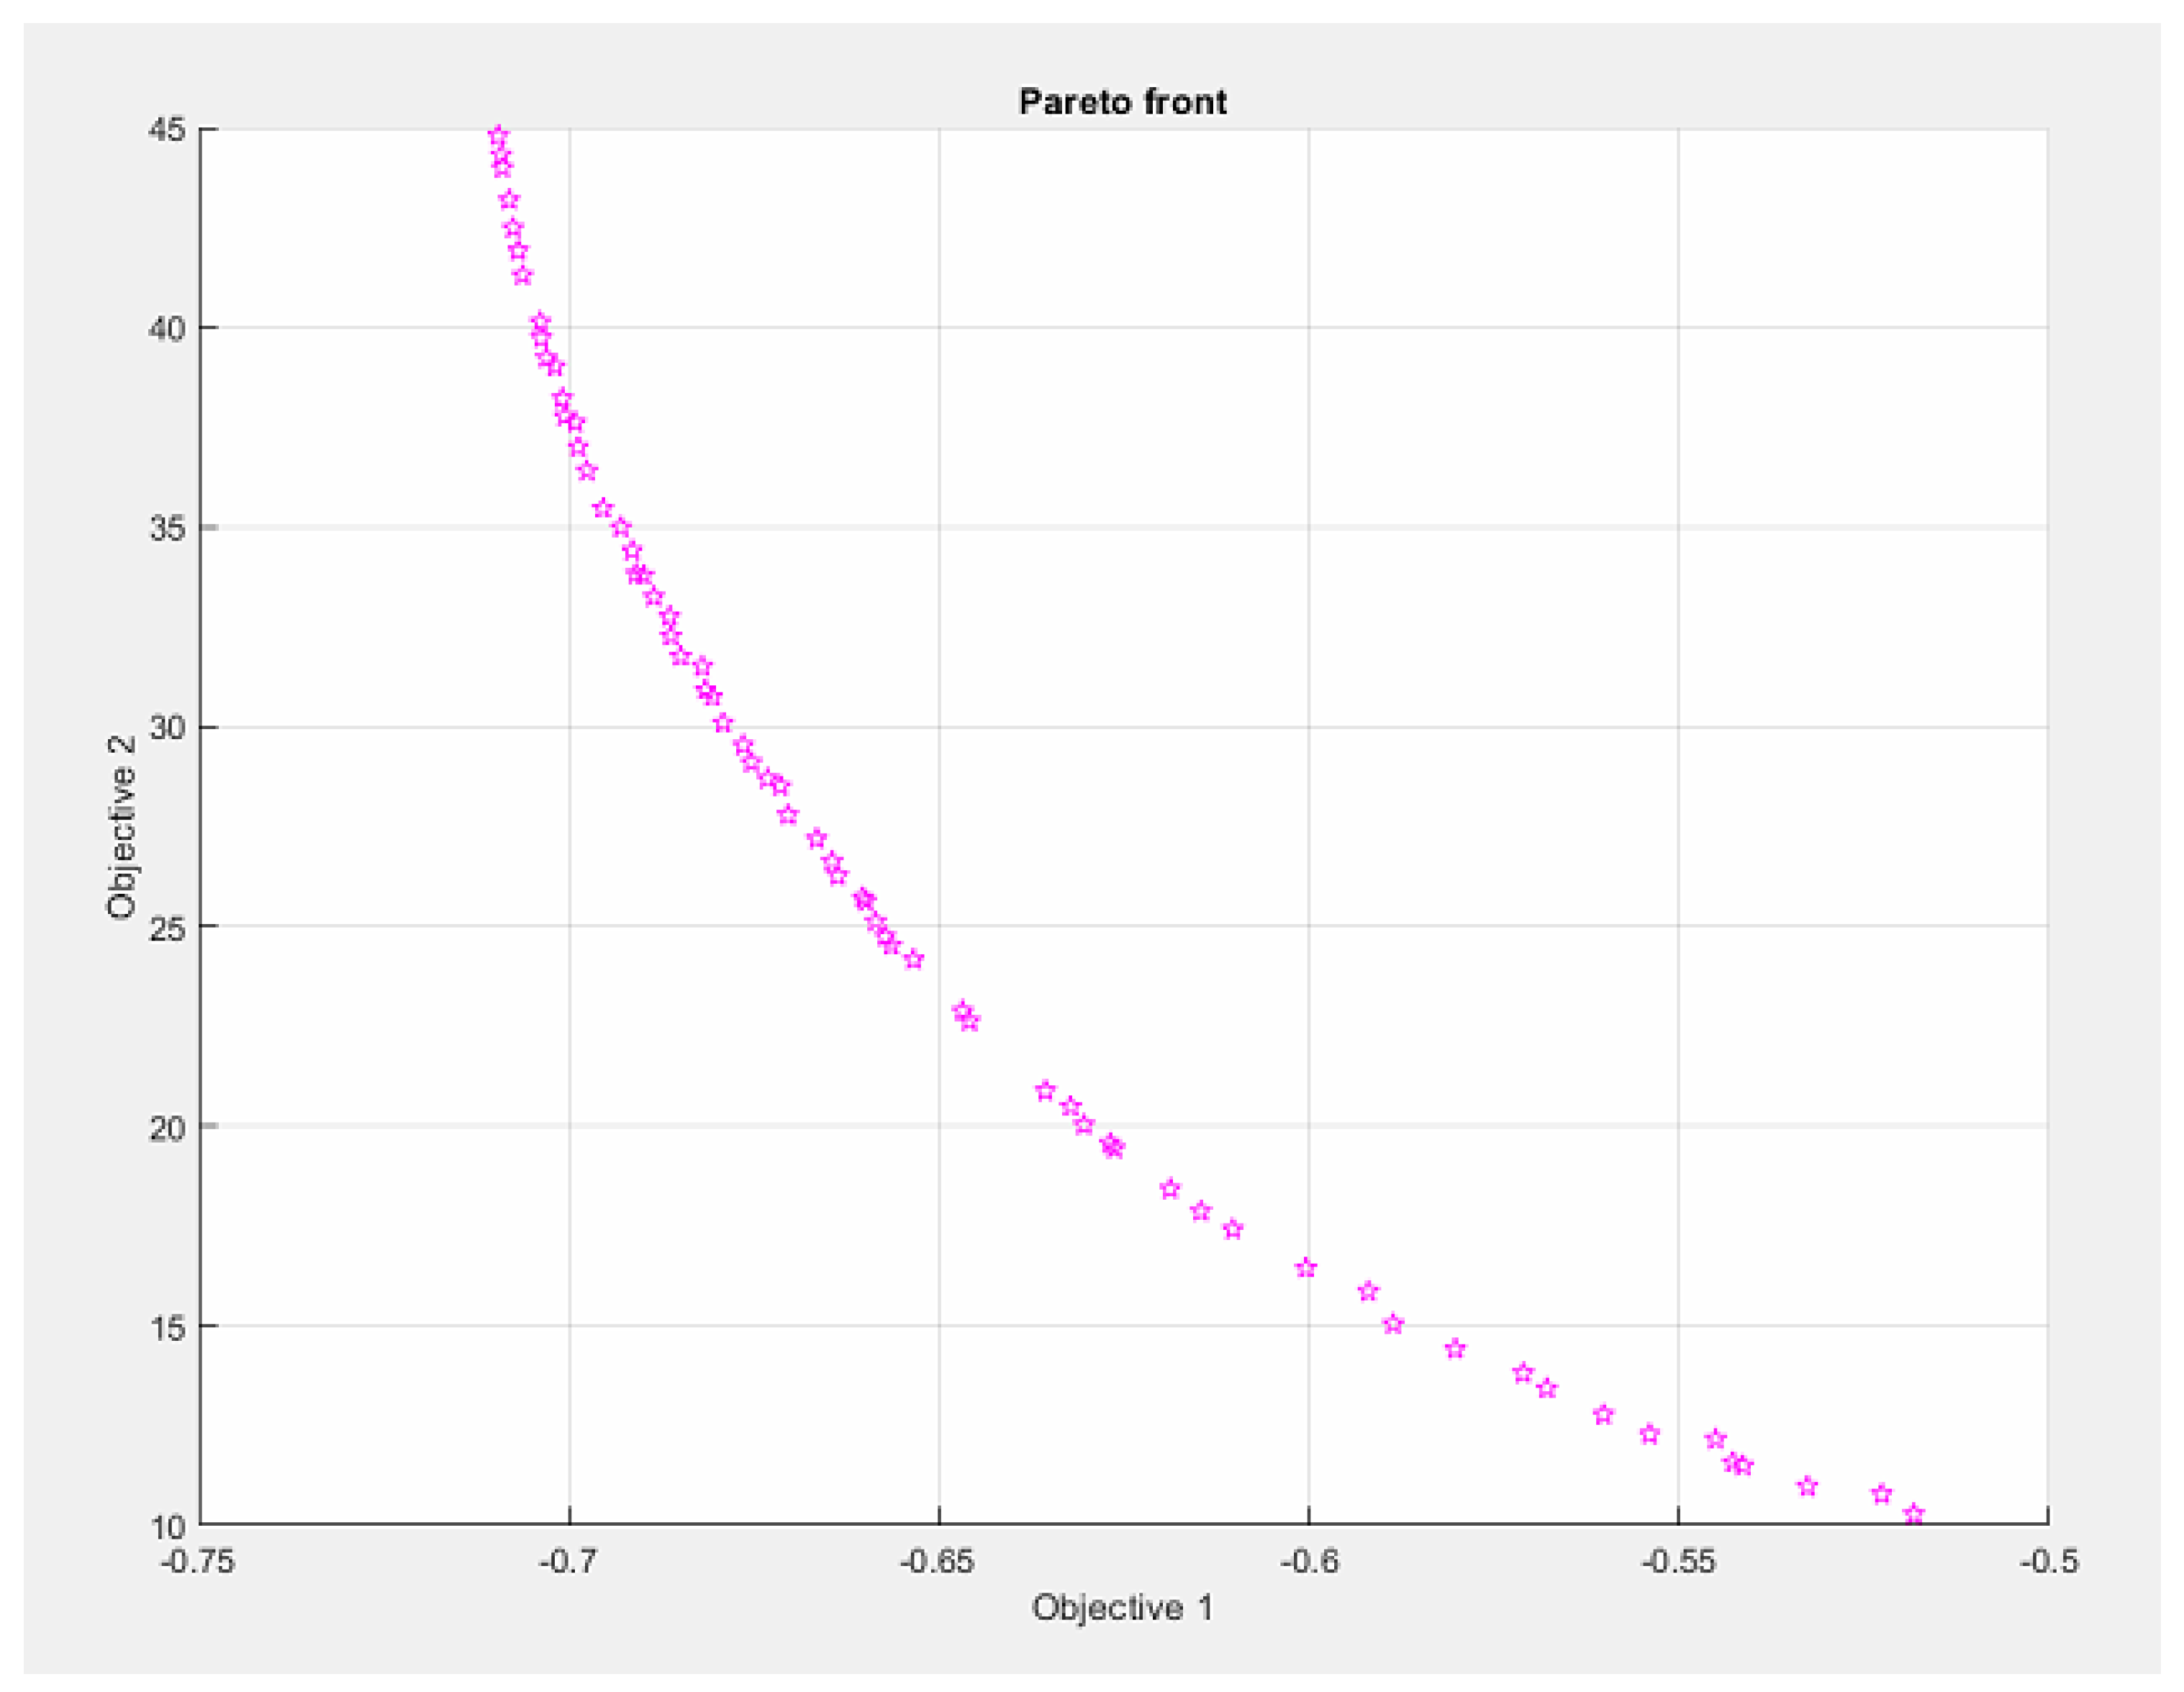
4.1. Numerical Applications of Optimization Model: Production Line of 11 Machine Tools

In this section, the proposed optimization model is utilized to optimize the buffer size for a production line with 11 machine tools, with the uptimes and downtimes parameters listed in Table 2. The maximum buffer capacity that is to be used in each bay of each machine tools is 5.
The proposed optimization model identifies several sets of optimal buffers corresponding to numerous sets of uptime and downtime parameters. The GA parameters are selected in this way; 100 individuals as the population size and the crossover rate and the mutation are 0.8 and 0.05, respectively. Figure 9 shows the fitness curve for the proposed GA optimization algorithm, applied to maximize the productivity and minimize the buffer size.
The optimal buffer sizes of the SPL at a desired uptime and downtime setting are listed in Table 3. The results of the proposed algorithm for estimating the optimal buffer sizes for serial production line of 11 machines was compared with what was reported in the literature [33] under the same conditions of uptime and downtime parameters. Observing the comparison between the results of the proposed model and the results of [33] under the same setting, it is not so difficult to see that the proposed method successfully optimized the buffer sizes that results in a higher throughput of the SPL (Productivity = 0.695) when compared with the results reported in [33] (Productivity = 0.6266), under the same set of uptime and downtime parameters.

4.2. Practical Industrial Use Case

The most basic production line is the SPL, and it is the basis for other production line types. With the SPL it is easy to estimate its productivity rate, knowing the parameters pi and ri for each machine and Ni for the buffers between consecutive machines. We can then optimize the production line by running a GA solver using MATLAB to test a cloud of values to find the optimum, but we not only want to maximize SPL productivity, we also want the minimum buffer space necessary to accomplish that. Therefore, we run a multi-objective GA that seeks the lowest buffer values to achieve the greatest productivity.
The number of buffers is one less than the number of machines; see Figure 10.
The previous procedure can find the optimal values for a certain line, but it can take some time for the optimization process to finish. To enhance the efficiency of the solution, we will train a Neural Network to solve this problem faster. However, training a Neural Network requires a significant amount of data to begin with; thus, we start with randomizing a set of production lines with variant machine parameters. Then, by running optimization on them, we will obtain the optimal buffer distributions and train the Neural Network using these data, as in Figure 11, which shows the three steps for processing SPLs.
The software can be easily adapted to different types of production lines, such as those not currently covered. As our first example, we will demonstrate working with an SPL; first, we generate a random machine set from the first page of the application and input the Machine count and set count. Then we press “Start Generating”, and the software saves the data in an Excel format to be available for the user to manually edit if necessary. After generating the file, the interface will enable the button to open the file for editing; the results are shown in Figure 12.
After revising the randomized sets of data, we move on to the next step for calculating the optimized buffers, after entering the maximum buffer range available for Ni, we press the “Start Optimizing” button as shown in Figure 13.
After pressing the “start optimization” button, the MATLAB runtime loads, and the GA solver shows the results on the screen in real-time, see Figure 14.
The results are filtered. The multi-objective GA gives 70 results for each set, and the selection is made according to the maximum productivity with the least amount of buffer, and the results are then saved to an Excel file as shown in Figure 15, and the training of the ANN is shown in Figure 16. The study shows a significant reduction in the buffer size and, as a result, the production line cost.
The Graphical User Interface for the decision support system requires the user to input 5 balanced parameters with a total of 100 for each of the parameters. However, the interface does not permit the user to start with invalid parameter values and guides the user to enter the right values, as shown in Figure 17. If the user enters values higher than 100, the start button is disabled.
Whenever the user enters the values, the interface allows the calculations to commence, and when finished, the application presents the results visually, as shown in Figure 18.

5. Conclusions

A SIGN has been designed and successfully implemented in this research work to optimize SPLs. The SIGN presented here integrates AI with simulation to select the buffer size, machine tools, and robots. A GUI has been developed, which enables a user to input the relevant parameters, settings, and optimization and decision-making techniques, which are then processed with the results presented.
Numerical tests were used to verify the accuracy of the SIGN proposed here. The research presented here may be extended to different designs of manufacturing systems with the following possible benefits:
  • Maximizing the efficiency and minimizing the cost of new manufacturing systems.
  • Reducing the initial cost of a new manufacturing system.
  • Providing support for production engineers determining buffer sizes.
  • Providing support for production engineers determining the components of a new manufacturing system.
  • Providing support for production engineers designing SPLs.
  • The major objectives achieved in this study are:
  • Determination of the optimal buffer sizes in SPLs.
  • Optimal selection of the manufacturing system components.
  • Development of a database for SPL components with their characteristics.
  • The design, development, and evaluation of a means of simulating a manufacturing system.
  • Development of an integrated framework for optimizing the buffer sizes and component selection.
  • Designing, developing, and evaluating a decision support system to assist in the design of manufacturing systems.

Author Contributions

Conceptualization, H.A., U.U., M.H.A. and A.E.; methodology, H.A., U.U., M.H.A. and A.E.; software, H.A., M.H.A. and A.E.; formal analysis, A.E. and H.A.; investigation, A.E. and H.A.; resources, H.A., M.H.A. and U.U.; writing—original draft preparation, A.E. and M.H.A.; writing—review and editing, A.E., H.A., M.H.A. and U.U.; project administration, H.A. funding acquisition, H.A. All authors have read and agreed to the published version of the manuscript.

Funding

This work was funded by the National Plan for Science, Technology, and Innovation (MAARIFAH), King Abdulaziz City for Science and Technology, Saudi Arabia, under Award 13-INF1155-02.

Data Availability Statement

All the data is available in the manuscript.

Acknowledgments

This work was supported by the National Plan for Science, Technology, and Innovation (MAARIFAH), King Abdulaziz City for Science and Technology, Saudi Arabia, under Award 13-INF1155-02.

Conflicts of Interest

The authors declare no conflict of interest.

Abbreviations

SPLSerial Production Lines
M1-MnMachine Tools
B1-BnBuffers
p i Uptime
r i Downtime
QProbability
NNumber of buffers in the main production line
BiBuffer size in front of the machine tool i + 1
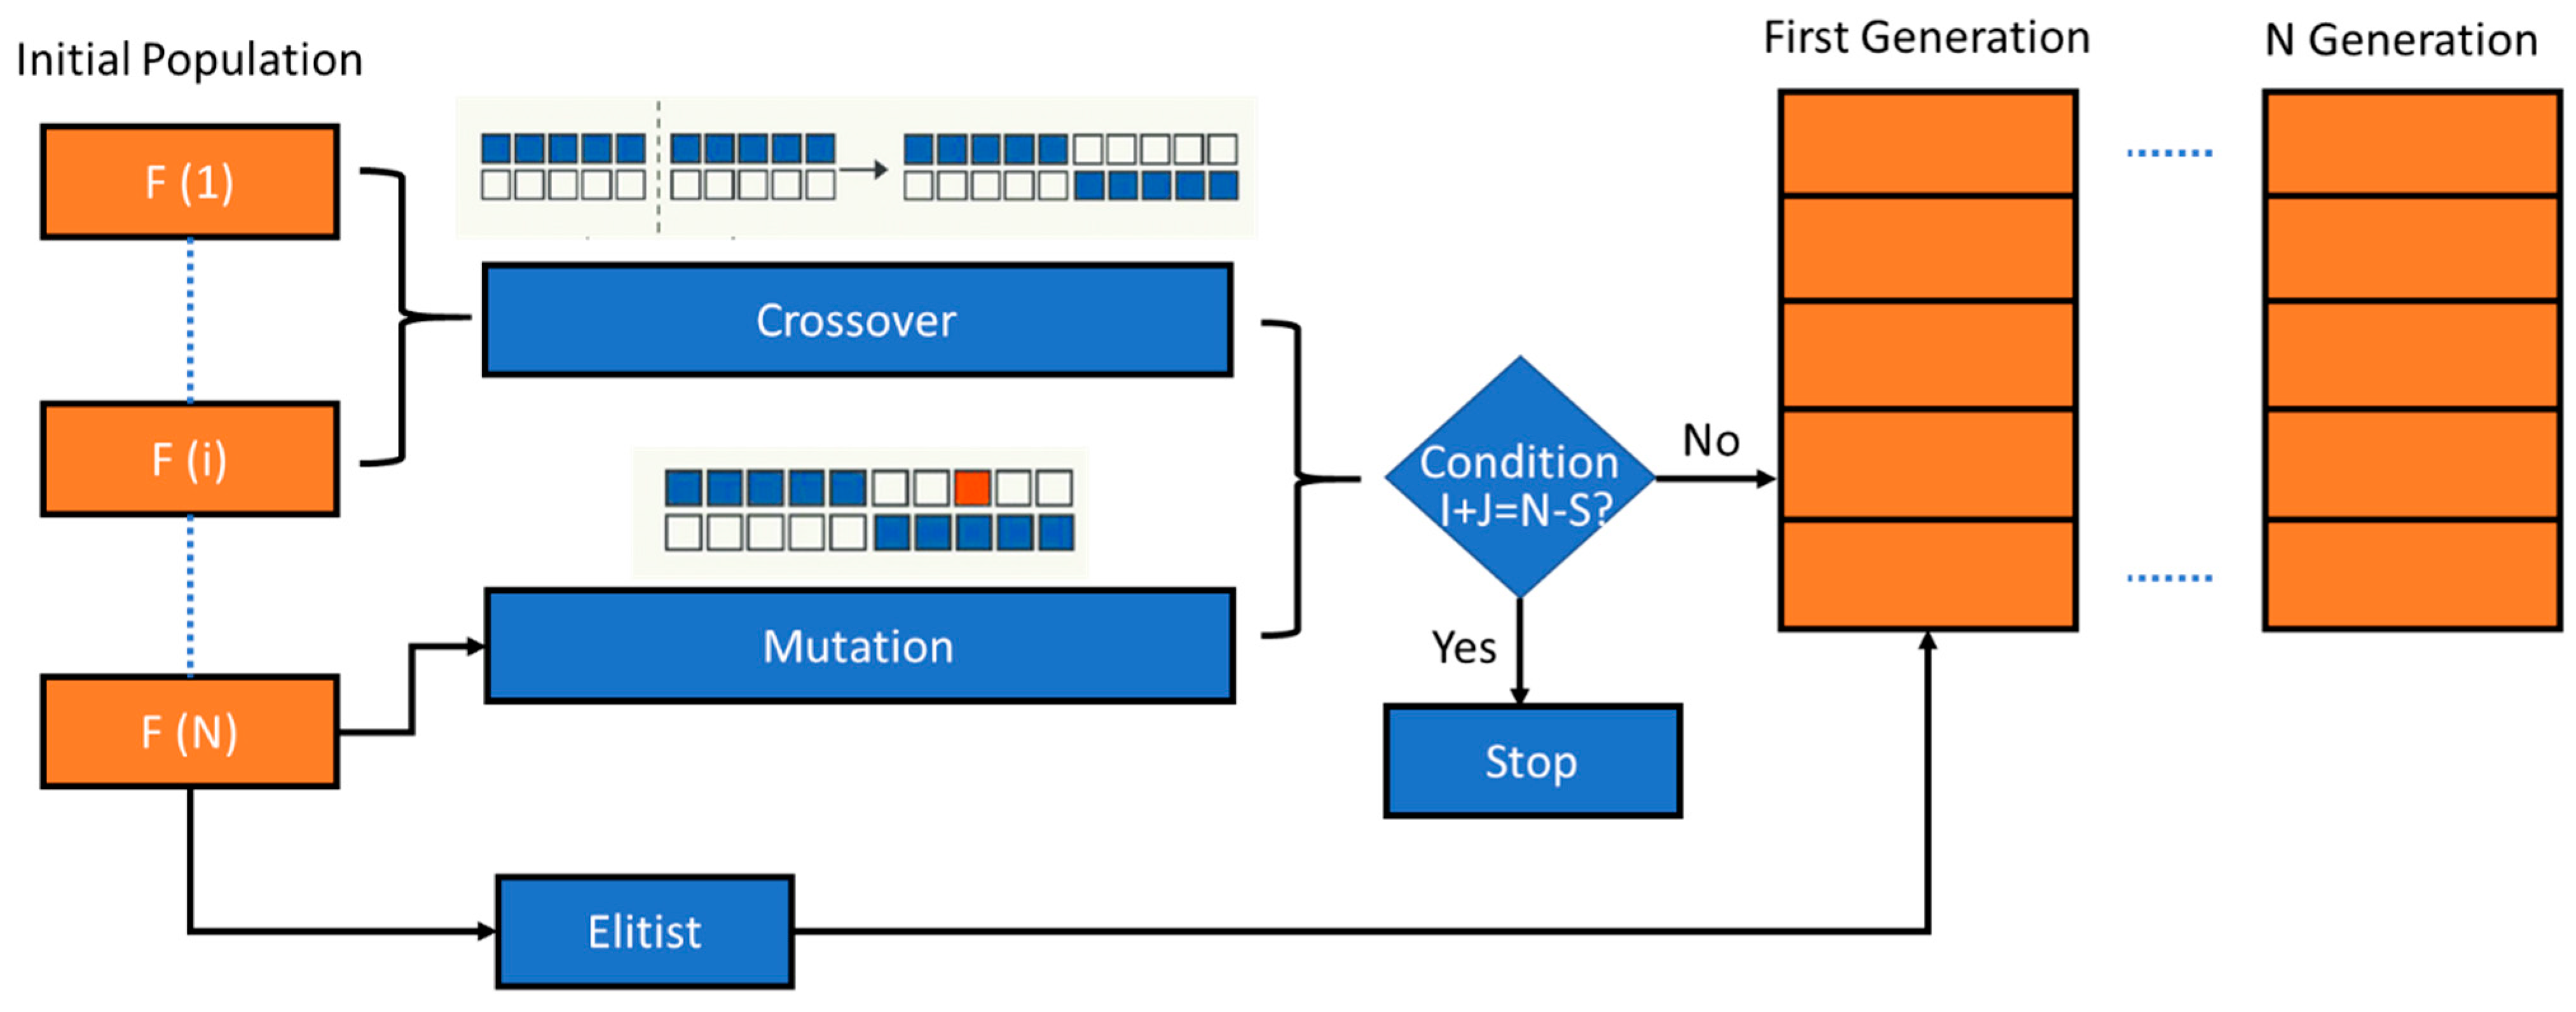
GAGenetic Algorithm
F(i)Fitness of individual i
P_sizePopulation size (number of individuals in population)
SNumber of individuals selected by applying elitist strategy
IND(i)Individual i
POP(i)Population i
CPCrossover point
Cr Crossover rate
MrMutation rate.

References

  1. Abidi, M.H.; Alkhalefah, H.; Mohammed, M.K.; Umer, U.; Abu Qudeiri, J.E. Optimal Scheduling of Flexible Manufacturing System Using Improved Lion-Based Hybrid Machine Learning Approach. IEEE Access 2020, 8, 96088–96114. [Google Scholar] [CrossRef]
  2. El-Tamimi, A.M.; Abidi, M.H.; Mian, S.H.; Aalam, J. Analysis of performance measures of flexible manufacturing system. J. King Saud. Univ.-Eng. Sci. 2012, 24, 115–129. [Google Scholar] [CrossRef]
  3. Shi, C.; Gershwin, S.B. An efficient buffer design algorithm for production line pro_t maximization. IFAC Proc. 2009, 42, 510–515. [Google Scholar] [CrossRef]
  4. Demir, L.; Tunali, S.; Eliiyi, D.T. The state of the art on buffer allocation problem: A comprehensive survey. J. Intell. Manuf. 2014, 25, 371–392. [Google Scholar] [CrossRef]
  5. Xi, S.; Chen, Q.; Smith, J.M.; Mao, N.; Yu, A.; Zhang, H. A new method for solving buffer allocation problem in large unbalanced production lines. Int. J. Prod. Res. 2020, 58, 6846–6867. [Google Scholar] [CrossRef]
  6. Yamamoto, H.; Abu Qudeiri, J.; Marui, E. Definition of FTL with bypass lines and its simulator for buffer size decision. Int. J. Prod. Econ. 2008, 112, 18–25. [Google Scholar] [CrossRef]
  7. Abu Qudeiri, J.; Yamamoto, H.; Ramli, R.; Jamali, A. Genetic algorithm for buffer size and work station capacity in serial-parallel production lines. Artif. Life Robot. 2008, 12, 102–106. [Google Scholar] [CrossRef]
  8. Qudeiri, J.A.; Yamamoto, H.; Ramli, R. Model of flexible production systems with sub-lines and their GA expressions. Int. J. Comput. Sci. Netw. Secur. 2007, 7, 223–231. [Google Scholar]
  9. Zandieh, M.; Joreir-Ahmadi, M.N.; Fadaei-Rafsanjani, A. Buffer allocation problem and preventive maintenance planning in non-homogenous unreliable production lines. Int. J. Adv. Manuf. Technol. 2017, 91, 2581–2593. [Google Scholar] [CrossRef]
  10. Shao, H.; Moroni, G.; Li, A.; Liu, X.; Xu, L. Simultaneously solving the transfer line balancing and buffer allocation problems with a multiobjective approach. J. Manuf. Syst. 2020, 57, 254–273. [Google Scholar] [CrossRef]
  11. Kang, Y.; Ju, F. Flexible preventative maintenance for serial production lines with multi-stage degrading machines and finite buffers. IISE Trans. 2019, 51, 777–791. [Google Scholar] [CrossRef]
  12. Ouzineb, M.; Mhada, F.Z.; Pellerin, R.; Hallaoui, I.E. Optimal planning of buffer sizes and inspection station positions. Prod. Manuf. Res. 2018, 6, 90–112. [Google Scholar] [CrossRef]
  13. Dolgui, A.B.; Eremeev, A.V.; Sigaev, V.S. Analysis of a multicriterial buffer capacity optimization problem for a production line. Autom. Remote Control 2017, 78, 1276–1289. [Google Scholar] [CrossRef]
  14. Azimi, P.; Farhadi, N. Developing a new integrated bi-objective model for buffer and process time optimization problem using optimization via simulation approach. Math. Models Comput. Simul. 2018, 10, 373–386. [Google Scholar] [CrossRef]
  15. Liberopoulos, G. Performance evaluation of a production line operated under an echelon buffer policy. IISE Trans. 2018, 50, 161–177. [Google Scholar] [CrossRef]
  16. Xi, S.; Smith, J.M.; Chen, Q.; Mao, N.; Zhang, H.; Yu, A. Simultaneous machine selection and buffer allocation in large unbalanced seriesparallel production lines. Int. J. Prod. Res. 2021, 60, 2103–2125. [Google Scholar] [CrossRef]
  17. Weiss, S.; Schwarz, J.A.; Stolletz, R. The buffer allocation problem in production lines: Formulations, solution methods, and instances. IISE Trans. 2019, 51, 456–485. [Google Scholar] [CrossRef]
  18. Kose, S.Y.; Kilincci, O. A multi-objective hybrid evolutionary approach for buffer allocation in open serial production lines. J. Intell. Manuf. 2020, 31, 33–51. [Google Scholar] [CrossRef]
  19. Koyuncuo, M.U.; Demir, L. A comparison of combat genetic and big bang_big crunch algorithms for solving the buffer allocation problem. J. Intell. Manuf. 2020, 32, 1529–1546. [Google Scholar] [CrossRef]
  20. Demir, L.; Koyuncuoglu, M.U. The impact of the optimal buffer configuration on production line efficiency: A VNS-based solution approach. Expert Syst. Appl. 2021, 172, 114631. [Google Scholar] [CrossRef]
  21. Koyuncuoğlu, M.U.; Demir, L. Buffer capacity allocation in unreliable production lines: An adaptive large neighborhood search approach. Eng. Sci. Technol. Int. J. 2021, 24, 299–309. [Google Scholar] [CrossRef]
  22. Duan, J.; Nan, X.; Lianhui, L. Optimal Buffer Allocation in Multi-Product Repairable Production Lines Based on Multi-State Reliability and Structural Complexity. KSII Trans. Internet Inf. Syst. (TIIS) 2020, 14, 1579–1602. [Google Scholar] [CrossRef]
  23. Hernández-Vázquez, J.O.; Hernández-González, S.; Hernández-Vázquez, J.I.; Figueroa-Fernández, V.; Cancino de la Fuente, C.I. Buffer allocation problem in a shoe manufacturing line: A metamodeling approach. Rev. Fac. Ing. 2022, 103, 175–185. [Google Scholar] [CrossRef]
  24. Magnanini, M.C.; Terkaj, W.; Tolio, T.A.M. A novel algorithm for optimal buffer allocation in automated asynchronous unreliable lines. Int. J. Adv. Manuf. Technol. 2022, 122, 4405–4419. [Google Scholar] [CrossRef]
  25. Nahas, N. Buffer allocation, equipment selection and line balancing optimization in unreliable production lines. Eur. J. Ind. Eng. 2020, 14, 217–246. [Google Scholar] [CrossRef]
  26. Duan, J.; Li, H.; Zhang, Q. Multiobjective optimization of buffer capacity allocation in multiproduct unreliable production lines using improved adaptive NSGA-II algorithm. Kuwait J. Sci. 2021, 48, 37–49. [Google Scholar] [CrossRef]
  27. Gao, S. A Bottleneck Detection-Based Tabu Search Algorithm for the Buffer Allocation Problem in Manufacturing Systems. IEEE Access 2022, 10, 60507–60520. [Google Scholar] [CrossRef]
  28. Alkhalefah, H.; Abu Qudeiri, J.E.; Umer, U.; Abidi, M.; Elkaseer, A. Development of an Efficient Prediction Model for Optimal Design of Serial Production Lines. IEEE Access 2021, 9, 61807–61818. [Google Scholar] [CrossRef]
  29. Chiang, S.-Y.; Kuo, C.-T.; Meerkov, S.M. DT-bottlenecks in serial production lines: Theory and application. IEEE Trans. Robot. Autom. 2000, 16, 567–580. [Google Scholar] [CrossRef]
  30. Gola, A. Economical Aspects of Manufacturing Systems Design. Actual Probl. Econ. 2014, 156, 205–212. [Google Scholar]
  31. Cimren, E.; Çatay, B.; Budak, E. Development of a machine tool selection system using AHP. Int. J. Adv. Manuf. Technol. 2007, 35, 363–376. [Google Scholar] [CrossRef]
  32. Qudeiri JE, A.; Mohammed, M.K.; Mian, S.H.; Khadra, F.A. A Multistage Approach for Buffer Size Decision in Serial Production Line. In Proceedings of the SIMULTECH 2015—5th International Conference on Simulation and Modeling Methodologies, Technologies and Applications, Colmar, France, 21–23 July 2015. [Google Scholar]
  33. Li, J. Performance analysis of production systems with rework loops. IIE Trans. 2004, 36, 755–765. [Google Scholar] [CrossRef]
Figure 1. The structure of an SPL (modified from [28]).
Processes 11 01578 g001
Figure 2. SPL evaluation procedure (modified from [28]).
Processes 11 01578 g002
Figure 3. The flexibility level.
Processes 11 01578 g003
Figure 4. The production system components.
Processes 11 01578 g004
Figure 5. Analytic hierarchy process algorithm.
Processes 11 01578 g005
Figure 6. Software workflow.
Processes 11 01578 g006
Figure 7. Flowchart of machine selection criteria.
Processes 11 01578 g007
Figure 8. GA block diagram (modified from [28,31]).
Processes 11 01578 g008
Figure 9. Example of a pareto chart for the optimization model of an SPL with 11 machine tools.
Processes 11 01578 g009
Figure 10. Example of serial production line (modified from [28]).
Processes 11 01578 g010
Figure 11. A serial production line interface.
Processes 11 01578 g011
Figure 12. A randomized machine output sample.
Processes 11 01578 g012
Figure 13. Calculating the optimized buffer page.
Processes 11 01578 g013
Figure 14. MATLAB GA optimization results.
Processes 11 01578 g014
Figure 15. Excel printout of the genetic algorithm optimization results.
Processes 11 01578 g015
Figure 16. Neural Network training.
Processes 11 01578 g016
Figure 17. DSS interface validation.
Processes 11 01578 g017
Figure 18. DSS output.
Processes 11 01578 g018
Table 1. Machine tool selection criteria and sub-criteria [31].
CapabilityFlexibilityAdaptabilitySafety
C1: PowerF1: U AxisA1: Taper TypeS1: Safety Door
C2: Maximum SpeedF2: Articulated AxisA2: Space Requirements S2: No. of Emergency Stops
C3: No. of SpindlesF3: No. of PalletsA3: Online Access or Not?S3: Fire Extinguisher
C4: Tool Exchange TimeF4: Rotary TableA4: Control TypeS4: Mist Collector
C5: Rapid Traverse SpeedF5: Head ChangerA5: Coolant Type
C6: Cutting FeedF6: Index Table
C7: Automatic Tool Exchanger SizeF7: Dual Axis Rotary Table
F8: No. of Axis
Table 2. Uptime and downtime parameters for the SPL of 11 machine tools.
Machine ToolUptime Parameter (pi)Downtime Parameter (ri)
10.20.83
20.220.86
30.250.85
40.10.94
50.150.93
60.170.95
70.230.86
80.240.84
90.20.9
100.180.95
110.140.87
Table 3. Optimal buffer size for an SPL of 11 machine tools.
SPLPi0.20.220.250.10.150.170.230.240.20.180.14
Ri0.830.860.850.940.930.950.860.840.90.950.97
Results of the proposed method Ni223223223 3
Productivity0.62
Result from the literature study [33]Ni4543445542
Productivity0.695
Disclaimer/Publisher’s Note: The statements, opinions and data contained in all publications are solely those of the individual author(s) and contributor(s) and not of MDPI and/or the editor(s). MDPI and/or the editor(s) disclaim responsibility for any injury to people or property resulting from any ideas, methods, instructions or products referred to in the content.

