
Simulation and Multi-Objective Optimization of Three-Column Double-Effect Methanol Distillation by NSGA-III Algorithm


Abstract
:1. Introduction
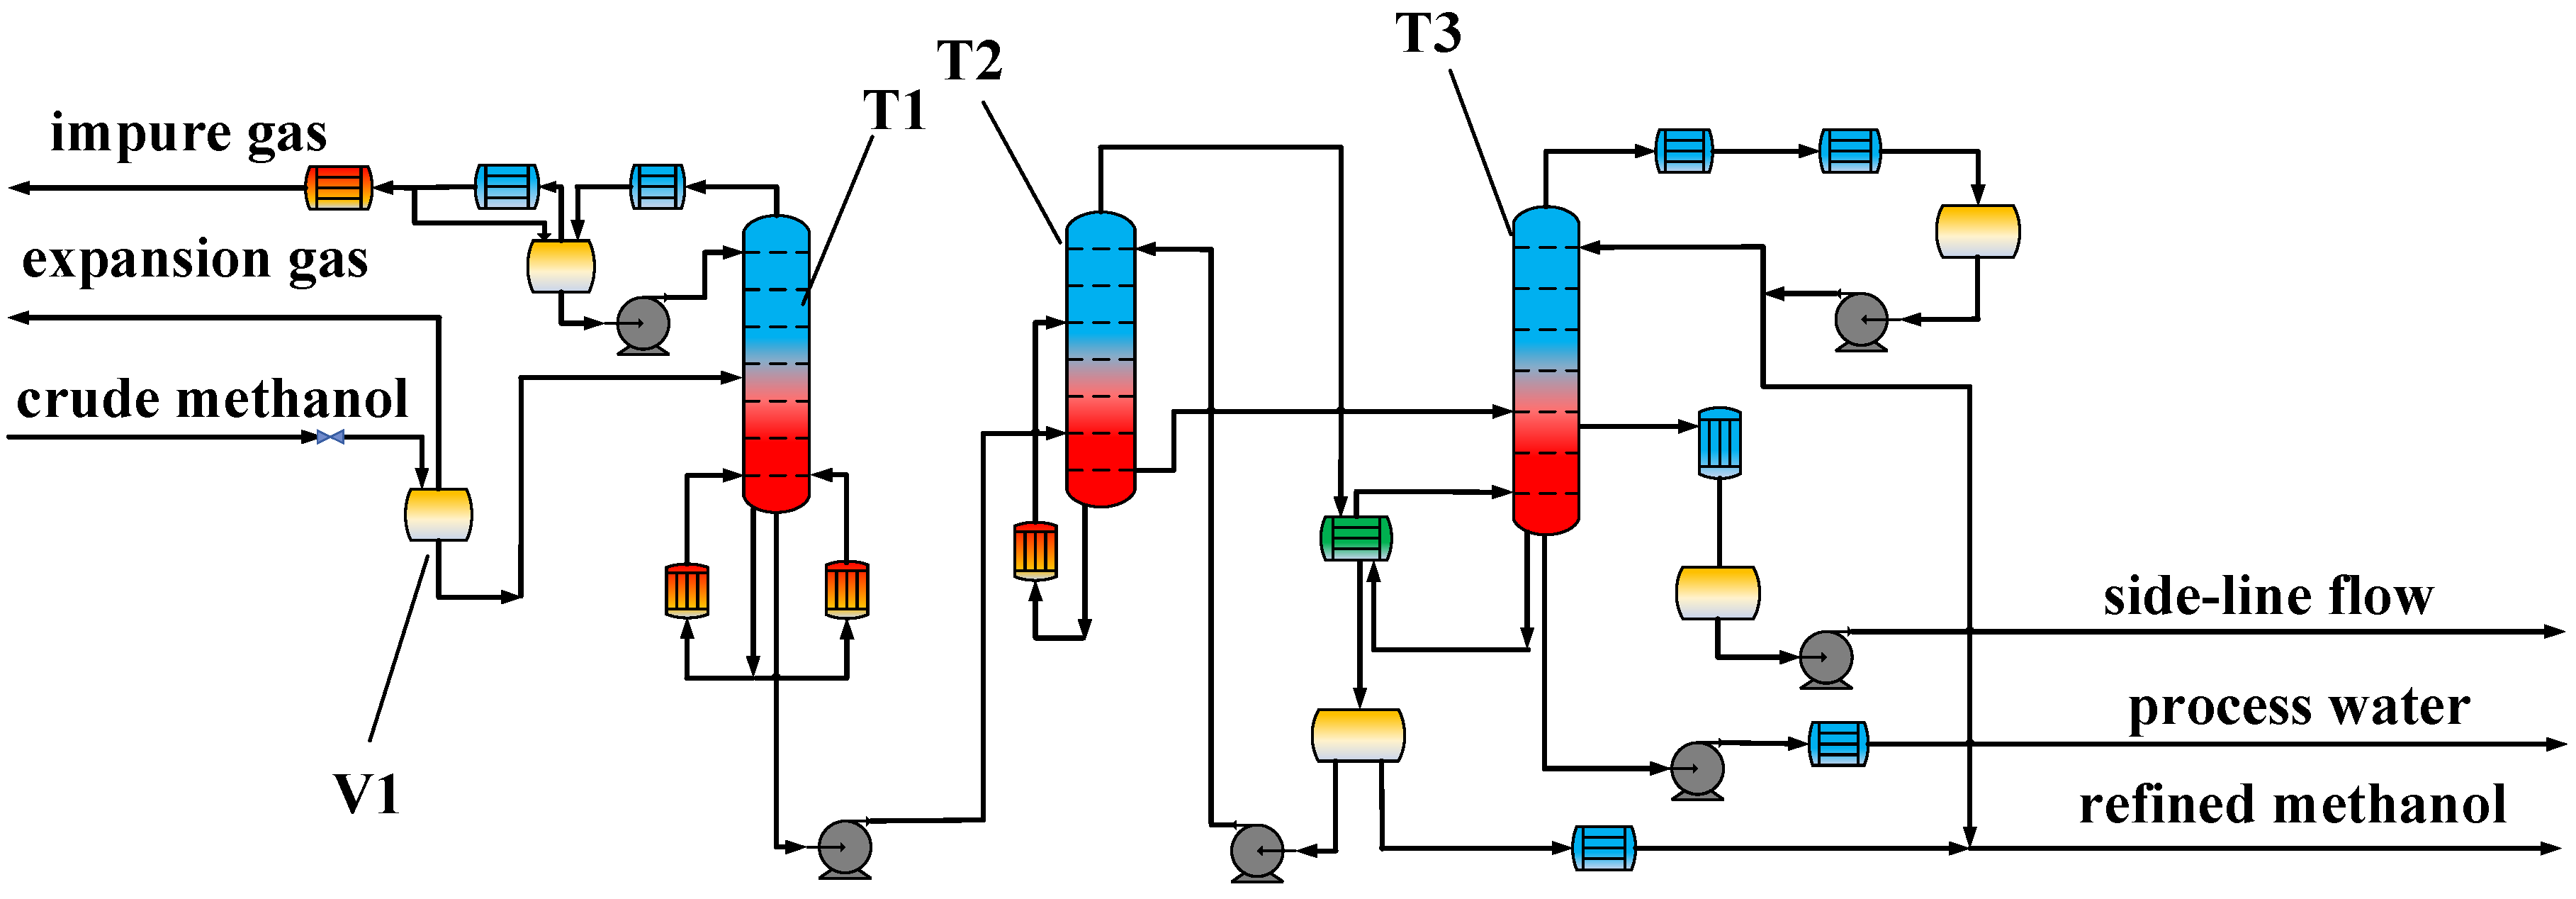
2. Process Simulation
2.1. Implementation of The Base Simulation Model
2.2. Data Reconciliation
- RR1: the mole reflux ratio of T1
- RR2: the mole reflux ratio of T2
- RR3: the mole reflux ratio of T3
3. Optimization of Distillation Sequence
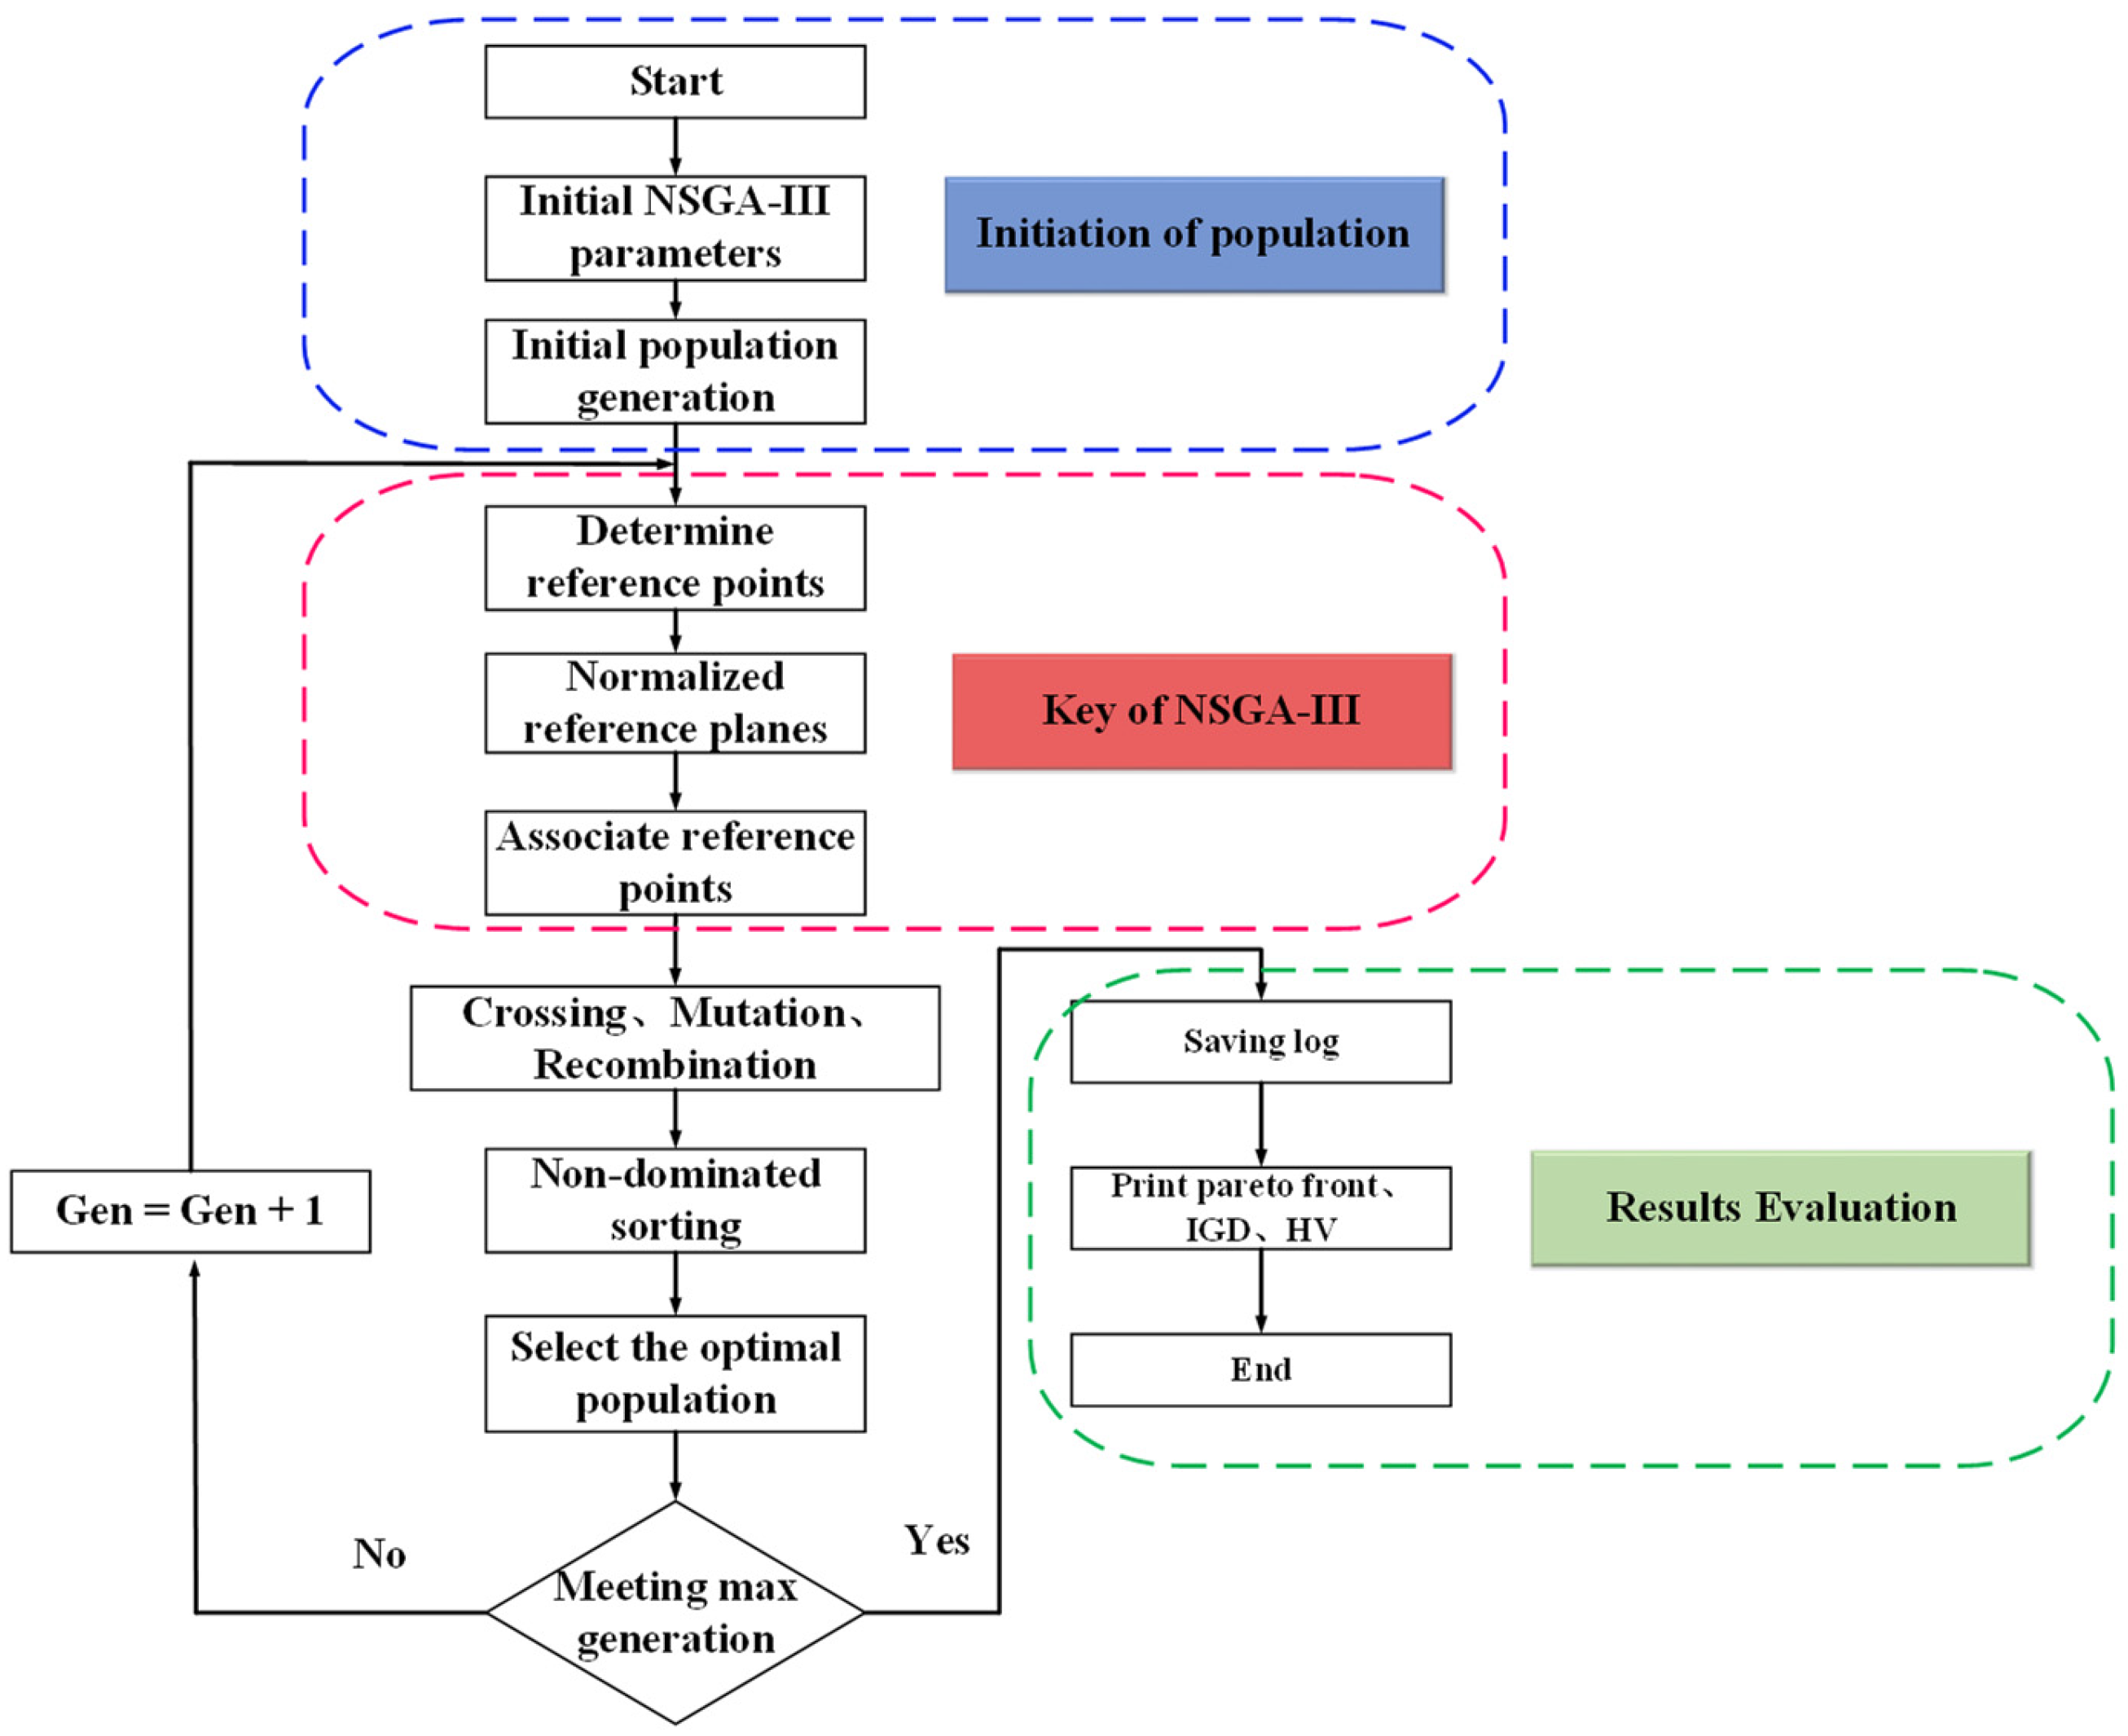
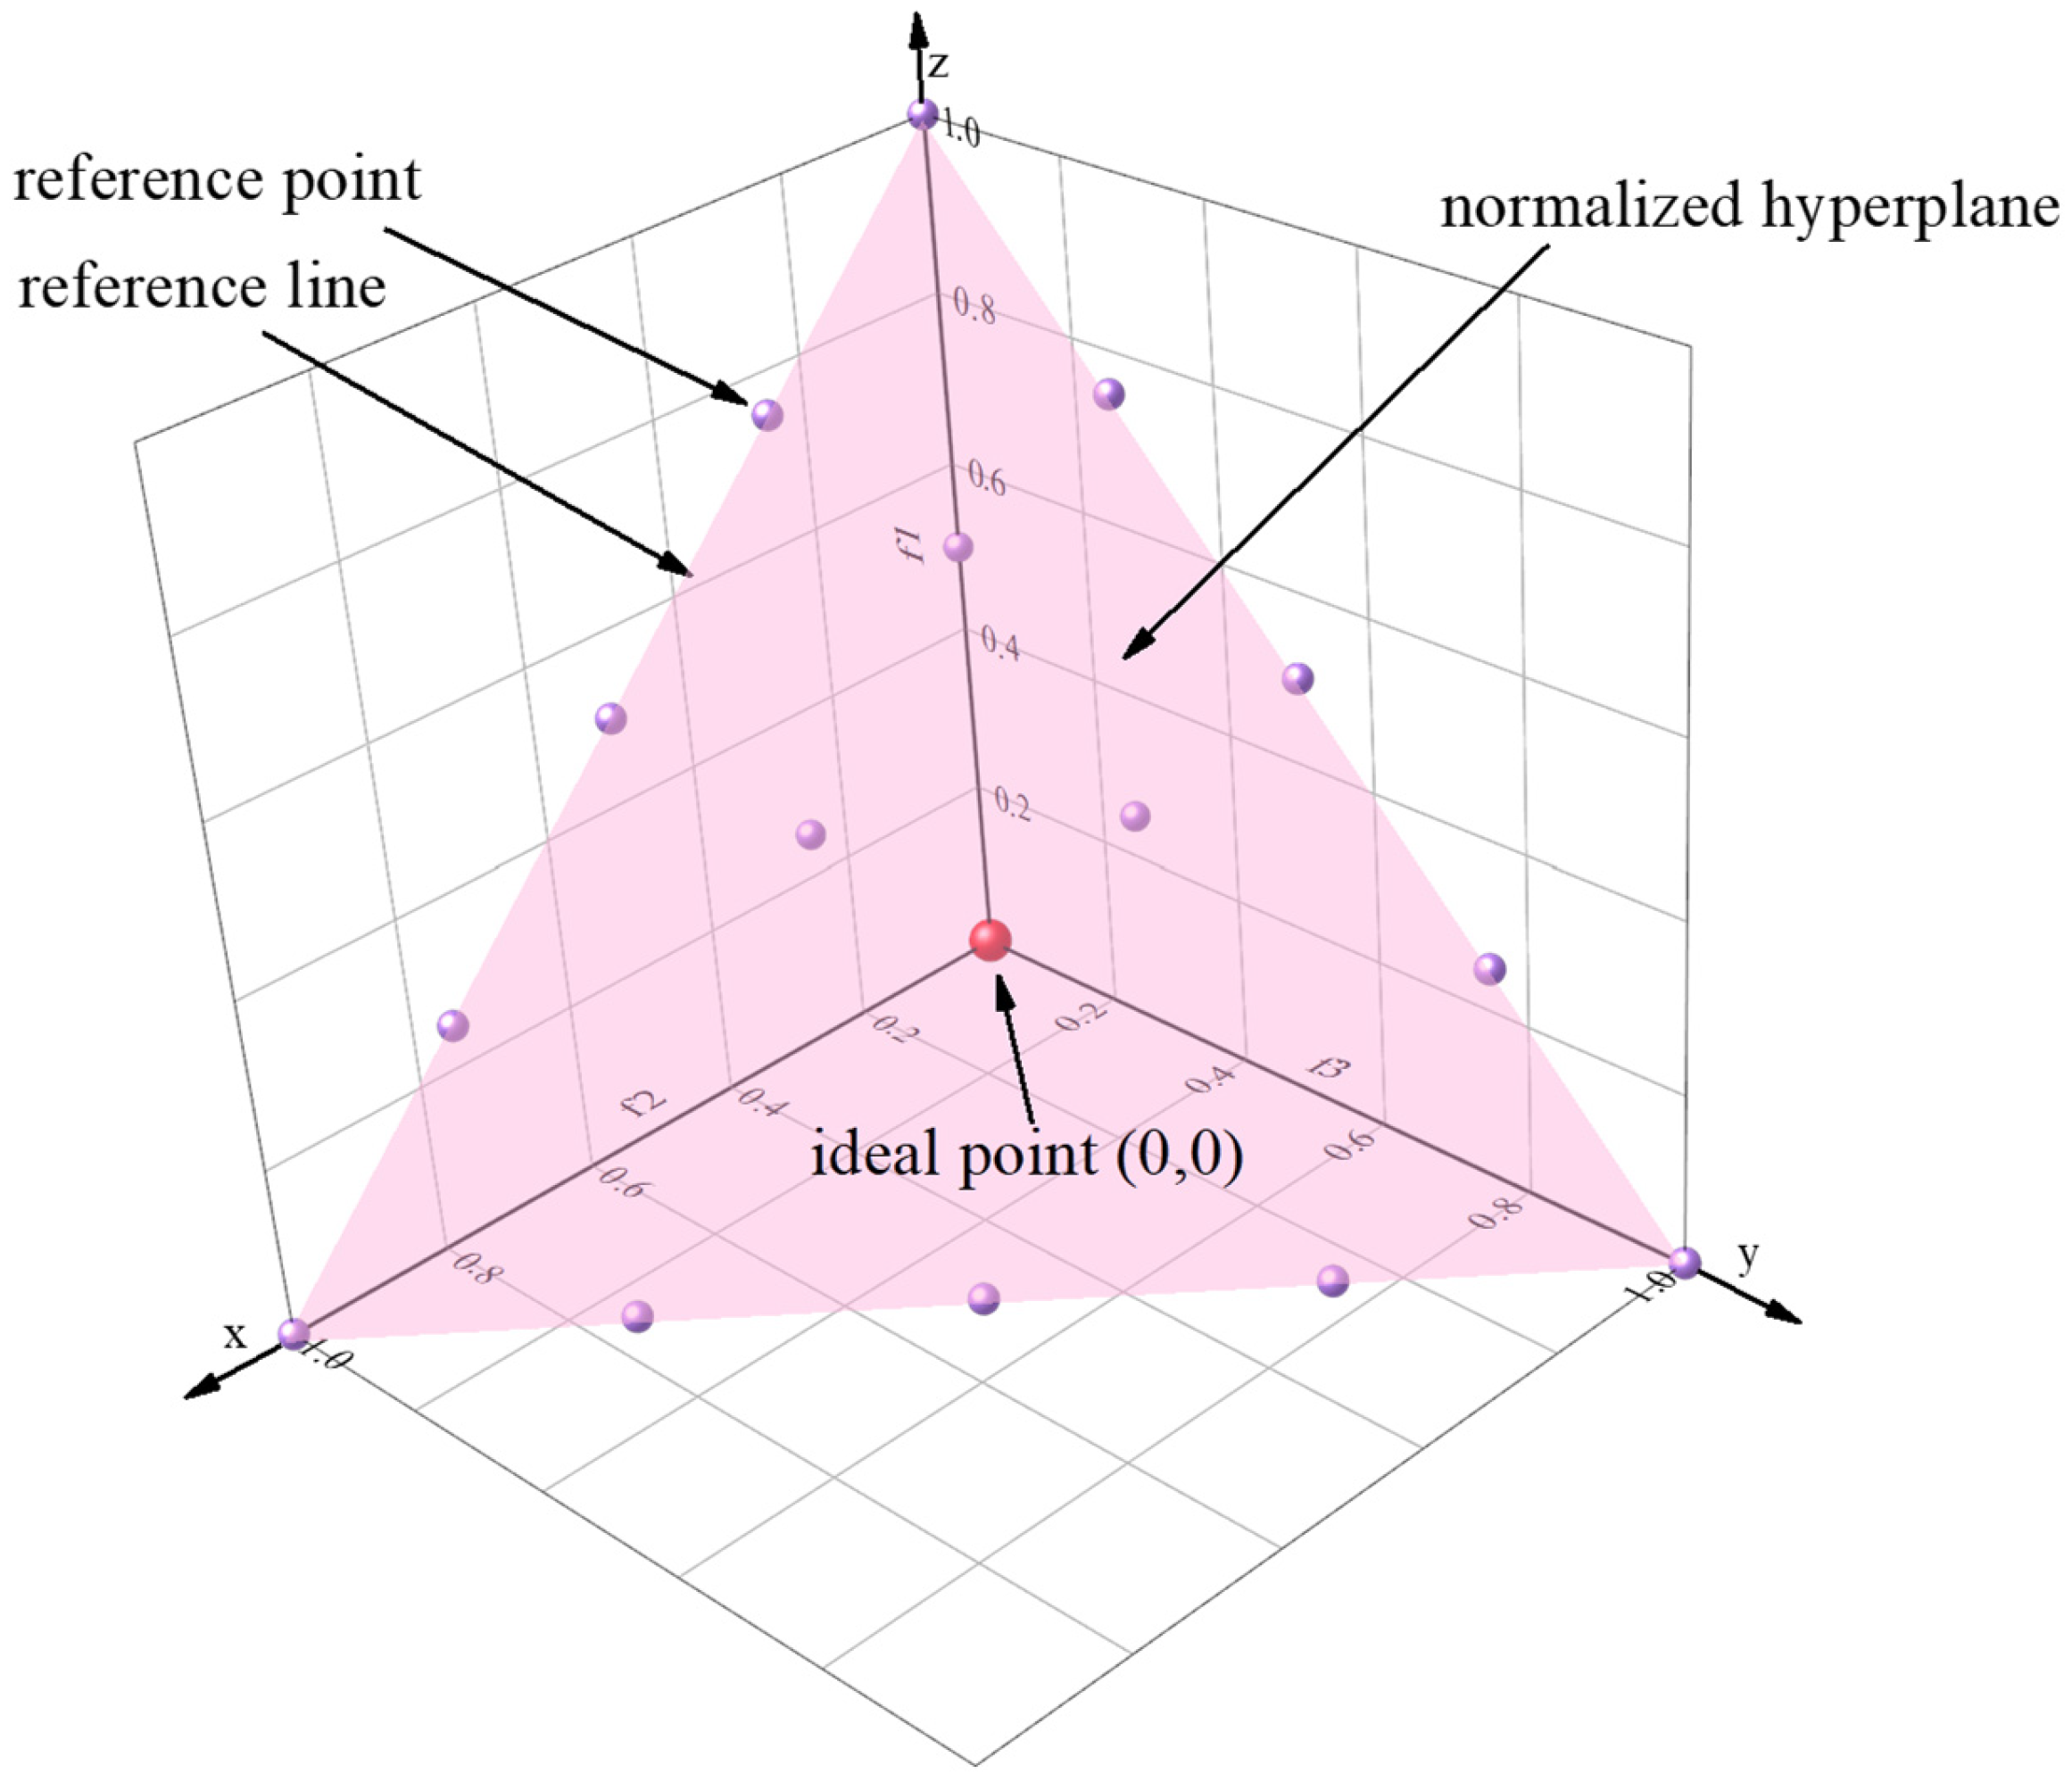
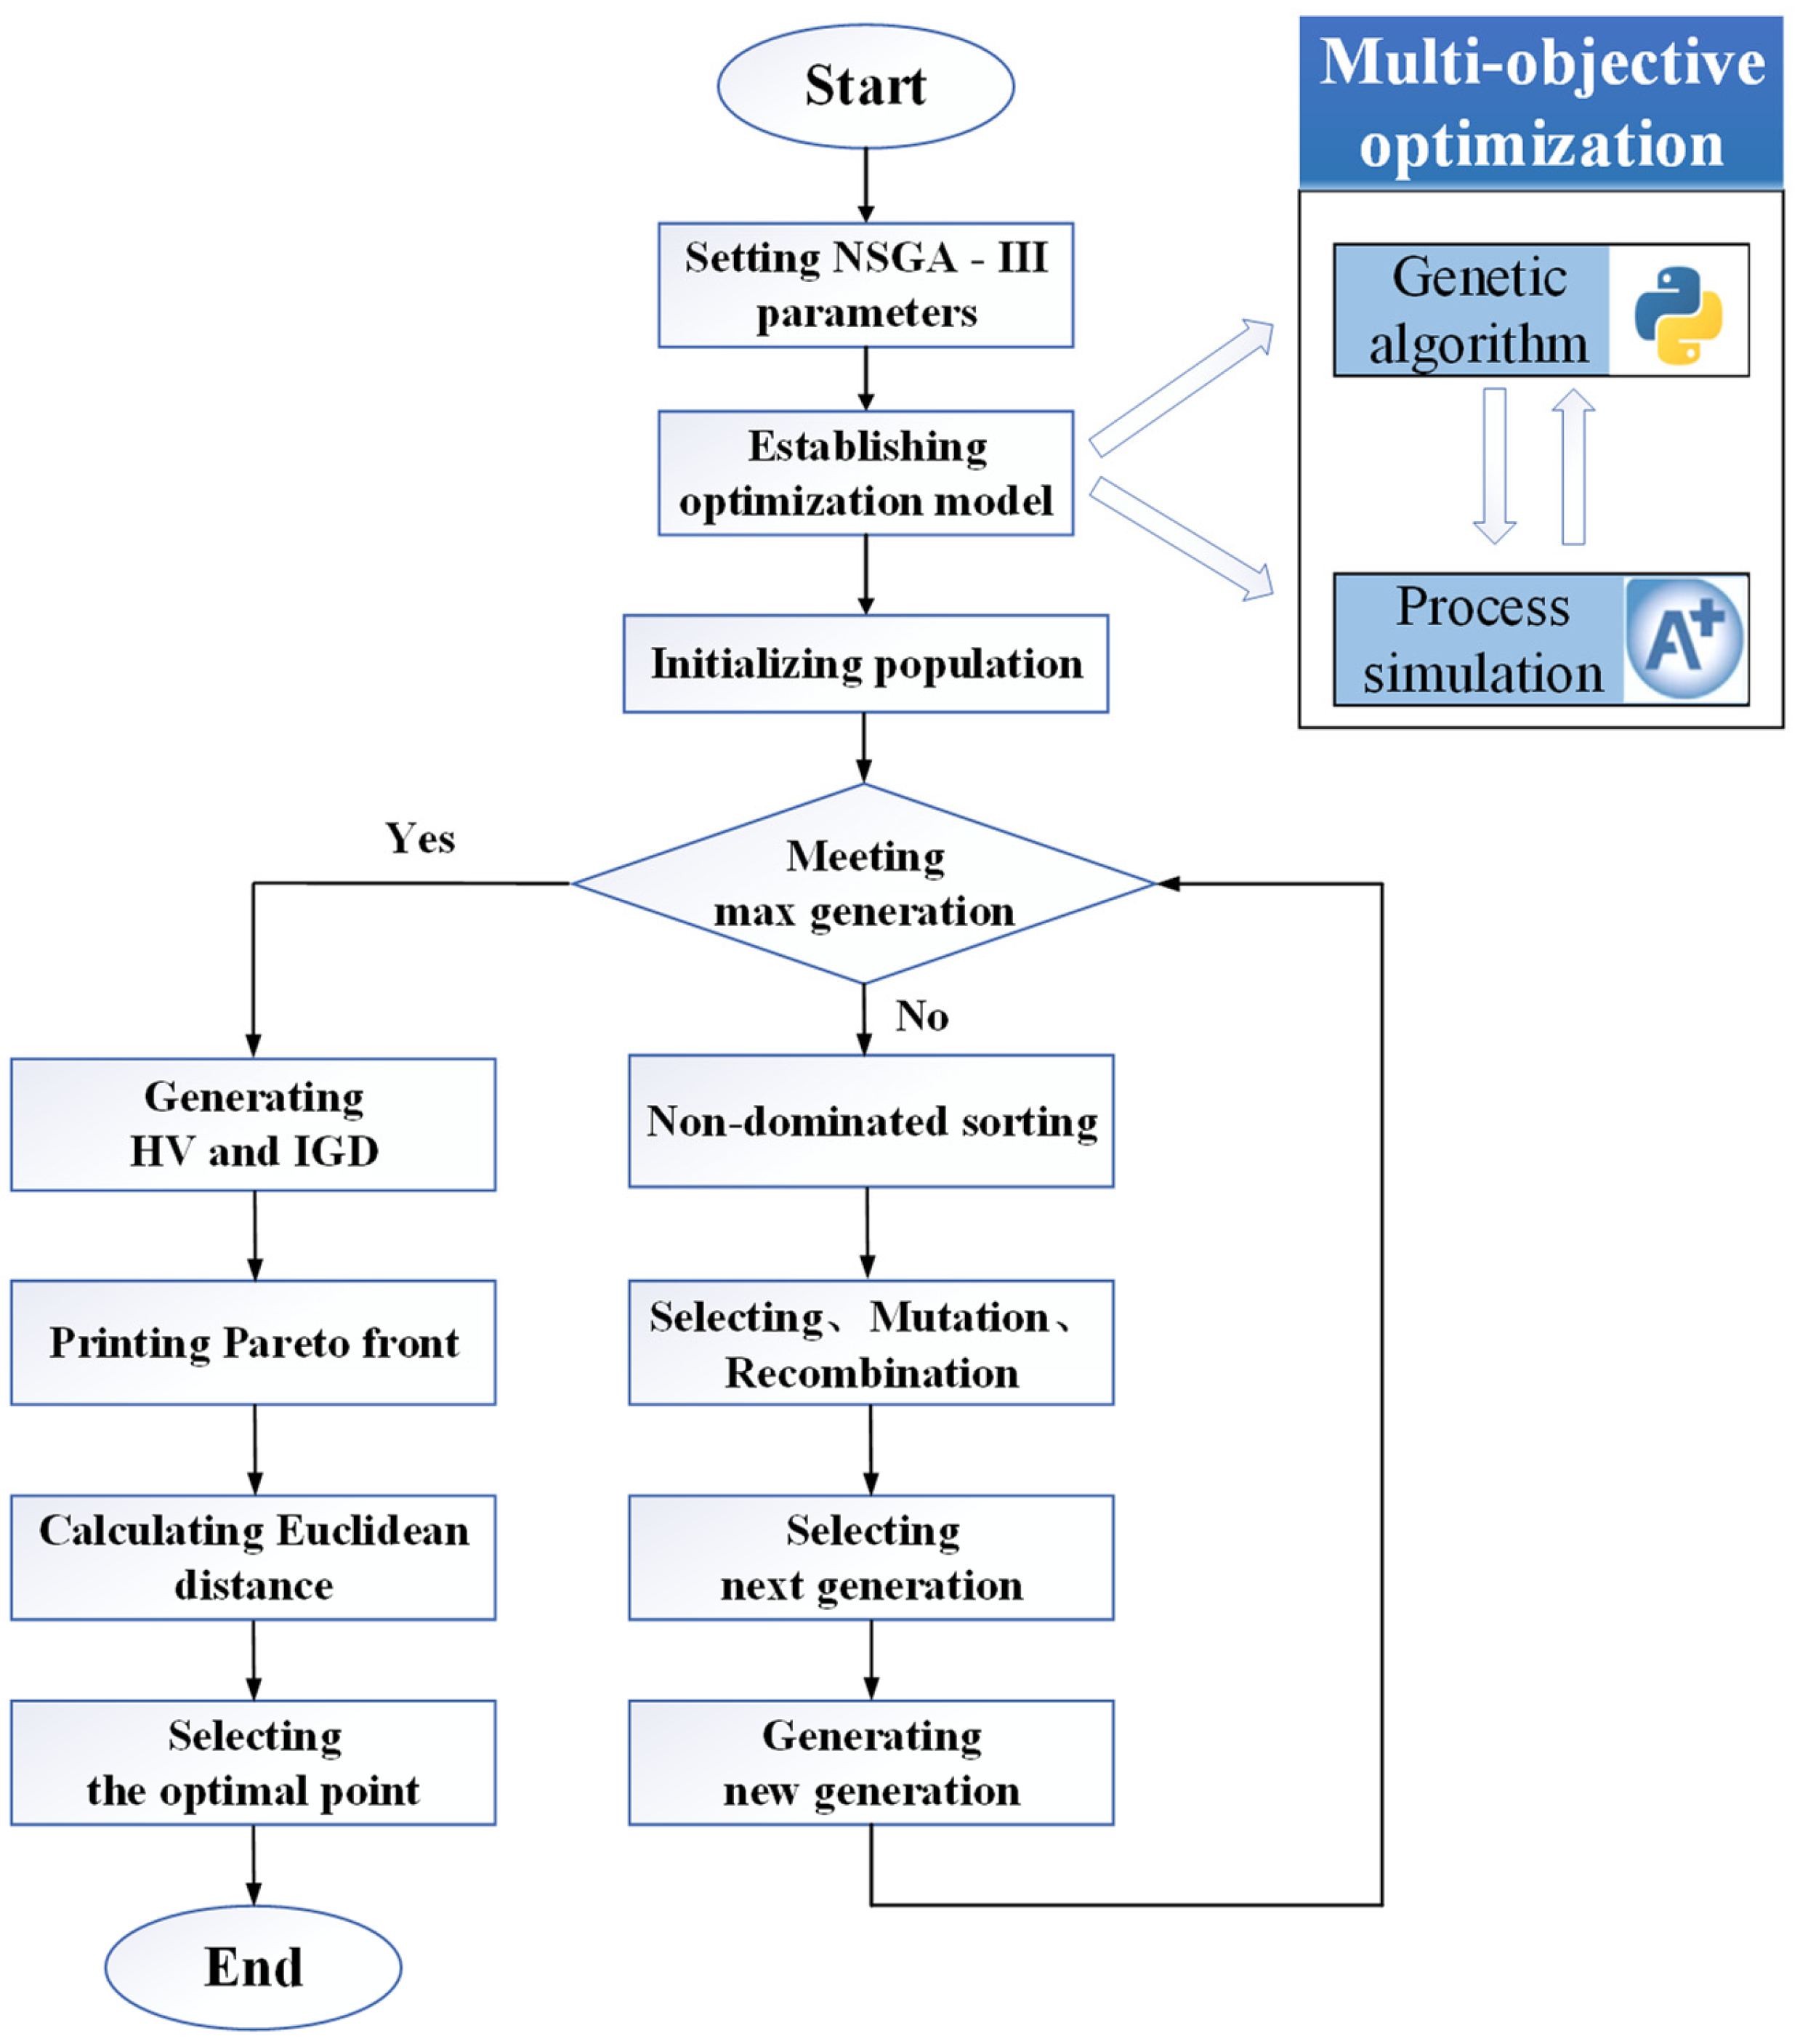
3.1. NSGA-III
3.2. Performance Parameters
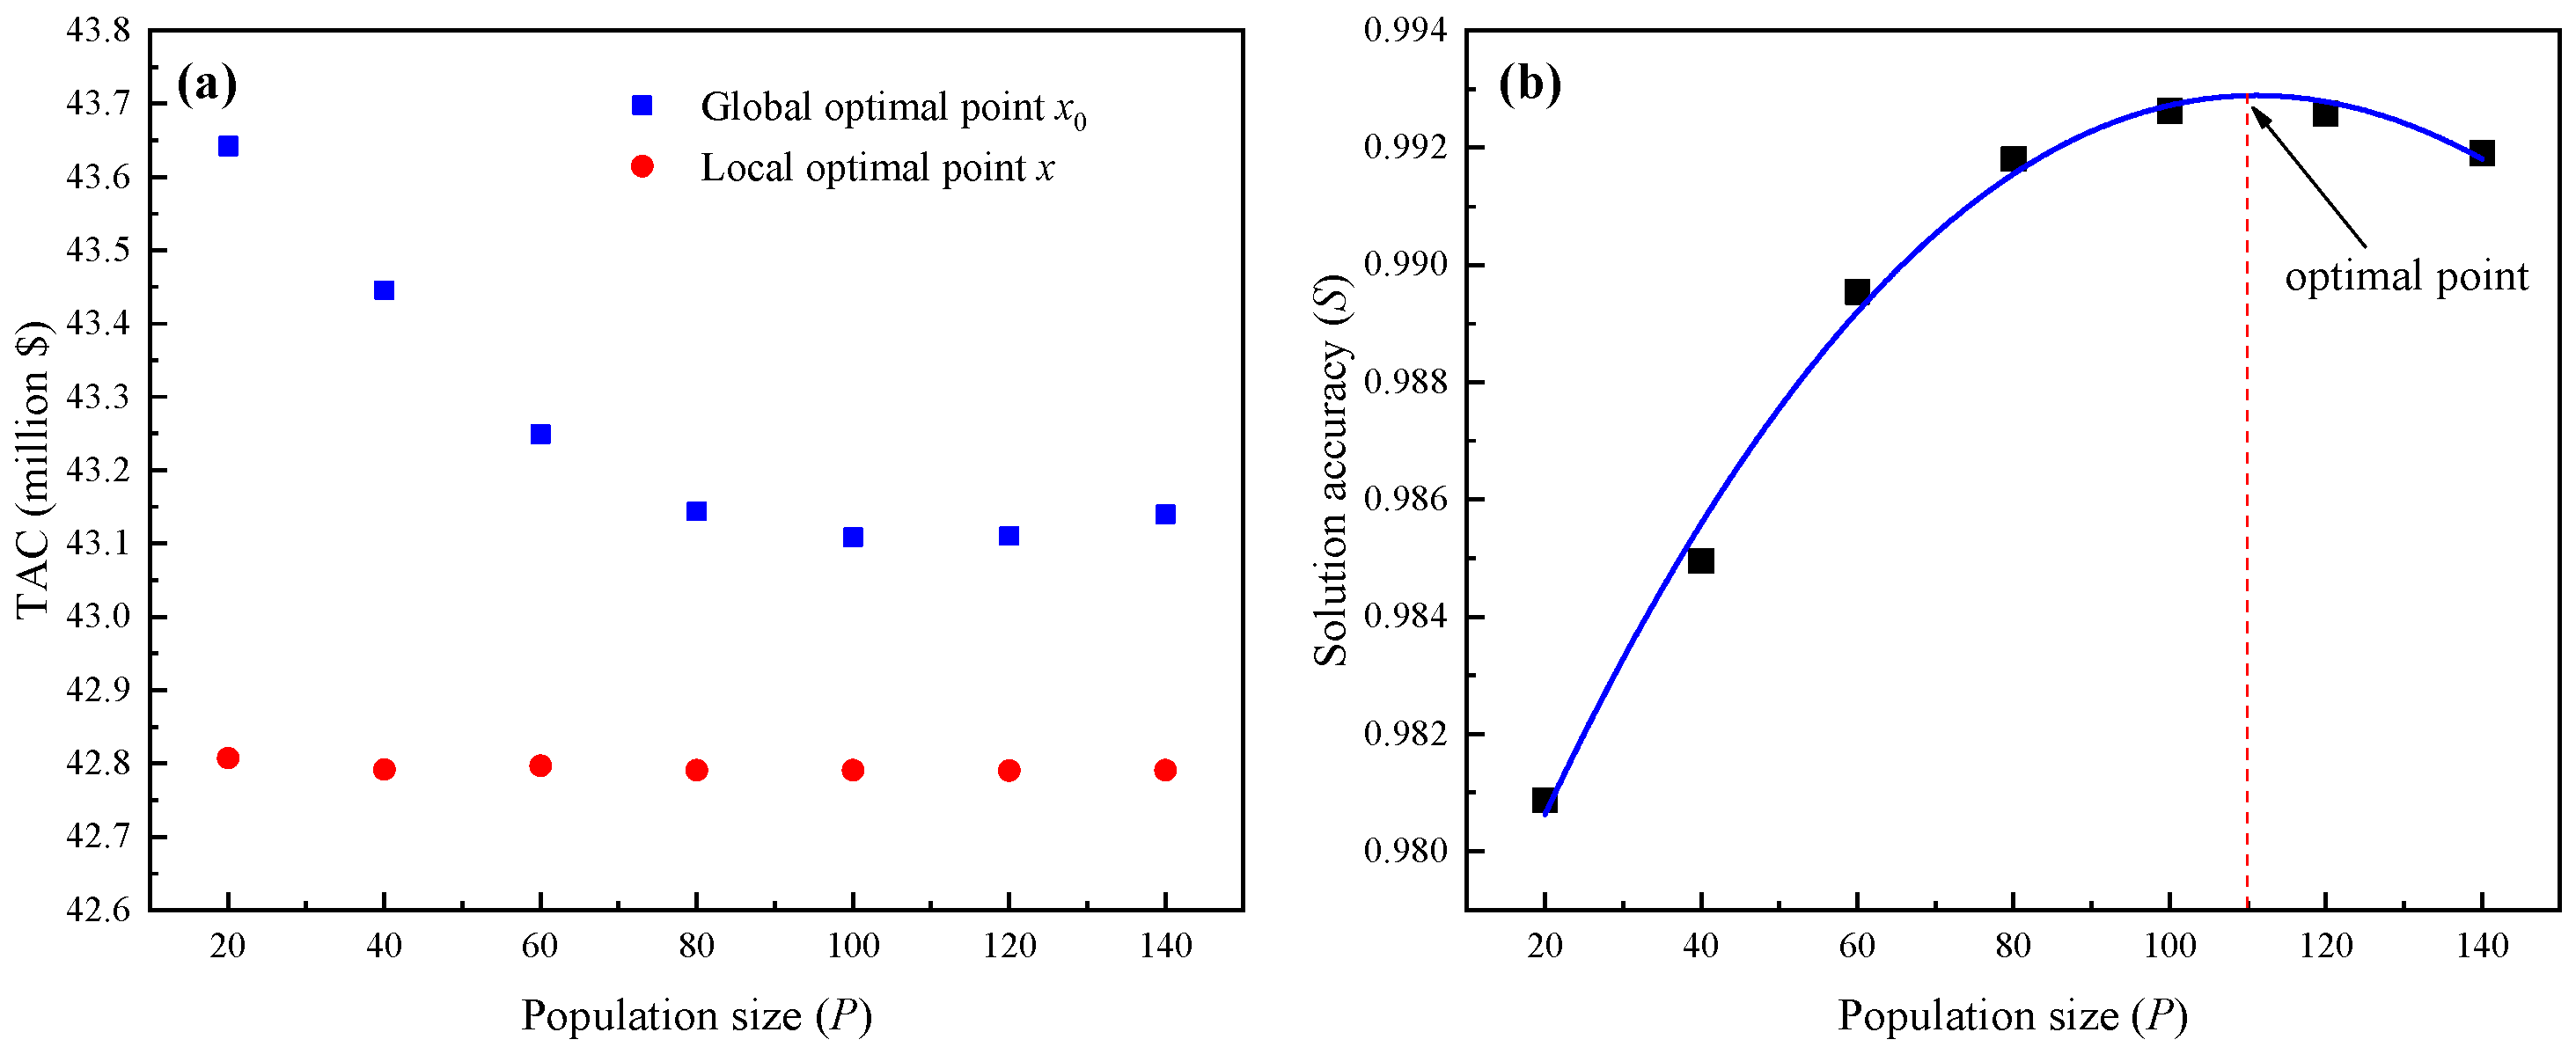
3.2.1. Population Size
3.2.2. Objective Function
3.2.3. Constraint Function
3.2.4. Decision Variables
4. Optimization Results and Discussion
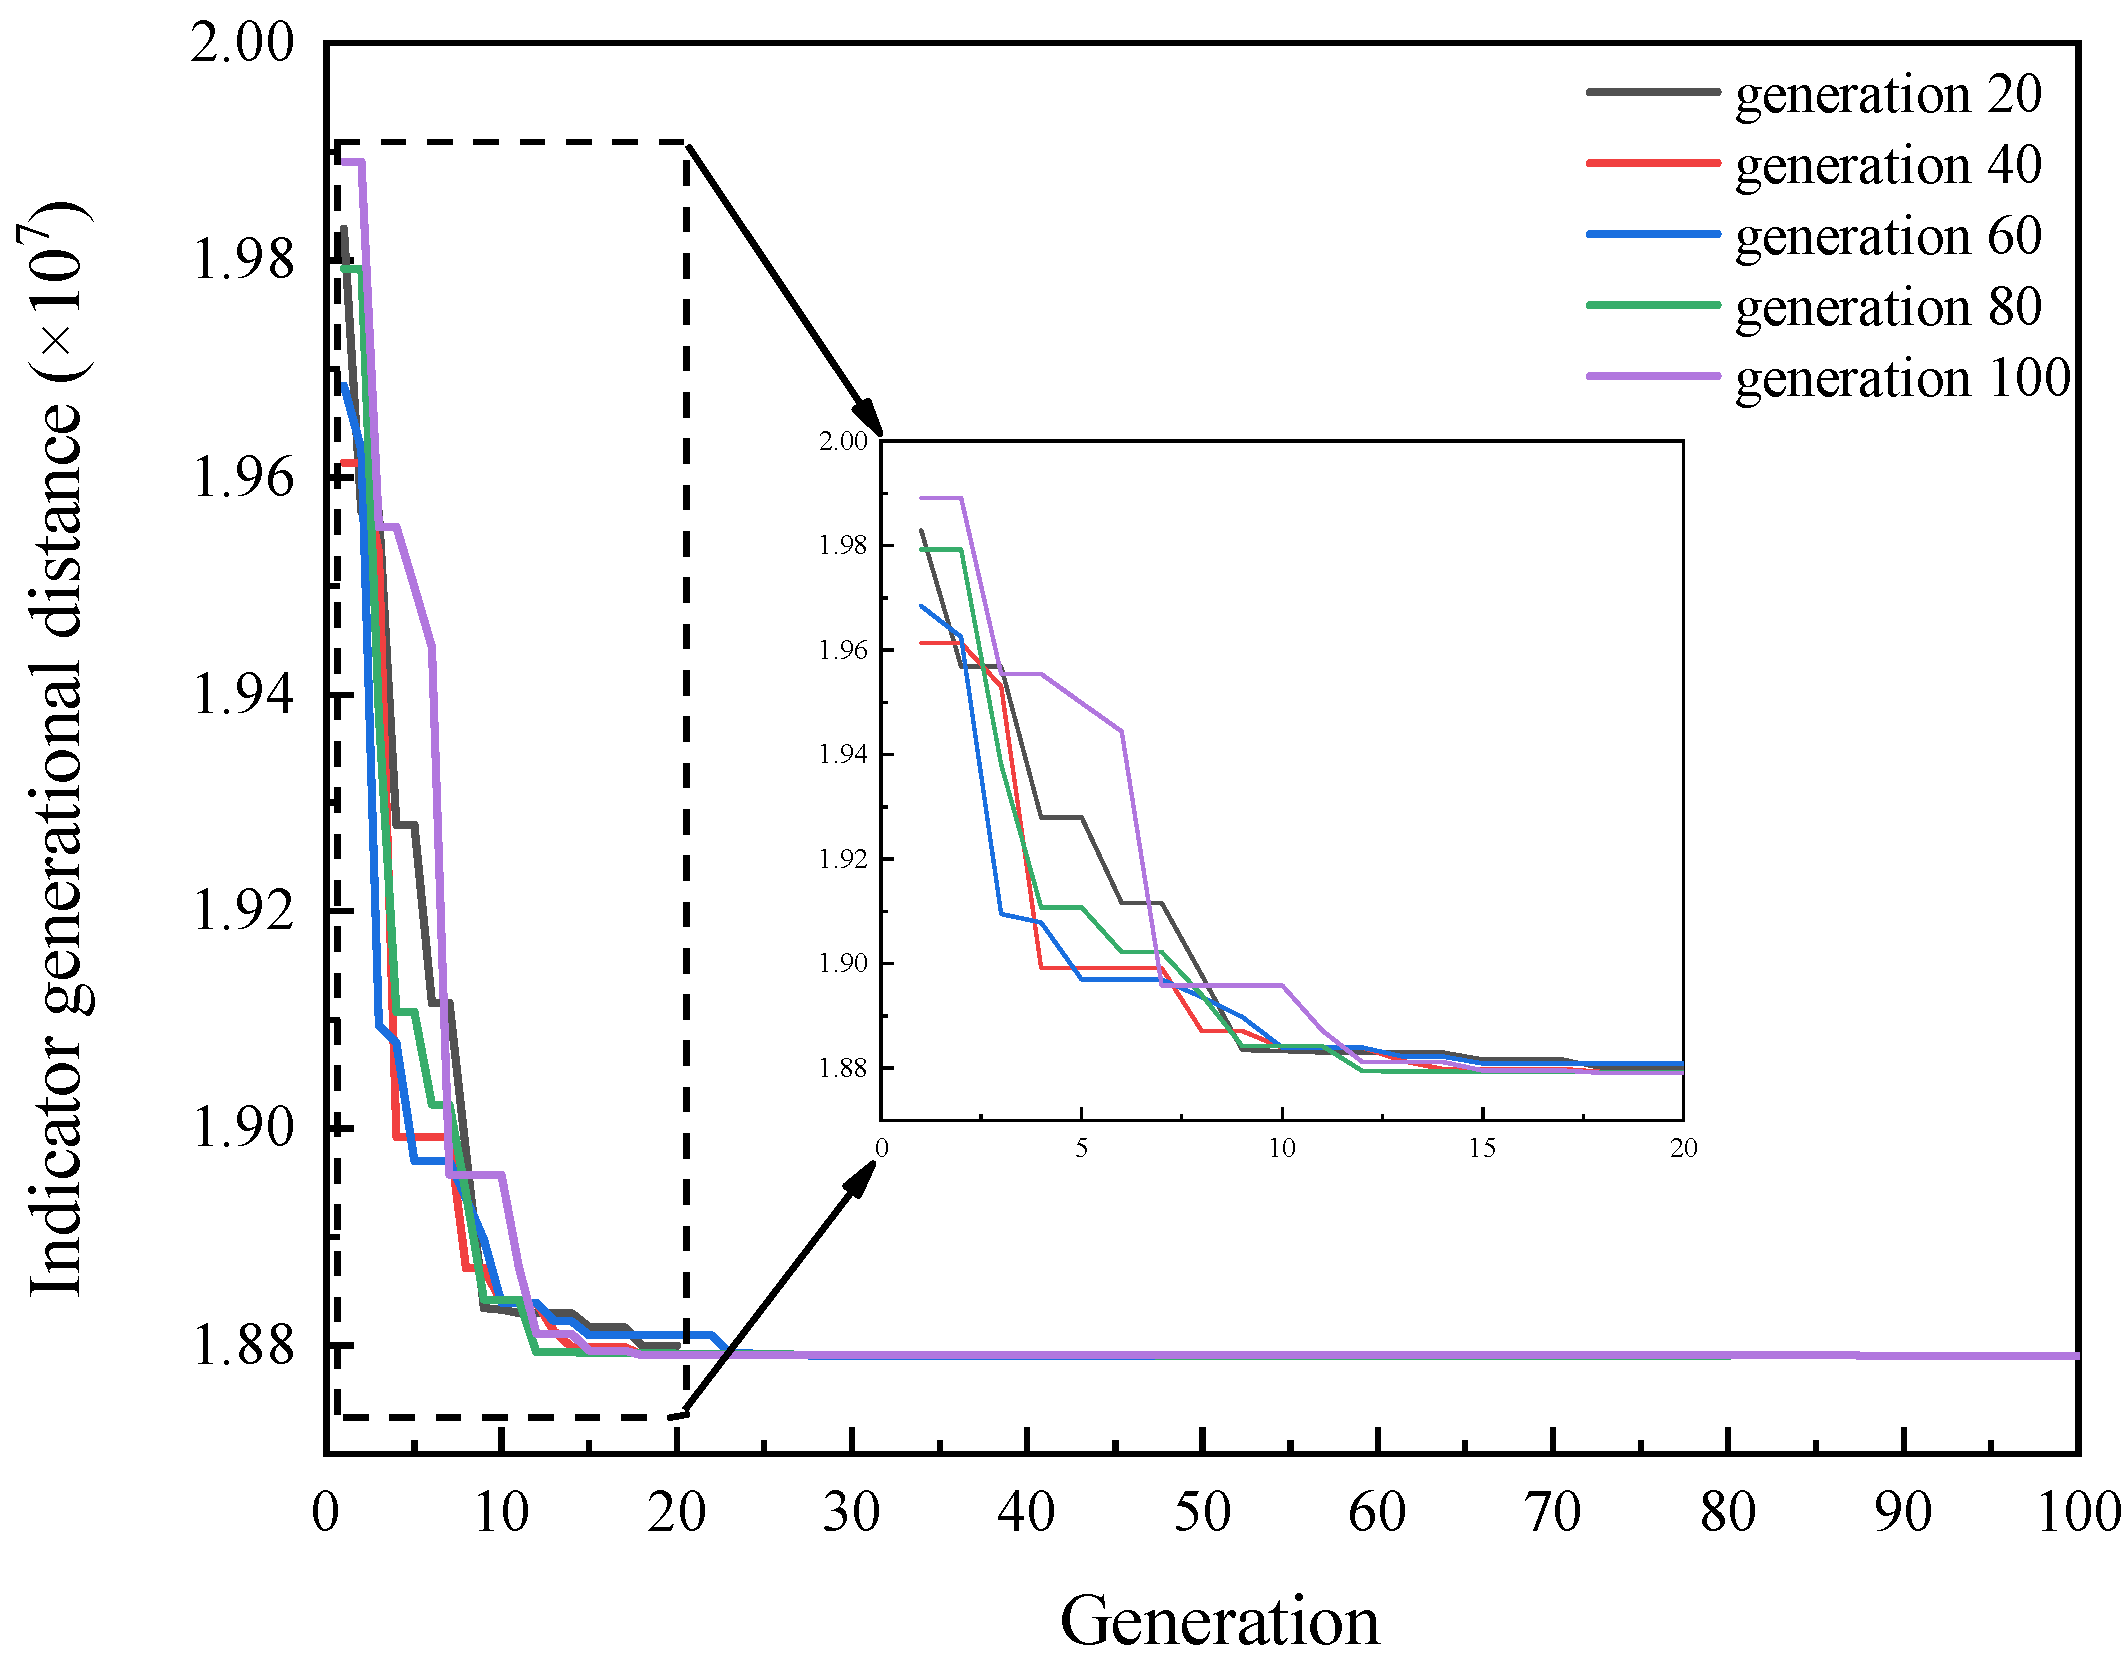
4.1. Indicator Generational Distance
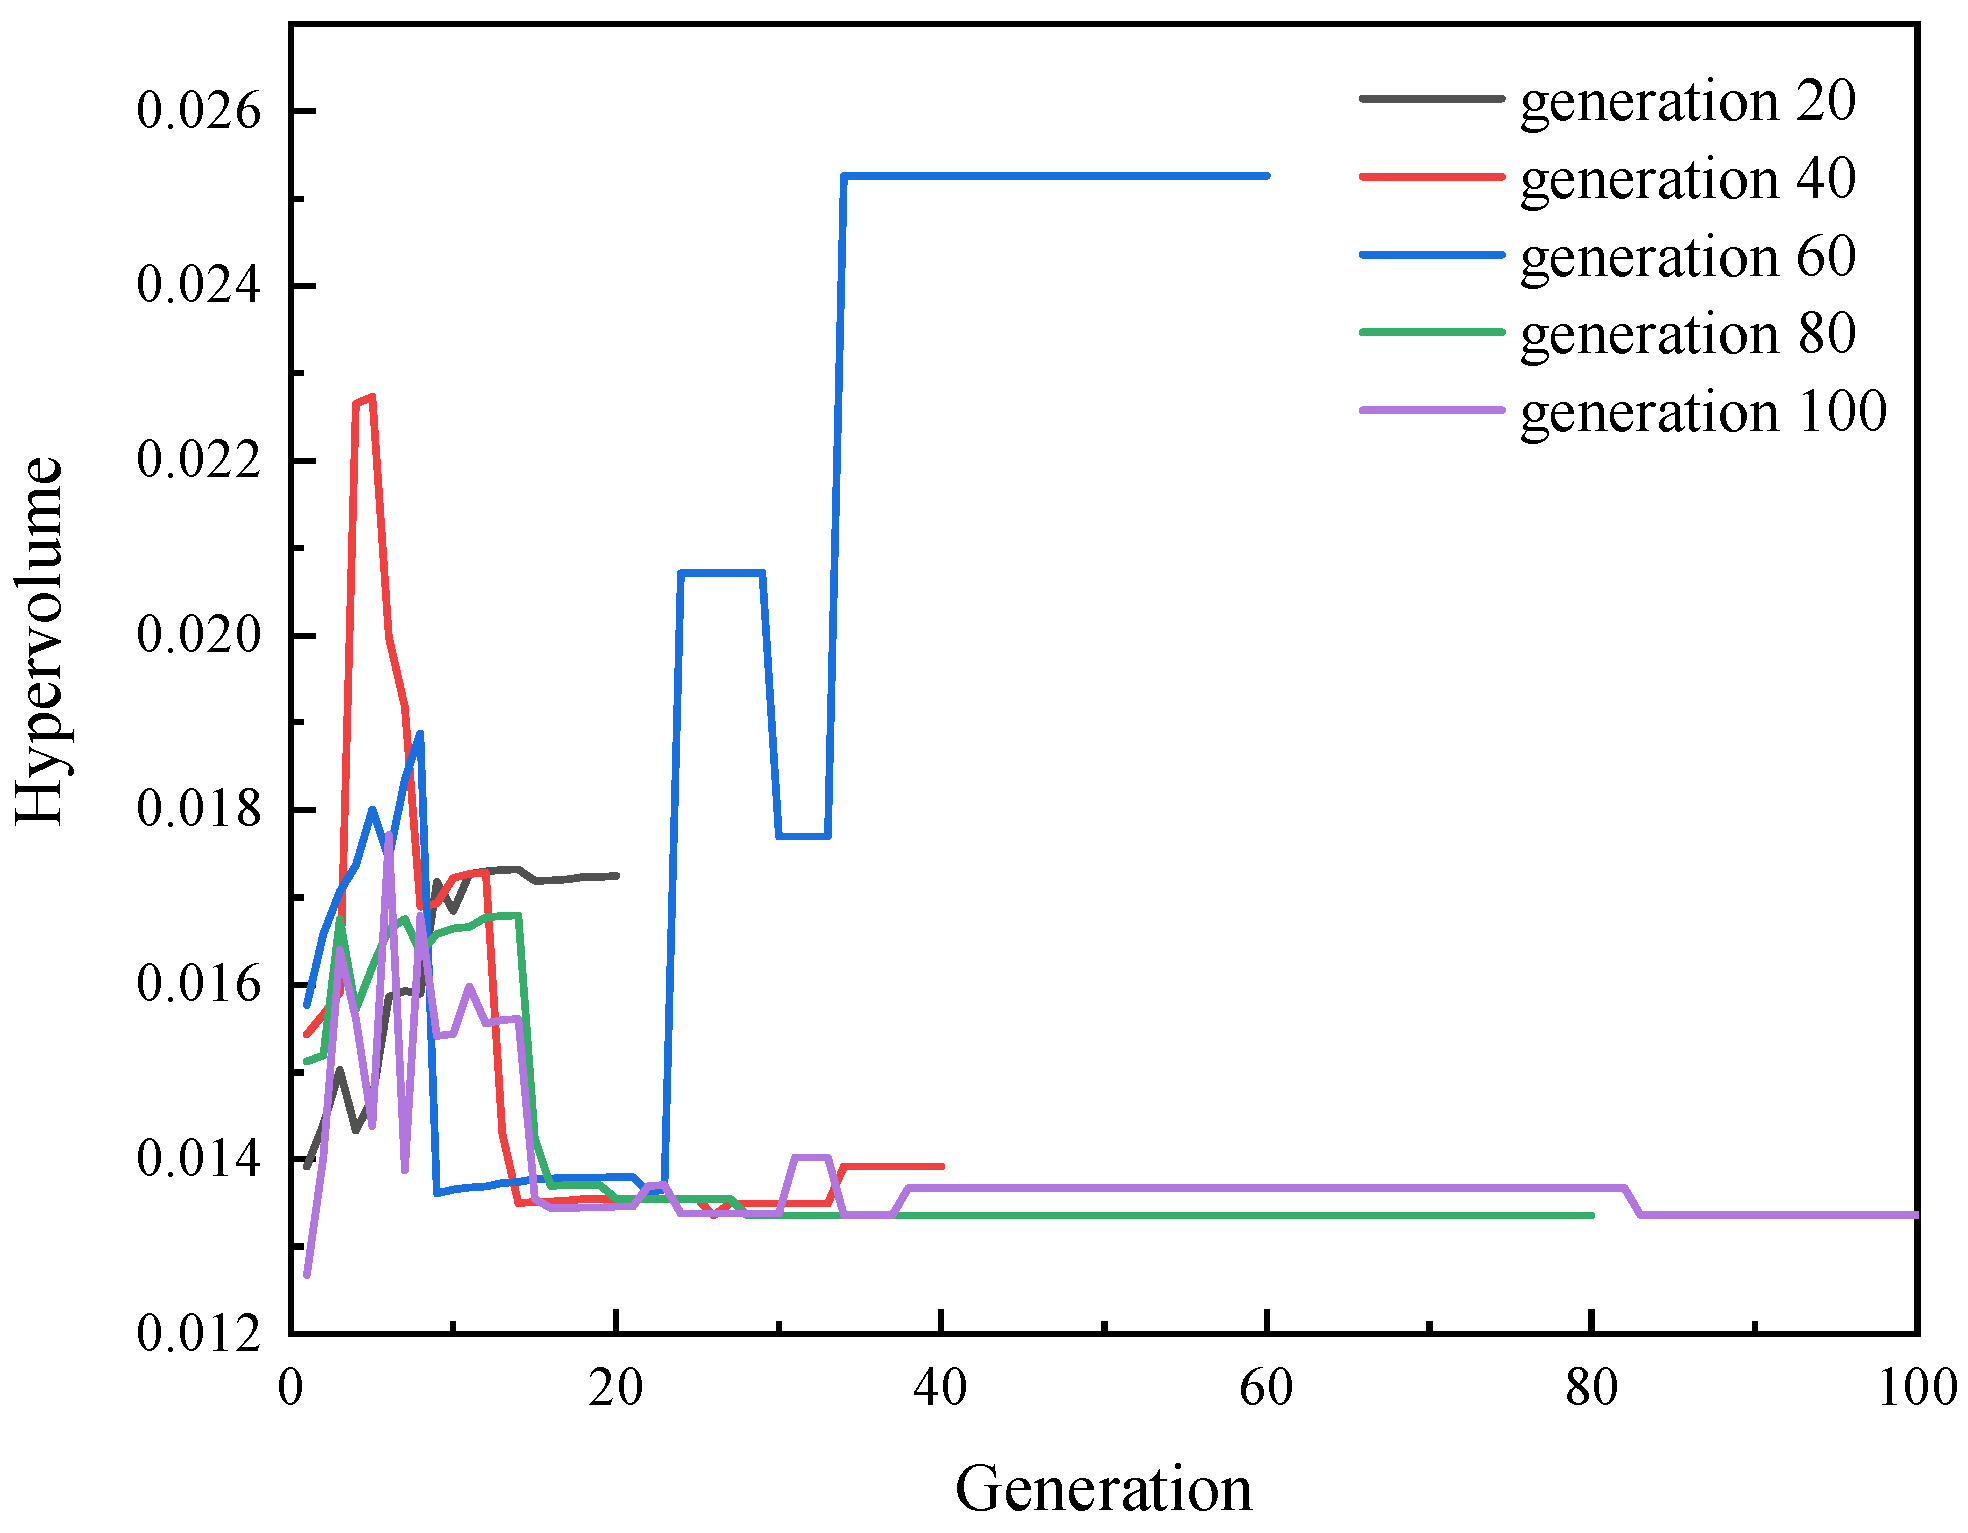
4.2. Hypervolume
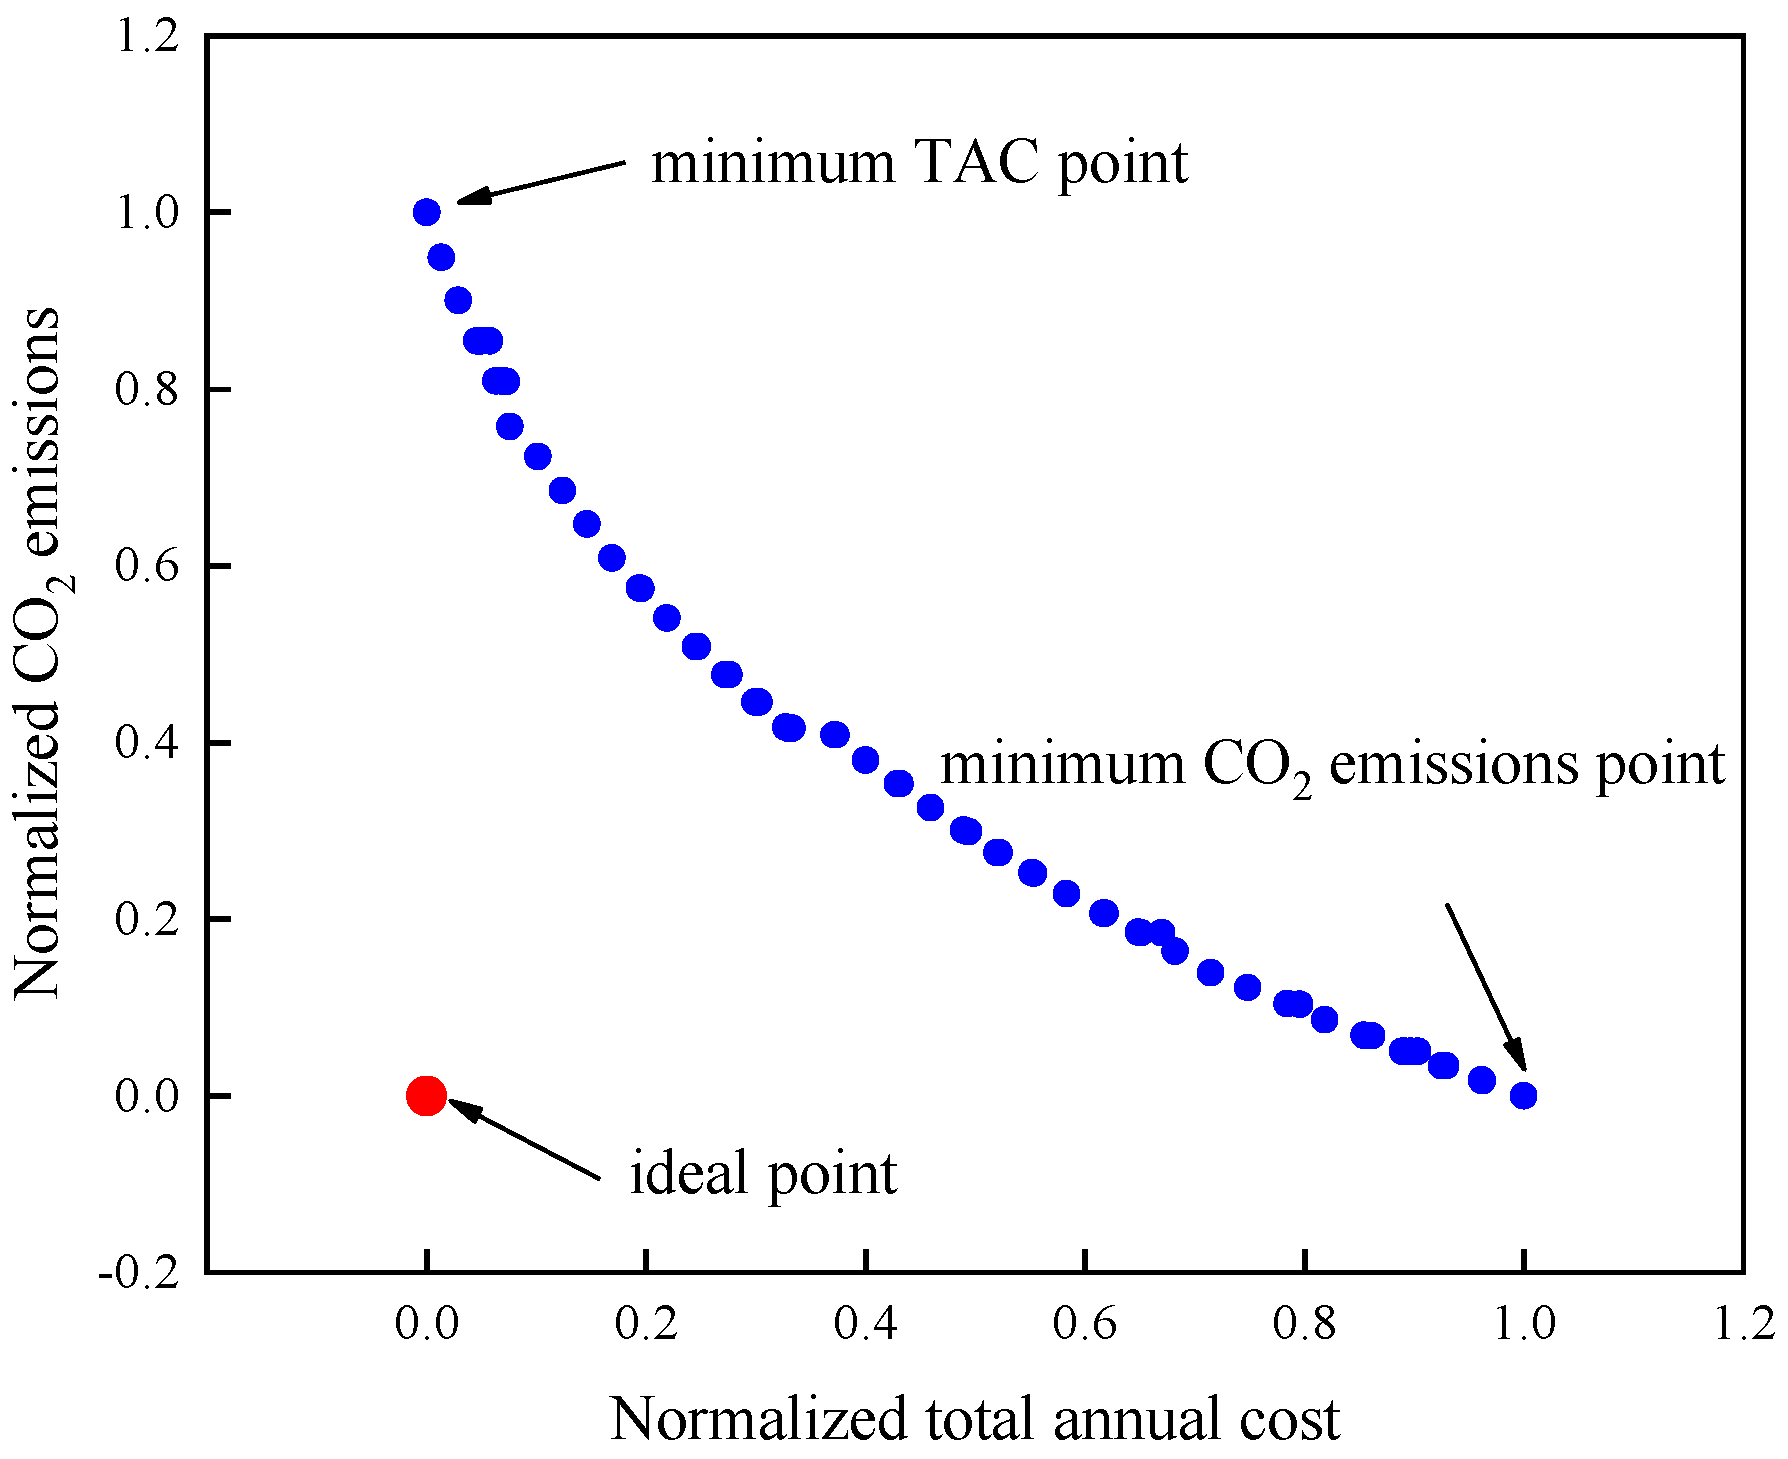
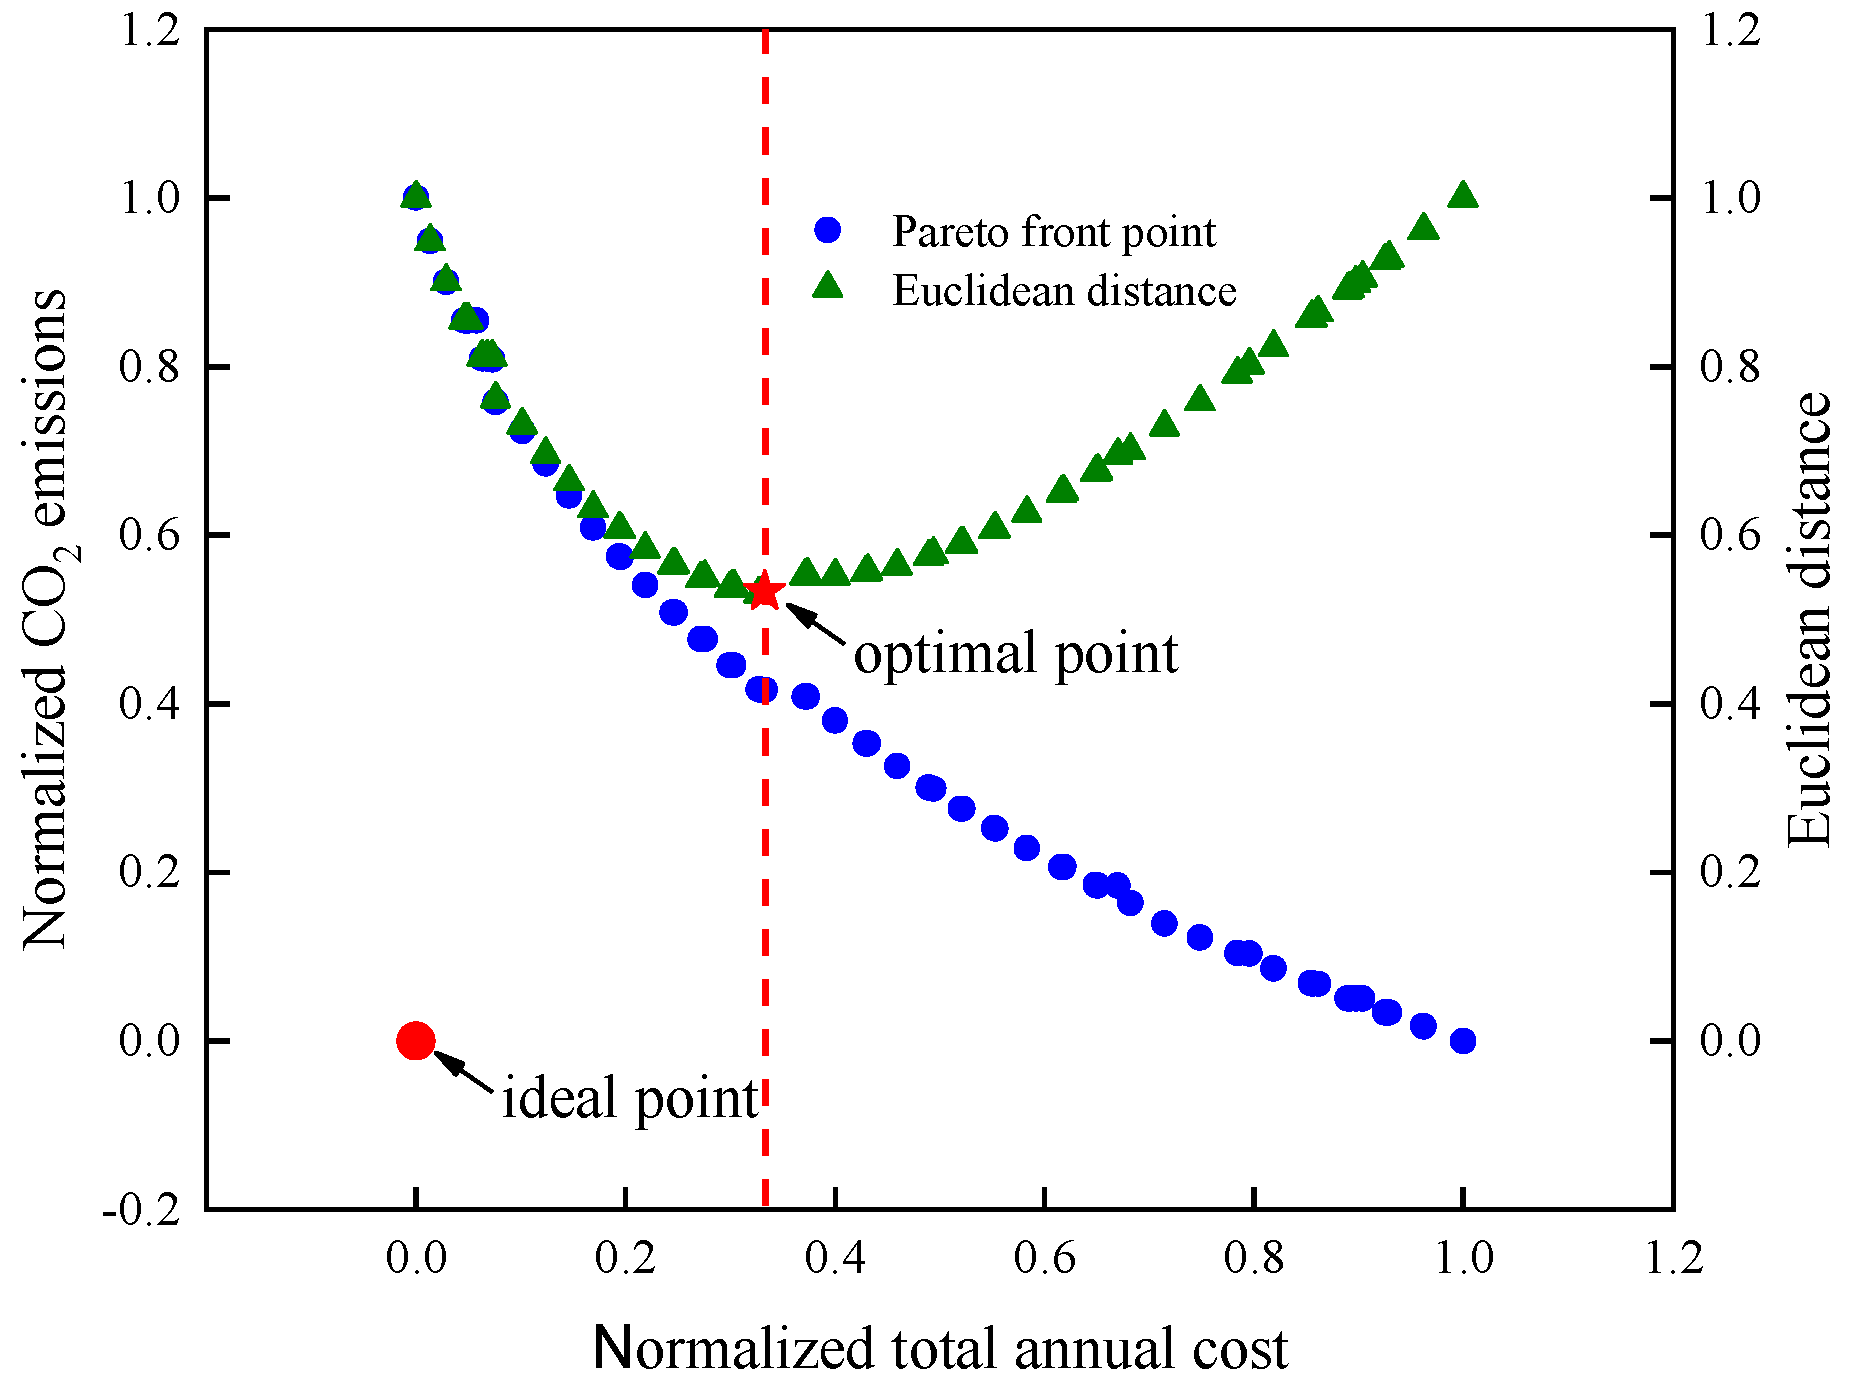
4.3. Selection of The Optimal Point
5. Conclusions
Author Contributions
Funding
Institutional Review Board Statement
Informed Consent Statement
Data Availability Statement
Conflicts of Interest
Nomenclature
| GA | Genetic algorithm |
| NSGA | Non-dominated sorting genetic algorithm |
| TAC | Total annual cost [million$] |
| T1 | The pre-run column |
| T2 | The high-pressure column |
| T3 | The atmospheric column |
| RR1 | The mole reflux ratio of T1 |
| RR2 | The mole reflux ratio of T2 |
| RR3 | The mole reflux ratio of T3 |
| Measured values of selected key quantities | |
| ϕi | Predicted model values of selected key quantities |
| k | The values of RR1, RR2, and RR3 |
| kmin | The minimum value of k |
| kmax | The maximum value of k |
| P | The population size |
| S | Solution accuracy |
| x0 | The global optimal solution |
| x | The local optimal solution |
| f1(x) | The global minimum of total annual cost [million$] |
| f2(x) | The global minimum of CO2 emissions [kt/year] |
| NTi | The total number of the ith column trays |
| NFi | The feed plate of the ith column |
| CE | The annual operating cost [million$] |
| CC | The equipment investments [million$] |
| Ppayback | The payback period |
| MLS | The annual consumption of low-pressure steam [t/year, 1 MPa] |
| MCW | The annual consumption of cooling water [t/year, 20 °C] |
| E | The annual power consumption [kW·h/year] |
| CP | The pump cost [million$] |
| CV | The column cost [million$] |
| D | The column diameter [m] |
| N | The total number of trays |
| CHE | The heat exchanger cost [million$] |
| A | The heat exchanger area [m2] |
| [CO2]emissions | The CO2 emissions [kt/year] |
| Qfuel | The amount of fuel burnt [kW] |
| α | The ratio of molar masses of CO2 and C |
| NHV | The net heating value of fuel with carbon content of C% [kJ/kg] |
| ObjV | The matrix of storing the objective function value |
| CVV | The matrix of storing the constraint violation value |
| IGD | The indicator generational distance |
| U | The point set uniformly distributed on the real Pareto surface |
| |U| | The number of individuals |
| Q | The optimal Pareto solution set |
| d (v, Q) | The minimum Euclidean distance from individual ν to population |
| HV | The hypervolume index |
| δ | The measurement of volume |
| |S| | The number of non-dominated solution sets |
| νi | The super volume formed by the reference point |
| TOPSIS | The technique for order preference by similarity to an ideal solution |
Appendix A

| Component | Mass Fraction |
|---|---|
| carbon monoxide | 0.0233 |
| carbon dioxide | 0.0002 |
| hydrogen | 0.0001 |
| nitrogen | 0.0019 |
| methane | 0.0001 |
| methanol | 0.8902 |
| water | 0.0767 |
| dimethyl ether | 0.0020 |
| n-butanol | 0.0046 |
| acetone | 0.0007 |
| ethanol | 0.0002 |
References
- Sun, J.S.; Li, X.G. A hybrid design combining double-effect thermal integration and heat pump to the methanol distillation process for improving energy efficiency. Chem. Eng. Process. 2017, 119, 81–92. [Google Scholar]
- Tijm, P.J.A.; Waller, F.J.; Brown, D.M. Methanol technology developments for the new millennium. Appl. Catal. A-Gen. 2001, 221, 275–282. [Google Scholar] [CrossRef]
- Cantero, C.A.T.; Zuniga, R.P.; Garcia, M.M.; Cabral, S.R.; Calixto-Rodriguez, M.; Martinez, J.S.V.; Enriquez, M.G.M.; Estrada, A.J.P.; Torres, G.O.; Vazquez, F.D.S.; et al. Design and control applied to an extractive distillation column with salt for the production of bioethanol. Processes 2022, 10, 1792. [Google Scholar] [CrossRef]
- Guzman-Martinez, C.E.; Maya-Yescas, R.; Castro-Montoya, A.J.; Rivera, F.N. Dynamic simulation of control systems for bioethanol reactive dehydration: Conventional and intensified case studies. Chem. Eng. Process. 2021, 159, 108238. [Google Scholar] [CrossRef]
- Cantero, C.A.T.; Lopez, G.L.; Alvarado, V.M.; Jimenez, R.F.E.; Morales, J.Y.R.; Coronado, E.M.S. Control structures evaluation for a salt extractive distillation pilot plant: Application to bio-ethanol dehydration. Energies 2017, 10, 1276. [Google Scholar] [CrossRef]
- De Figueiredo, M.F.; Brito, K.D.; Ramos, W.B.; Vasconcelos, L.G.S.; Brito, R.P. Effect of solvent content on the separation and the energy consumption of extractive distillation columns. Chem. Eng. Commun. 2015, 202, 1191–1199. [Google Scholar] [CrossRef]
- Yin, C.F.; Liu, G.L. Optimization of solvent and extractive distillation sequence considering its integration with reactor. Processes 2021, 9, 565. [Google Scholar] [CrossRef]
- Xue, X.C.; Gu, Q.F.; Pascal, H.; Darwesh, O.M.; Zhang, B.; Li, Z.Q. Simulation and optimization of three-column triple-effect methanol distillation scheme. Chem. Eng. Process. 2020, 159, 108229. [Google Scholar] [CrossRef]
- Errico, M.; Pirellas, P.; Torres-Ortega, C.E.; Rong, B.G.; Segovia-Hernandez, J.G. A combined method for the design and optimization of intensified distillation systems. Chem. Eng. Process. 2014, 85, 69–76. [Google Scholar] [CrossRef]
- Contreras-Zarazúa, G.; Vázquez-Castillo, J.A.; Ramírez-Márquez, C.; Segovia-Hernández, J.G.; Alcántara-Ávila, J.R. Multi-objective optimization involving cost and control properties in reactive distillation processes to produce diphenyl carbonate. Comput. Chem. Eng. 2016, 105, 185–196. [Google Scholar] [CrossRef]
- Alcocer-García, H.; Segovia-Hernández, J.G.; Prado-Rubio, O.A.; Sánchez-Ramírez, E.; Quiroz-Ramírez, J.J. Multi-objective optimization of intensified processes for the purification of levulinic acid involving economic and environmental objectives. Chem. Eng. Process. 2019, 136, 123–137. [Google Scholar] [CrossRef]
- Tarafder, A.; Lee, B.; Ray, A.K.; Rangaiah, G.P. Multiobjective optimization of an industrial ethylene reactor using a nondominated sorting genetic algorithm. Ind. Eng. Chem. Res. 2005, 44, 124–141. [Google Scholar] [CrossRef]
- Mariano, A.P.; Borba Costa, C.B.; de Angelis, D.d.F.; Maugeri Filho, F.; Pires Atala, D.I.; Wolf Maciel, M.R.; Maciel Filho, R. Optimization of a fermentation process for butanol production by particle swarm optimization (PSO). J. Chem. Technol. Biot. 2010, 85, 934–949. [Google Scholar] [CrossRef]
- Deb, K.; Jain, H. An evolutionary many-objective optimization algorithm using reference-point-based nondominated sorting approach, part I: Solving problems with box constraints. IEEE Trans. Evol. Comput. 2014, 18, 577–601. [Google Scholar] [CrossRef]
- Pan, J.C.; Ding, J.H.; Zhang, C.D.; Wan, H.; Guan, G.F. Optimization and control for separation of ethyl benzene from C8 aromatic hydrocarbons with extractive distillation. Processes 2022, 10, 2237. [Google Scholar] [CrossRef]
- Hou, Y.; Wu, N.Q.; Li, Z.W.; Zhang, Y.X.; Qu, T.; Zhu, Q.H. Many-objective optimization for scheduling of crude oil operations based on NSGA-III with consideration of energy efficiency. Swarm Evol. Comput. 2020, 57, 100714. [Google Scholar] [CrossRef]
- Brambilla, A.; Vaccari, M.; Pannocchia, G. Analytical RTO for a critical distillation process based on offline rigorous simulation. IFAC-Pap. 2022, 55, 143–148. [Google Scholar] [CrossRef]
- Vaccari, M.; Pannocchia, G.; Tognotti, L.; Paci, M. Rigorous simulation of geothermal power plants to evaluate environmental performance of alternative configurations. Renew. Energy 2023, 207, 471–483. [Google Scholar] [CrossRef]
- Hu, Z.H.; Li, P.L.; Liu, Y.F. Enhancing the performance of evolutionary algorithm by differential evolution for optimizing distillation sequence. Molecules 2022, 27, 3802. [Google Scholar] [CrossRef]
- Su, Y.; Jin, S.M.; Zhang, X.P.; Shen, W.F.; Eden, M.R.; Ren, J.Z. Stakeholder-oriented multi-objective process optimization based on an improved genetic algorithm. Comput. Chem. Eng. 2019, 132, 106618. [Google Scholar] [CrossRef]
- Douglas, J.M. Conceptual Design of Chemical Processes; McGraw-Hill, Inc.: New York, NY, USA, 1998. [Google Scholar]
- Luyben, W.L. A counter-intuitive heuristic for specifying the composition of recycle streams. Chem. Eng. Process. 2018, 133, 234–244. [Google Scholar] [CrossRef]
- Gadalla, M.A.; Olujic, Z.; Jansens, P.J.; Jobson, M.; Smith, R. Reducing CO2 emissions and energy consumption of heat-integrated distillation systems. Environ. Sci. Technol. 2005, 39, 6860–6870. [Google Scholar] [CrossRef] [PubMed]
- Czyzak, P.; Jaszkiewicz, A. Pareto simulated annealing-a metaheuristic technique for multiple-objective combinatorial optimization. J. Multi-Crit. Decis. Anal. 1998, 7, 34–47. [Google Scholar] [CrossRef]
- Zitzler, E. Evolutionary Algorithms for Multiobjective Optimization: Methods and Applications. Ph.D. Thesis, Swiss Federal Institute of Technology, Zürich, Switzerland, 1999. [Google Scholar]
- Yoon, K.S.; Hwang, C.L. Manufacturing plant location analysis by multiple attribute decision making: Part I—Single-plant strategy. Int. J. Prod. Res. 1985, 23, 345–359. [Google Scholar] [CrossRef]


| Quantity | Initial Values | Optimal Values |
|---|---|---|
| RR1 | 1.053 | 0.085 |
| RR2 | 0.715 | 1.169 |
| RR3 | 0.732 | 0.605 |
| Operating Parameters | Calibration Values | Simulation | Relative Error |
|---|---|---|---|
| T1 top/bottom temperature (°C) | 82/90 | 82.7/90.1 | 0.85%/0.11% |
| T2 top/bottom temperature (°C) | 127.2/135 | 128.7/134.4 | 1.18%/0.44% |
| T3 top/bottom temperature (°C) | 41/116 | 41/116.8 | 0.00%/0.69% |
| Refined methanol flow rate (t/h) | 149.591 | 149.592 | 0.00067% |
| Process water flow rate (t/h) | 12.600 | 12.472 | 1.02% |
| Side stream flow rate (t/h) | 1.250 | 1.359 | 8.72% |
| Parameter Values | ||||
|---|---|---|---|---|
| a | B | c | d | R2 |
| 78.34715 | −0.00163 | −77.37291 | −0.00165 | 0.98875 |
| Decision Variables | Range |
|---|---|
| Total number of T1 trays | [30, 60] |
| The ratio of the index number of feed plate to total number of T1 trays | [0.20, 0.48] |
| Total number of T2 trays | [65, 100] |
| The ratio of the index number of feed plate to total number of T2trays | [0.7, 0.95] |
| Total number of T3 trays | [65, 100] |
| The ratio of the index number of feed plate to total number of T3 trays | [0.53, 0.95] |
| Generation | Non-Dominant Individuals |
|---|---|
| 20 | 62 |
| 40 | 75 |
| 60 | 75 |
| 80 | 69 |
| 100 | 70 |
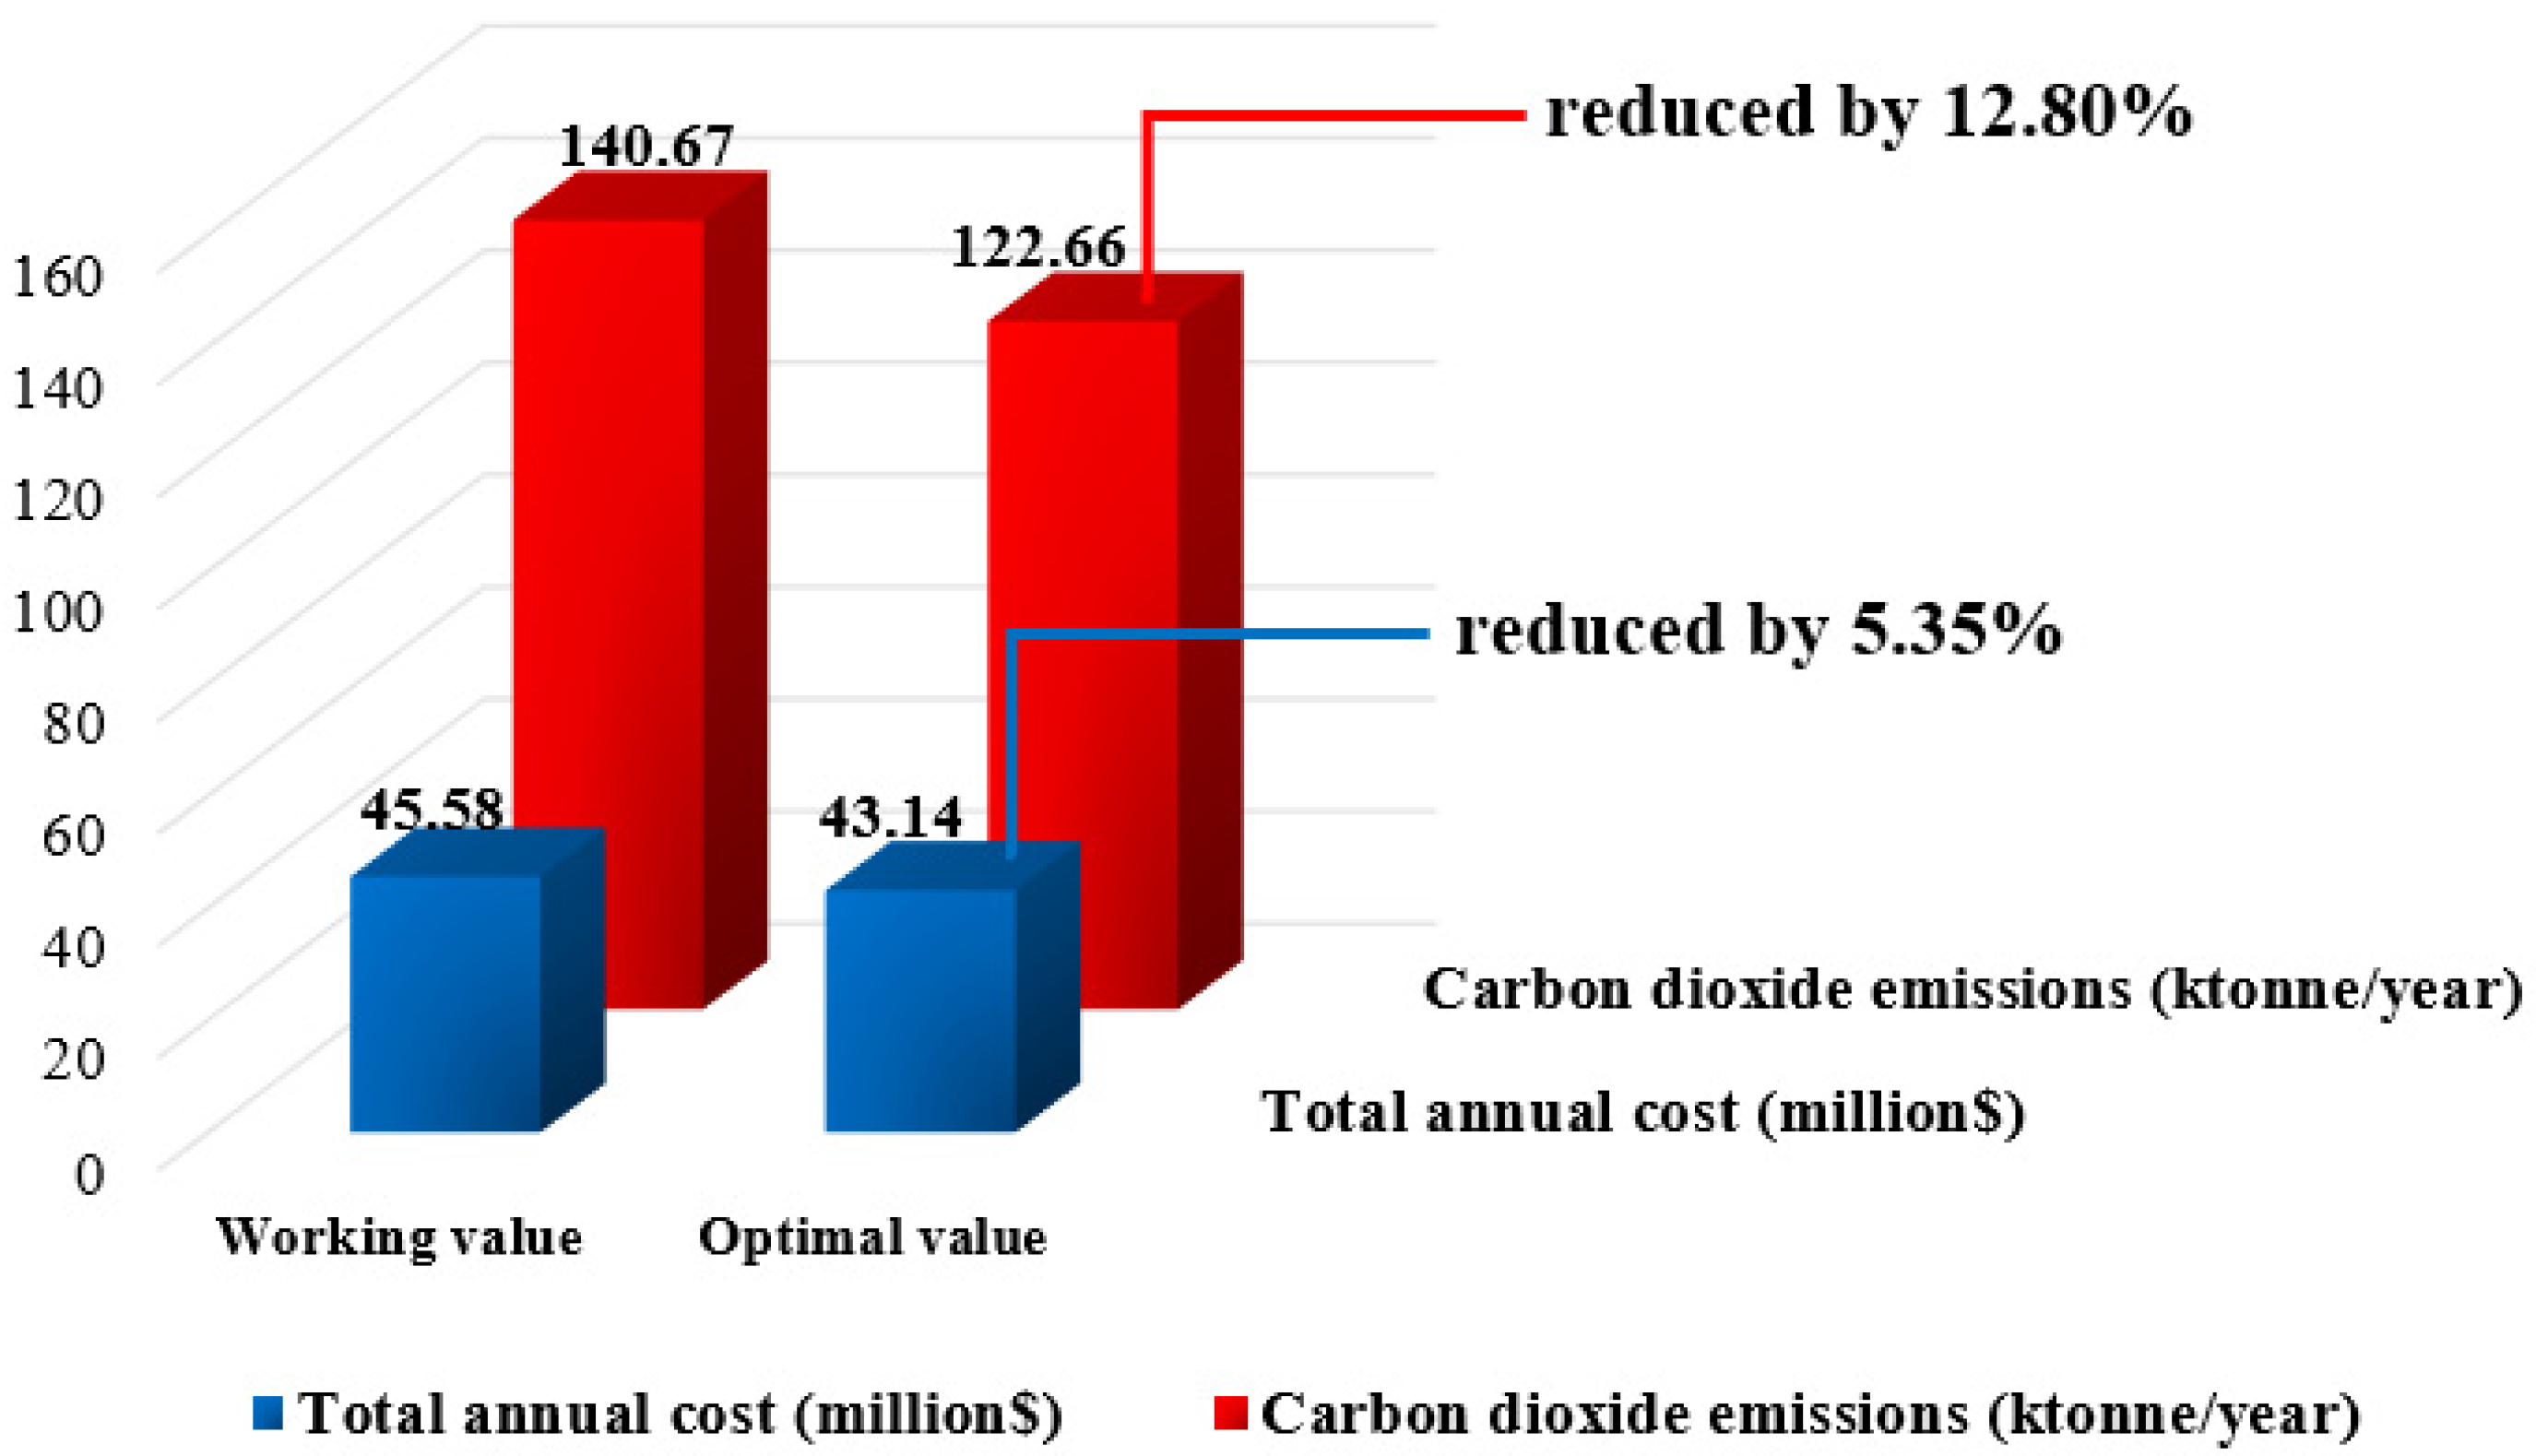
| Operating Parameters | Plant Data | Optimal Values | Adjustment Strategy |
|---|---|---|---|
| Total number of T1 trays | 40 | 30 | ↓ |
| The index number of feed plate in T1 | 11 | 9 | ↓ |
| Total number of T2 trays | 85 | 80 | ↓ |
| The index number of feed plate in T2 | 76 | 76 | - |
| Total number of T3 trays | 85 | 65 | ↓ |
| The index number of feed plate in T3 | 62 | 35 | ↓ |
| TAC (million$) | 45.58 | 43.14 | |
| CO2 emissions (kt/year) | 140.67 | 122.66 |
Disclaimer/Publisher’s Note: The statements, opinions and data contained in all publications are solely those of the individual author(s) and contributor(s) and not of MDPI and/or the editor(s). MDPI and/or the editor(s) disclaim responsibility for any injury to people or property resulting from any ideas, methods, instructions or products referred to in the content. |
© 2023 by the authors. Licensee MDPI, Basel, Switzerland. This article is an open access article distributed under the terms and conditions of the Creative Commons Attribution (CC BY) license (https://creativecommons.org/licenses/by/4.0/).
Share and Cite
Chen, W.; Hu, Z.; Gao, X.; Liu, Y. Simulation and Multi-Objective Optimization of Three-Column Double-Effect Methanol Distillation by NSGA-III Algorithm. Processes 2023, 11, 1515. https://doi.org/10.3390/pr11051515
Chen W, Hu Z, Gao X, Liu Y. Simulation and Multi-Objective Optimization of Three-Column Double-Effect Methanol Distillation by NSGA-III Algorithm. Processes. 2023; 11(5):1515. https://doi.org/10.3390/pr11051515
Chicago/Turabian StyleChen, Weiye, Zehua Hu, Xuechao Gao, and Yefei Liu. 2023. "Simulation and Multi-Objective Optimization of Three-Column Double-Effect Methanol Distillation by NSGA-III Algorithm" Processes 11, no. 5: 1515. https://doi.org/10.3390/pr11051515