Article

Highly Efficient CO2 Capture and Utilization of Coal and Coke-Oven Gas Coupling for Urea Synthesis Process Integrated with Chemical Looping Technology: Modeling, Parameter Optimization, and Performance Analysis

1
The 404 Company Limited, China National Nuclear Corporation, Jiayuguan 735100, China
2
College of Petrochemical Technology, Lanzhou University of Technology, Lanzhou 730050, China
*
Author to whom correspondence should be addressed.
Processes 2023, 11(3), 960; https://doi.org/10.3390/pr11030960
Submission received: 23 February 2023 / Revised: 16 March 2023 / Accepted: 18 March 2023 / Published: 21 March 2023

Abstract

:
The resource endowment structure of being coal-rich and oil-poor makes China’s production of coal-based ammonia and urea, with a low production cost and a good market, a competitive advantage. However, the process suffers from high CO2 emissions and low energy efficiency and carbon utilization efficiency due to the mismatch of hydrogen-to-carbon ratio between raw coal and chemicals. Based on the coal-to-urea (CTU) process and coal-based chemical looping technology for urea production processes (CTUCLAS&H), a novel urea synthesis process from a coal and coke-oven gas-based co-feed chemical looping system (COG-CTUCLAS&H) is proposed in this paper. By integrating chemical looping air separation and chemical looping hydrogen production technologies and the synergies between coal gasification, low-energy consumption CO2 capture and CO2 utilization are realized; the excess carbon emissions of the CTU process are avoided through coupling the pressure swing adsorption of COG, and the low carbon emissions of the proposed system are obtained. In this work, the novel process is studied from three aspects: key unit modeling, parameter optimization, and technical-economic evaluation. The results show that COG-CTUCLAS&H achieves the highest system energy efficiency (77.10%), which is much higher than that of the CTU and CTUCLAS&H processes by 40.03% and 32.80%, respectively, when the optimized ratio of COG to coal gasified gas is 1.2. The carbon utilization efficiency increases from 35.67% to 78.94%. The product cost of COG-CTUCLAS&H is increased compared to CTU and CTUCLAS&H, mainly because of the introduction of COG, but the technical performance advantages of COG-CTUCLAS&H make its economic benefits obvious, and the internal rate of return of COG-CTUCLAS&H is 26%, which is larger than the 14% and 16% of CTU and CTUCLAS&H, respectively. This analysis will enable a newly promising direction of coal and COG-based co-feed integrated chemical looping technology for urea production.

Graphical Abstract

1. Introduction

As the most widely used nitrogen fertilizer, urea plays a vital role in the growing agriculture demand in the world. It is also a raw material for many important compounds, such as various plastics. According to the latest forecast by IFA, by 2020, the global urea production capacity will reach 229 million tons/year, and this will continue to grow [1]. Urea has the advantages of high-water solubility, low volatility, non-toxic ideal energy density, and high hydrogen content [2]. In addition, the energy density of urea is higher than liquid hydrogen; thus, urea is also regarded as a promising H2 carrier. Therefore, the low-carbon process for urea production has become a research hotspot.
The main industrial route for urea production is initially producing ammonia and carbon dioxide from fossil energy (e.g., coal- and natural gas-based). As one of the main raw materials for synthesizing urea production, more than 80% of ammonia is used as nitrogen fertilizer [3]. Nearly all commercial production of ammonia is based on the Haber–Bosch synthesis process through the synthesis of N2 and H2 (N2/H2 = 1/3) at 450–600 °C and 10–250 bar [4]. The hydrogen is mainly derived from coal, natural gas, and other fossil fuels. The production of H2 mainly relies on coal and coke, and about 97% of H2 comes from these two feedstocks [5]. For the coal-to-hydrogen process, coal reacts with O2 to produce crude syngas, and after scrubbing and waste heat recovery, the crude syngas is delivered into the water–gas shift unit (WGS), in which CO and H2O are converted to CO2 and H2. Thus, a large amount of CO2 is generated in WGS [6,7]. In order to avoid the toxic catalyzer of NH3 synthesis, CO2 is split from the H2-rich steam in the acid gas removal unit (AGR). The AGR is a high operational cost unit mainly because a larger amount of energy is consumed.
According to the literature review, the chemical looping hydrogen (CLH) technology developed from chemical looping combustion (CLC) has tremendous potential for converting fuel into hydrogen production [8]. In this method, CO2 and H2 are generated in different reactors, which illustrates that purified CO2 and H2 are obtained relatively more easily than traditional AGR through gas–solid separation and condensation procedures. It is indicated that the energy consumption for CO2/H2 separation is decreased obviously [9,10,11]. Many studies have explored that the CLH technology as a competitive method was used for low-carbon and clean hydrogen production. Ohio State University (OSU) developed and studied two looping processes: the syngas chemical looping (SCL) and the coal direct chemical looping (CDCL) technologies. The combined SCL and CDCL were continuously operated for more than 850 h, and the hydrogen with a purity of more than 99.99% and a carbon capture ratio of 100% were obtained [12]. Edrisi et al. [13] investigated an iron-based oxygen carrier chemical looping technique to convert methane and air into CO2, N2, and H2. Recently, Edrisi et al. [14] used N2 and H2 produced by chemical looping technology for ammonia synthesis. The yield of ammonia products is increased by 30%, and the investment cost is significantly reduced. Mehrpooya et al. [15] developed a new process for H2 production and net electrical power output, including biomass gasification, CLC, and CO2 capture. The proposed integrated process showed excellent performance in terms of energy efficiency and environmental benefits.
Apart from the H2 production, coke-oven gas (COG) produced in coking plants is mostly used for combustion due to COG being rich in hydrogen. It leads to a lot of waste of resources and serious environmental problems [16,17]. Because coal is rich in carbon and low in hydrogen, it is attractive to co-feed with coal by introducing COG as a supplementary hydrogen source [18]. Scholars have studied the different conceptual designs of coal and COG co-feed systems. Hao et al. [19] developed a new poly-generation system based on coal and COG co-feed for the co-production of dimethyl ether (DME)/methanol and electricity. The system performed better than the traditional CH4/CO2 dry reforming process in terms of exergy efficiency and CO2 emission. Li et al. [20] also developed a methanol and power generation cogeneration system based on coal gasification and COG, which coupled with CO2 capture process. The results showed that the energy saving was increased by over 5%, while the exergy efficiency increased by about 50%.
The N2 required for ammonia production is obtained through air separation (AS) technology. Large-scale O2 production plants commonly use cryogenic air separation (CAS). However, CAS is characterized by high energy consumption; it is reported that the specific energy of O2 production (95% vol.%) is 200 kWh/t [21]. To seek a more economical and energy-saving O2 production process, a potentially promising technology, chemical looping air separation (CLAS) technology, has gradually attracted the attention of scholars. It is a kind of oxygen absorption and oxygen release reaction in different reactors to achieve pure oxygen production [22]. Due to its simple process, the equipment investment cost is lower than that of traditional CAS. In addition, the heat-absorbing of metal oxides is mostly provided by the heat-releasing of exothermic metal oxidation; thus, the operational cost of CLAS is decreased obviously [23]. Newcastle university concluded that CLAS technology has great potential to replace traditional CAS through a series of experiments and modeling studies on CLAS technologies [24]. Shi et al. [25] studied a novel CLAS system and analyzed the technical/economic performance of different oxygen carriers, and the results showed that Mn-based CLAS can significantly increase the energy efficiency of the oxidation reaction and reduce the size of the reactor under specific oxidation conditions. Zhu et al. [26] investigated coal gasification integrated with CLAS; the key parameters were optimized and exergy efficiency was analyzed. The results showed that the largest exergy destroyer in the process is located in gasifier, which accounts for 65.06% of the total exergy destruction.
Although stacks of research have been produced on chemical looping technology and COG-assisted coal co-feed production for chemical production in the past few decades, to our knowledge, there have been few studies on integrating chemical looping technology and COG in the production of urea processes. On the one hand, CLH technology only using coal as a raw material does not improve carbon utilization efficiency, resulting in the waste of carbon resources [27]. On the other hand, the CLH process with COG as feedstock also results in relatively low energy efficiency due to the high hydrogen content of the COG [28]. Aiming at the above problems, a COG pressure swing adsorption (PSA)-assisted coal combined with CLAS and CLH technologies for urea production (COG-CTUCLAS&H) is proposed in this paper. The H2 in the COG is separated by PSA technology, and the remaining hydrogen-poor COG is used mixed with syngas from coal gasified gas (CG) as fuel for the CLH, while the N2 separated by CLAS provides the nitrogen source for the synthesis of urea. COG-CTUCLAS&H technology can efficiently produce H2 and N2, which can improve the carbon utilization efficiency of raw materials and reduce CO2 emissions. The operational parameters of the COG-CTUCLAS&H process are analyzed based on rigorous simulation for each unit using Aspen Plus software. The technical/economic performance of three processes (CTU, CTUCLAS&H, and COG-CTUCLAS&H) is conducted to verify the feasibility of the novel processes.
The rest of the paper is organized as follows: the CTU, CTUCLAS&H, and COG-CTUCLAS&H are described in Section 2. Section 3 is the methodology of technical performance and economic performance, including carbon utilization efficiency, energy efficiency, total capital investment, total production cost, and internal rate of return. Section 4 is the results and discussion, where the key operational parameters of the COG-CTUCLAS&H process are optimized to improve the system energy efficiency, and the technical and economic performance are analyzed. Conclusions are drawn in Section 5.

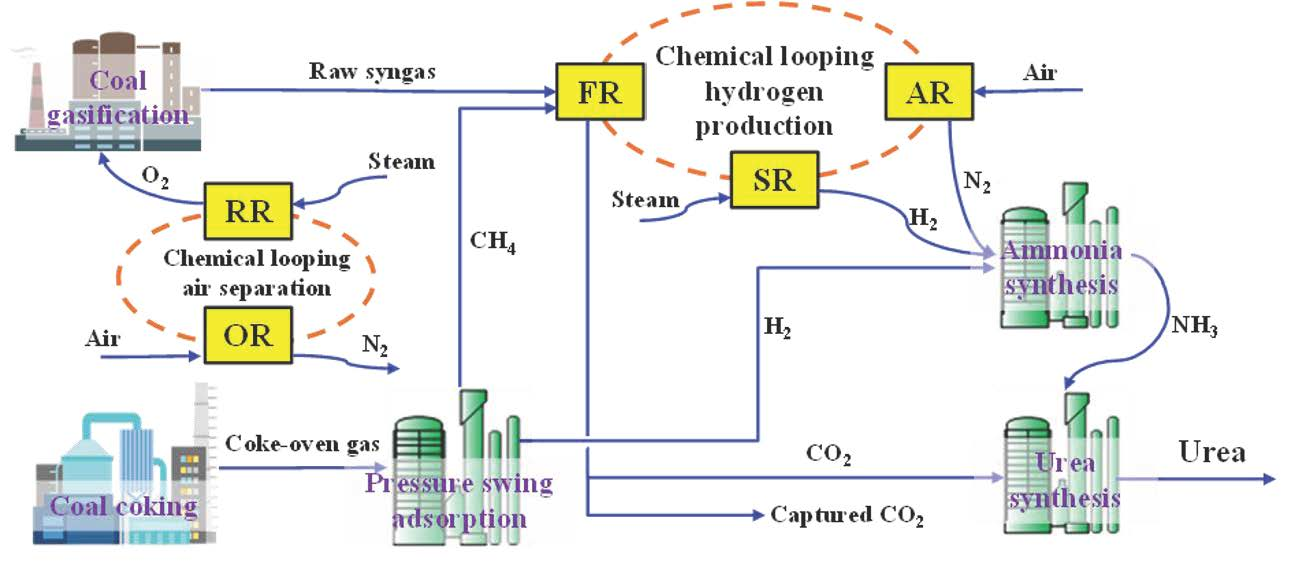
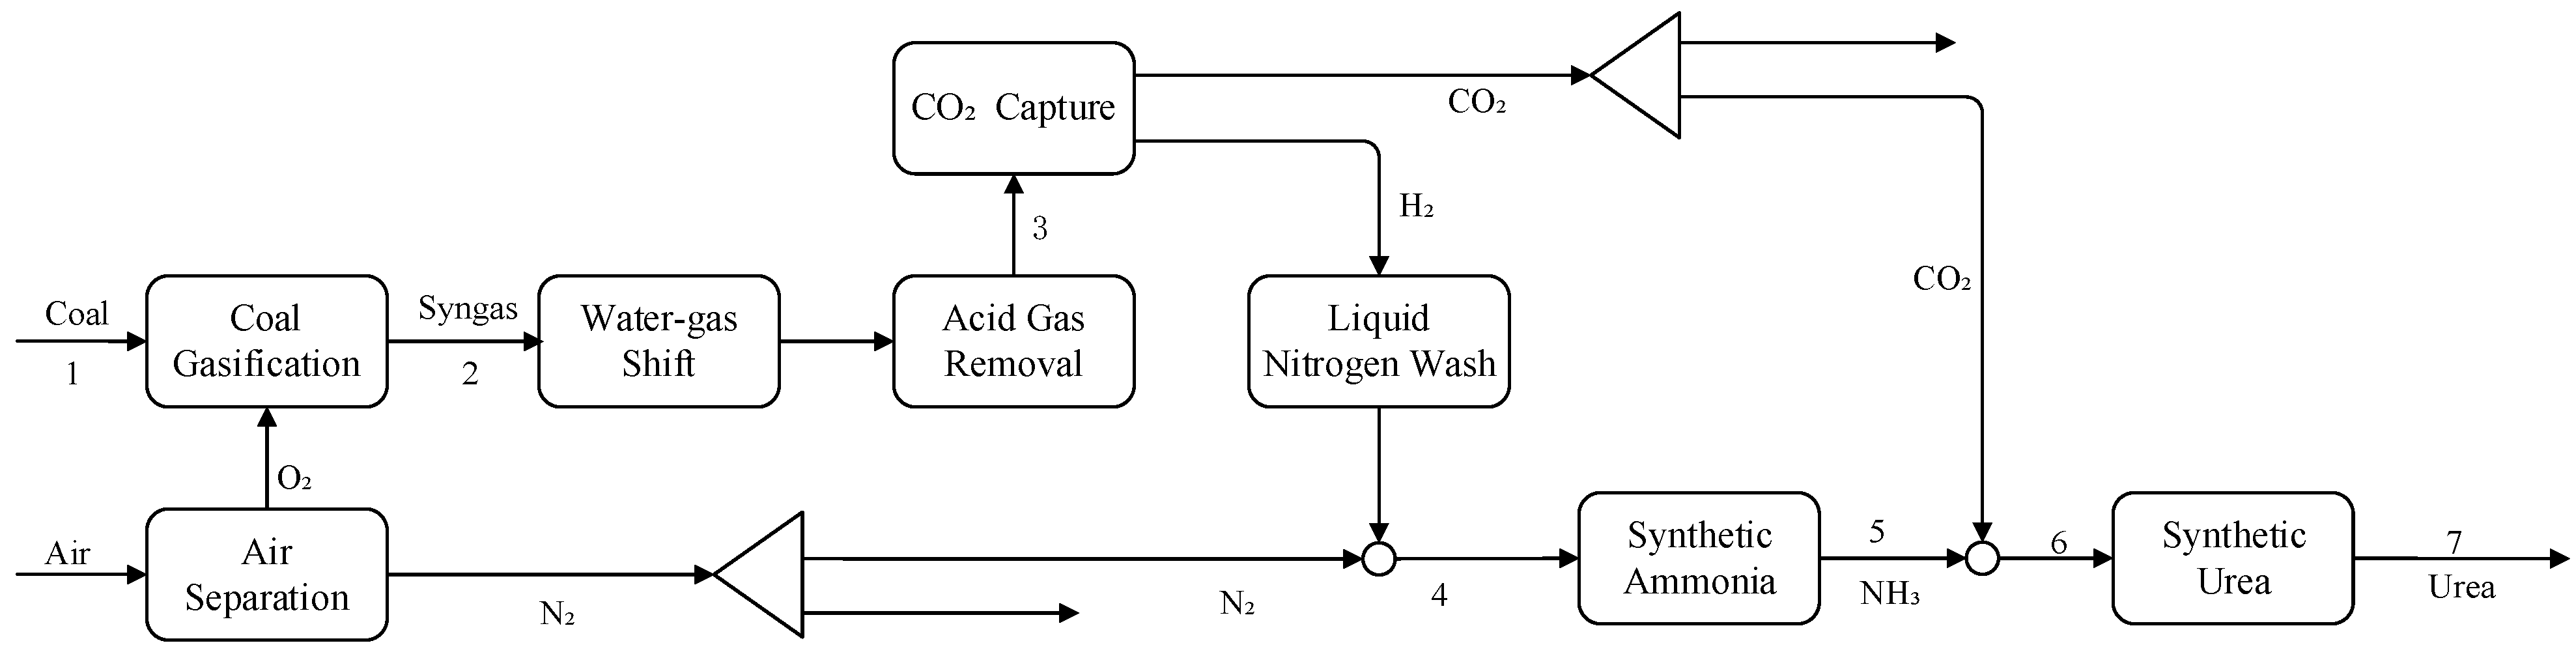
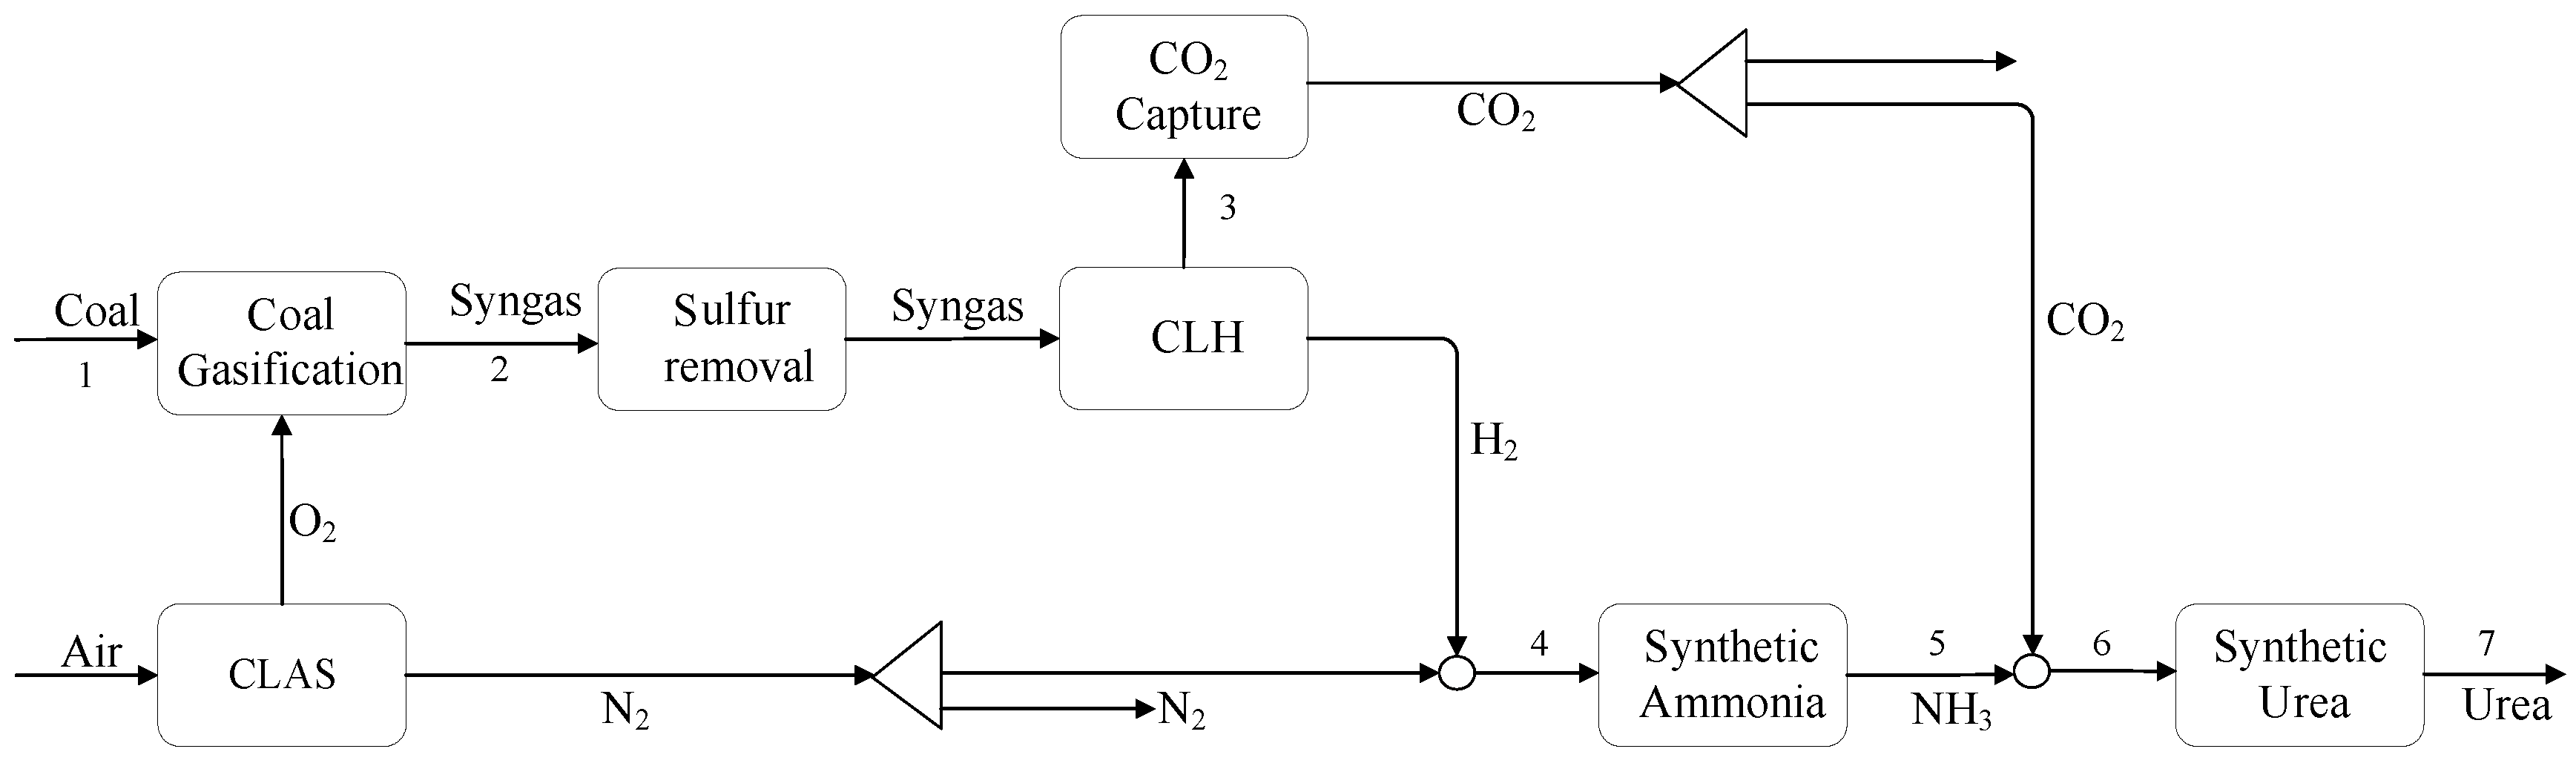
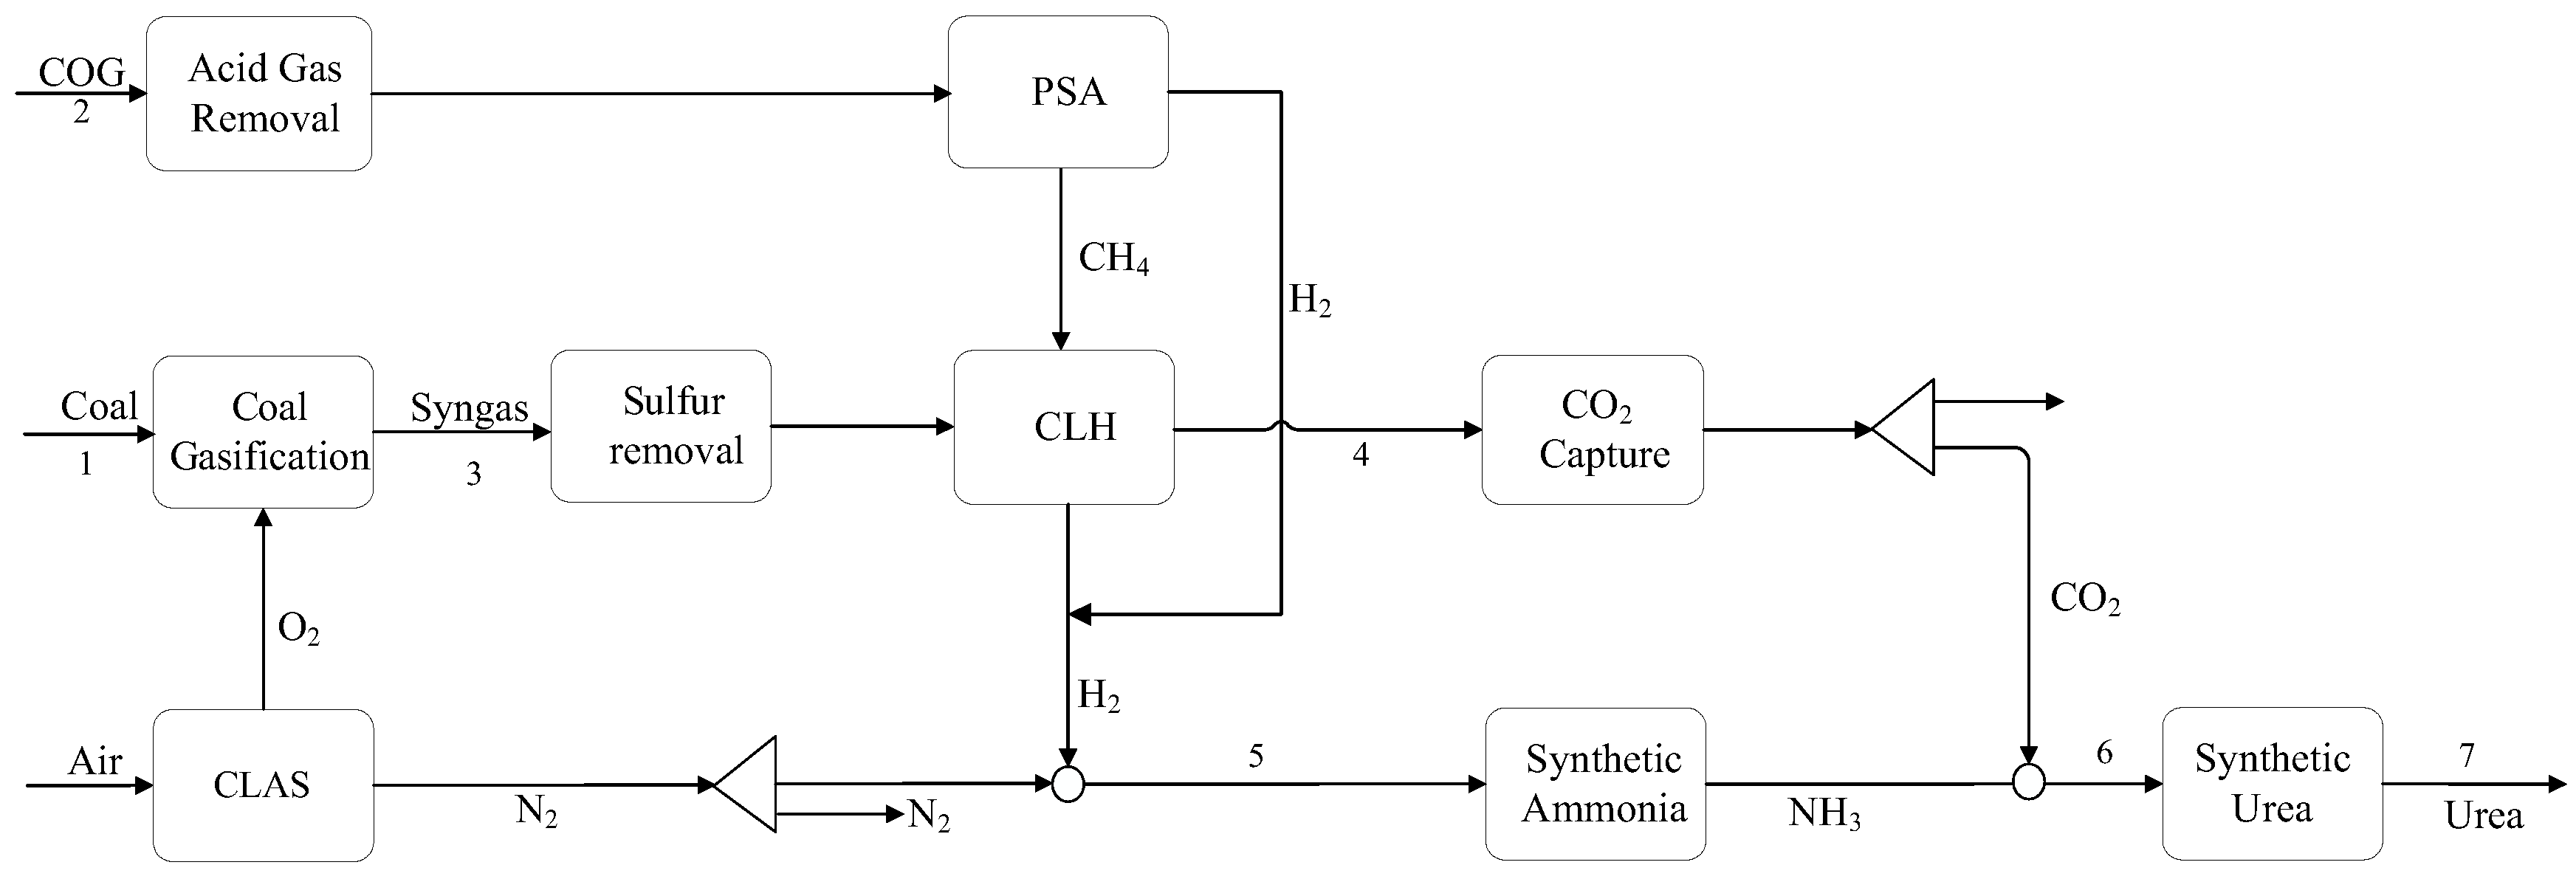
2. Scheme Design and Modeling

Conventional CTU mainly includes a cryogenic air separation unit (CAS), coal gasification unit (CGU), water–gas shift unit (WGS), acid gas removal unit (AGR), ammonia production unit (AP), and urea production unit (UP), as shown in Figure 1. The pulverized coal obtained from the raw coal after grinding and drying is mixed with water to make coal water slurry. The coal water slurry enters the gasifier and reacts with oxygen from the CAS to generate crude syngas. The crude syngas enters the WGS after acid hydrogen sulfide removal from the AGR, in which CO in syngas is converted into H2 required for ammonia production, and a large amount of CO2 is produced at the same time. The mixed gas from the WGS enters CO2 capture unit, where CO2 is separated by Rectisol technology and CO2 is used as the carbon source for urea production. The purified gas from the CO2 capture unit is further washed with liquid nitrogen to obtain pure H2. The N2 from the ASU is firstly mixed with H2 and then compressed and delivered to AP. The NH3 and the CO2 separated from the previous unit are mixed and then entered into the UP for urea production.
The flow diagram of the CTUCLAS&H process is shown in Figure 2. The CTUCLAS&H mainly includes CGU, AGR, CLAS, CLH, AP, and UP. Compared with the conventional CTU, the CTUCLAS&H adopts advanced chemical looping technology for ammonia and urea production. In the CTUCLAS&H, the CLAS replaces the conventional CAS to produce O2 and N2 with low energy consumption. In addition, the CLH replaces the conventional WGS to produce H2, and high-purity CO2 is obtained for synthetic urea. The CLH contains three reactors, a fuel reactor (FR), steam reactor (SR), and air reactor (AR). After desulfurization, the crude syngas enters the FR, reacts with oxygen carrier Fe2O3, and produces a large amount of CO2 and H2O; at the same time, the Fe2O3 is broken apart into Fe and FeO, which are introduced into the SR to react with steam for H2 production, and the Fe and FeO are converted into Fe3O4. The Fe3O4 from the SR enters the AR and is further oxidized to Fe2O3, realizing the circulation of the oxygen carrier. In the CLH, the gas and oxygen carrier can be separated by simple gas–solid separation, and CO2 and H2 are not in direct contact, which minimizes the energy consumption of gas separation and purification.
The flow diagram of the COG-CTUCLAS&H process is shown in Figure 3. The difference between COG-CTUCLAS&H and CTUCLAS&H is that coke-oven gas (COG) is introduced to produce hydrogen by pressure swing adsorption (PSA) technology in the COG-CTUCLAS&H. The separated hydrogen adds a new direct H2 source for ammonia production, while the remaining hydrogen-poor coke oven gas and syngas from coal gasification are mixed and fed into the CLH to produce hydrogen, which indirectly increases the H2 source for ammonia synthesis. The increasing ammonia production improves the capacity of CO2 for urea production. The introduction of COG in the CTUCLAS&H can realize the effective utilization of COG and generate more ammonia and urea production. In addition, the carbon utilization rate and economic benefits of the whole process are effectively improved compared with the CTU and CTUCLAS&H.

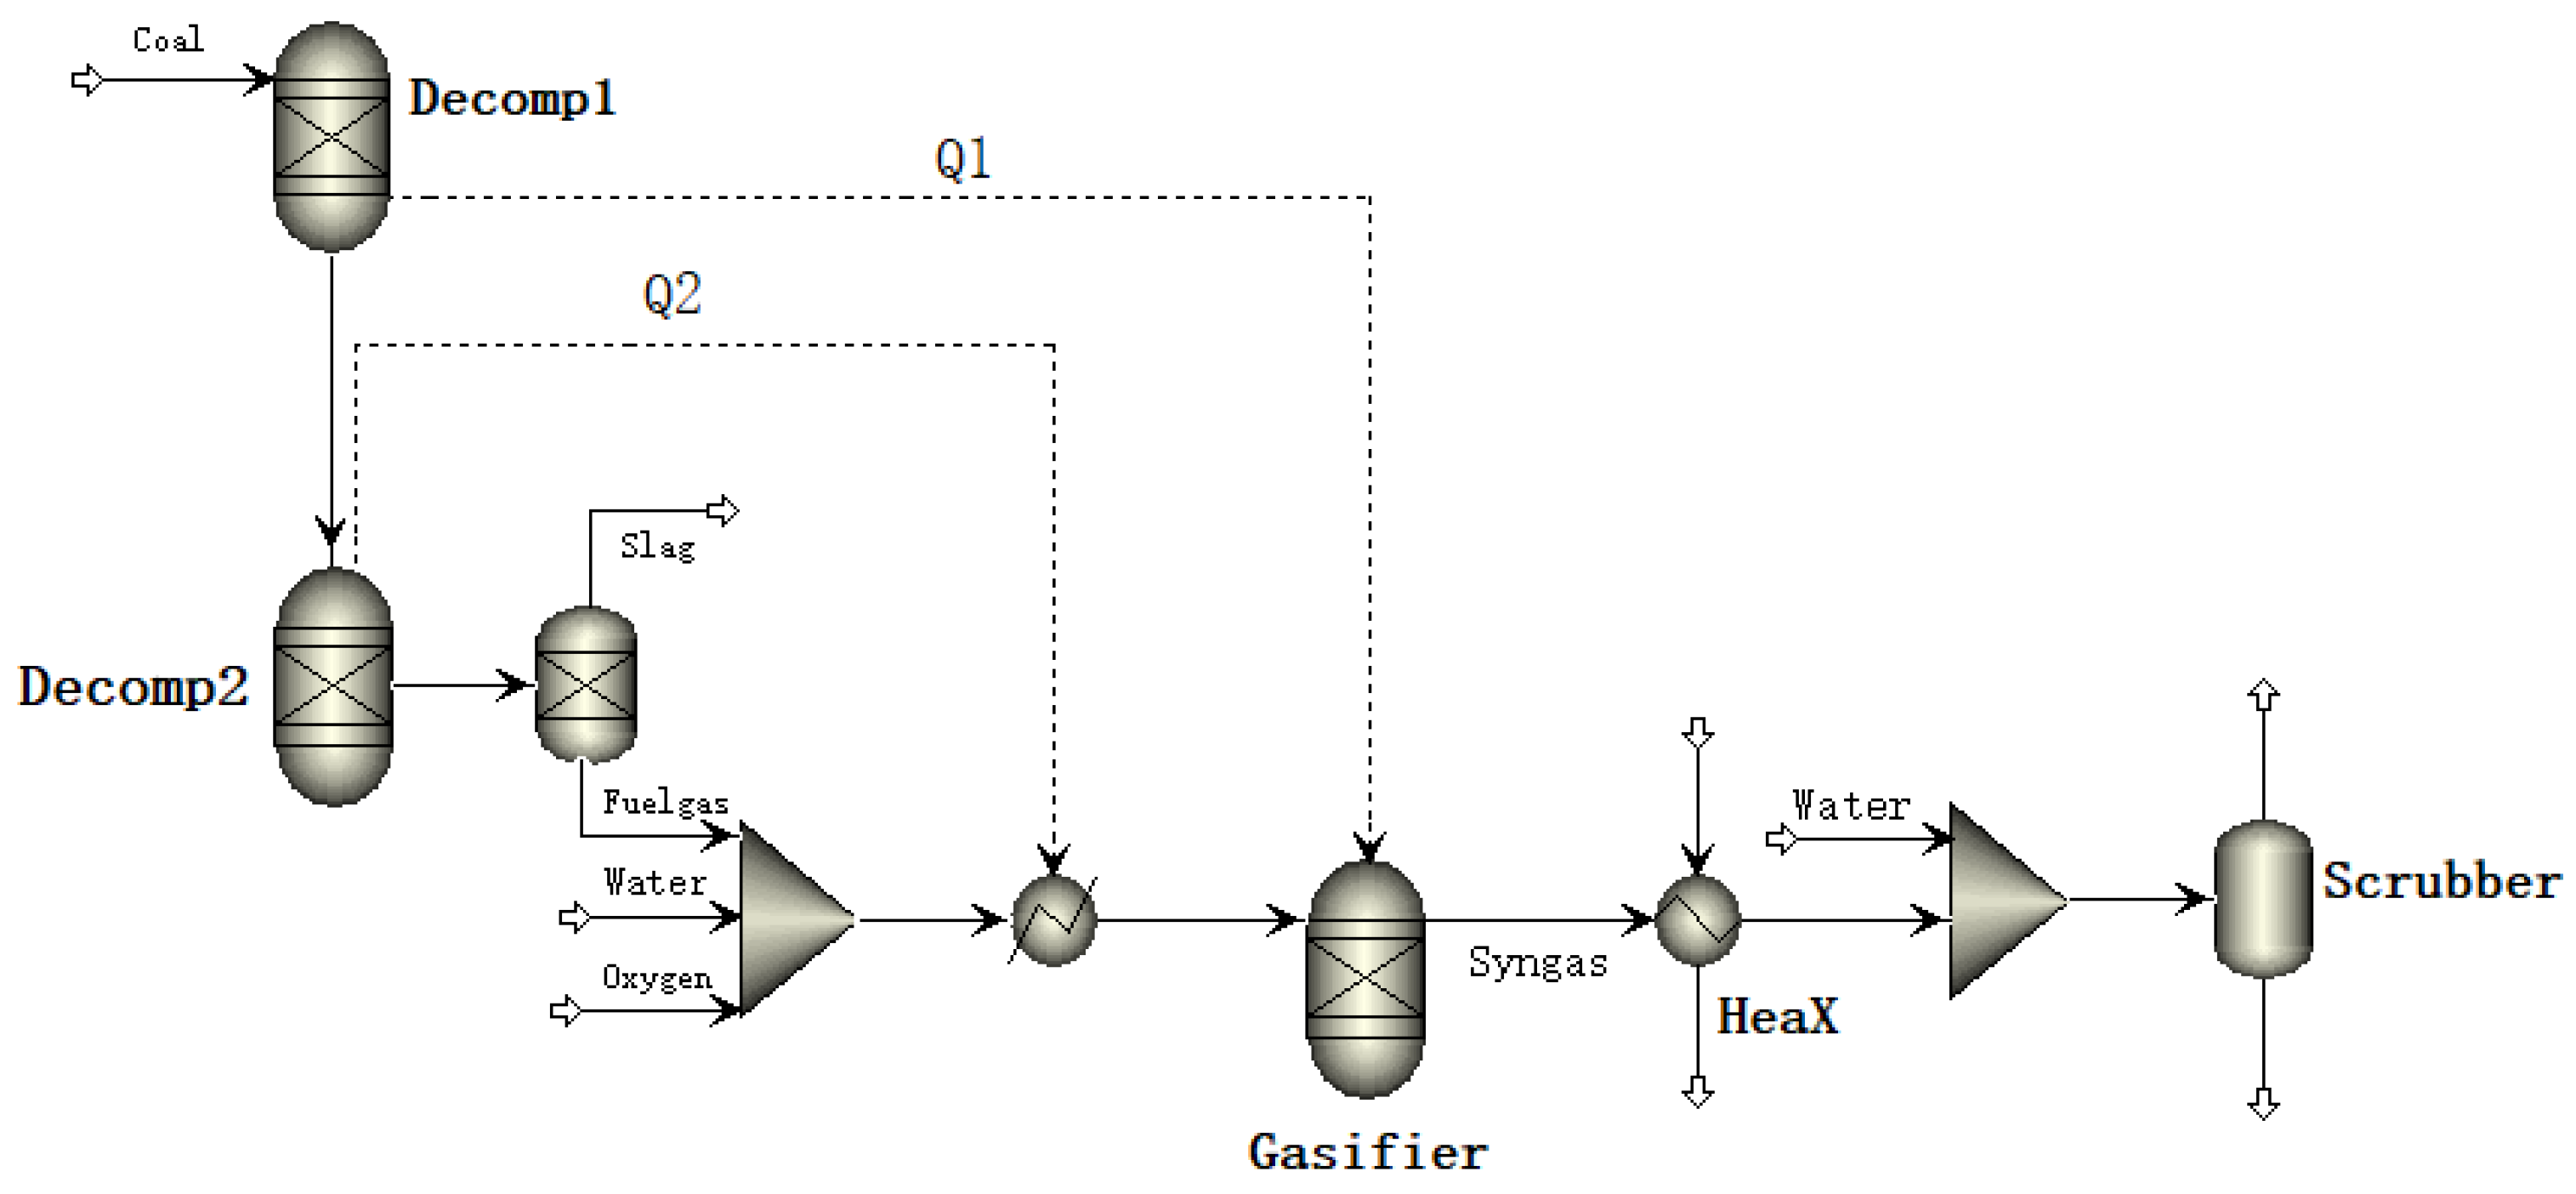
2.1. Coal Gasification Unit

The process flowsheet of gasification is presented in Figure 4. The coal gasification process mainly includes coal water slurry preparation, gasification, waste heat recovery, and washing. In the preparation stage of coal water slurry, the raw coal is first crushed and pulverized and then mixed with water to obtain coal water slurry with coal to water ratio of 65% [29]. The Texaco coal-water slurry gasification technology is adopted. The coal slurry and O2 from CLASU enter the gasifier, where the water is rapidly vaporized and the partial combustion and devolatilization reactions begin to occur simultaneously. The generated crude syngas is cooled by water quenching method using the HeatX module to recover waste heat. After water quenching, the crude syngas enters the scrubber (flash model) to remove the soluble gas, and the crude syngas is further cooled and finally sent to the sulfur removal unit.
During the modeling of coal gasification, two independent processes are assumed: the pyrolysis process and the gasification process. The coal pyrolysis stage is modeled by RYield reactor to decompose coal into C, H2, O2, S, and ash at a temperature of 500 °C and pressure of 6.5 MPa [30]. The gasification stage is modeled by RGibbs reactor according to Gibbs free energy minimization. In addition, the physical property method selected is Peng–Rob model [31]. The main equations of the gasification process are shown as follows [32]:
C + H2O → CO + H2  ∆H = +131.4 kJ/mol
CO + H2O → CO2 + H2  ∆H = −42 kJ/mol
C + CO2 → 2CO  ∆H = +172.6 kJ/mol
C + 2H2 → CH4  ∆H = −75 kJ/mol
CH4 + 2O2 → CO2 + 2H2O  ∆H = −890.3 kJ/mol
The properties of raw coal are listed in Table 1. The components in Aspen Plus are defined as unconventional components; HCOALGEN is adopted for the enthalpy model, and DCCOALIGN is adopted for the density model [27].

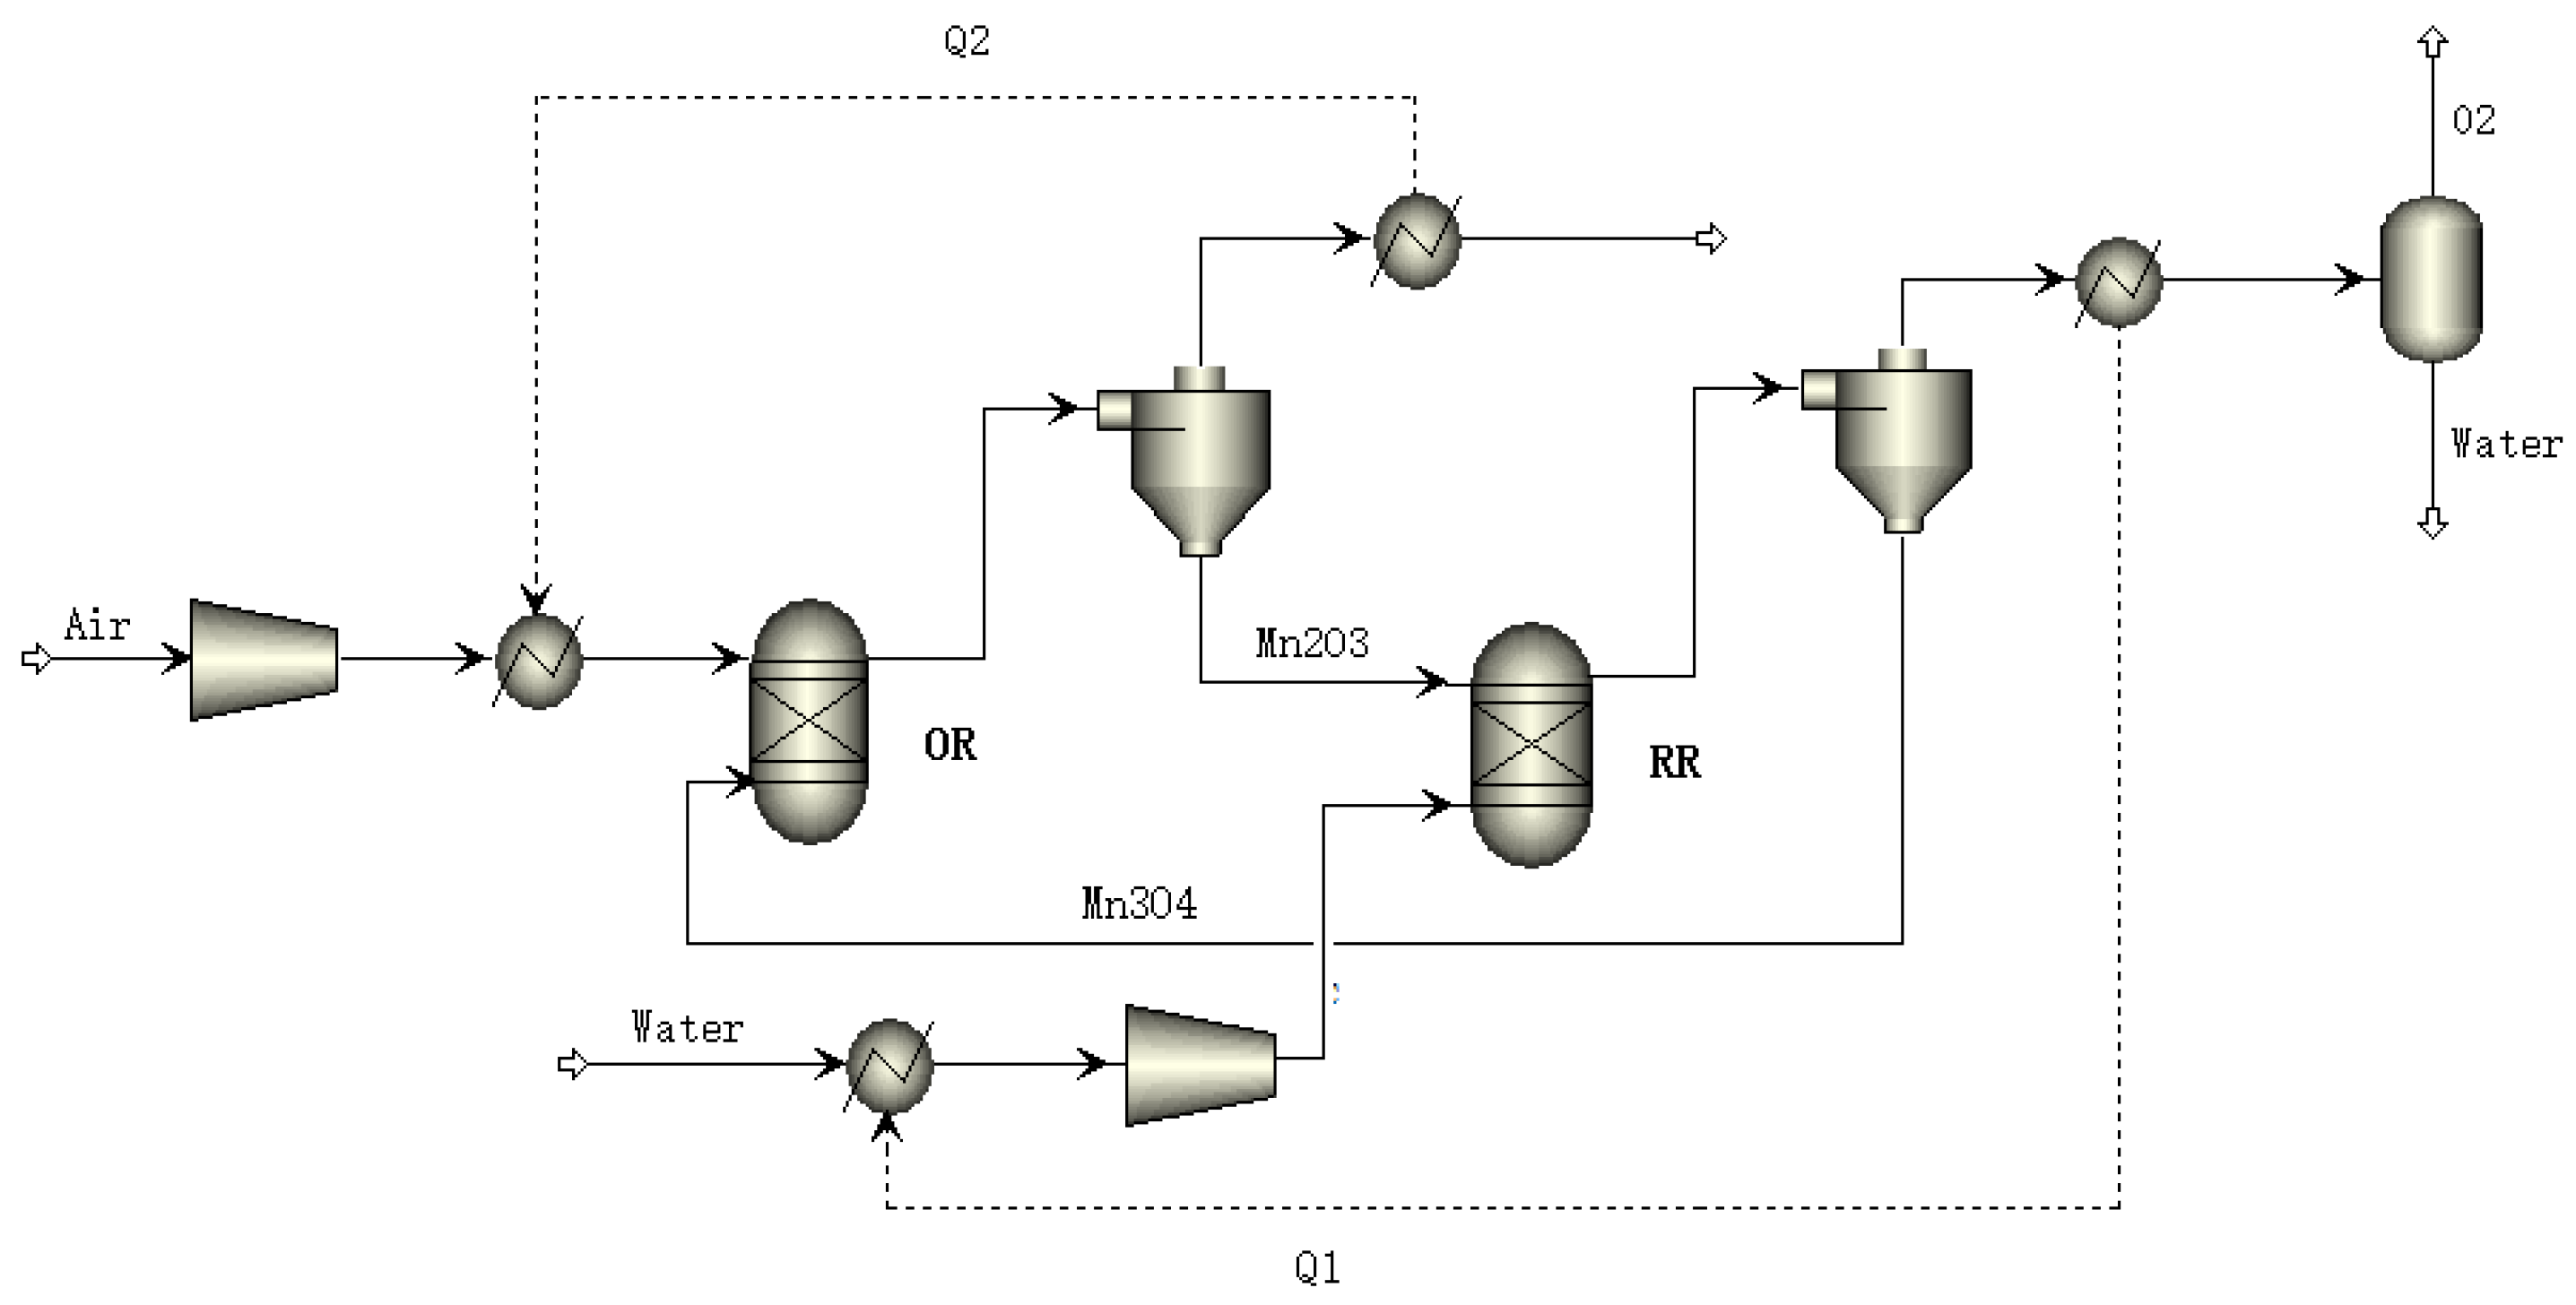
2.2. Chemical Looping Air Separation Unit

The schematic diagram of the CLAS process is shown in Figure 5. The CLAS process mainly includes oxidation reactor (OR) and reduction reactor (RR). Firstly, air is compressed by a compressor and heated up to reaction temperature; then, air is fed into the OR (RGibbs model), where Mn3O4 is converted to Mn2O3 by reacting with O2, as shown in Equation (6). The reaction product out of the OR enters the separator to separate oxygen-lean air and Mn2O3, and oxygen-lean air is used to provide N2 for the NH3 synthesis unit. In the RR, due to the low partial pressure of oxygen, steam needs to be introduced to promote the production of Mn3O4, and oxygen is by-produced in this process, as shown in Equation (7); Mn3O4 is then cycled back to the OR again. The O2 and steam out of the RR enter the separation unit, pure O2 is obtained, and O2 is required for coal gasification.
4 Mn3O4 + O2 → 6 Mn2O3
6 Mn2O3 → 4 Mn3O4 + O2

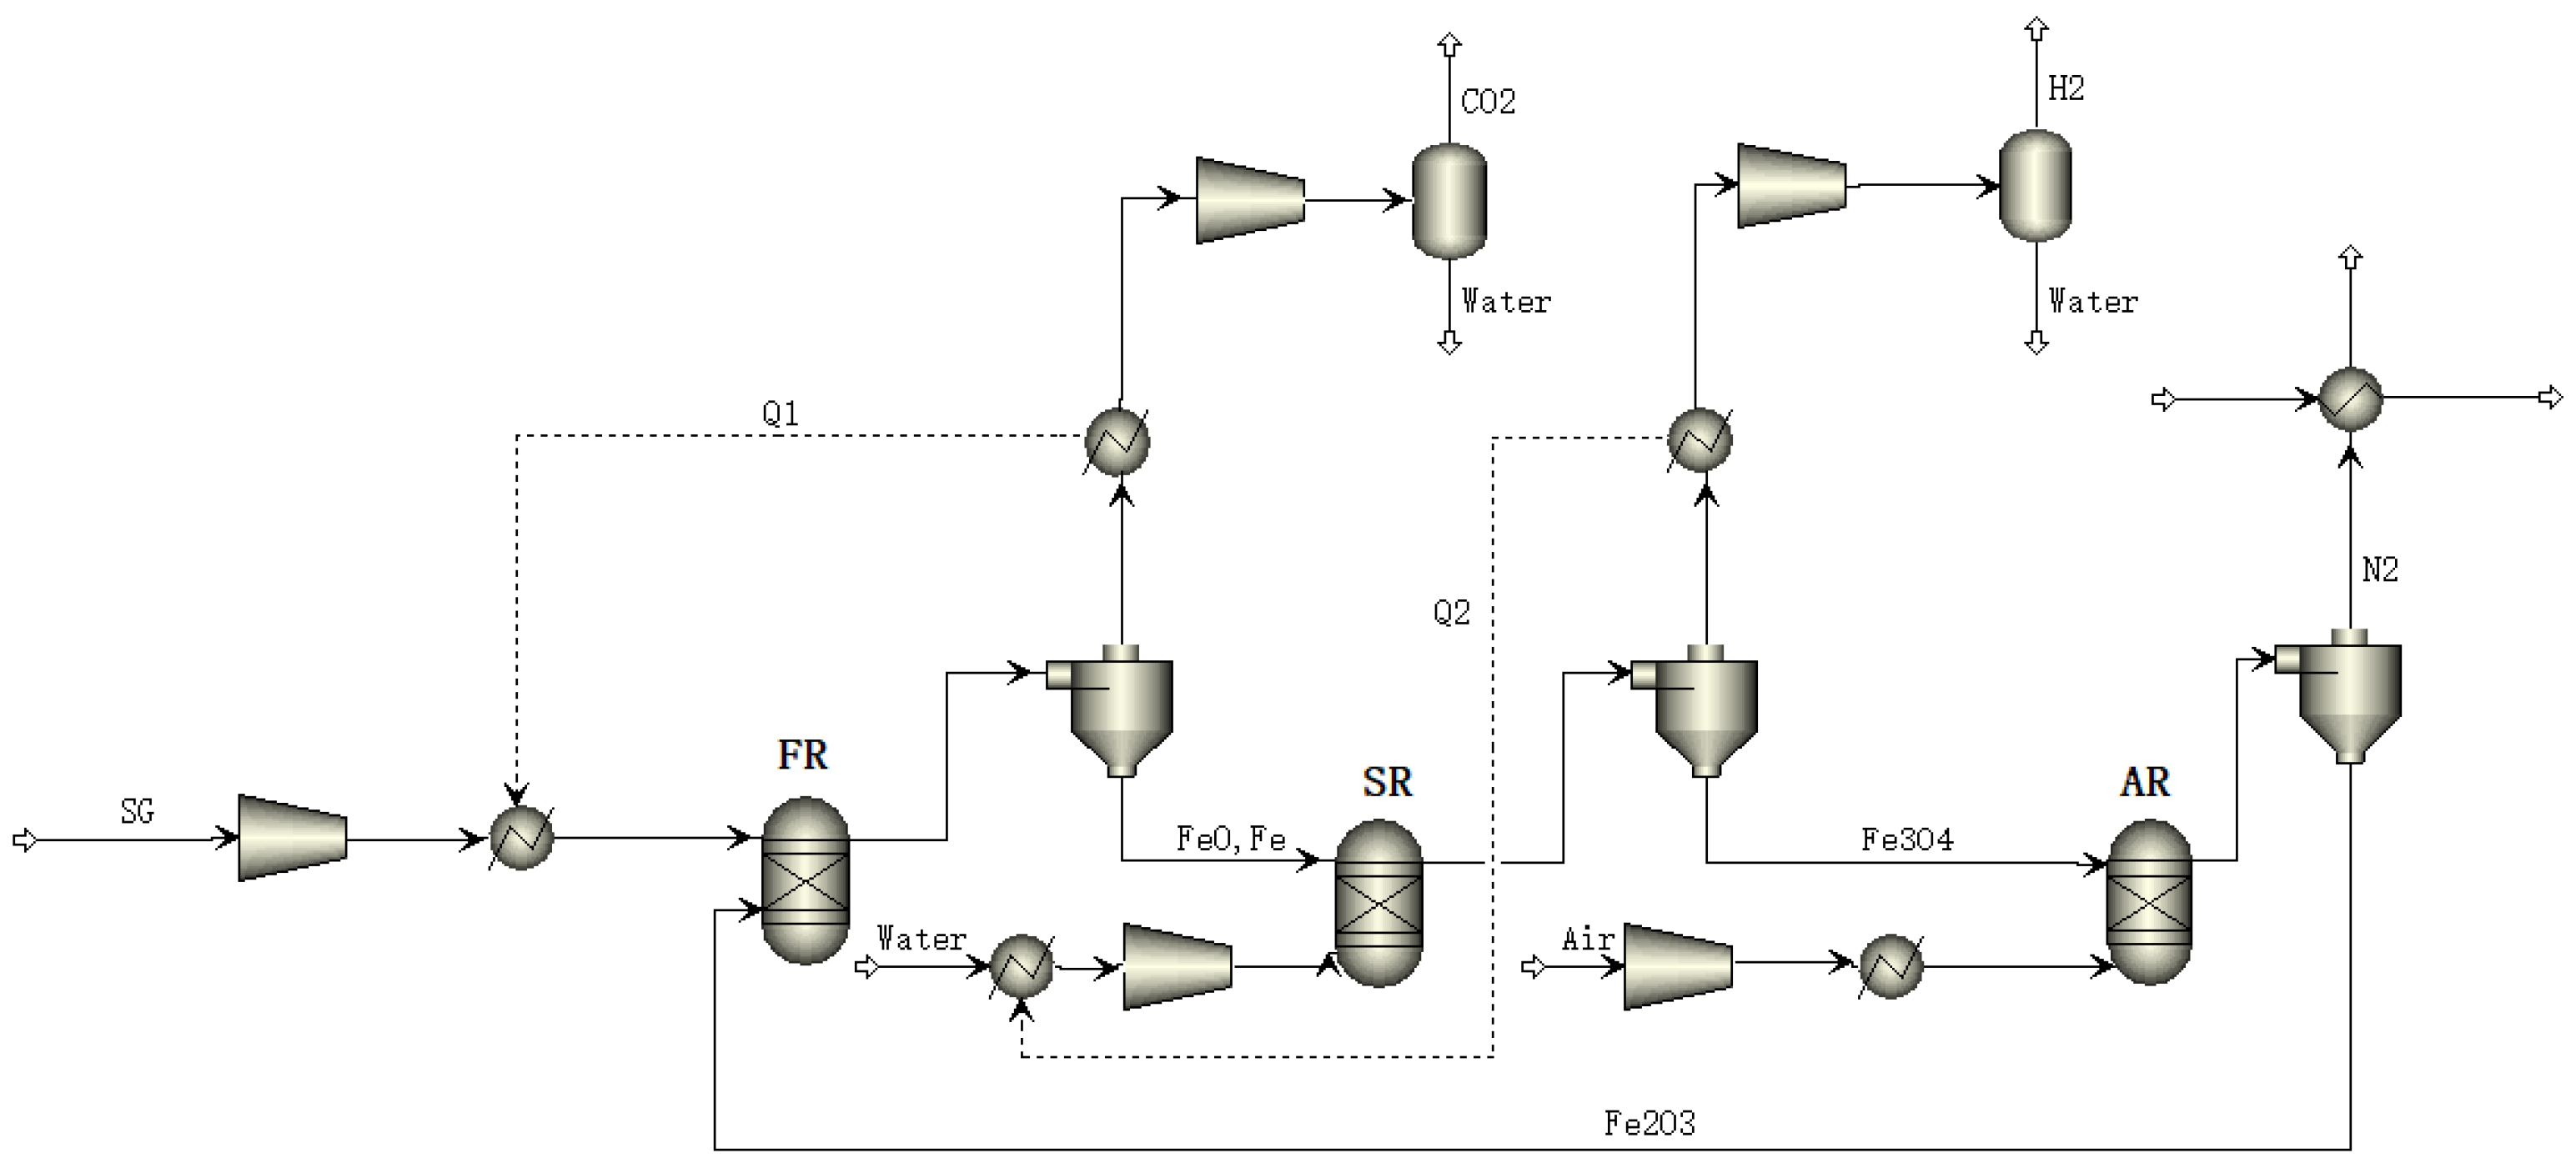
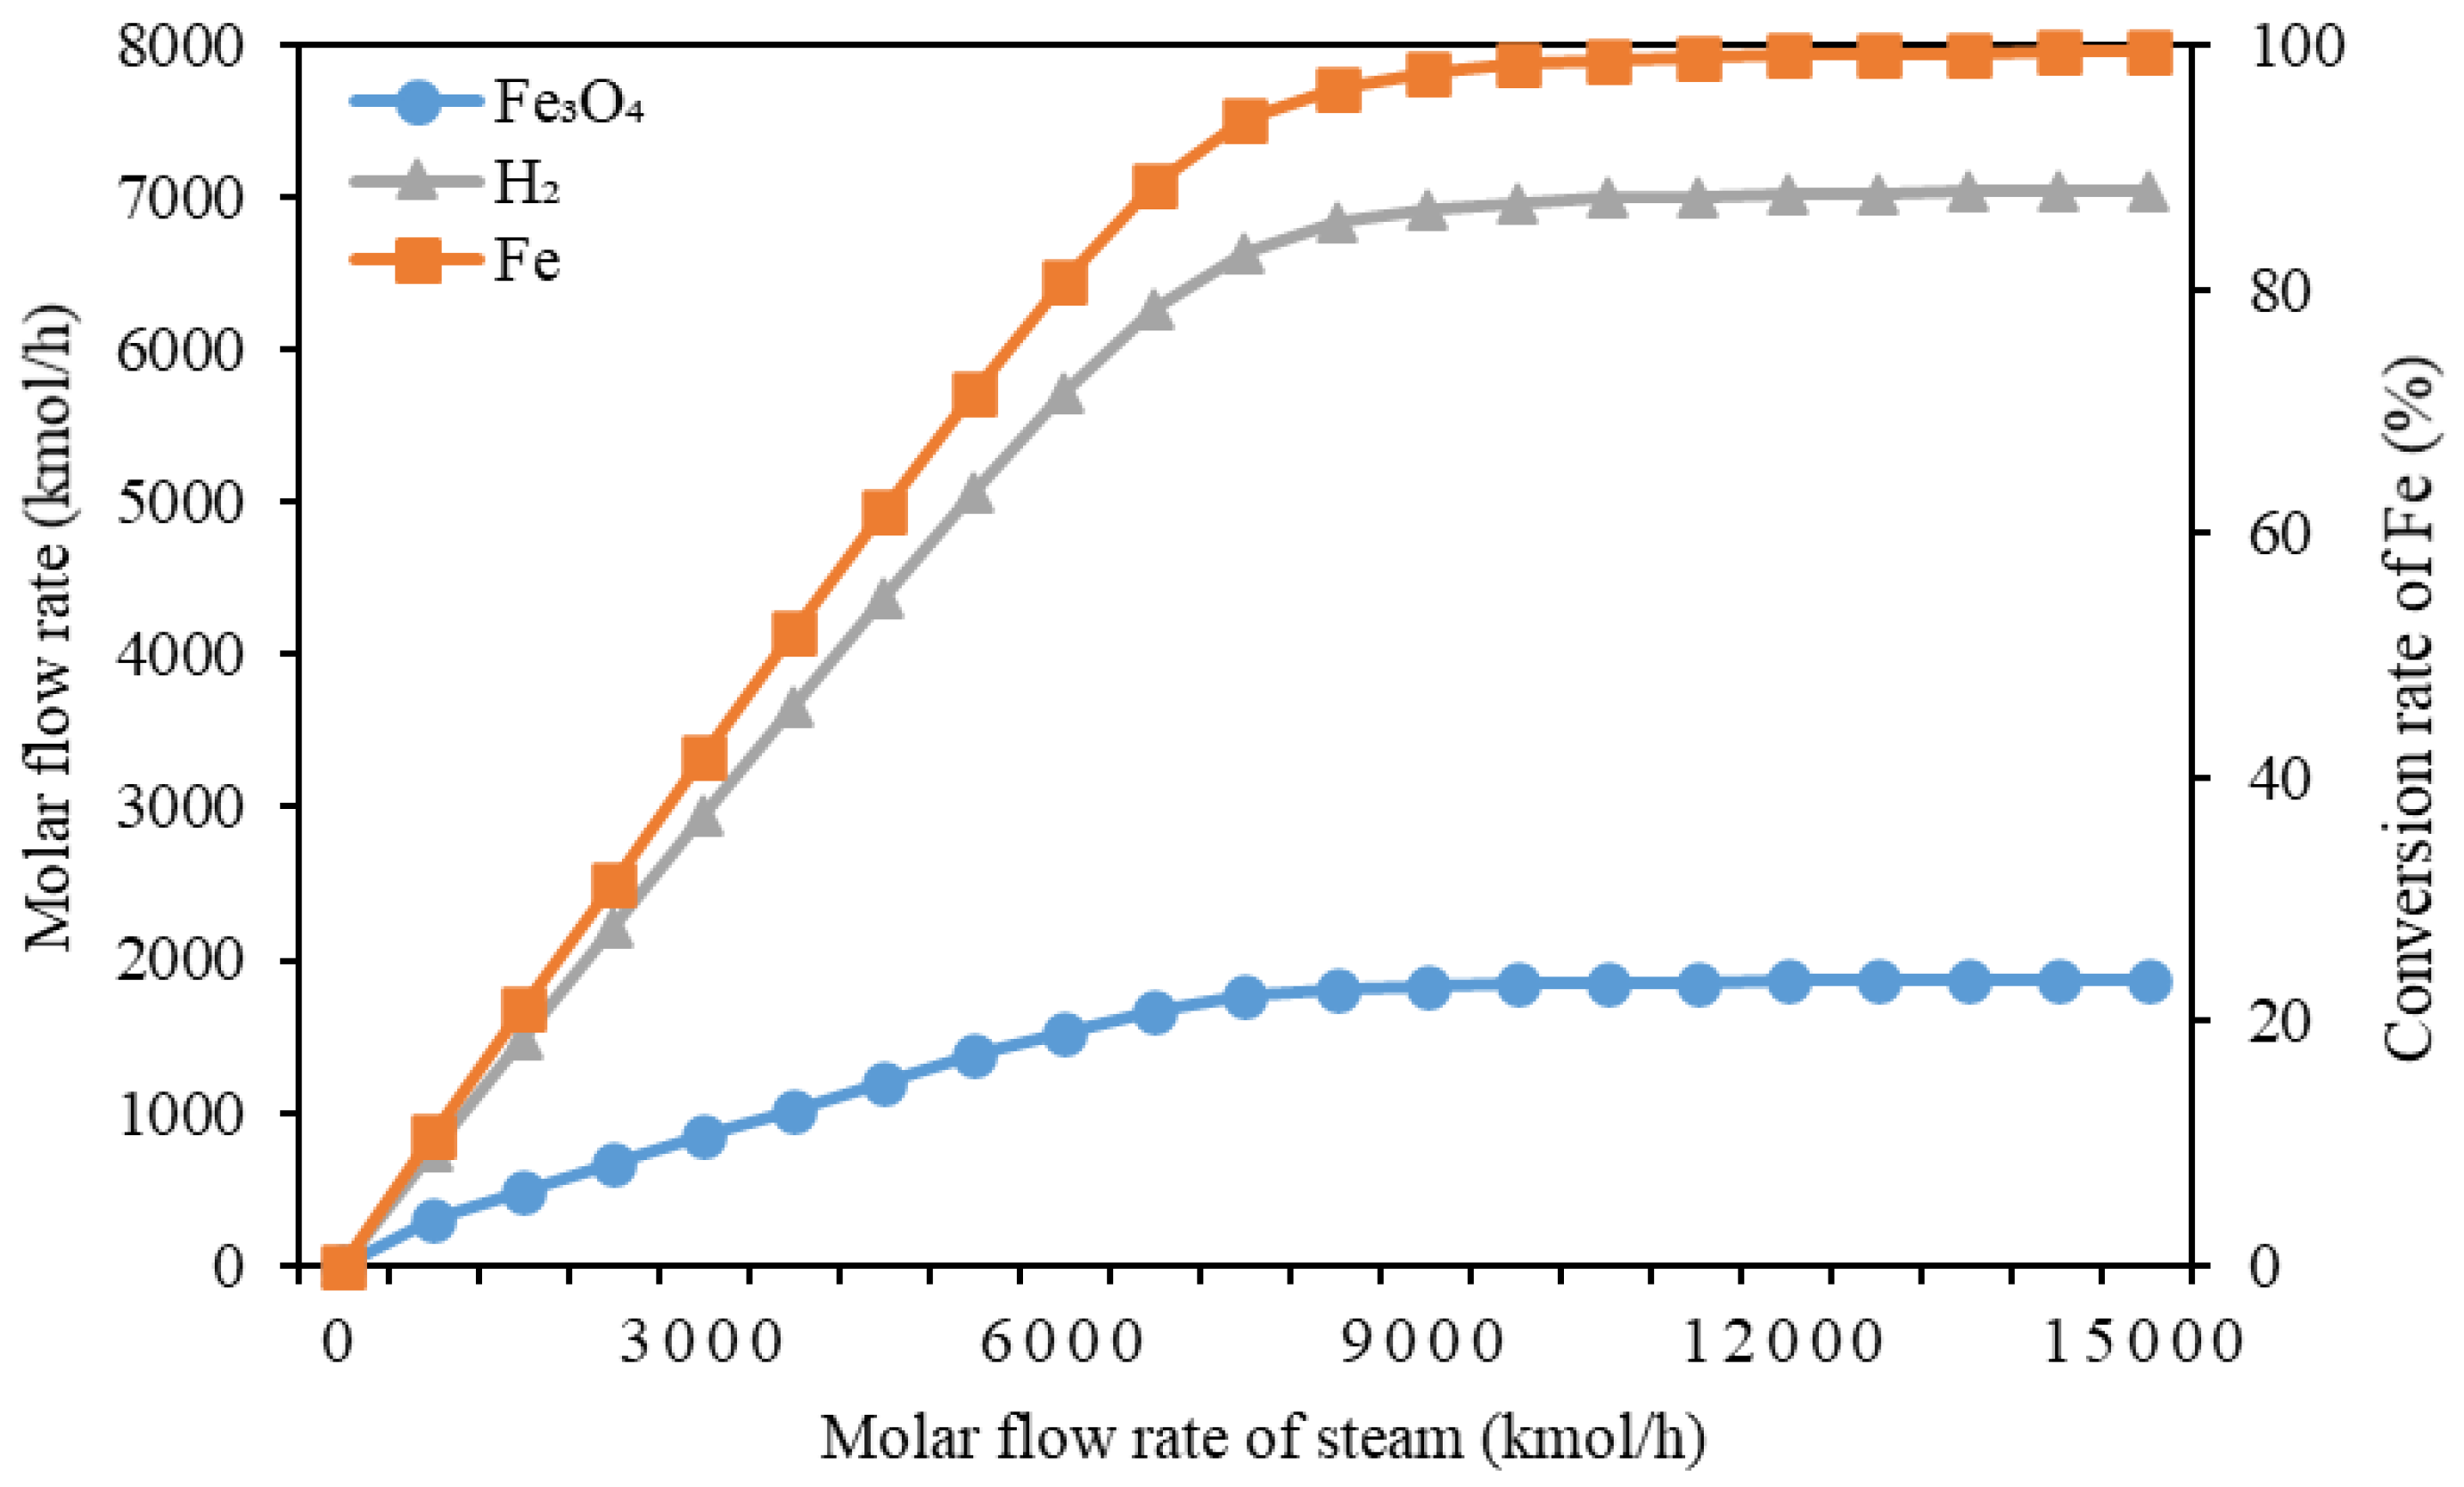
2.3. Chemical Looping Hydrogen Unit

The main units of CLH process include a fuel reactor (FR), stream reactor (SR), and air reactor (AR). The circulating oxygen carrier (OC) is Fe2O3 with the inert material MgAl2O4 (70% wt.). Fe2O3 is selected because Fe2O3 has the advantages of being cheap and having high reactivity; moreover, Fe2O3 makes the water vapor has a high conversion rate [33,34,35]. Inert materials are used to control the temperature of the solids and reduce heat stress. In these sub-processes, the thermodynamic method of Peng–Rob is used for simulation.
Figure 6 depicts a flowsheet of the CLH process. After washing, desulfurization, and compression, the syngas enters the CLH process. The purified syngas is almost completely oxidized to CO2 and H2O by Fe2O3 in the FR (RGibbs model), and gas–solid separation is performed using a cyclone separator (Cyclone model). In this work, gas–solid separation is assumed to be complete. After gas-–solid separation, the gas phase passes heat exchange and is fed into the flash tank to separate the steam and CO2. The reduced oxygen carrier enters the SR (RGibbs model), where Fe, FeO, and the steam react to form a mixture of H2. Fe3O4 is separated from H2 and steam through the cyclone separator, and the gas phase is transported by the compressor to the flash tank after the heat exchanger, and the hydrogen is separated from the steam to obtain high-purity H2. Fe3O4 enters the air reactor (AR) and reacts with O2 in the air with a strongly exothermic reaction. After the gas–solid separation by the cyclone separator, the high-temperature and high-pressure hypoxic air enters the waste heat boiler (HeatX model) to recover the heat, and the solid oxygen carrier circulates into the combustion reactor (FR).
The reactions occurring in the FR are shown in Equations (8)–(12):
Fe2O3 + CO → 2 FeO + CO2
Fe2O3 + H2 → 2 FeO + H2O
4 Fe2O3 + 3 CH4 → 8 Fe + 6 H2O + 3 CO2
FeO + CO → Fe + CO2
FeO + H2 → Fe + H2O
The reactions occurring in the SR are shown in Equations (13) and (14):
3 FeO + H2O → Fe3O4 +H2
3 Fe + 4 H2O → Fe3O4 + 4 H2
The reactions occurring in the AR are shown in Equation (15):
4 Fe3O4 + O2 → 6 Fe2O3

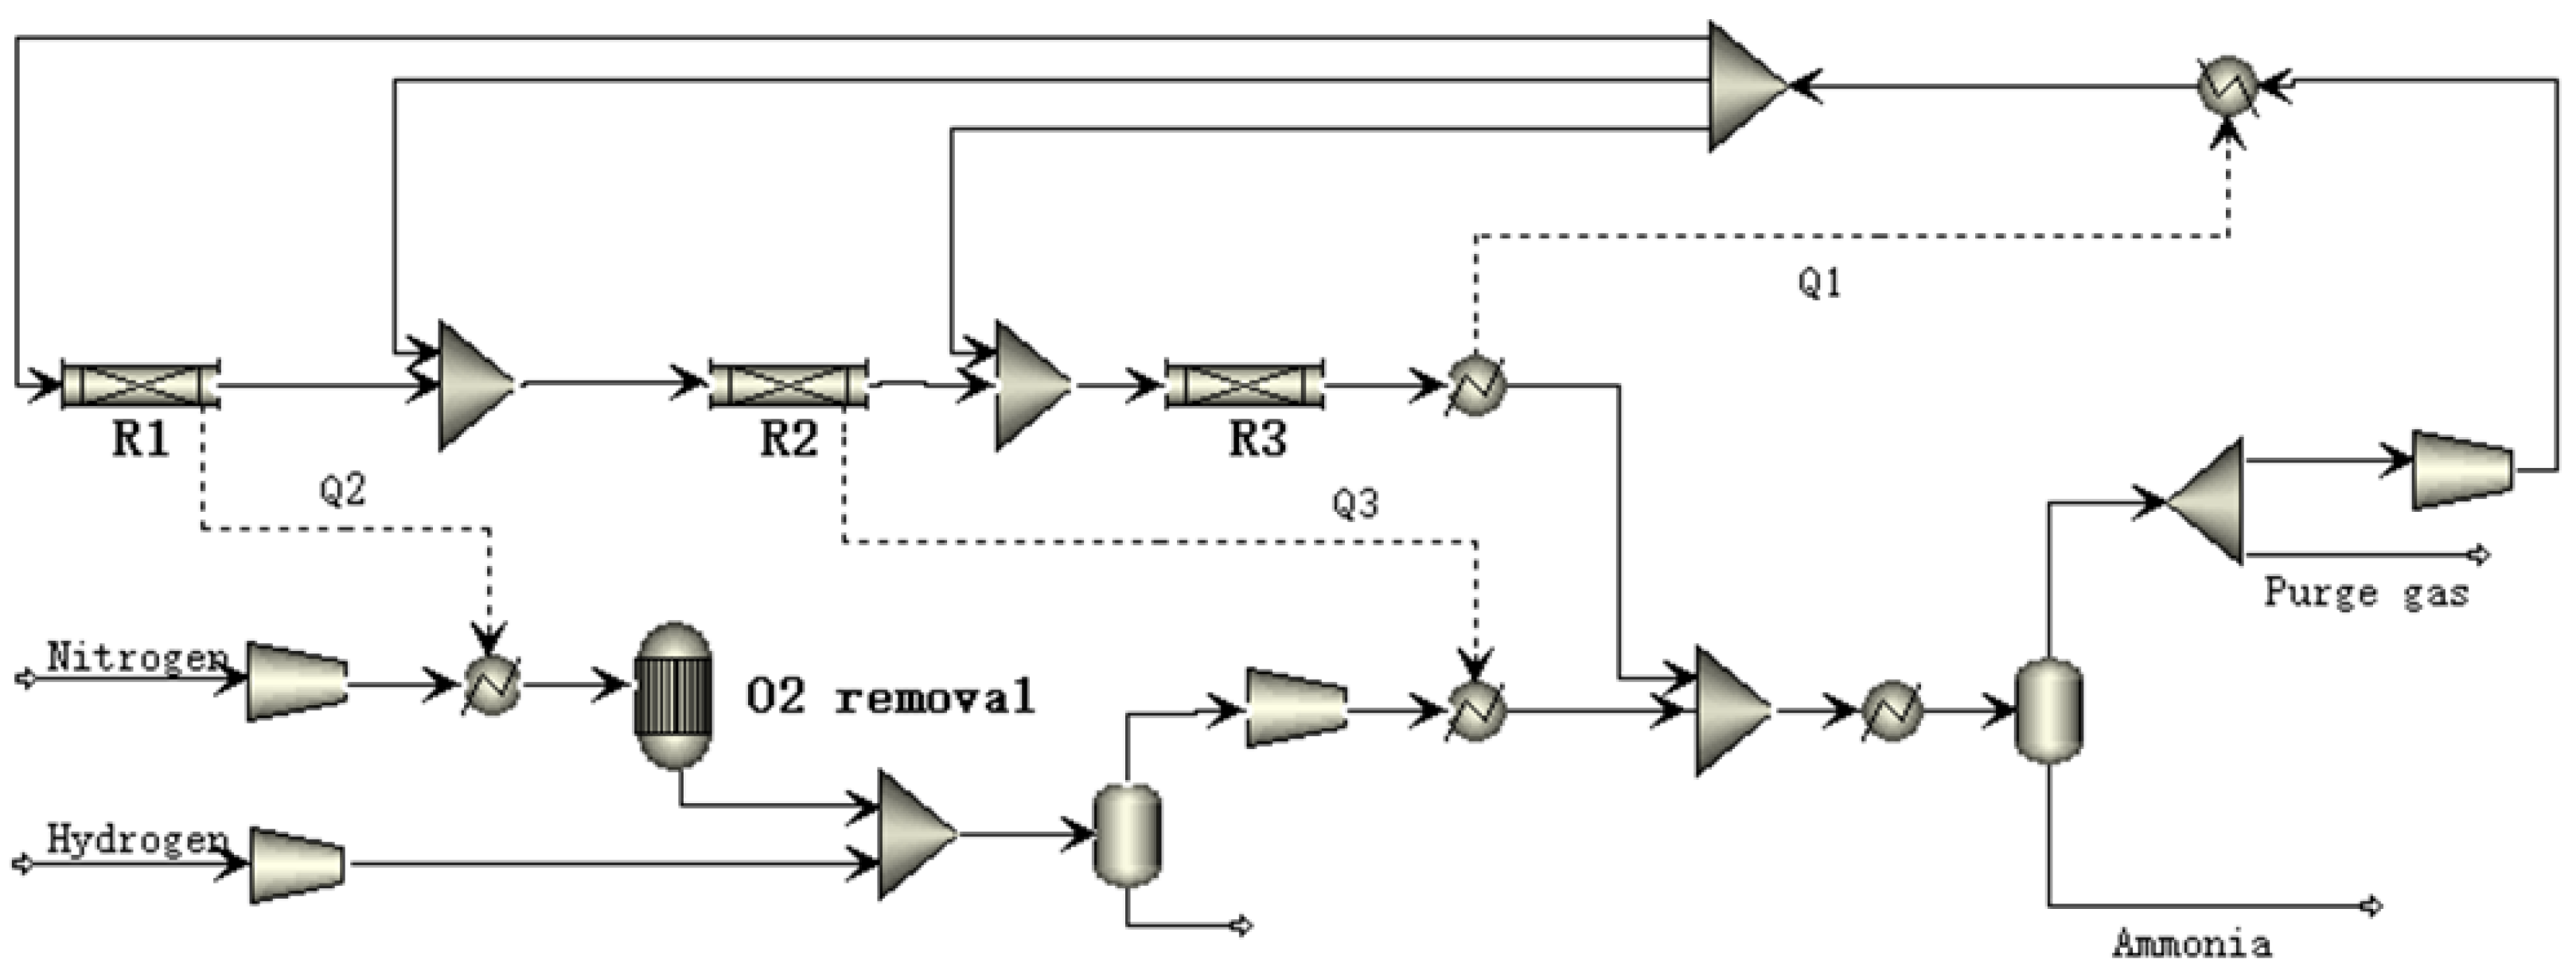
2.4. Ammonia Synthesis Unit

The flowsheet of the ammonia synthesis unit is shown as Figure 7. It mainly includes feed gas pretreatment, reaction, and purification parts. In the raw gas pretreatment stage, H2 and N2 are compressed and pressurized by the compressor and enter the catalytic oxidation reactor (Requil model); after removing a small amount of O2, the molar ratio of H2 and N2 is about 3, and they are then delivered into the dryer (Flash model). After removing the H2O in the mixed gas, the purified raw material gas passes and is compressed and enters ammonia synthesis reactors after passing through the heat exchanger. Since the synthesis ammonia reaction is exothermic, R1 can exchange heat with the feed N2, R2 pre-heats the cold feed, and the unreacted gas at the R3 outlet is mixed with the preheated feed. After the purified part of the unreacted gas and NH3 are further cooled by the heat exchanger into the flash tank (Flash model).
The ammonia production is achieved in liquid flow, while the gas flow contains a large amount of unreacted gas, of which a small amount is discharged as a purge gas, and the remaining gas enters the reaction part of the cycle. The Rplug block is used to model the NH3 reactor and main reaction equation is shown in Equation (16). The kinetic rate equation, Equation (17), can be found in Morud et al. [36] and Flórez-Orrego et al. [37], and additional detailed parameters for the optimization of ammonia synthesis can be found in Xiang et al. [38] and Araújo et al. [39].
N2 + 3 H2 ↔ 2 NH3
r NH 3 = 2 f ρ cat ( k 1 P N 2 P H 2 1.5 P NH 3 k 1 P NH 3 P H 2 1.5 )
where P represents the partial pressure; ρcat represents the catalyst density; f is the correction factor, 4.75; k1 and k−1 represent the pre-exponential factors: k1 = 1.79 × 10⁴e−10,475/T, k−1 = 2.75 × 10¹⁶e−23,871/T; and T represents the temperature (K).

2.5. Urea Synthesis Unit

Commercial urea synthesis is based on the Basarov reaction [40] (Equations (18) and (19)) at 125–250 bar and 170–220 °C, according to the following two reactions:
2 NH3 + CO2 → CARB
CARB → UREA + H2O
The urea synthesis adopts a mature CO2 stripping process (Figure 8). A large amount of ammonium carbamate produced in the urea reactor enters the CO2 stripping tower (RadFrac model) and decomposes into NH3 and CO2. NH3 and CO2 circulate into the urea reactor, and the liquid stream from the bottom of the CO2 stripping tower is rich in urea and enters the urea purification unit; in the urea synthesis part, NH3 is mixed with the circulating gas and delivered into a high-pressure condenser (RStoic model) to react with NH3 to generate ammonium carbamate and is then fed into the urea synthesis reactor (Rplug model), where the urea solution overflows from the bottom of the reactor to the CO2 stripper, while the unreacted gas overflows from the top of the reactor into the scrubber (RadFrac model). Unreacted NH3 and CO2 contact with a carbamate solution recovered from the urea purification section, while gases O2, N2, and other gases are discharged from the top of the scrubber. In the purification section, the urea-rich liquid from the bottom of the CO2 stripper enters the CARB decomposer (RStoic model), further decomposes the ammonium carbamate in the liquid phase into CO2 and NH3, and enters the urea separator (SEP model) to separate urea production and gas phase. The gas phase containing CO2 and NH3 then are fed into the CARB regenerator (RGibbs model) to produce ammonium carbamate and then enter the scrubber to absorb CO2 and NH3, which eventually circulate into the synthetic urea synthesis unit.

3. Methodology

3.1. Carbon Utilization Efficiency

The carbon flow analysis is an important technical indicator for the COG-CTUCLAS&H and CTUCLAS&H processes [41]. The carbon utilization efficiency and CO2 emission rate are expressed in Equations (20) and (21).
δ 1 = C output C input × 100 % = C urea C coal + C COG × 100 %
δ 2 = C input C output C input × 100 % = ( 1 C urea C coal + C COG ) × 100 %
where δ1 is the carbon utilization efficiency, and δ2 is the CO2 emission rate. Cinput represents the input C in raw materials, which include coal and COG. Coutput represents the output in the production, which is urea for the COG-CTUCLAS&H and CTUCLAS&H processes.

3.2. Energy Efficiency

Energy efficiency is an important indicator for comparing the COG-CTUCLAS&H and CTUCLAS&H processes [42]. The effect of COG/CG on the utilities and energy efficiency and the energy efficiency of CTUCLAS&H and COG-CTUCLAS&H processes are shown in Equations (22) and (23), respectively. The energy consumption is calculated by Equation (24).
η 1 = E x , out E x , in × 100 % = E x , urea E x , coal + E x , util × 100 %
η 2 = E x , out E x , in × 100 % = E x , urea E x , coal + E x , COG + E x , util × 100 %
E x , util = E x , steam + E x , ele
where η1 and η2 represent the system energy efficiencies of the CTUCLAS&H and COG-CTUCLAS&H processes. Ex,out and Ex,in represent the output and input energy, Ex,coal, Ex,COG, and Ex,util represent the energy of coal, COG, and utilities, respectively. Ex,stream and Ex,ele represent the energy of stream and electricity.

3.3. Total Capital Investment

The total capital investment (TCI) consists of fixed capital investment and working capital. The fixed capital investment mainly includes the direct investment and indirect investment which correspond to the costs of equipment, installation, engineering, supervision, etc. The equipment cost (IEI) is generally the most important component of the TCI and the rest costs of TCI have a ratio to equipment cost. We adopt the plant capacity index method to calculate the equipment cost, as shown in Equation (25), and TCI is calculated according to Equation (26) [42,43].
I E I = I E I ref × θ × ( S S ref ) s f
T C I = I E I × ( 1 + ζ i )
where I E I ref and Sref are the equipment investment and processing scale of the present plants. θ is the domestic production index with 0.65, and sf is the scale index with 0.67. ζi is the ratio of other costs in TCI to equipment cost, as shown in Table S1.

3.4. Total Production Cost

We investigate the total product costs (TPC) of the CTU, CTUCLAS&H, and COG-CTUCLAS&H to compare the economic performance of all three processes. The product costs are calculated by referring to our previous works as shown in Equation (27) [31,44]. In order to calculate the product costs, the following assumptions are made: the prices of coal, COG, stream, electricity and urea are USD 100/t, USD 0.06/m3, USD 6.0/GJ, USD 0.1/kW·h, and USD 357.14/t, respectively. The assumptions for 15 years of depreciation and a residual value of 4% were used for calculating the depreciation cost [42]. The exchange rate between the US dollar and the Chinese yuan is set at 7.0 yuan per US dollar.
T P C = C r + C u + C om + C d + C poc + C ge
where Cr, Cu, Com, Cd, Cpoc, and Cge represent costs of raw material, utilities, operation and maintenance, depreciation, plant overhead, and general expenses, respectively. Detailed calculation data are shown in Table S2.

3.5. Internal Rate of Return

To assess the feasibility of the CTUCLAS&H and COG-CTUCLAS&H processes, the internal rate of return (IRR) is investigated in this work. It can be defined as the discount rate (i) at which the net present value equals to zero, given by [38]:
t = 0 n N C F t ( 1 + i ) t = 0 ,
where NCF and n are the net cash flow and project life period, respectively.

4. Results and Discussion

4.1. Parameter Optimization and Simulation

To increase the yield of urea production and the conversion of raw material as well as the techno-economic performance of the novel process, several key parameters of the process are investigated and optimized in the following section, including oxygen/coal ratio (O/C ratio) in the coal gasification, Mn3O4/air and stream/Mn2O3 in the CLAS, and Fe2O3/CG and stream flow rate in the CLH.
The O/C ratio is an important parameter for coal gasification due to the O/C ratio significantly affecting the flow and composition of produced crude synthesis. The effects of the O/C ratio on the gasifier performance (molar flow and H/C of crude syngas) are shown in Figure 9. In the range of 0.1–1.0, the molar flow of the components (H2 + CO) first increases as the O/C ratio increases and reaches the highest level (8158.88 kmol/h) when the O/C ratio is 0.7 and 0.31 is obtained for the H/C ratio. When the O/C ratio increases from 0.7 to 0.9, the molar flow rate (CO + H2) shows a downward trend, while the CO2 molar flow rate shows a rising trend because the high O/C means that the oxygen content entering the gasifier increases, and more CO reacts with O2 to generate CO2 in the gasifier. Therefore, 0.7 is suggested for the O/C ratio in this work.
Figure 10a emphasizes the effect of the Mn3O4/air ratio on the molar flow of Mn3O4 and Mn2O3 for the CLAS system. When Mn3O4/air increases from 0 to 0.8, the molar flow rate of Mn2O3 shows a rising trend and the molar flow rate of Mn3O4 stays at 0, which is due to the complete conversion of Mn3O4 to Mn2O3 under excess air. Mn3O4/air continues to increase to over 1, the molar flow rate of Mn2O3 remains constant, and Mn3O4 shows a rising trend, which is due to the oxidation reaction of Mn3O4 with air already reaching the limit. Figure 10b indicates the effect of different Mn3O4/air on O2 conversion and molar flow rate of unreacted O2 in air; when Mn3O4/air increases from 0 to 0.8, the O2 conversion shows an increasing trend from 0 to 94%, and the corresponding molar flow rate of unreacted O2 in air shows a decreasing trend from 3016.42 kmol/h. When Mn3O4/air increased from 0.8 to 1, the conversion of O2 and the molar flux of unreacted O2 in air did not change, again indicating that the reaction had reached its limit when Mn3O4/air is 0.8. Therefore, Mn3O4/air is determined to be 0.8 in this paper.
At the same temperature, the Mn2O3 conversion rate increases with the increase in the stream/Mn2O3 (S/Mn2O3) ratio. Under the same S/Mn2O3 ratio, the higher conversion rate of the Mn2O3 is achieved with increase in the reaction temperature, indicating that increasing the reduction temperature within a certain range can promote the reduction reaction. As the temperature changes from 800 to 840 °C, the steam/Mn2O3 ratio changes from 0.25 to 0.6 to maintain the Mn2O3 conversion at 95%. When the temperature is 830 °C and S/Mn2O3 is 0.3, the Mn2O3 conversion rate can reach 100%. In order to realize 100% of the Mn2O3 conversion and lower steam consumption, 830 °C and 0.3 are chosen for reaction temperature and S/Mn2O3 ratio, respectively, as shown in Figure 11.
Figure 12 shows the effect of the Fe2O3/CG on the molar flow rate. When Fe2O3/CG increases from 0 to 0.3, the molar flow rate of H2 and CO decreases with the increase in Fe2O3/CG. When Fe2O3/CG increases from 0.3 to 0.5, the molar flow rate of H2 and CO almost completely reacts with CO2. The molar flow rate of Fe increases with the increase in Fe2O3/CG. When Fe2O3/CG increases from 0.3 to 0.5, the molar flow rate of CO2 and Fe does not change. This is because when Fe2O3/CG is 0.3, the molar flow rate of H2 and CO in the reactor is very low, and the reaction reaches the limit. In this analysis, the molar flow rate of FeO is very low in the case of excessive syngas. According to Equation (14), the higher the molar flow rate of Fe is, the more favorable it is for H2 generation. Therefore, Fe2O3/CG is chosen as 0.3.
Figure 13 shows the effect of the steam on the Fe3O4 and H2 molar flow rate and the Fe conversion rate. When the molar flow rate of water vapor is from 0 to 8250 kmol/h, the molar flow rate of Fe3O4 and the molar flow rate of Fe conversion H2 show an upward trend. However, when the molar flow rate of water vapor continues to increase, the Fe3O4 generation rate changes very little, indicating that the reaction has tended to reach its limit. At this time, the molar flow rate of hydrogen reaches 6836.79 kmol/h, and the conversion rate of Fe reaches 97%. The remaining Fe is completely oxidized to Fe2O3 in the AR reactor.
The efficiency of the process model and simulation can be verified by comparing the calculation and reference results. The simulation agrees well with the reference data, as shown in Table 2. Detailed simulation results are shown in Tables S3–S5 in the Supporting Materials.

4.2. Technical Performance Analysis

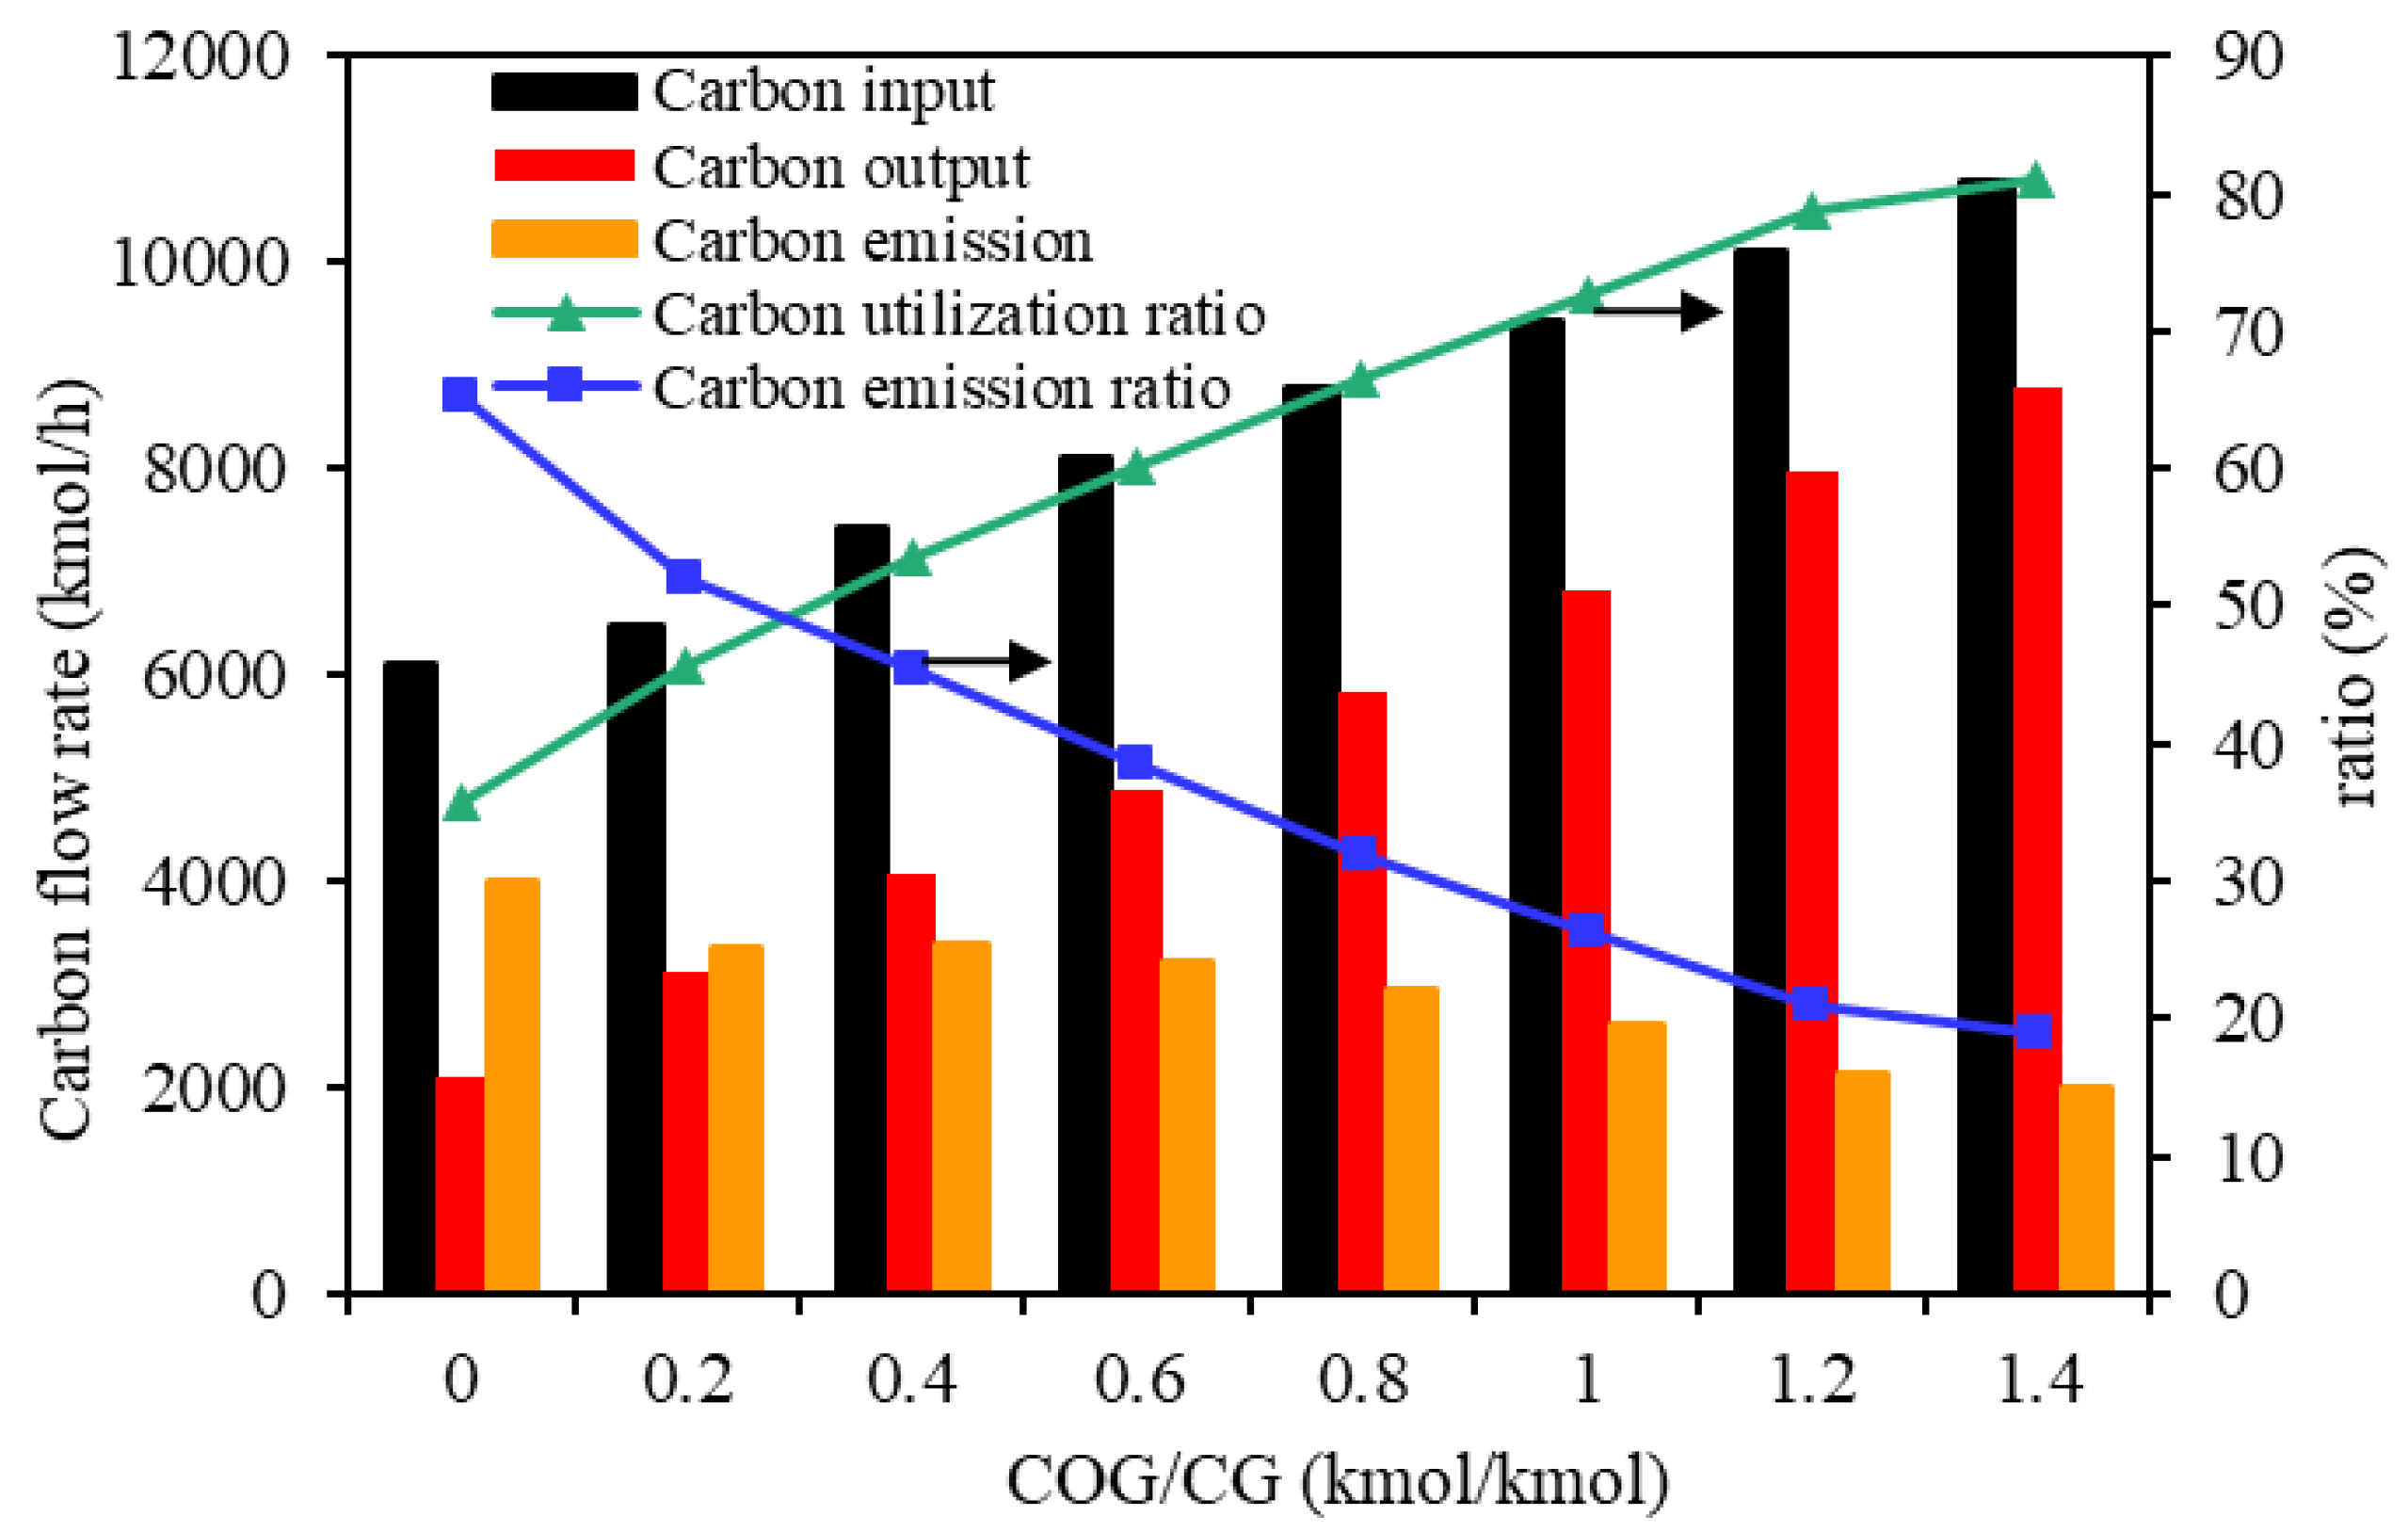
4.2.1. Carbon Utilization Efficiency Analysis

Figure 14 investigates the effect COG/CG on the carbon utilization efficiency and the CO2 emission rate. Both carbon input and carbon output are on the rise. This is because with the increase in coke oven gas, the output of H2 is directly increased, and the output of urea is also increased, while the carbon emission is on the decline. This is because more CO2 is used to produce urea. With the growth of COG/CG, the carbon emission rate showed a decreasing trend, while the carbon utilization rate showed a rising trend. When COG/CG increased from 0 to 1.4, the carbon utilization rate increased from 35.67% to 81%, which proved that the introduction of coke-oven gas greatly improved the utilization of raw materials for urea production and improved the carbon utilization ratio of the traditional CTU process.

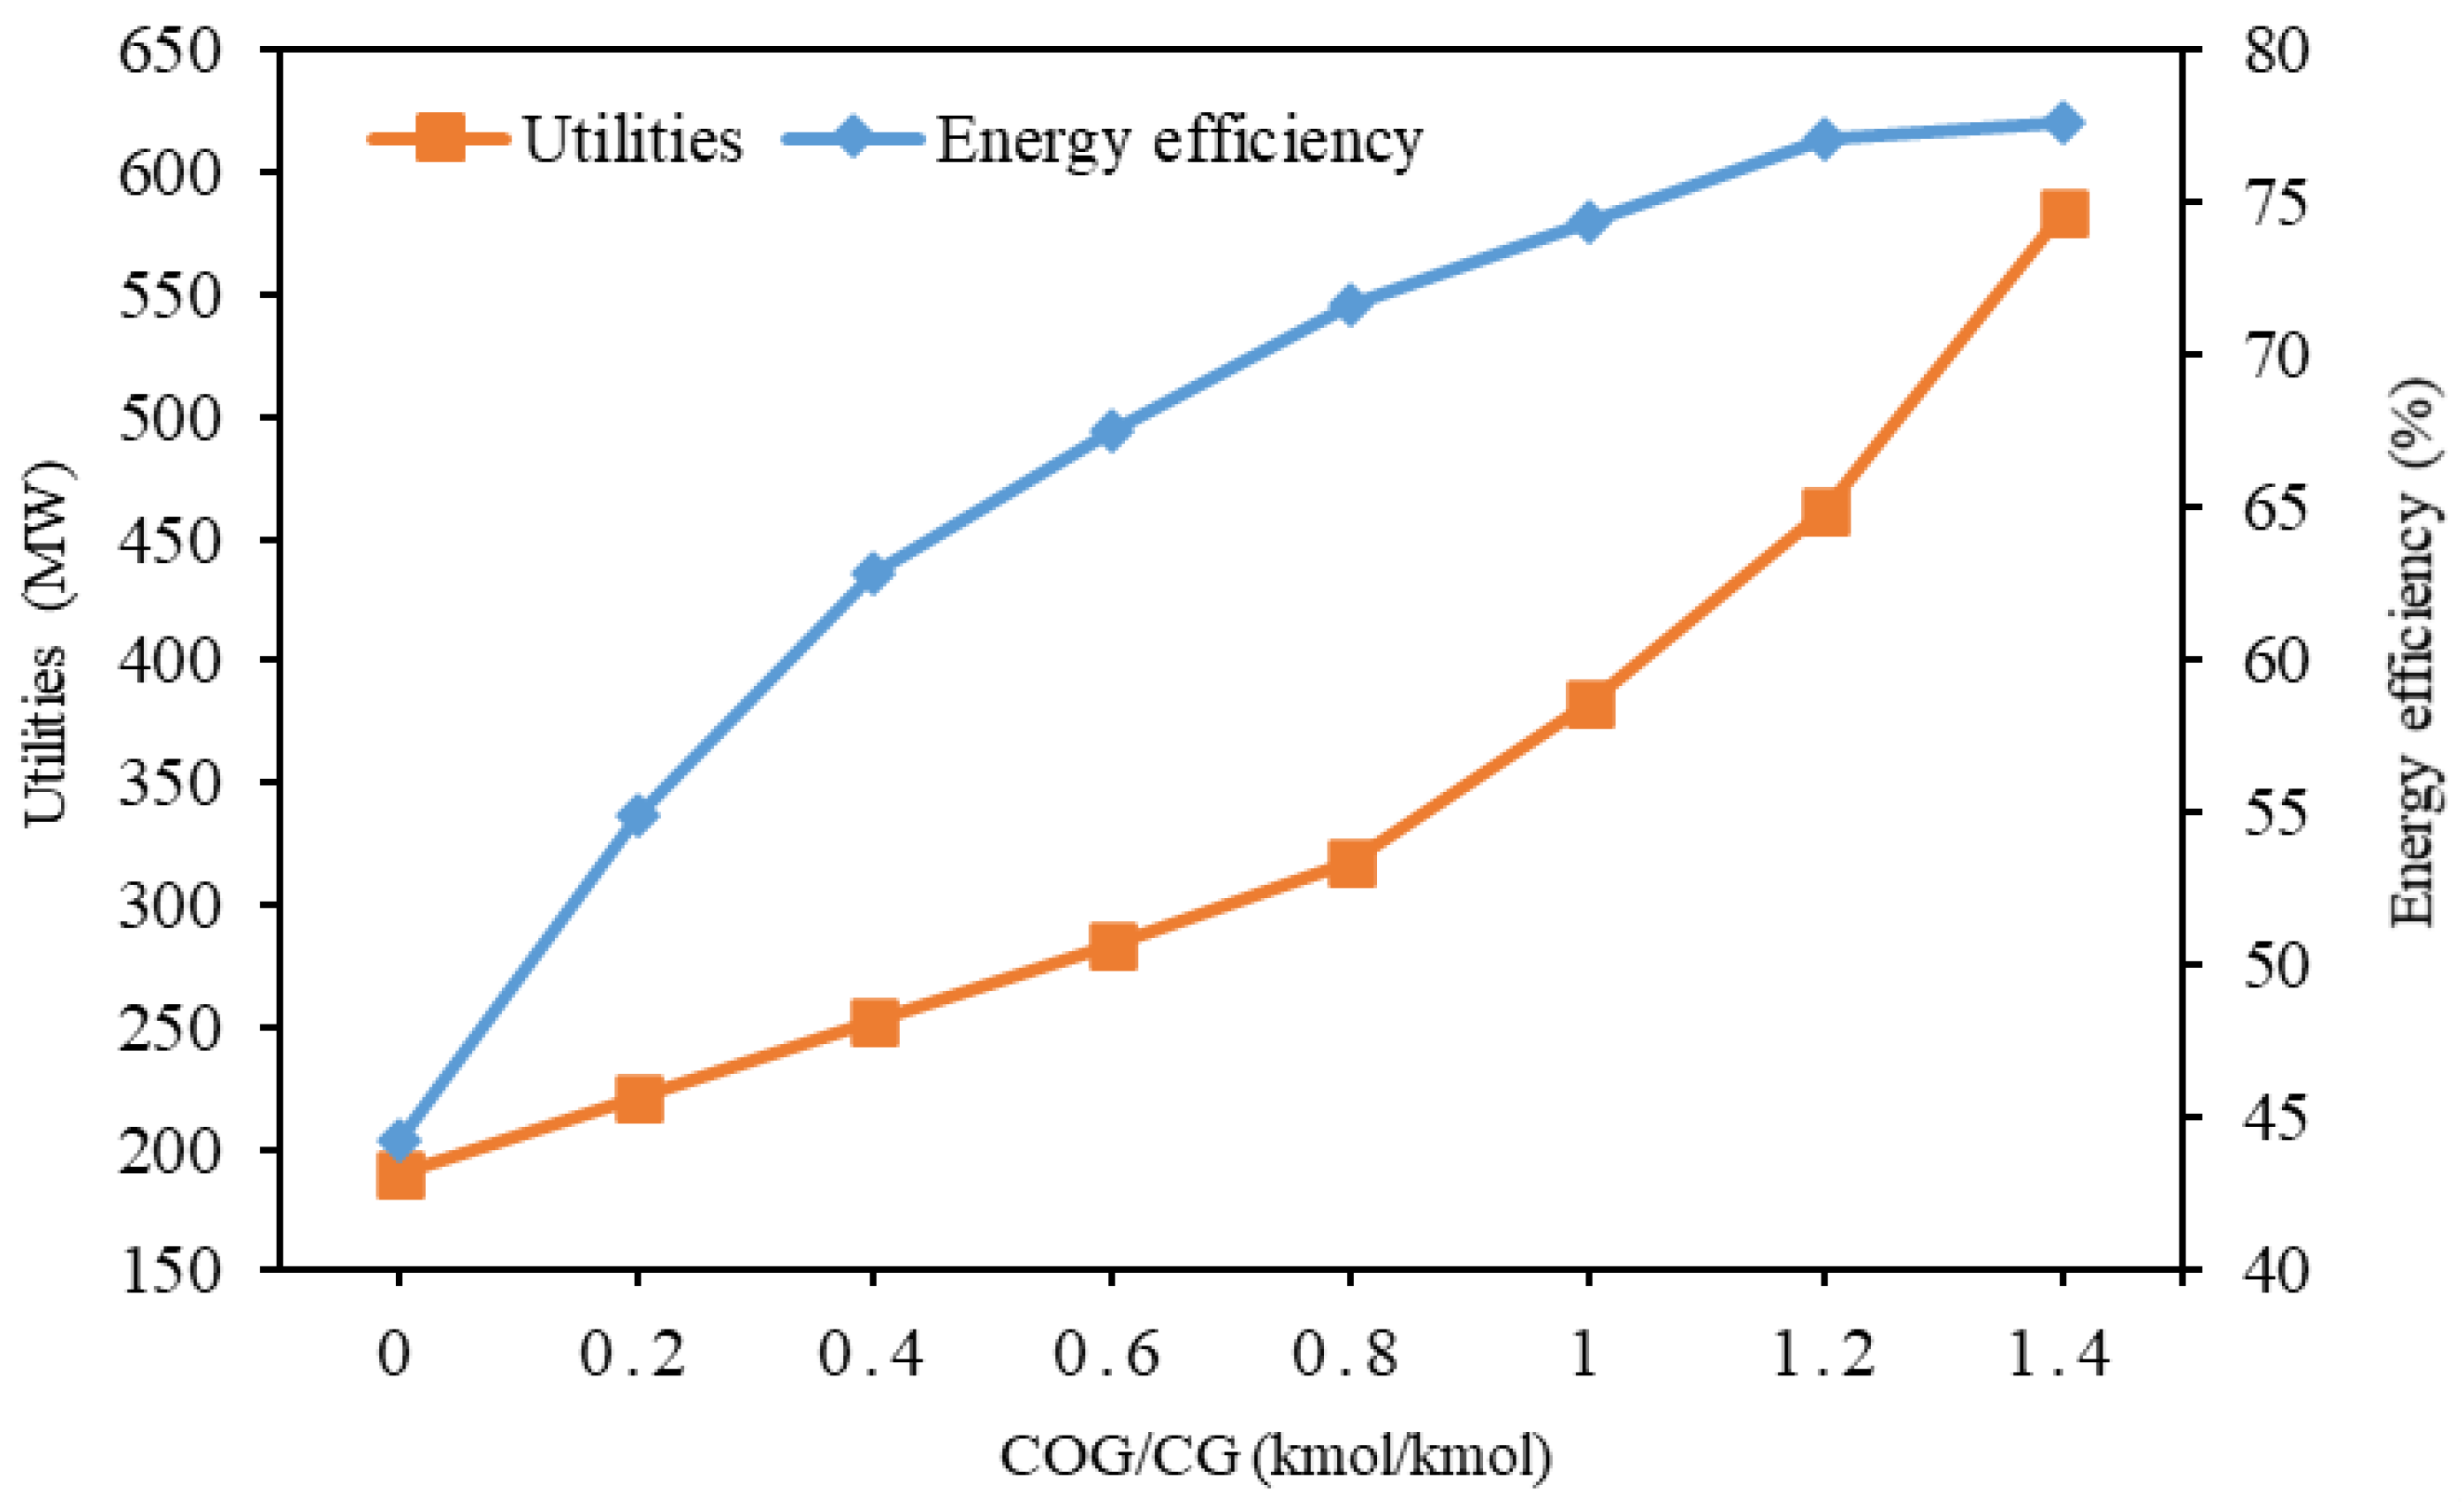
4.2.2. Energy Efficiency Analysis

The energy efficiency is analyzed in this work, as shown in Figure 15. The minimal usage of utilities is obtained when the COG/CG ratio is 0, where the system energy efficiency is also the least (44.3%). At this time, H2 production in the system is insufficient, resulting in low urea production, and a large amount of CO2 is not used.
When COG/CG rises from 0 to 1.2, utility consumption and energy efficiency increase. When COG/CG rises from 1.2 to 1.4, the increase in energy efficiency tends to be constant, which is mainly because the introduction of COG generates more H2, which indirectly increases the yield of urea. In addition, the processing capacity of each unit increases with the increase in COG/CG, which means that the energy consumption of each piece of equipment also increases.
The above analysis shows that increasing the output of products often contributes to high energy consumption of equipment. We need to find a balance between increasing the output of products and the energy consumption of the process while taking into account the impact of the process on the environment. COG-CTUCLAS&H process can improve the production output, system energy efficiency, and carbon utilization rate. However, a high proportion of COG feedstock can increase energy consumption to the contrary. Thus, 1.2 is obtained for COG/CG value In this work.

4.2.3. Technical Performance Comparison

As illustrated in Figure 16, the energy efficiency and carbon utilization rate of the CTU, CTUCLAS&H, and COG-CTUCLAS&H processes are compared. The CTUCLAS&H achieves a system efficiency of 44.30%. The CTU process only reaches an efficiency of 37.07%. This is mainly because that the energy consumption of CLHU and CLAU in CTUCLAS&H processes is lower than that of ASU and AGR in the traditional CTU process. Since the COG feedstock is required, the energy efficiency of the COG-CTUCLAS&H process can reach as high as 77.10%. For the COG-CTUCLAS&H, a significant amount of H2 is obtained by CLHU and PSA, which can be applied in NH3 synthesis to realize the increase in urea production output. Therefore, the efficiency of COG-CTUCLAS&H is enhanced by 40.03% more than that of the traditional CTU process.
The carbon utilization efficiency of CTUCLAS&H process is 35.67%, similar to that of the CTU process (35.42%). Carbon is mainly emitted in the form of carbon dioxide due to the low H2 flow rate of CTU and CTUCLAS&H. Contrary to the CTU and CTUCLAS&H, enough H2 provided by COG feedstock and CLHU ensures that almost all of CO2 is converted to urea production and achieves a carbon utilization efficiency of 78.94%. Due to the high efficiency, the CO2 capture scale and operating cost are remarkably lower than that of CTU and CTUCLAS&H.

4.3. Economic Performance Analysis

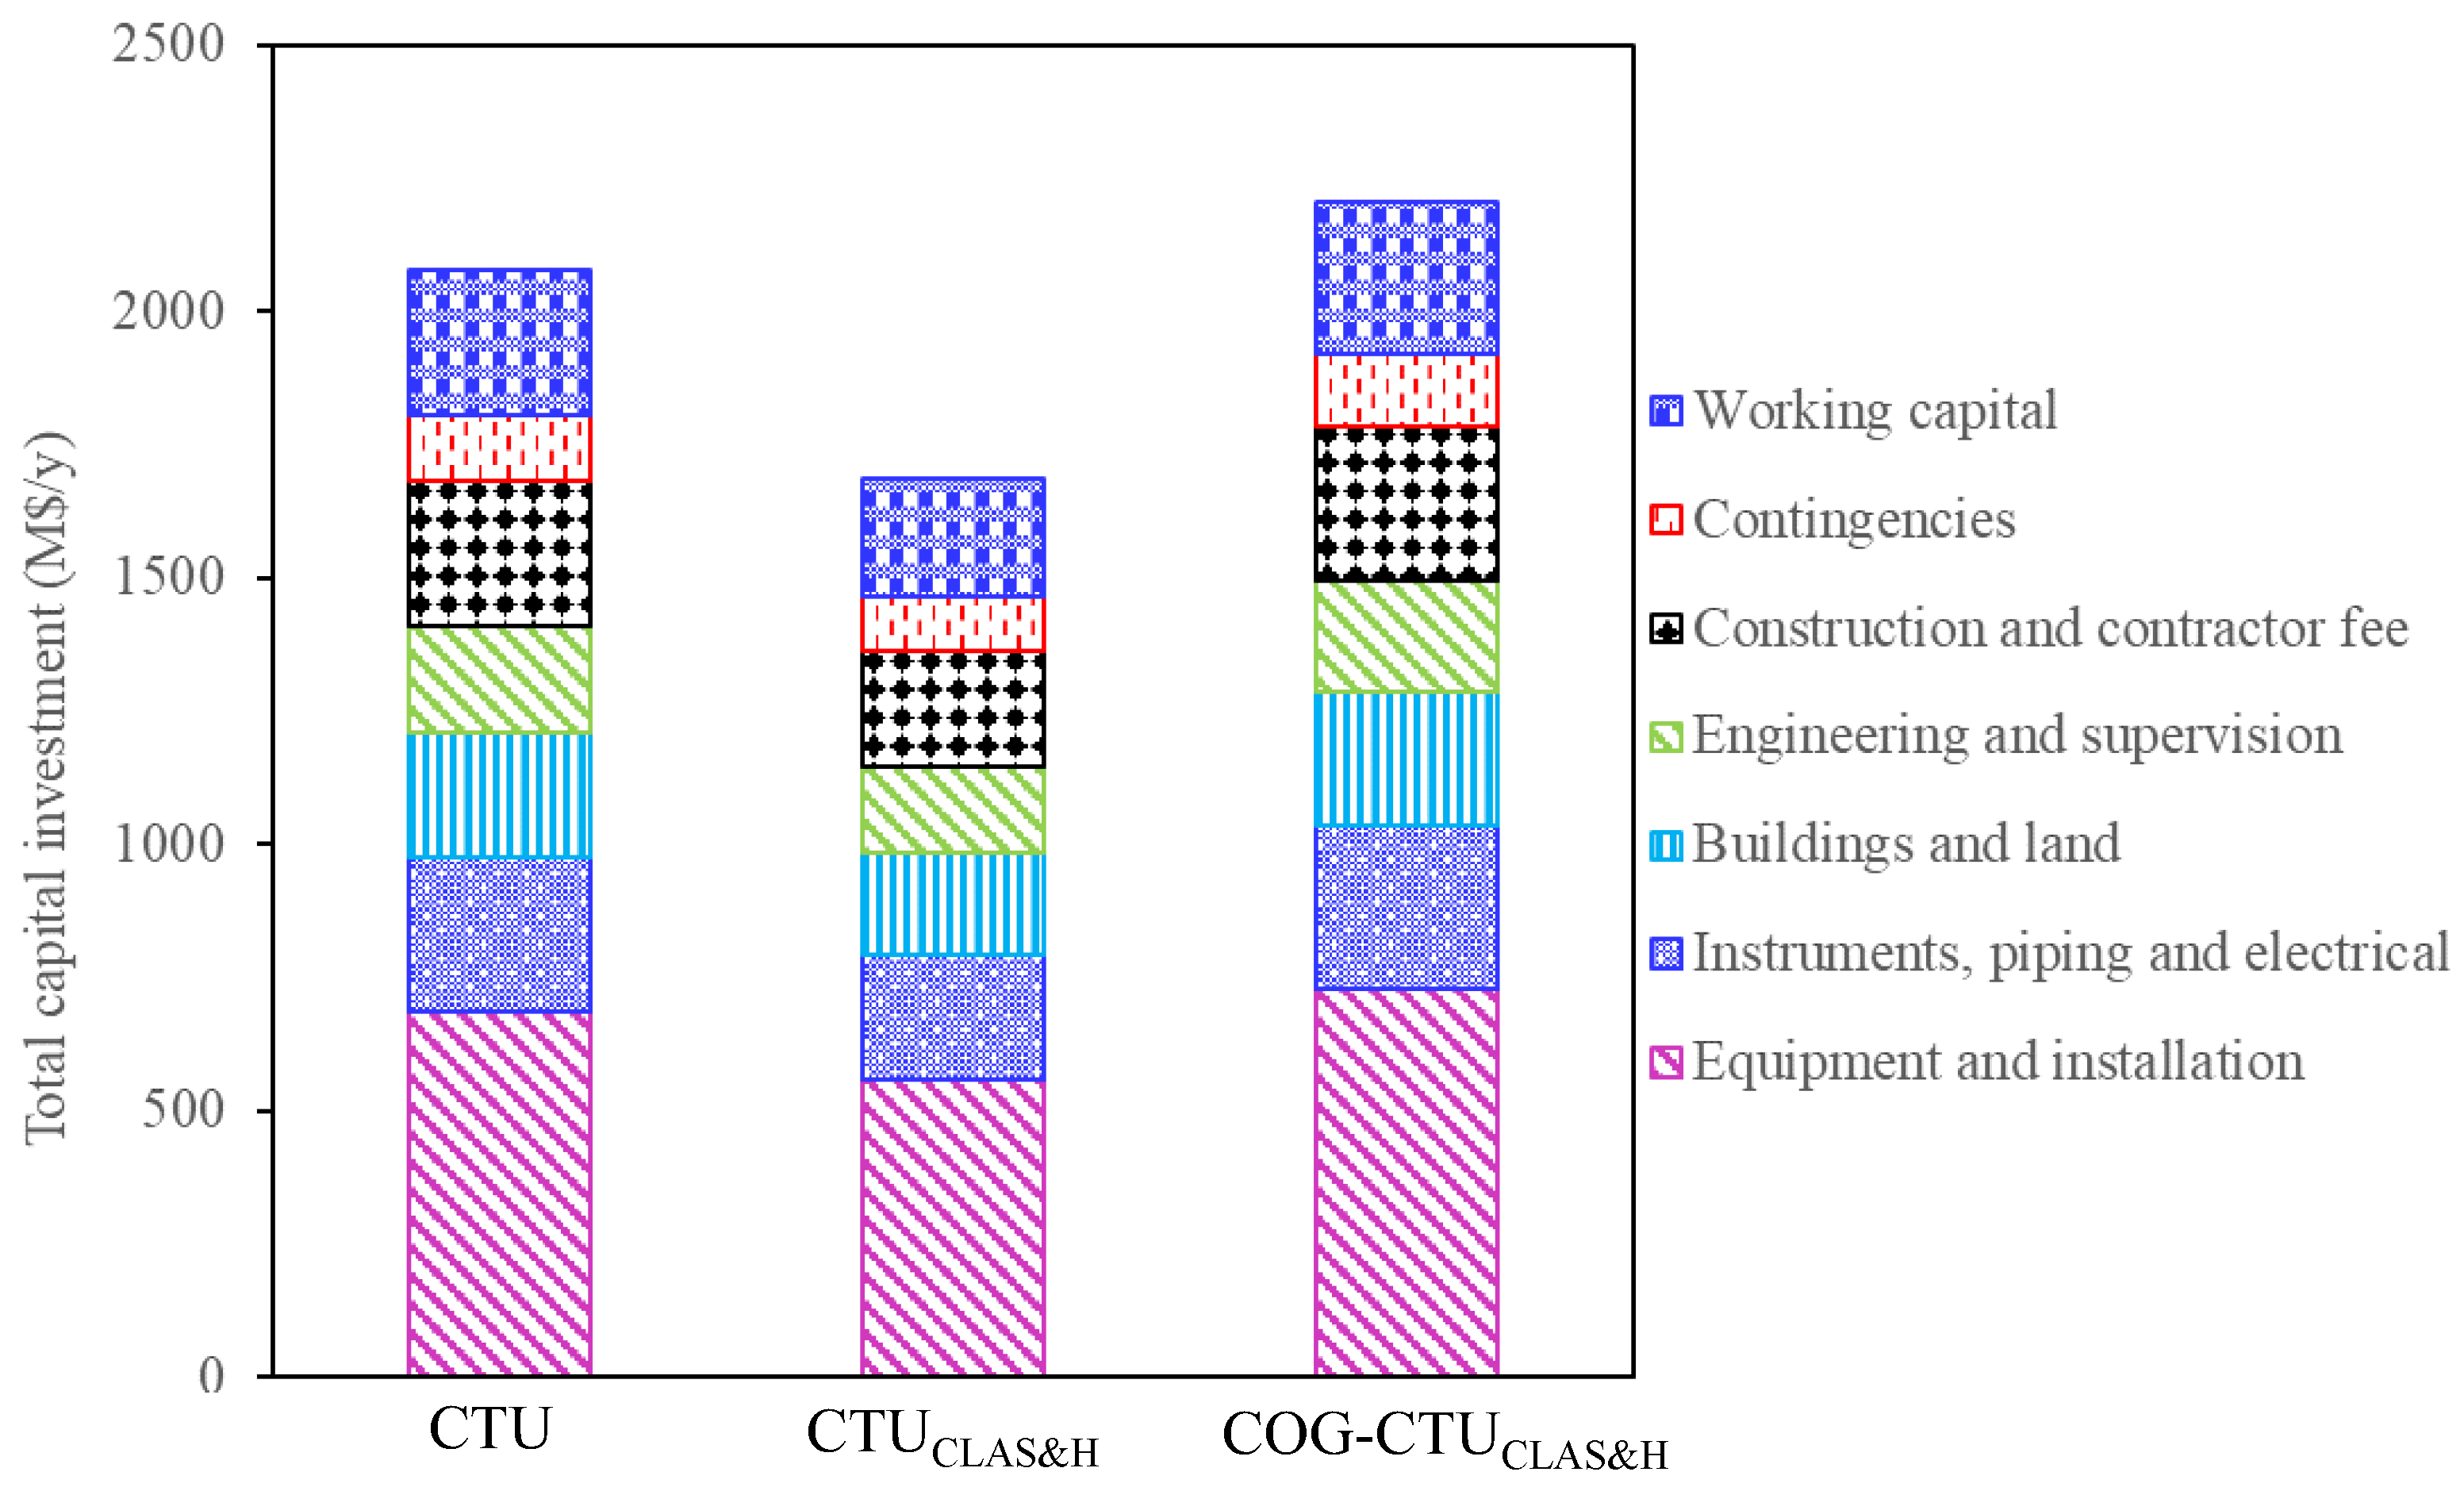
4.3.1. Total Capital Investment Analysis

According to Equations (25) and (26) and Table S1, the TCIs of the CTU, CTUCLAS&H, and COG-CTUCLAS&H are calculated and the results are shown in Figure 17. The TCI of the CTUCLAS&H is 1687.34 M$/y, which is 18.81% lower than that of the CTU (2078.14 M$/y). This is mainly because that the CTUCLAS&H process adopts CLAS and CLH technologies to produce oxygen and hydrogen for low energy consumption and low capital investment compared to that of the conventional CAS and WGS in the CTU process. Compared with the CTU and CTUCLAS&H, the TCI of the COG-CTUCLAS&H is increased to 2207.44 M$/y. Because the flowsheet of the COG-CTUCLAS&H is longer than that of the CTU and CTUCLAS&H, it requires the pretreatment of COG and then pressure swing adoption for hydrogen and methane separation. The hydrogen is introduced into the AP unit and methane is introduced into the CLH unit. The processing scales of the CLH, AP, and UP units are increased as the introduction of COG. Hence, the COG-CTUCLAS&H has the largest capital cost.

4.3.2. Total Production Cost Analysis

After calculation based on Equation (27) and Table S2, the TPCs of the CTU, CTUCLAS&H and COG-CTUCLAS&H are shown in Figure 18. They are USD 174.65/t-urea, USD 162.11/t-urea, and USD 201.34/t-urea, respectively. The TPC of the COG-CTUCLAS&H is 15.28% and 24.19% larger than that of the CTU and CTUCLAS&H. This is mainly because the introduction of COG of the CTUCLAS&H for high carbon utilization, which makes the raw material costs 1.56 and 1.57 times that of the CTU and CTUCLAS&H. However, the COG-CTUCLAS&H has the largest urea production, which is approximately 2.0 times that of the CTU and CTUCLAS&H. Thus, the increase in other costs, excluding raw material costs of unit urea, is not clearly comparable to that of the CTU and CTUCLAS&H.

4.3.3. Sensitivity Analysis

For the total production cost analysis, e.g., COG-CTUCLAS&H, the raw material cost, utilities cost, operating and maintenance cost, depreciation cost, plant overhead cost, and general expenses respectively account for 69%, 13%, 0.8%, 12.3%, 0.6%, and 4% of the total production cost. The price of raw coal, steam price, and total capital investment have the greatest impact on the total production cost. In this paper, we conducted sensitivity analysis on the effect of coal price, steam price, and total capital investment on the production cost. The results are shown in Figure 19. In the case of coal prices falling and rising by 20%, the TPC of the CTUCLAS&H drops to USD 140.95/t-urea and rises to USD 183.28/t-urea, and that of the COG-CTUCLAS&H drops to USD 166.64/t-urea and rises to USD 236.03/t-urea. The steam price and total capital investment have little impact on the production cost.

4.3.4. Internal Rate of Return Analysis

The IRRs for three processes are shown in Figure 20. The IRRs of the CTU, CTUCLAS&H, and COG-CTUCLAS&H processes are 14%, 16%, and 26% with the coal and urea prices of USD 100 and USD 357/t, respectively. Obviously, the IRRs of the COG-CTUCLAS&H process are higher than those of the CTU and CTUCLAS&H processes. Moreover, the IRRs of the three processes are greater than 12%, where all three processes are economically feasible and profitable. Moreover, the IRRs for processes highly relies on the urea price. When urea price increase from USD 285 to 428/t, the IRRs of CTU, CTUCLAS&H, and COG-CTUCLAS&H processes are increased to 21%, 24%, and 39%, respectively. In addition, when coal prices increase from USD 80 to 120/t, the IRRs of different processes are decreased to 11%, 14%, and 24%, respectively.

5. Conclusions

In this paper, two novel coal-to-urea processes (CTUCLAS&H and COG-CTUCLAS&H) based on chemical looping air separation (CLAS) and chemical looping hydrogen production (CLH) technologies are proposed for high energy efficiency and urea yield. The high energy consumption of cryogenic air separation unit and water–gas shift unit of the traditional CTU process is replaced by CLAS and CLH in the CTUCLAS&H. Furthermore, COG feedstock is introduced into the CTUCLAS&H to improve carbon utilization efficiency and overall system energy efficiency. Technical-economic performances are assessed in this paper after process modeling, key parameter analysis, and system analysis. The main conclusions for this study are as follows:
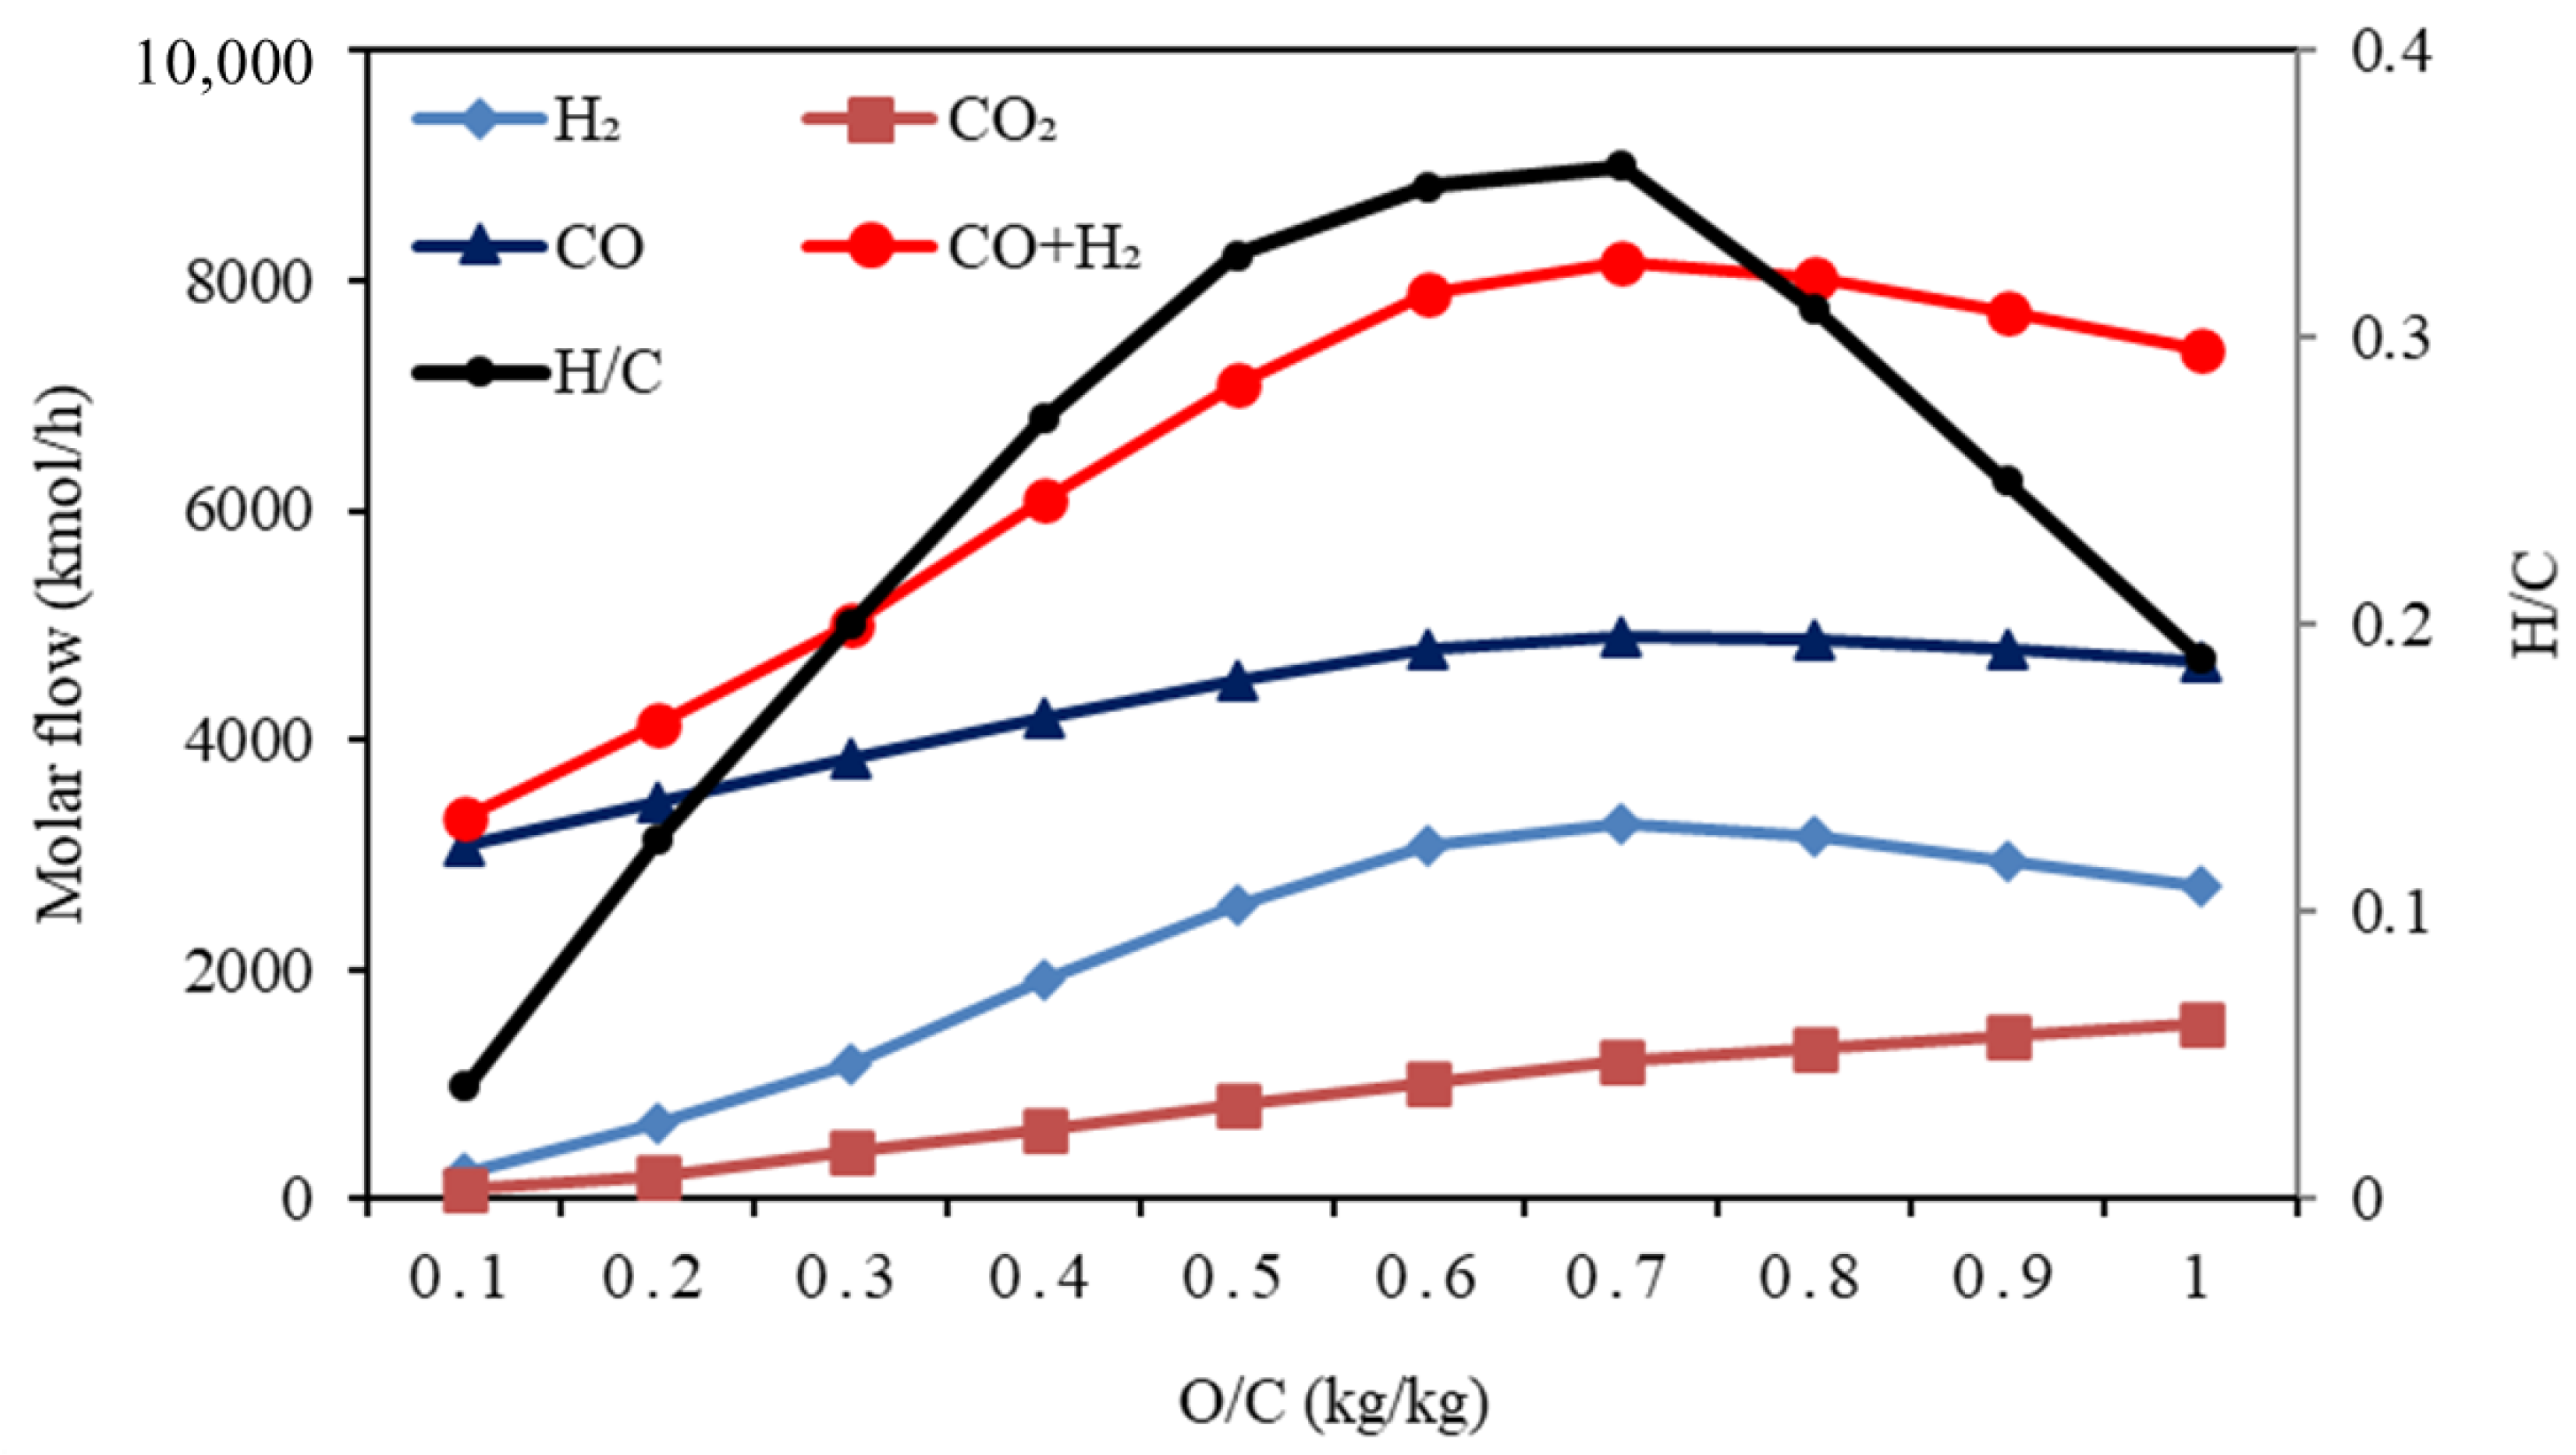
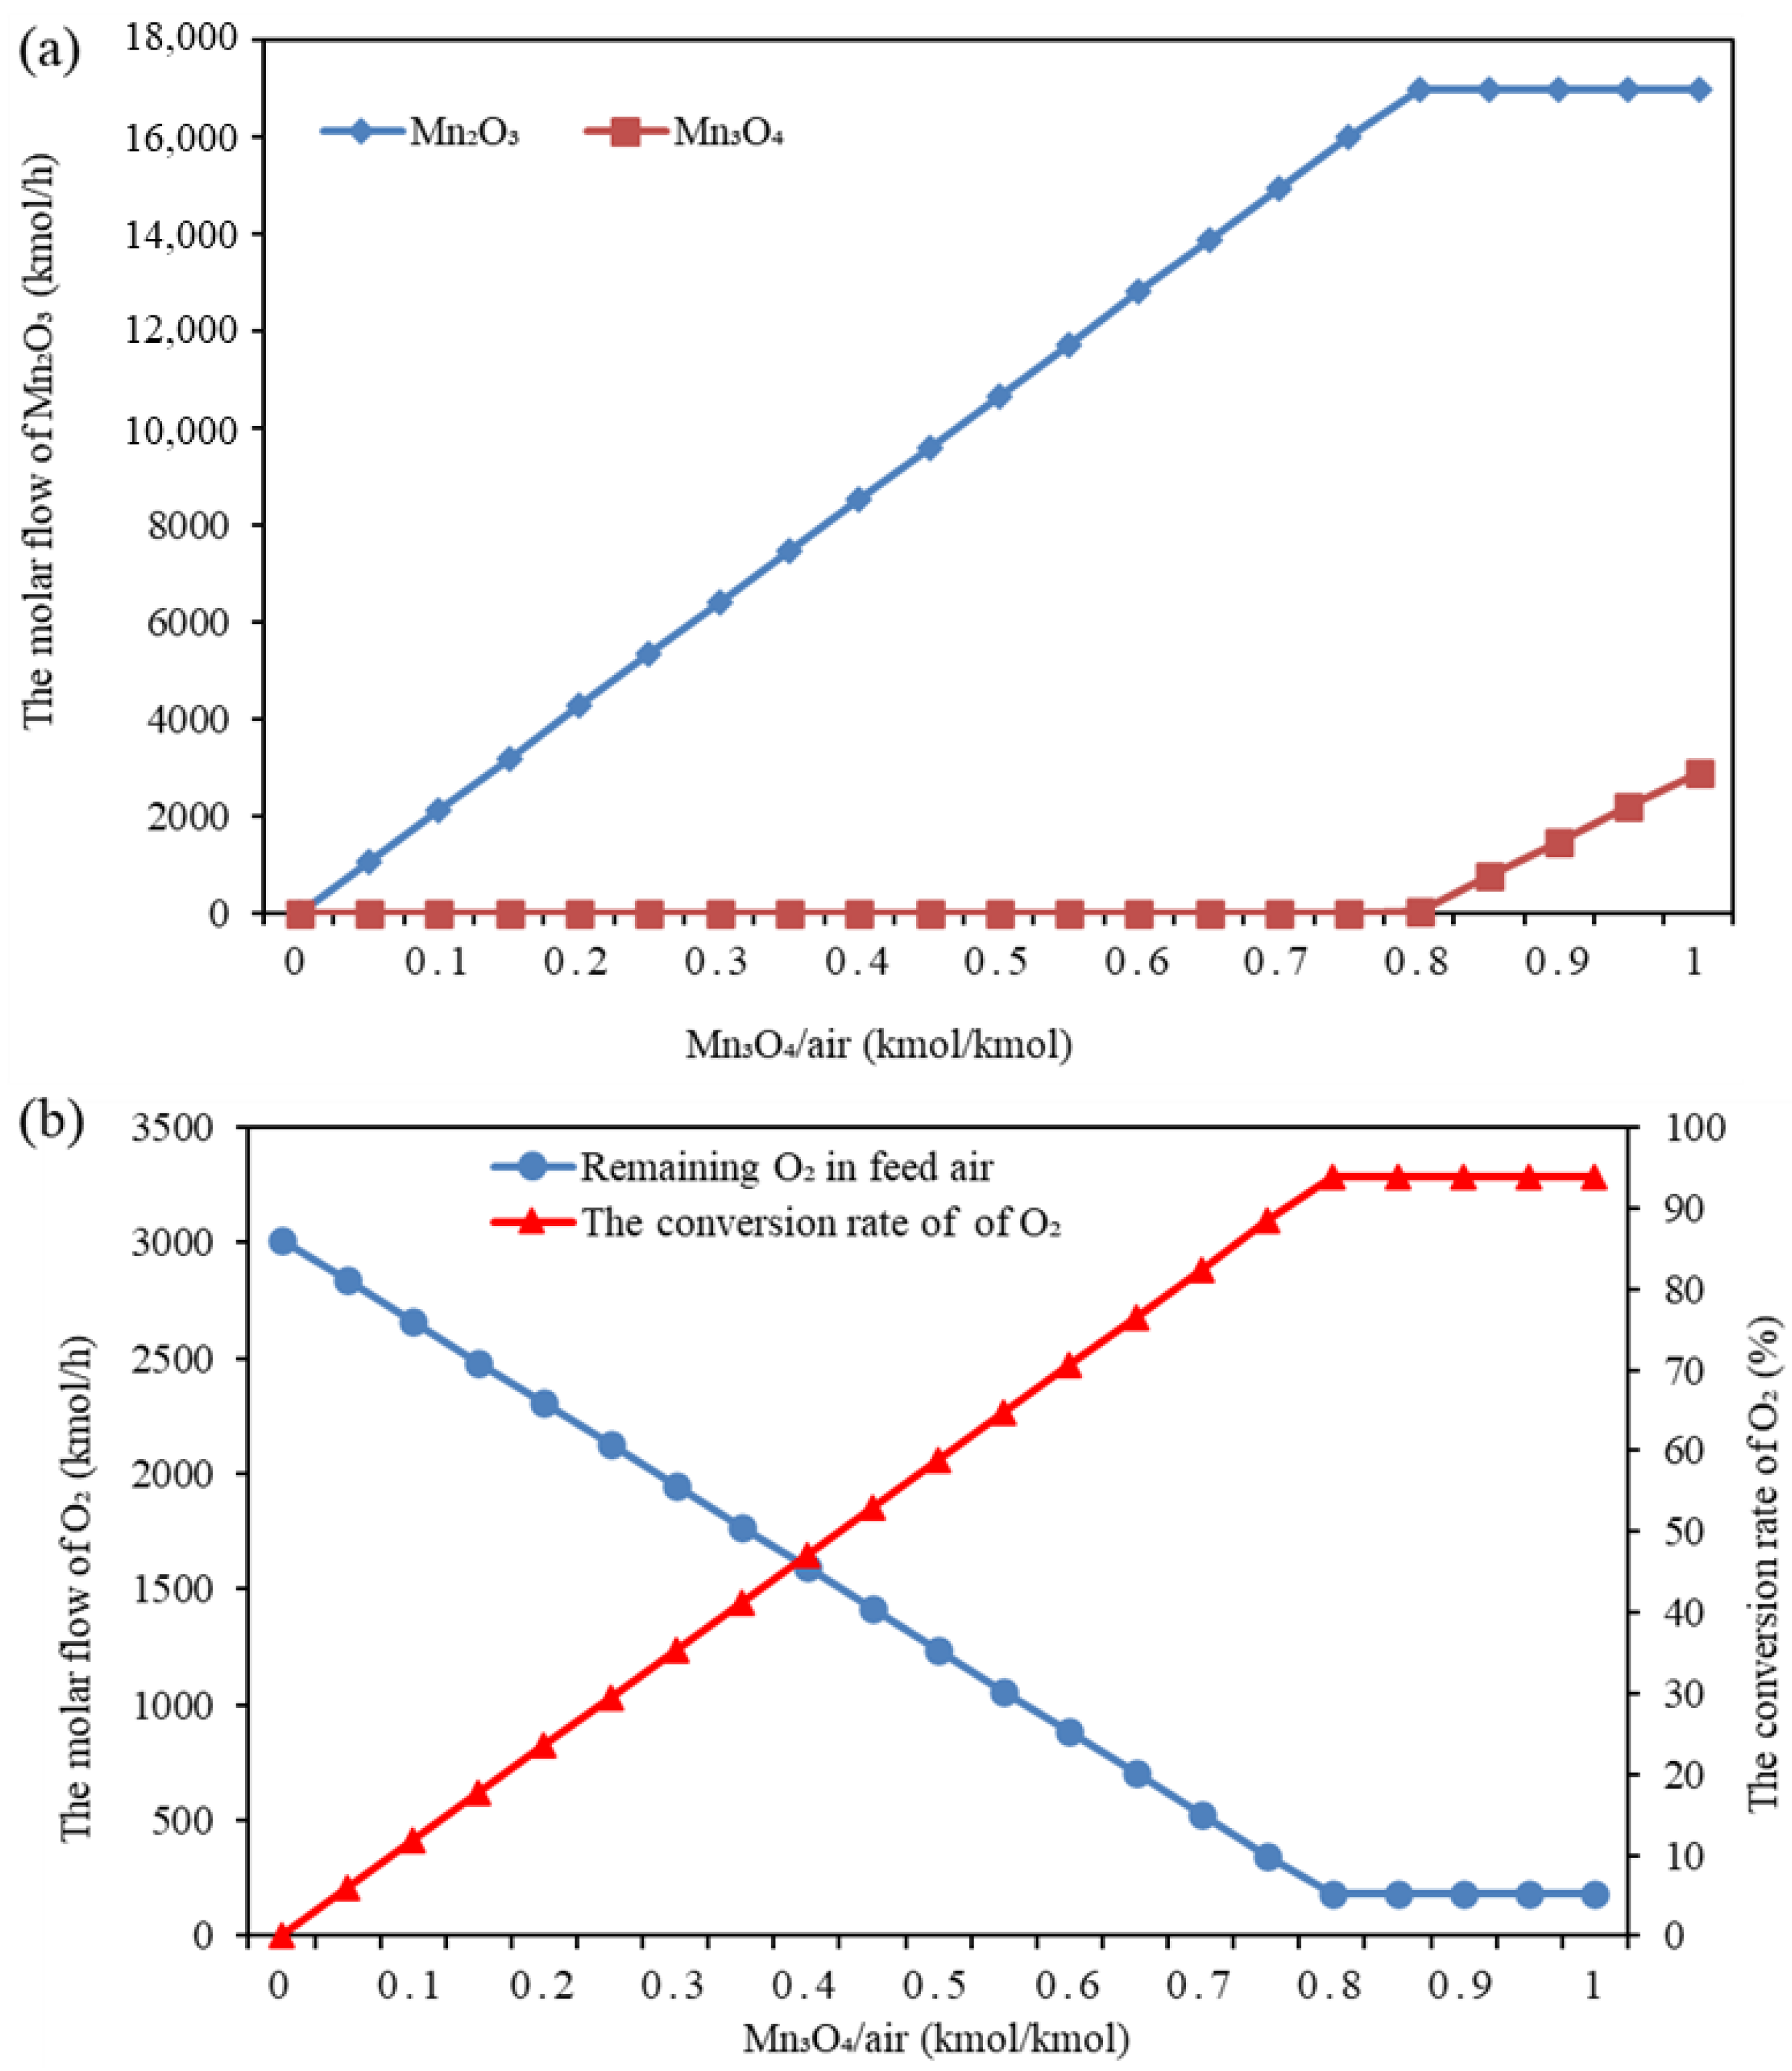
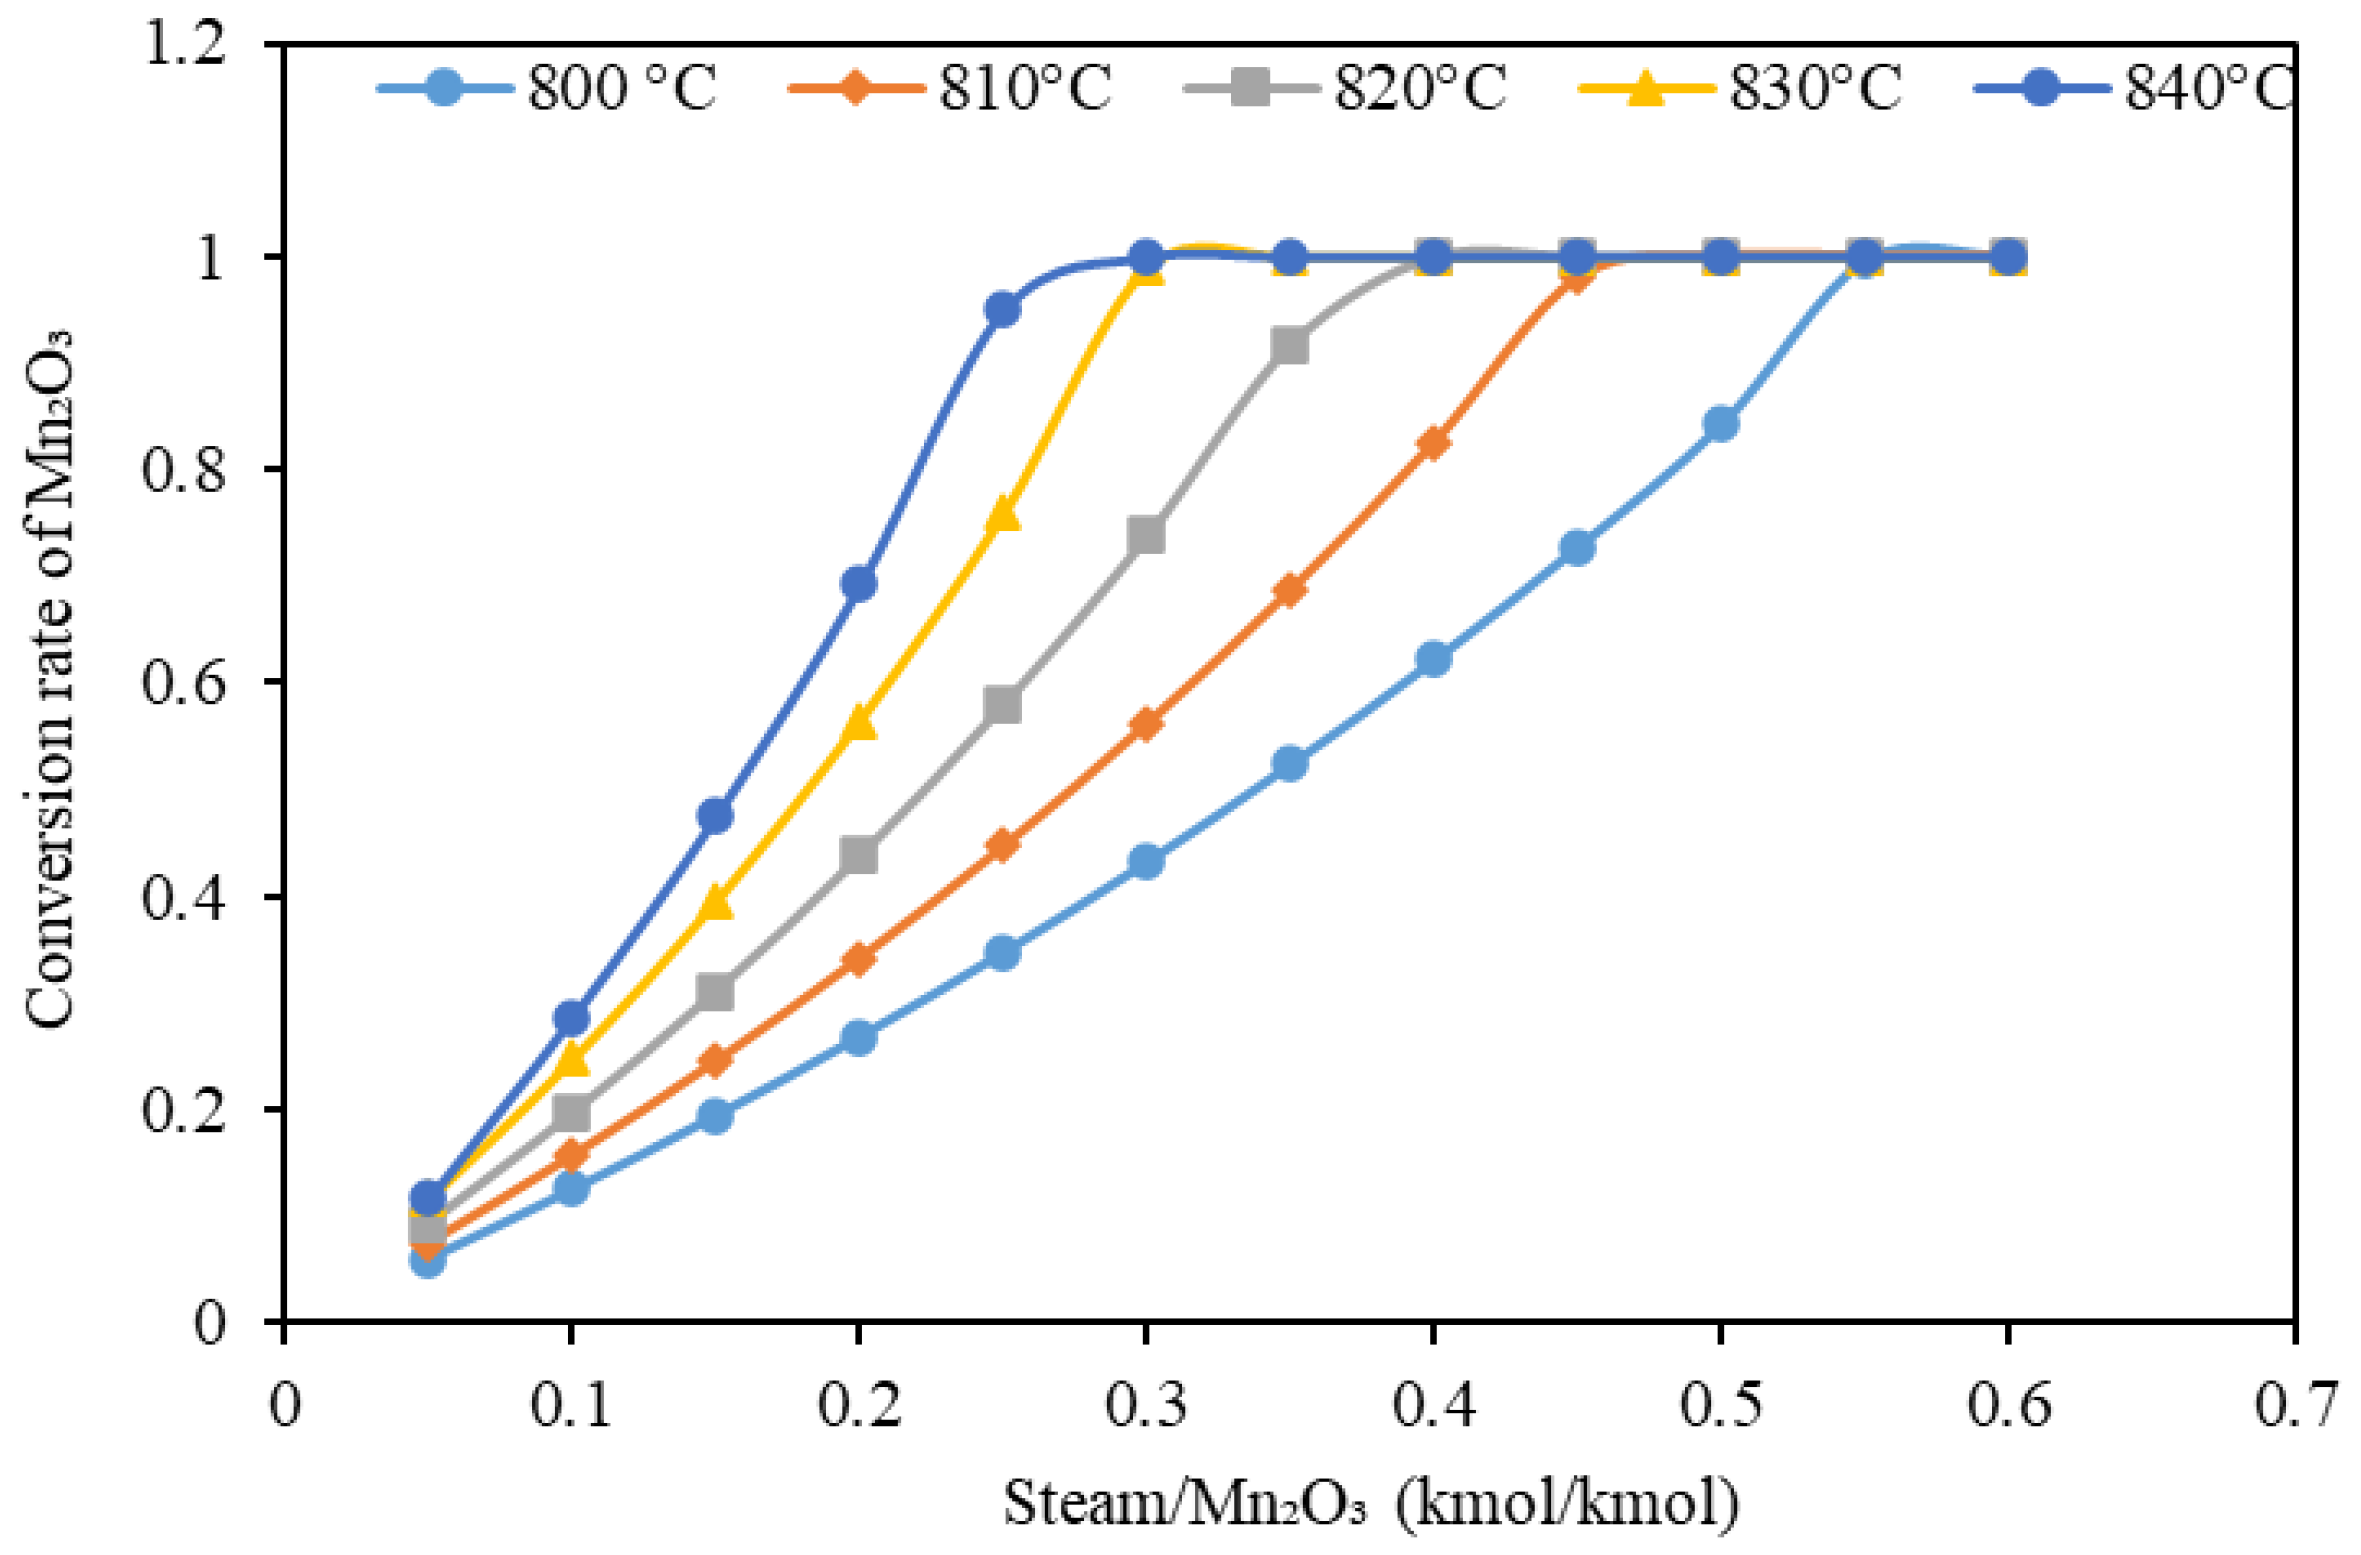
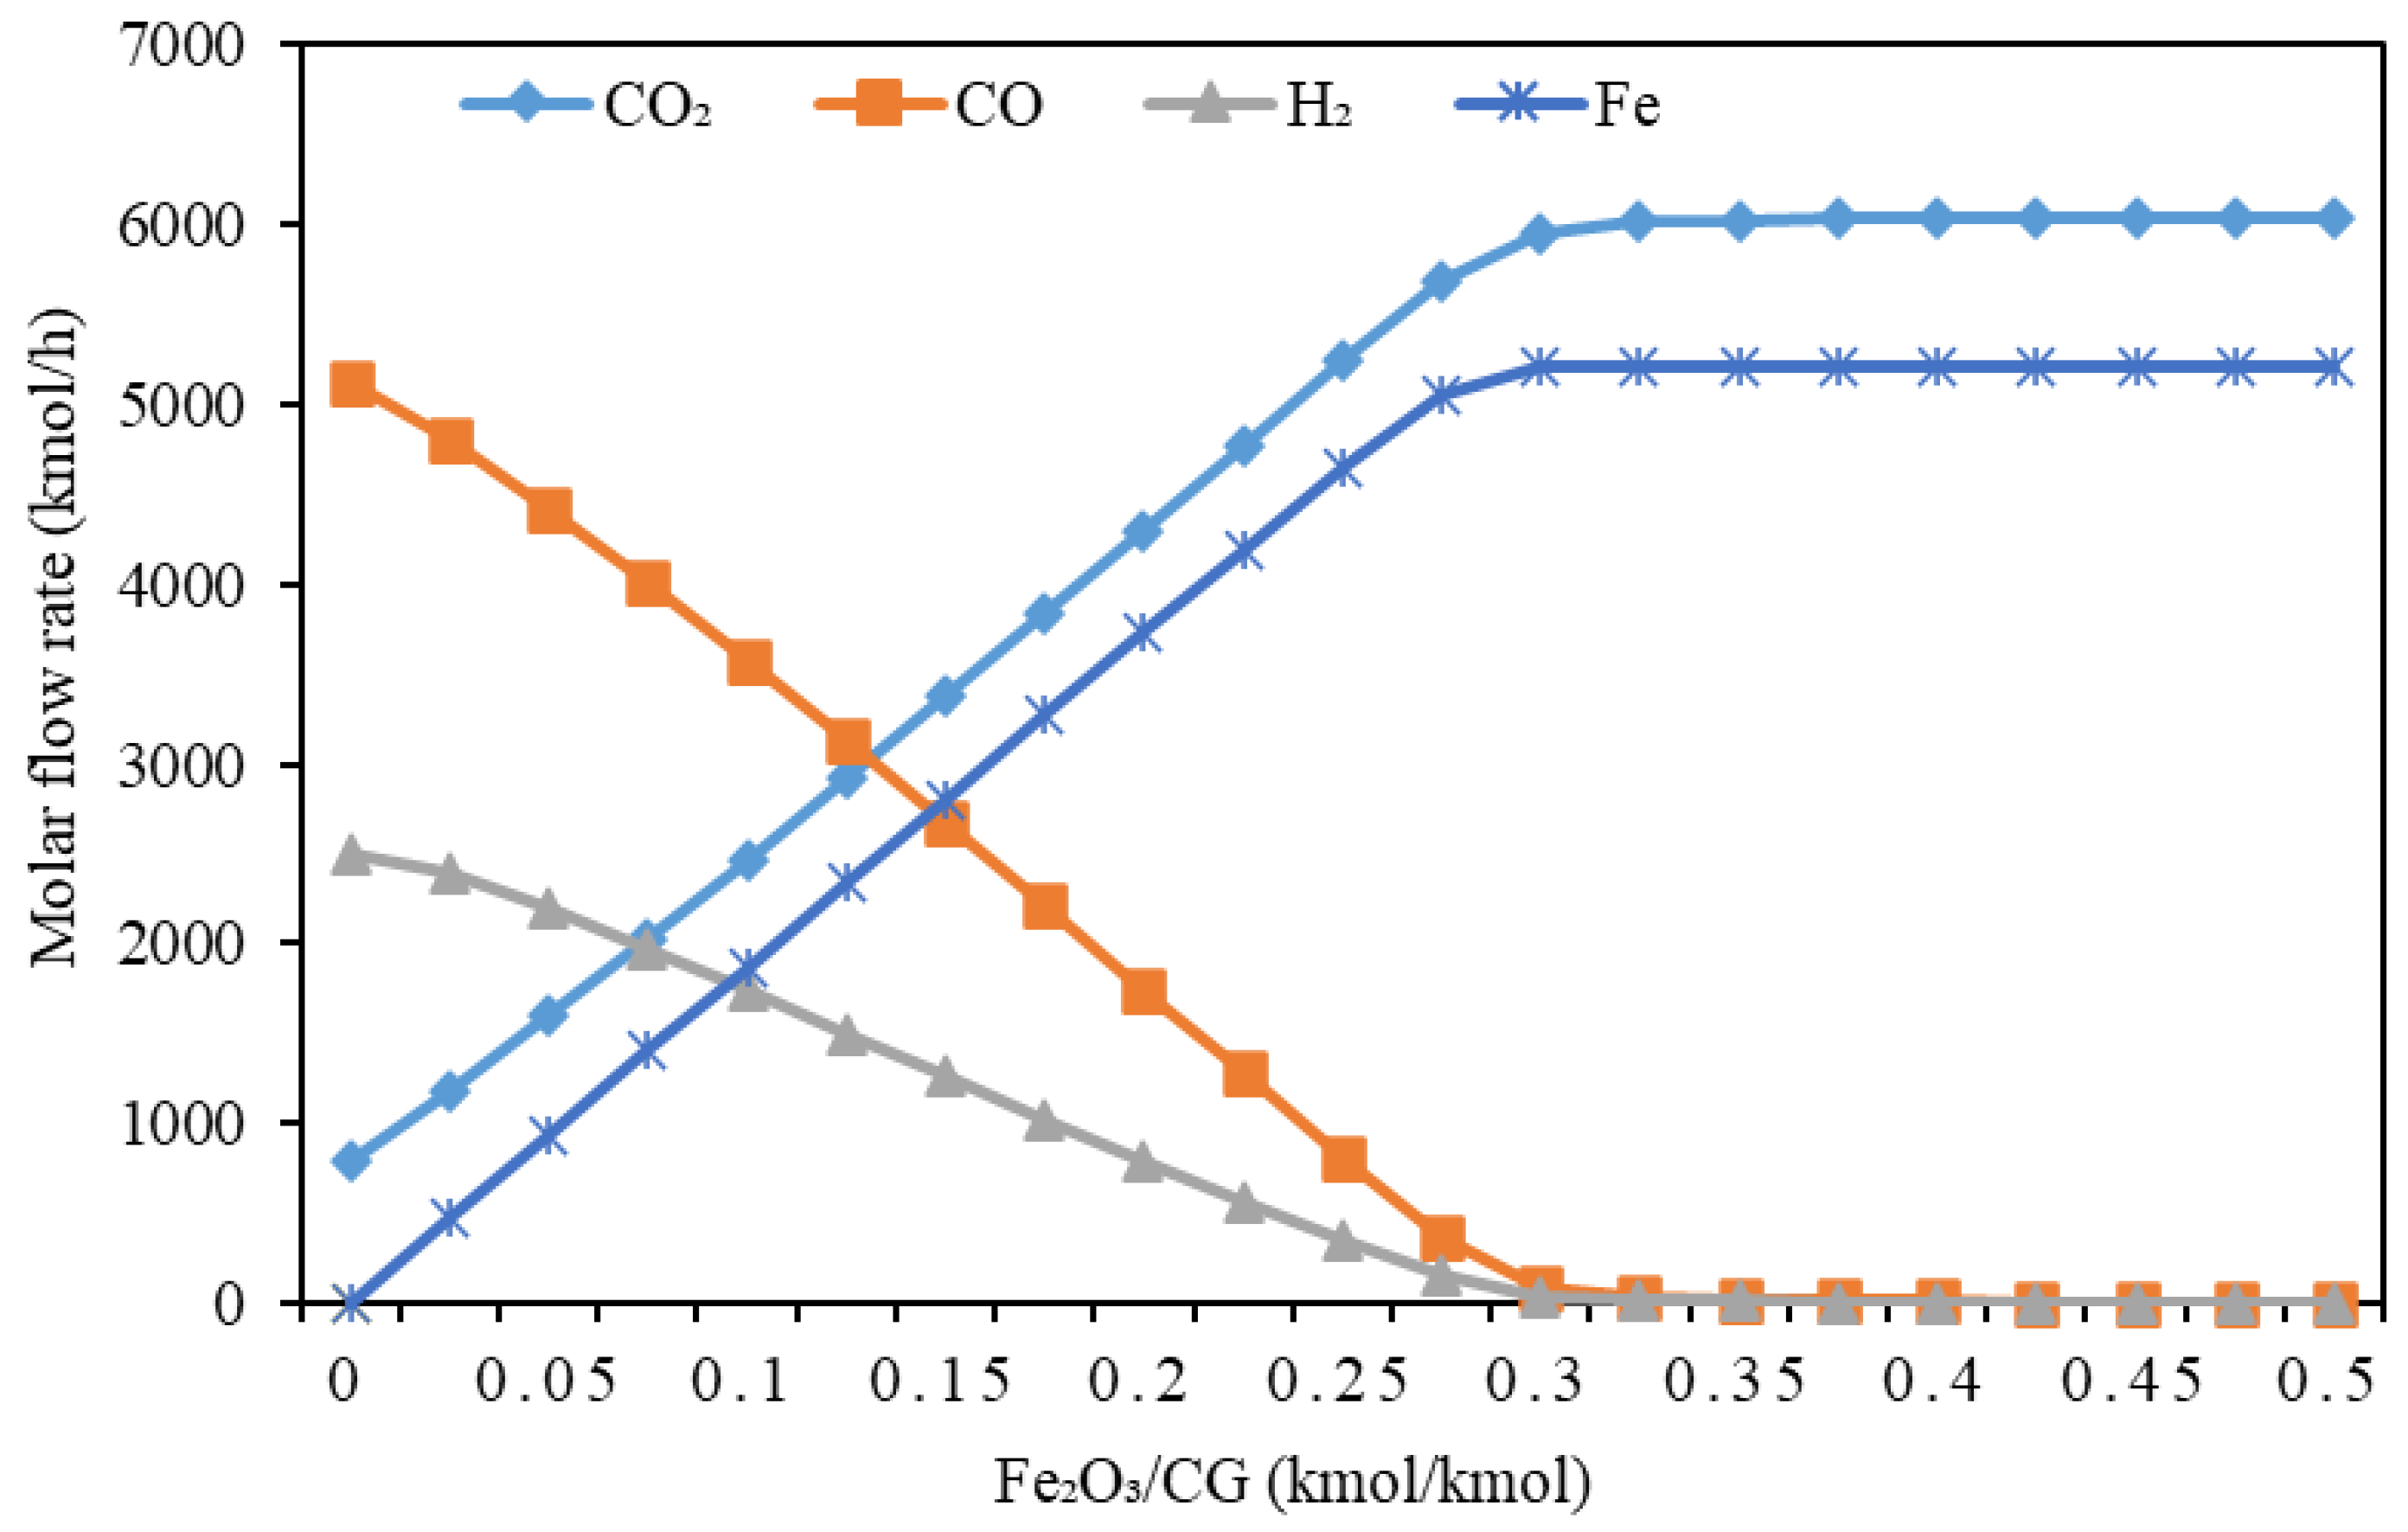
  • The optimized oxygen/coal ratio, Mn3O4/air, S/Mn2O3, Fe2O3/CG, and COG/CG are 0.7, 0.8, 0.3, 0.3, and 1.2, respectively, and 830 °C is chosen for the reaction temperature of the CLAS.
  • The carbon utilization ratio of COG-CTUCLAS&H is 78.94% higher than that of traditional CTU (35.67%) when the optimized value COG/CG is 1.2. Compared with the CTU and CTUCLAS&H, the COG-CTUCLAS&H process can generally achieve the highest overall system efficiency (77.10%), indicating a promising technical method for CTUCLAS&H assisted with COG feedstock.
  • The product costs of CTU, CTUCLAS&H and COG-CTUCLAS&H processes are USD 174.65, USD 162.11, and USD 201.34/t-urea, respectively. The introduction of coke-oven gas results in increased production cost of the COG-CTUCLAS&H process. Sensitivity analysis of the coal price and urea price changes on internal return of rate indicates that the COG-CTUCLAS&H has higher economic benefit and stronger ability to resist market risk. The urea yield is enhanced largely improving the economic performance and market competitiveness of COG-CTUCLAS&H.
It is concluded that the COG-CTUCLAS&H process has more considerable technical and economic advantages than those of the CTU and CTUCLAS&H processes. The CLAS and CLH are the state-of-the-art technologies for lower energy consumption and lower capital investment used in the CTU process. In addition, the introduction of COG brings about a higher carbon utilization rate and larger economic benefits. However, the integration of COG pretreatment and pressure swing adsorption makes the urea production process longer and more complex, which affects the process’s operability and security. This paper is focused on conceptual design and modeling of the COG-CTUCLAS&H as well as exploring its techno-economic feasibility. The next work should be conducted for optimizing material, energy, and water networks and the safety control of the whole system. Therefore, we hope this work can provide a promising route for urea production characterized by economic and environmental benefits.

Supplementary Materials

The following supporting information can be downloaded at: https://www.mdpi.com/article/10.3390/pr11030960/s1, Table S1: Ratio factors for capital investment; Table S2: Assumptions for the estimation of the total product cost; Table S3: Simulation results of the CTU process; Table S4: Simulation results of the CTUCLAS&H process; Table S5: Simulation results of the COG-CTUCLAS&H process.

Author Contributions

Conceptualization, Q.W. and H.Z.; methodology, Q.W.; software, Q.W.; validation, Q.W., H.Z. and Y.Y.; formal analysis, Q.W.; investigation, Q.W.; resources, H.Z.; data curation, H.Z.; writing—original draft preparation, Q.W.; writing—review and editing, Y.Y.; visualization, H.Z.; supervision, H.Z.; project administration, H.Z. All authors have read and agreed to the published version of the manuscript.

Funding

This research received no external funding.

Data Availability Statement

The data presented in this study are available on request from the first author.

Conflicts of Interest

The authors declare no conflict of interest.

References

  1. Sergeev, Y.A.; Anderzhanov, R.V.; Vorob’Ev, A.A. Energy- and Resourse-Saving Technologies and Equipment in Urea Production. Russ. J. Gen. Chem. 2020, 90, 1168–1172. [Google Scholar] [CrossRef]
  2. Rollinson, A.N.; Rickett, G.L.; Lea-Langt, A.; Dupont, V.; Twigg, M.V. Hydrogen from urea-water and ammonia-water solutions. Appl. Catal. B Environ. 2011, 106, 304–315. [Google Scholar] [CrossRef] [Green Version]
  3. Elishav, O.; Lewin, D.R.; Shter, G.E.; Grader, G.S. The nitrogen economy: Economic feasibility analysis of nitrogen-based fuels as energy carriers. Appl. Energy 2017, 185, 183–188. [Google Scholar] [CrossRef]
  4. Bicer, Y.; Dincer, I.; Vezina, G.; Raso, F. Impact Assessment and Environmental Evaluation of Various Ammonia Production Processes. Environ. Manag. 2017, 59, 842–855. [Google Scholar] [CrossRef]
  5. Habgood, D.C.; Hoadley, A.F.; Zhang, L. Techno-economic analysis of gasification routes for ammonia production from Victorian brown coal. Chem. Eng. Res. Des. 2015, 102, 57–68. [Google Scholar] [CrossRef]
  6. Yang, C.-J.; Jackson, R.B. China’s growing methanol economy and its implications for energy and the environment. Energy Policy 2012, 41, 878–884. [Google Scholar] [CrossRef]
  7. Huang, H.; Yang, S.; Cui, P. Design concept for coal-based polygeneration processes of chemicals and power with the lowest energy consumption for CO2 capture. Energy Convers. Manag. 2018, 157, 186–194. [Google Scholar] [CrossRef]
  8. Khan, M.N.; Shamim, T. Investigation of hydrogen generation in a three reactor chemical looping reforming process. Appl. Energy 2016, 162, 1186–1194. [Google Scholar] [CrossRef]
  9. Adanez, J.; Abad, A.; Garcia-Labiano, F.; Gayan, P.; de Diego, L.F. Progress in Chemical-Looping Combustion and Reforming technologies. Prog. Energy Combust. Sci. 2012, 38, 215–282. [Google Scholar] [CrossRef] [Green Version]
  10. Nandy, A.; Loha, C.; Gu, S.; Sarkar, P.; Karmakar, M.K.; Chatterjee, P.K. Present status and overview of Chemical Looping Combustion technology. Renew. Sustain. Energy Rev. 2016, 59, 597–619. [Google Scholar] [CrossRef]
  11. Moghtaderi, B. Review of the Recent Chemical Looping Process Developments for Novel Energy and Fuel Applications. Energy Fuels 2011, 26, 15–40. [Google Scholar] [CrossRef]
  12. Tong, A.; Bayham, S.; Kathe, M.V.; Zeng, L.; Luo, S.; Fan, L.-S. Iron-based syngas chemical looping process and coal-direct chemical looping process development at Ohio State University. Appl. Energy 2014, 113, 1836–1845. [Google Scholar] [CrossRef]
  13. Edrisi, A.; Mansoori, Z.; Dabir, B.; Shahnazari, A. Hydrogen, nitrogen and carbon dioxide production through chemical looping using iron-based oxygen carrier—A Green plant for H2 and N2 production. Int. J. Hydrog. Energy 2014, 39, 10380–10391. [Google Scholar] [CrossRef]
  14. Edrisi, A.; Mansoori, Z.; Dabir, B. Using three chemical looping reactors in ammonia production process—A novel plant configuration for a green production. Int. J. Hydrog. Energy 2014, 39, 8271–8282. [Google Scholar] [CrossRef]
  15. Mehrpooya, M.; Sharifzadeh, M.M.M.; Rajabi, M.; Aghbashlo, M.; Tabatabai, M.; Hosseinpour, S.; Ramakrishna, S. Design of an integrated process for simultaneous chemical looping hydrogen production and electricity generation with CO 2 capture. Int. J. Hydrog. Energy 2017, 42, 8486–8496. [Google Scholar] [CrossRef]
  16. Kim, A.R.; Lee, H.Y.; Cho, J.M.; Choi, J.-H.; Bae, J.W. Ni/M-Al2O3 (M=Sm, Ce or Mg) for combined steam and CO2 reforming of CH4 from coke oven gas. J. CO2 Util. 2017, 21, 211–218. [Google Scholar] [CrossRef]
  17. Yi, Q.; Wu, G.-S.; Gong, M.-H.; Huang, Y.; Feng, J.; Hao, Y.-H.; Li, W.-Y. A feasibility study for CO2 recycle assistance with coke oven gas to synthetic natural gas. Appl. Energy 2017, 193, 149–161. [Google Scholar] [CrossRef]
  18. Bhui, B.; Vairakannu, P. Experimental and kinetic studies on in-situ CO2 gasification based chemical looping combustion of low ash coal using Fe2O3 as the oxygen carrier. J. CO2 Util. 2019, 29, 103–116. [Google Scholar] [CrossRef]
  19. Hao, Y.; Huang, Y.; Gong, M.; Li, W.; Feng, J.; Yi, Q. A polygeneration from a dual-gas partial catalytic oxidation coupling with an oxygen-permeable membrane reactor. Energy Convers. Manag. 2015, 106, 466–478. [Google Scholar] [CrossRef]
  20. Li, S. The Mechanism of Minimal Energy Penalty for CO2 Capture and the Study on Coal-Based Polygeneration System for Cogenerating Substitute Natural Gas and Power; Graduate University of Chinese Academy of Sciences: Beijing, China, 2012. [Google Scholar]
  21. Ge, H.; Guo, W.; Shen, L.; Song, T.; Xiao, J. Biomass gasification using chemical looping in a 25 kWth reactor with natural hematite as oxygen carrier. Chem. Eng. J. 2016, 286, 174–183. [Google Scholar] [CrossRef]
  22. Tagliaferri, C.; Görke, R.; Scott, S.; Dennis, J.; Lettieri, P. Life cycle assessment of optimised chemical looping air separation systems for electricity production. Chem. Eng. Res. Des. 2018, 131, 686–698. [Google Scholar] [CrossRef]
  23. Shah, K.; Moghtaderi, B.; Wall, T. Effect of flue gas impurities on the performance of a chemical looping based air separation process for oxy-fuel combustion. Fuel 2013, 103, 932–942. [Google Scholar] [CrossRef]
  24. Zhou, C.; Shah, K.; Song, H.; Zanganeh, J.; Doroodchi, E.; Moghtaderi, B. Integration Options and Economic Analysis of an Integrated Chemical Looping Air Separation Process for Oxy-fuel Combustion. Energy Fuels 2015, 30, 1741–1755. [Google Scholar] [CrossRef]
  25. Shi, B.; Wu, E.; Wu, W.; Kuo, P.-C. Multi-objective optimization and exergoeconomic assessment of a new chemical-looping air separation system. Energy Convers. Manag. 2018, 157, 575–586. [Google Scholar] [CrossRef]
  26. Zhu, L.; Wang, F.; Zhang, Z. Thermodynamic evaluation of a conceptual process for coal gasification coupled with chemical looping air separation. Chem. Eng. Process.-Process Intensif. 2016, 106, 33–41. [Google Scholar] [CrossRef]
  27. Zhang, D.; Duan, R.; Li, H.; Yang, Q.; Zhou, H. Optimal design, thermodynamic, cost and CO2 emission analyses of coal-to-methanol process integrated with chemical looping air separation and hydrogen technology. Energy 2020, 203, 117876. [Google Scholar] [CrossRef]
  28. Xiang, D.; Zhao, S. Parameter optimization and thermodynamic analysis of COG direct chemical looping hydrogen processes. Energy Convers. Manag. 2018, 172, 1–8. [Google Scholar] [CrossRef]
  29. Qin, S.; Chang, S.; Yao, Q. Modeling, thermodynamic and techno-economic analysis of coal-to-liquids process with different entrained flow coal gasifiers. Appl. Energy 2018, 229, 413–432. [Google Scholar] [CrossRef]
  30. Zhou, H.; Yang, S.; Xiao, H.; Yang, Q.; Qian, Y.; Gao, L. Modeling and techno-economic analysis of shale-to-liquid and coal-to-liquid fuels processes. Energy 2016, 109, 201–210. [Google Scholar] [CrossRef]
  31. Wang, D.; Meng, W.; Zhou, H.; Yang, Y.; Xie, J.; Yang, S.; Li, G. Novel coal-to-methanol process with near-zero carbon emission: Pulverized coal gasification-integrated green hydrogen process. J. Clean. Prod. 2022, 339, 130500. [Google Scholar] [CrossRef]
  32. Kuo, P.-C.; Wu, W. Thermodynamic analysis of a combined heat and power system with CO 2 utilization based on co-gasification of biomass and coal. Chem. Eng. Sci. 2016, 142, 201–214. [Google Scholar] [CrossRef]
  33. Hacker, V.; Fankhauser, R.; Faleschini, G.; Fuchs, H.; Friedrich, K.; Muhr, M.; Kordesch, K. Hydrogen production by steam–iron process. J. Power Sources 2000, 86, 531–535. [Google Scholar] [CrossRef]
  34. Zheng, T.; Li, M.; Mei, D.; Ma, J.; Wang, B.; Xu, Z. Effect of H2S presence on chemical looping reforming (CLR) of biogas with a firebrick supported NiO oxygen carrier. Fuel Process. Technol. 2022, 226, 107088. [Google Scholar] [CrossRef]
  35. de Diego, L.F.; Ortiz, M.; García-Labiano, F.; Adánez, J.; Abad, A.; Gayán, P. Hydrogen production by chemical-looping reforming in a circulating fluidized bed reactor using Ni-based oxygen carriers. J. Power Sources 2009, 192, 27–34. [Google Scholar] [CrossRef] [Green Version]
  36. Morud, J.C.; Skogestad, S. Analysis of instability in an industrial ammonia reactor. AIChE J. 1998, 44, 888–895. [Google Scholar] [CrossRef]
  37. Flórez-Orrego, D.; de Oliveira Junior, S. Modeling and optimization of an industrial ammonia synthesis unit: An exergy approach. Energy 2017, 137, 234–250. [Google Scholar] [CrossRef]
  38. Xiang, D.; Zhou, Y. Concept design and techno-economic performance of hydrogen and ammonia co-generation by coke-oven gas-pressure swing adsorption integrated with chemical looping hydrogen process. Appl. Energy 2018, 229, 1024–1034. [Google Scholar] [CrossRef]
  39. Araújo, A.; Skogestad, S. Control structure design for the ammonia synthesis process. Comput. Chem. Eng. 2008, 32, 2920–2932. [Google Scholar] [CrossRef] [Green Version]
  40. Meessen, J. Urea synthesis. Chem. Ing. Tech. 2014, 86, 2180–2189. [Google Scholar] [CrossRef]
  41. Yang, Q.; Zhang, Z.; Fan, Y.; Chu, G.; Zhang, D.; Yu, J. Advanced exergy analysis and optimization of a CO2 to methanol process based on rigorous modeling and simulation. Fuel 2022, 325, 124944. [Google Scholar] [CrossRef]
  42. Zhang, J.; Yang, Q.; Fan, Y.; Zhang, D.; Yu, J. Conceptual design and techno-economic analysis of a coproduction system for ethylene glycol and LNG from steel mill off-gases. Fuel 2022, 318, 123693. [Google Scholar] [CrossRef]
  43. Xiang, D.; Xiang, J.; Sun, Z.; Cao, Y. The integrated coke-oven gas and pulverized cokegasification for methanol production with highly efficient hydrogen utilization. Energy 2017, 140, 78–91. [Google Scholar] [CrossRef]
  44. Wang, D.; Meng, W.; Zhou, H.; Li, G.; Yang, Y.; Li, H. Green hydrogen coupling with CO2 utilization of coal-to-methanol for high methanol productivity and low CO2 emission. Energy 2021, 231, 120970. [Google Scholar]
  45. Kathe, M.V.; Empfield, A.; Na, J.; Blair, E.; Fan, L.-S. Hydrogen production from natural gas using an iron-based chemical looping technology: Thermodynamic simulations and process system analysis. Appl. Energy 2016, 165, 183–201. [Google Scholar] [CrossRef]
Figure 1. Flow diagram of conventional CTU.
Processes 11 00960 g001
Figure 2. Flow diagram of CTUCLAS&H.
Processes 11 00960 g002
Figure 3. Flow diagram of COG-CTUCLAS&H.
Processes 11 00960 g003
Figure 4. Process flowsheet of the coal gasification unit.
Processes 11 00960 g004
Figure 5. Process flowsheet of the chemical looping air separation unit.
Processes 11 00960 g005
Figure 6. Process flowsheet of the chemical looping hydrogen unit.
Processes 11 00960 g006
Figure 7. Process flowsheet of the ammonia synthesis unit.
Processes 11 00960 g007
Figure 8. Process flowsheet of the urea synthesis unit.
Processes 11 00960 g008
Figure 9. Effect of the O/C ratio on the performance of the coal gasifier.
Processes 11 00960 g009
Figure 10. Effect of the Mn3O4/air ratio on the molar flow (a) Mn3O4 and Mn2O3, (b) O2 conversion and remaining O2 in feed air.
Processes 11 00960 g010
Figure 11. Effect of the S/Mn2O3 on the Mn2O3 conversion at different reduction temperatures.
Processes 11 00960 g011
Figure 12. Effect of the Fe2O3/CG on the molar flow rate of the CTUCLAS&H process.
Processes 11 00960 g012
Figure 13. Effect of the steam on the Fe3O4 and H2 molar flow rate and the Fe conversion rate.
Processes 11 00960 g013
Figure 14. Effect COG/CG on the carbon utilization efficiency and the CO2 emission rate.
Processes 11 00960 g014
Figure 15. Effect of COG/CG on utilities and energy efficiency.
Processes 11 00960 g015
Figure 16. Energy and carbon utilization efficiencies of CTU, CTUCLAS&H, and COG-CTUCLAS&H.
Processes 11 00960 g016
Figure 17. Total capital investments of CTU, CTUCLAS&H and COG-CTUCLAS&H.
Processes 11 00960 g017
Figure 18. Product costs of CTU, CTUCLAS&H, and COG-CTUCLAS&H.
Processes 11 00960 g018
Figure 19. Sensitivity analysis of the effects of variables on the production cost of (a) CTUCLAS&H and (b) COG-CTUCLAS&H.
Processes 11 00960 g019
Figure 20. Effect of coal and urea prices on the IRRs of (a) CTU, (b) CTUCLAS&H, and (c) COG-CTUCLAS&H.
Processes 11 00960 g020
Table 1. Proximate analysis and ultimate analysis of raw coal.
Proximate Analysis (wt.%, ad)Elementary Analysis (wt.%, ad)
MFCVACHONS
Coal6.150.0124.7119.1866.314.438.50.760.82
Table 2. Comparison of the simulation and reference data.
CLHURef.Sim.UnitRef.
FR parameters [45]
 Heat duty0.00.0MW
 CO purity~0.0~0.0Mol.%
 Fe2O3 conversion100100%
SR parameters [13]
 Operating temperature700–750700°C
 Heat duty0.00.0MW
 Steam conversion30–5058.5%
AR parameters [13]
 Operating temperature12001200°C
 Fe3O4 conversion100100%
 N2 purity99.899.799.7
 Operating pressure1.01.0MPa
CLAS [26]
OR parameters
 Operating pressureAmbientAmbient-
 Mn2O3 conversion100100%
XR parameters
 Operating temperature800–900830°C
 Operating pressure11bar
 Mn3O4 conversion100100%
APUInputOutputInputOutput [28]
 H2 purity75.02.274.81.2mol.%
 N2 purity25.00.825.20.3mol.%
 NH4 purity-97.0 98.2mol.%
 Operating temperature723–729731–738K
 Operating pressure20.1–20.320.1–20.3MPa
Disclaimer/Publisher’s Note: The statements, opinions and data contained in all publications are solely those of the individual author(s) and contributor(s) and not of MDPI and/or the editor(s). MDPI and/or the editor(s) disclaim responsibility for any injury to people or property resulting from any ideas, methods, instructions or products referred to in the content.

