Article

Numerical Simulation of Selective Non-Catalytic Reduction Denitrification Process in Precalciner and the Effect of Natural Gas Injection on Denitrification

College of Materials Science and Engineering, Nanjing Tech University, Nanjing 211816, China
*
Author to whom correspondence should be addressed.
Processes 2023, 11(5), 1377; https://doi.org/10.3390/pr11051377
Submission received: 18 March 2023 / Revised: 27 April 2023 / Accepted: 28 April 2023 / Published: 2 May 2023

Abstract

:
Cement production is the third largest source of nitrogen oxides (NOx), an air pollutant that poses a serious threat to the natural environment and human health. Reducing NOx emissions from cement production has become an urgent issue. This paper aims to explore and investigate more efficient denitrification processes to be applied in NOx reduction from precalciner. In this study, firstly, the flow field, temperature field, and component fraction in the precalciner are studied and analyzed using numerical simulation methods. Based on this, the influence of the reductant injection height and amount on the SNCR was studied by simulating the selective non-catalytic reduction (SNCR) process in the precalciner. The effect of natural gas on the NOx emissions from the precalciner was also investigated. The simulation results showed that, with the increase in height, the NOx concentration in the precalciner decreased, then increased, then decreased, and then increased again. The final NOx concentration at the exit position was 531.33 ppm. In the SNCR denitrification process, the reductant should be injected in the area where the precalciner height is 26–30 m so that the reductant can fully react with NOx and avoid the increase of ammonia escape. The NSR represents the ratio of reductant to NOx, and the results show that the larger the NSR is, the higher the denitrification rate is. However, as the NSR approaches 2, the denitrification rate slows down and the ammonia escape starts to increase. Therefore, according to the simulation results, the NSR should be kept between 1 and 1.6. The denitrification rate reached the maximum value of 42.62% at the optimal condition of 26 m of reductant injection height and 1.6 of NSR. Co-firing of natural gas with pulverized coal can effectively reduce the NOx generation in the furnace. The denitrification rate reached the maximum value of 32.15% when the natural gas injection amount was 10%. The simulation results of natural gas co-combustion and SNCR combined denitrification showed that combined denitrification was better than natural gas co-combustion or SNCR denitrification. Under the condition of NSR of 1 and natural gas injection of 10%, the denitrification rate increased by 29.83% and 31.64% compared to SNCR-only or co-combustion-only denitrification, reaching 61.98%, respectively. Moreover, less reductant is used in co-denitrification, so the problem of excessive ammonia emissions can be avoided. The results of this study provide useful guidance for denitrification process development and NOx reduction in cement production.

1. Introduction

Cement, as a basic construction material, plays an important role in the construction of urban infrastructure and the national economic development. However, the resource consumption and pollutant emissions are also massive in the cement industry. At present, NOx emissions account for approximately 10% of the total industrial emissions in China, and the NOx emission in cement industry has become the third largest source of NOx emissions, after thermal power generation and automobile exhaust [1]. As the environmental protection problem has become more and more serious, the technology about NOx reduction in the cement production process is also getting more and more attention. The selective catalytic reduction [2,3] (SCR) technology is widely applied in the denitrification of power plant boilers and automobile exhaust gases. However, considering the costs and benefits, the denitrification of cement plants requires huge modifications to the existing operating systems and equipment, which restricts the application of this technology. Moreover, in recent years, in response to the increasingly stringent NOx emissions in cement plants, the methods most commonly applied have been graded combustion technology [4,5] and selective non-catalytic reduction [6,7,8] (SNCR). SNCR is a flue gas denitrification technology that selectively reduces NOx by spraying an amino reductant (ammonia or urea is commonly used) from the wall of the precalciner into the flue chamber indent of the cement kiln and the high-temperature reduction zone. At the reductant injection site of the precalciner, the factors including the flow field, temperature distribution, gaseous phase residence time, and distribution of each component are complex, and these factors are closely related to the location of reductant injection [9]. This affects both the final result of denitrification and the amount of ammonia escape. Besides, the amount of reductant injection, or the ammonia-to-nitrogen ratio, is also an influential factor of the denitrification efficiency: a high ammonia-to-nitrogen ratio can improve the denitrification efficiency, but a too high ammonia-to-nitrogen ratio can also cause an increase in ammonia escape [10]. In addition, Kang [11] studied the gas-solid characteristics of the cyclone separator, and the results show that the temperature window of the SNCR method lay between 1123 K and 1323 K, and the reduction efficiency peaked at 1223 K when NSR was 1.5. Fan [6], Li [12], and Bae [13] explored the effect of gas components in the precalciner on NOx reduction. Fu [14] investigated the effect of CaCO3 on the SNCR denitrification process and explained the mechanism of the influence. Fu [15] developed a kinetic model to explore the catalytic effect of CaO on the decomposition of the amino reductant, the conversion process, and the reduction of NOx, which well predicted the involvement of CaO in the SNCR denitrification process.
Although the SNCR process has been widely used, it has become more and more difficult to meet the more stringent emission standards as the environmental pressure increases. Therefore, it is necessary to carry out an in-depth optimization design of SNCR denitrification to improve its emission reduction effect. In this regard, Yao [16] established a multiple linear regression model of NBC to optimize the denitrification effect of SNCR by adjusting the process parameters. In addition to further optimization of the SNCR denitrification process, research and exploration of other denitrification processes have been in progress. Moreover, co-combustion denitrification is an effective method. This technology mainly increases the concentration of reducing groups by injecting fuels containing hydrocarbons into the combustion zone of the kiln, thus increasing the reduction rate of NOx and achieving emission reduction. These fuels are generally natural gas, coal, biomass fuels [17,18,19], and even waste such as garbage [20]. Barraza [21] studied the combustion characteristics and pollutant emissions of natural gas mixed with bio-oil in a cyclone burner. Kowalewski [22] investigated the characteristics and pollutant emissions of natural gas mixed with bio-oil combustion in a cyclone burner. Javadi [23] and Orooji [24] conducted a lot of research on how to use natural gas to reduce NOx, and the research results show that natural gas reburning denitrification has a good effect on NOx reduction. However, in the cement production process, natural gas co-combustion denitrification technology is mainly applied in the rotary kiln, but less in precalciner. Therefore, the effect of natural gas co-combustion denitrification technology in precalciner needs further study. Meanwhile, single denitrification technologies have become increasingly challenging to meet the demand for NOx reduction in plants, so many researchers have started to study the effects of combining multiple denitrification technologies [25]. However, because of the situation’s complexity, when multiple denitrification processes are used in combination, the denitrification rate tends to fluctuate, so more analysis of the combined denitrification technology is needed.
In order to explore and study a more efficient denitrification process, a TTF-type precalciner was simulated in this paper using numerical simulation techniques. Firstly, the denitrification process of SNCR in the precalciner was simulated and studied, and the parameters affecting the SNCR denitrification process were optimized. Then, the effect of natural gas co-combustion denitrification technology on the generation and reduction of NOx in the precalciner was studied. The feasibility of using this technology in the precalciner was verified. Finally, the denitrification effect of combining SNCR with natural gas co-combustion denitrification was simulated to investigate the process characteristics and denitrification effect of combined denitrification. Overall, the above research can provide theoretical guidance for optimizing the SNCR denitrification process and applying natural gas co-combustion denitrification technology in precalciner, and finally provide a boost for developing a cleaner and more efficient denitrification technology.

2. Geometrical Model and Boundary Condition

2.1. Geometrical Model and Mesh

Figure 1 shows the structural model and mesh of the precalciner. The height of the precalciner is 46 m. The overall structure of can be divided into four parts along the Z-axis of the coordinate system, which are the lower cone, the lower column, the middle column and the upper column. In Figure 1a, the bottom of the lower cone is the flue gas inlet, and the precalciner outlet is at the top of the upper column. There are three tertiary air ducts entering the precalciner: two of them are located in the lower column symmetrically on both sides and the remaining one in the middle column. The tertiary air is divided into upper and lower parts and injected into the precalciner, thus forming an air grading structure. There are four conveying ducts for raw material, which are symmetrically distributed two by two on both sides of the lower and central part of the precalciner. There are four coal injection ducts in the precalciner, all of which are distributed at approximately 0.7 m above the lower tertiary air duct.
As shown in Figure 1a, there are four types of inlets for the precalciner: the inlets of tertiary air and flue gas belong to the velocity inlet type, and the inlets of pulverized coal and raw material are the mass flow inlet type. The flue gas from the rotary kiln enters the precalciner vertically from the bottom. The lower tertiary air enters the precalciner through an inlet perpendicular to the furnace wall, and the upper tertiary air enters the precalciner through an inlet perpendicular to the direction of the raw material inlet. O2 and N2 account for 23.3% and 76.7% of all the content of the tertiary air, respectively (by mass). The four pulverized coal inlets are symmetrically distributed two by two above the lower-column tertiary air inlet. The mass flow rate of the raw material entering from the lower raw material tube is 66.62% of the total, while the remaining 33.38% is fed from the feed tube of the central column. Finally, all gas and solid fractions leave through the outlet at the top of the precalciner. Figure 1b shows the grid for the numerical calculations. A fine unstructured tetrahedral grid was used for all inlets and the grid was encrypted, while a structured hexahedral grid was used for the remaining areas.

2.2. Boundary Condition

The boundary condition data used in this study were obtained during the on-site inspection of the cement plant testing program, where testing instruments such as Pitot tubes, thermocouples, and Orsat apparatus were used, and samples of pulverized coal and raw material were also obtained during the testing process. The inspection process is under the standard requirements, and the data are reliable. The boundary conditions used in the simulations are as follows.
(1)
The velocity of the tertiary air entering at the upper level is 25 m/s, and the temperature is 1193 K, the velocity of the tertiary air entering at the lower level is 26 m/s, and the temperature is 1193 K. The velocity of the lower flue gas is 27 m/s, and the temperature is 1300 K.
(2)
The mass flow rate of coal powder conveying pipeline is 1.25 kg/s at a temperature of 331 K. The mass flow rate of the lower raw material inlet is 18.16 kg/s and the mass flow rate of the upper raw material inlet is 9.1 kg/s. The main composition of the raw material is CaCO3 (SiO2 is negligible). The maximum particle size of pulverized coal is 80 μm; the minimum particle size is 20 μm, and the average particle size is 60 μm. The maximum particle size of raw material is 50 μm; the minimum particle size is 30 μm, and the average particle size is 40 μm. The particle sizes of both particles are in accordance with the Rosin–Rammler distribution.
(3)
The boundary condition of the outlet is the pressure outlet, and the pressure at the outlet is −500 Pa. The elemental analysis, industrial analysis, and calorific value of the coal are listed in Table 1. The raw material composition is listed in Table 2.
(4)
The particle phase at the outlet of the precalciner is set to escape, the particle phase at all inlets is set to reflect, and the wall sections are set to be slip-free walls.

3. Mathematical Model and Calculation Method

3.1. Turbulence Model

The flow of fluid in the precalciner is often in a turbulent state, so the calculation of turbulence is very important in the whole numerical simulation. After considering the structural characteristics of the precalciner, the complexity of the calculation, and the accuracy of the calculation, the standard k-ε two-equation model was used to solve the turbulent flow in this study [26]. The transport equations of the standard k-ε model are as follows:
ρ k t + ρ k u i x i = x j μ + μ t σ k k x j + D k + D b ρ ε Y M + S k
ρ ε t + ρ ε u i x i = x i μ + μ t σ ε ε x j + C 1 ε ε k G k + C 3 ε G b C 2 ε ρ ε 2 k + S ε
where μ t represents the turbulent viscosity, D k and G b represent the turbulent kinetic energy due to the mean velocity gradient and buoyancy, respectively, and Y M is the contribution of compressible turbulence to the dissipation rate. C 1 ε , C 2 ε , and C 3 ε are correction factors of 1.45, 1.93, and 0.09, respectively. S k and S ε are custom source terms.

3.2. Discrete Phase Model

The reaction in the precalciner is a gas-solid phase interaction process. In this study, the gas phase is treated as a continuous phase body and the solid phase as a discrete phase. The coupling between the gas flow and the particles in the numerical simulation is two-way. The motion of the discrete particles is influenced by the gas flow, and the gas flow motion is also influenced by the particles. Therefore, this study chose the discrete phase model (DPM model) to calculate the motion between the gas and the solid in the precalciner [27]. The motion of particles in turbulent flow is predicted by the mean flow velocity in the force balance equation for the particles. The force equilibrium equation for the particles is as follows:
d u p d t = F D u u p + g x ρ p ρ ρ p + F x
F D = 18 μ ρ p d p 2 C D R e 24
R e = ρ d p u p u μ
where: F D u u p denotes the drag force on the particle, g x ρ p ρ ρ p is the gravitational force, and F x represents the additional force. u is the velocity of the fluid, u p is the particle velocity, ρ is the density of the fluid, ρ p is the particle density, and R e is the relative Reynolds number.

3.3. Chemical Reaction Model

3.3.1. Combustion Mechanism of Pulverized Coal

The combustion of pulverized coal is a complex physical and chemical process. A spherical model is used for the pulverized coal particles in the simulation. After the pulverized coal was injected into the precalciner, firstly, the moisture was precipitated by heat, and then the volatile fraction was precipitated when the temperature continued to rise, while the volatile fraction precipitated mixed with the oxygen in the air, and then the combustion reaction occurred rapidly. When the volatile fraction in the outer layer of the pulverized coal particle burned to produce carbon dioxide and nitrogen, the oxygen in the outer layer also continued to diffuse to the inner layer of the pulverized coal particle, and when the volatile fraction in the outer layer burned to a certain degree, the coke in the coal core also began to burn, producing carbon dioxide until it burned out. The above process consists of two main stages [28,29]. The first stage is the combustion of the volatile fraction in the pulverized coal particles after it is released by heat and mixed with oxygen, and the second stage volatile fraction is released and burned to a certain extent before the coke starts to burn. The volatile matter release process in the first stage is based on the two-step competitive rate model proposed by Kobayashi [30], which is less computationally intensive and highly accurate. The combustion reaction of volatiles in the numerical model is shown in Equation (6).
Vol + 1.99 O 2 0.31 CO 2 + 4.26 H 2 O + 0.561 N 2 + 0.0291 SO 2
The rate of volatiles precipitation is given by the following Equation:
m v t m p , 0 m a = 0 t a 1 R 1 + a 2 R 2 exp 0 t R 1 + R 2 d t d t
where: m v t denotes the mass of volatiles released from the pulverized coal during the reaction time, m p , 0 denotes the initial mass of the pulverized coal particles, m a denotes the content of inorganic residues in coal powder particles. R 1 and R 2 are the reaction rate constants, a 1 and a 2 are the release rate factors of volatiles at low and high temperatures, respectively, and their values are given by the Arrhenius formula.
In the second stage, the remaining coke undergoes a surface combustion reaction The coal particle combustion reaction can be expressed by Equation (8).
C + 1 f m O 2 2 2 f m CO + 2 f m 1 CO 2
The mechanism factor f m depends on the char particle size and temperature and ranges between 1 and 2. This factor determines the shift from CO2 to CO production with an increasing temperature and decreasing particle diameter.
The kinetic/diffusion rate model is used for the reaction process in this stage. The kinetic rate K and the diffusion rate D 0 in this model control the reaction rate of coke combustion with the following equation:
d m p d t = A P P O X D 0 K D 0 + K
D 0 = C 1 T P + T 2 0.75 d p
K = C 2 e E 2 R T p
where A P is the surface area of the coke particles, P O X is the pressure of the gas on the surface of the coke particles, T P and T are the initial temperature of the coke particles and the temperature of the gas near the coke particles, respectively, and d p is the particle diameter.

3.3.2. Raw Material Decomposition Model

The numerical simulation study on the decomposition reaction of raw material in precalciner mainly takes CaCO3 as the object of the decomposition reaction. In this study, the component transport model is used to simulate the decomposition reaction of CaCO3, and the equation of the decomposition reaction of CaCO3 is Equation (12), which shows that heat is absorbed during the decomposition of CaCO3. In this study, the decomposition reaction of calcium carbonate was solved by a non-homogeneous chemical reaction based on a volumetric reaction [31]. The kinetic parameters controlling the proceeding reaction were calculated from the reaction kinetic Equations (13)–(15), with activation energy Ea and finger front factor k 0 of 171 kJ/mol and 1 × 10⁷ s−1, respectively. These values are the control parameters in the simulation process and are used to monitor the reaction process while controlling the decomposition reaction of CaCO3.
CaCO 3 s Δ H = + 171 KJ mol CaO s + CO 2 g
G α T = k 0   exp E a R T
G α = 3 1 1 α 1 3
l n G α T = 1 T E a R + l n k 0
The equation for calculating the decomposition rate of the precalciner CaCO3 decomposition reaction is shown below:
η = C 1 C 2 C 1 × 100 %
In this equation, C 1 and C 2 represent the mass flow rate of CaCO3 entering and leaving the precalciner, respectively.

3.4. Radiation Model

In the precalciner, since radiation heat transfer accounts for more than 95% of all heat transfer, we chose the P1 radiation model as the model for radiation heat transfer. The expression for the radiation flux q r in the P1 radiation model is as follows:
q r = 1 3 a + σ s C σ s G
Introduce the parameter ξ :
ξ = 1 3 a + σ s C σ s
The transport equation for G is:
ξ G a G + 4 a n 2 σ T 4 = S G
Combining Equations (17)–(19) yields the following equation:
· q r = a G 4 a n 2 σ T 4
where: a is the absorption coefficient, σ s is the scattering coefficient, G is the incident radiation, C is the linear anisotropic phase function coefficient, n is the refractive index of the medium, σ is the Stefan-Boltzmann constant, and S G is the user-defined radiation source.

3.5. NOx Model and De-NOx Mode

3.5.1. NOx Model

Under the combustion condition in the precalciner, the proportion of thermal NOx and prompt NOx is less than 5%, which can be neglected, so only fuel NOx was considered in this study. NOx generated by pulverized coal combustion usually refers to NO and NO2, with more than 90% being NO. Specifically, only a small amount of NO2 is generated from low-temperature combustion below 900 °C, which means at a normal combustion temperature in the precalciner, almost all of the NOx generated is NO, so the mechanism of NOx generation is mainly for NO [32]. After considering the calculation volume and the actual engineering requirements, the NOx generation mechanism model proposed by De’Soete was adopted in this study. This model assumes that the nitrogen in the fuel is distributed among the volatile fraction and fixed carbon, and in the process of nitrogen conversion, all the nitrogen in the volatile fraction is converted to HCN, some of which is oxidized to NO, and the remainder is used as a reducing agent to generate N2 by reduction reaction with NO, while all the nitrogen in the coke is directly converted to NO. In addition, because of the reducing property of coke, part of the NO generated in the conversion process will be reduced to N2 by the coke. According to the NOx generation mechanism model proposed by De’Soete, the generation and reduction of NO in the precalciner can be expressed by the following equation.
S NO = S charN NO + S HCN NO + S NO char N 2 + S NO HCN N 2
S HCN = S volatile HCN + S HCN NO + S HCN N 2

3.5.2. De-NOx Mode

Selective catalytic reduction (SNCR) denitrification is a flue gas post-treatment denitrification technology, whose main method is to spray an amino reductant, in most cases ammonia or urea, into the flue chamber indent of the cement kiln or into the high-temperature region of the precalciner (between 800 and 1100 °C). In this study, urea was used as the reducing agent, and the reaction between the reductant and NO was carried out using a seven-step reaction mechanism proposed and simplified by Brouwer [33]. Brouwer assumes that the decomposition of urea is instantaneous and 1 mol of urea produces 1.1 mol of NH3 and 0.9 mol of HNCO. The underlying reaction equation is:
NH 3 + NO     N 2 +   H 2 O   +   H
NH 3 + O 2 NO + H 2 O   + H  
HCNO   +   M     H   +   NCO   + M
NCO   +   NO     N 2 O   +   CO
NCO   +   OH     NO   +   CO   +   H
N 2 O   +   OH     N 2 +   O 2 +   H
N 2 O   +   M     N 2 +   O   +   M
The key factors affecting the SNCR operation process are mainly the initial concentration of NOx in the precalciner, the temperature window of the reductant injection, the ammonia-to-nitrogen ratio (NSR), the residence time, the mixing degree of the reductant and the flue gas, the oxygen content in the flue gas, the ammonia escape rate, etc. In particular, ammonia escape is a problem where unreacted NH3 reacts with sulfur trioxide (SO3) present in the flue gas at high reductant injection and generates ammonium salts, which can lead to corrosion and scaling of the downstream equipment. In addition, the ammonium salts and residual amino reductants can lead to new pollution when they are released into the atmosphere [34]. NSR (ammonia-to-nitrogen ratio) is used to quantify the ratio of the reductant NH3 to the pollutant NO, which can be expressed as:
NSR = mole   fraction   of   NH 3   mole   fraction   of   NO
Co-combustion denitrification technology is used to reduce NOx emissions by increasing the concentration of free radicals (CO and CHx) capable of carrying out reduction reaction with NOx by injecting hydrocarbon fuels(such as natural gas, biofuels and waste materials)into a burner such as a boiler [18,19]. This technology in industrial kilns has been studied and experimented with in detail [24]. Various kinetic models have been proposed since 1990 to reveal the mechanism of NOx reduction in a multi-step combustion regime, and the reduction path proposed by Bowman [35] is able to calculate the NOx dissipation in the fuel-rich co-combustion region based on CH radicals. This model is compatible with the viscous dissipative combustion model, where the concentration of CH radicals can be obtained through partial equilibrium reactions, and therefore no additional determination is required.
The reduction reaction of NO and hydrocarbon radicals is expressed by the following equation:
NO + CH i HCN + products
HCN will form or reduce NO through reaction depending on the local conditions of the mixture, with HCO as an intermediate component. The reaction mechanism consists of three steps:
HCN + O 2 HCO + NO
HCN + NO HCO + N 2
HCO + 2 3 O 2 CO 2 + 1 2 H 2 O
The above three equations demonstrate that HCN plays an important role in NO reduction, while according to Taniguchi [36], Equation (31) has an essential impact on NO reduction in the fuel-rich region. The oxidation of HCN is inhibited, and it acts as a reductant to react with NOx in the flue gas, reducing NOx to N2. When the injected hydrocarbon fuel is natural gas, the combustion of natural gas in the fuel-rich zone consumes a large amount of oxygen and creates an oxygen-poor zone. Coal combustion is suppressed in this area, limiting the oxidation of nitrogen in coal volatiles, which can effectively control the generation of NOx [5]. Meanwhile, CO produced by incomplete combustion of fuel is also an effective NOx reducer. Moreover, it has been proved that the main product of natural gas combustion, H2O, has a certain reduction effect on NOx. This is because H2O produces H2 at high temperatures, and H2 has a reducing effect on NOx, and the reduction process is NO → HNO → NH → N2O → N2 [37]. Thus, the NOx concentration is reduced. Since methane accounts for the majority of the composition of natural gas, it was selected to represent natural gas for simulation studies in this research.

3.6. Computational Conditions

This study focuses on the exploration of the NOx reduction technology in the TTF-type precalciner. It consists of two main parts. In the first part, the factors affecting the effectiveness of the SNCR process were studied and analyzed. Among the various influencing factors, the temperature window of the reductant injection point, the NOx concentration at the injection point, the residence time, and the oxygen content in the flue gas are all closely related to the height of the injection point. Moreover, the mixing degree of reductant and flue gas, ammonia escape rate, etc. are influenced by the ammonia-to-nitrogen ratio (NSR). Therefore, in the first part, the effects of two key factors (injection height and injection flow rate) on the NOx removal efficiency were investigated separately. Firstly, three different ammonia injection heights (26 m, 31 m, 36 m) were selected as the variables based on the study of temperature and component fields in the precalciner. Then, six different ammonia-to-nitrogen ratios (NSR) of 1, 1.2, 1.4, 1.6, 1.8 and 2 (with a variation gradient of 0.2) were selected for the simulation analysis. In this study, urea was used as the reductant, with a mass fraction of 50%. The required ammonia injection volumes for different ammonia-to-nitrogen ratios calculated from the flue gas volume and NOx concentration values were 0.049 kg/s, 0.059 kg/s, 0.069 kg/s, 0.078 kg/s, 0.088 kg/s, and 0.098 kg/s. Only a single study variable (ammonia injection height, ammonia-to-nitrogen ratio) was changed in the above simulations, and other operating conditions were kept constant, including the injection velocity of 30 m/s, the injection angle of 30°, the average droplet size of 80 μm, and the installation of the nozzle against the wall.
In the second part, the effect of four different natural gas injection scenarios on NOx reduction in the precalciner was investigated. The four natural gas injection ducts are installed near each of the four coal injection ducts, which reduces the impact of structural changes on the combustion process in the precalciner. The ratio of the amount of natural gas substance to the amount of pulverized coal substance is 2.5%, 5%, 7.5%, and 10%, respectively, which are expressed in the paper as CH4-2.5%, CH4-5%, CH4-7.5%, and CH4-10%. Based on the simulation results, the effects of natural gas injection on pulverized coal combustion, raw material decomposition rate, and NOx emission were studied and analyzed. In addition, SNCR denitrification was performed after natural gas was injected into the precalciner (NSR was 1, and other conditions remained unchanged), and the effectiveness of this combined denitrification was investigated.

3.7. Mesh Independence Verification

The mesh in the simulation calculation is a computational cell generated by discretization of the finite volume method. In this study, the ICEM software is used to mesh the computational model, and this process requires calculating the topology of the model to mesh. It is important to check the independence of the mesh when creating the mesh to ensure the accuracy of the numerical simulation, because the topology of the model and the number of grids affect the computational accuracy of the numerical calculation. Table 3 shows the temperature at the outlet using 5 different mesh numbers (663,748, 875,822, 101,804, 1,209,264 and 14,659,040) and compares the effect of mesh number on the calculation results based on the average temperature at the outlet of the precalciner. As shown in Table 3, when the number of meshes is greater than 1,018,704, the temperature variation is less than 10 K, and the variation is very small, which indicates that the quantity of mesh at this time has little effect on the results of this investigation. Meanwhile, it can be observed that 1,018,704 meshes can effectively simulate the heat distribution in the precalciner and meet the requirements for accuracy. Following the principle of simplest calculation, the choice of 1,018,704 meshes was adopted for the simulation study in this research.

4. Results and Discussion

4.1. Results Verificatio

Table 4 shows the comparison between the simulated and measured values at the precalciner outlet, the simulated value has an excess air factor of 1.1. As can be seen from Table 4, the errors of both simulated and actual values are less than 5%, which indicates that the temperature field, component field, and NOx in the precalciner during the simulation are more consistent with the actual situation. The errors are mainly due to the assumption that the whole process is in an ideal state during the simulation. Various reactions consume the heat from pulverized coal and flue gas combustion, and the remaining is carried away by air. In reality, problems, such as heat loss and air leakage, in the precalciner barrel exist. In general, all errors are within the allowable range of engineering standards, indicating the model’s reliability.

4.2. Flow Field and Temperature Field Analysis

4.2.1. Distribution of the Velocity Field

Figure 2a,b show the velocity vector plots for the cross sections in the precalciner when X = 0 and Y = 0, respectively. From Figure 2a, we can observe that the velocity field in the precalciner is symmetrically distributed about the Z-axis, and the difference between the velocity fields on both sides of the Z-axis is small. This makes the flow field in the precalciner more stable, thus reducing the intensity of the disturbing flow, which is beneficial to the combustion of pulverized coal and the decomposition of raw material. From the bottom inlet to the upper outlet, it can be seen that after the flue gas from the rotary kiln enters the precalciner, the velocity of the flue gas gradually decreases because the diameter of the furnace chamber becomes larger, and after intersecting with the tertiary air, a high speed airflow is formed vertically upward, thus forming the first spouting effect area. In the vicinity of the high-speed airflow are two low-speed vortex ring areas. The two indentations in the precalciner can be regarded as two Laval nozzles, where the velocity increases sharply when the flue gas flow passes by, resulting in the formation of a second and third area of the spouting effect. In the middle part of the precalciner, three vortex circulation zones are formed after the upper raw material and the upper tertiary air inputs intersect with the rising flue gas. Here, the spouting effect zone allows a sufficient diffusion of the coal and raw material. The low-speed vortex circulation zone increases the residence time of airflow and particles in the furnace, leading to a more uniform mixing of pulverized coal and raw material, which facilitates the heat exchange and improves the burning rate of pulverized coal and the decomposition rate of raw material.

4.2.2. Analysis of the Temperature Field in the Precalciner

Figure 3 shows the temperature distribution in the precalciner for two cross sections at X = 0 and Y = 0. It can be observed that there are three high-temperature regions in the precalciner. The first high-temperature zone is near the inlet of the precalciner, with a temperature of around 1300 K. Here, it is mainly generated by the diffusion of high temperature gases from the rotary kiln in the precalciner. The second high-temperature zone is near the coal injection duct in the lower column of the precalciner, where the volatiles, which are rapidly released from the pulverized coal, combine with sufficient oxygen provided by the lateral tertiary air and violently burn in the reflux zone of the lower column, forming the main combustion zone in the area near the furnace wall, with a temperature of approximately 1500 K. Further, the raw material moves upward under the action of high-speed flue gas and quickly absorbs much heat for the decomposition reaction, which makes the temperature in the central region of the lower column gradually decrease. The third high-temperature zone is located at the middle column of the precalciner. Due to the graded combustion design of the precalciner, some tertiary air is introduced in the middle column, which makes the unburned pulverized coal particles and combustible materials such as CO continue to burn here, thus forming a burnout area and raising the temperature in this zone to approximately 1350 K. Then, CaCO3 continues to absorb heat and decompose as the flue gas continues to rise, and the unburned combustible material continues to burn. However, in general, the temperature in this zone gradually decreases and tends to be stable. The temperature at the outlet is 1269.18 K, which is close to the actual result of 1217 K obtained by measurement.
The temperature distribution in the precalciner at different natural gas injection amounts are shown in Figure 4. It can be seen that with the increase of natural gas injection, two of the three high-temperature zones (in the lower and middle columns respectively) of the precalciner both expand, and the maximum temperatures in them are also increased. The expansion of the lower high-temperature zone and the increase of the temperature occur because the natural gas is injected into the precalciner in the gaseous state, so it can burn more rapidly and release heat compared with the two-part reaction of pulverized coal combustion, thus increasing the temperature of the zone. At the same time, the rapid reaction between oxygen and natural gas consumes a large amount of oxygen, which lowers the combustion rate of pulverized coal and lengthens the combustion time, thus expanding the high-temperature areas. In addition, the increase of unburned pulverized coal particles makes the burn out reaction between combustible materials and the upper tertiary air more intense and long-lasting, thus increasing the average temperature in the high-temperature area of the central column and expanding the high-temperature area. The changes in the second and third high-temperature zones also result in higher average temperatures in the precalciner, and the temperature of the upper column zone increases accordingly, with the temperatures near the outlet increasing to 1276.68 K, 1280.28 K, 1283.06 K, and 1285.3 K, respectively. Changes in the average temperature in the precalciner can have an impact on pulverized coal combustion, raw material decomposition, and NOx generation, which will be discussed in detail in the following analysis.

4.2.3. Distribution of Components in the Precalciner

Figure 5 shows the distribution of each component in the precalciner. As shown in Figure 5a,b, the mass fraction of CaCO3 in the lower and middle columns decreases with the increase of height, while the mass fraction of CaO increases significantly, indicating that CaCO3 is converted into CaO through the decomposition reaction after entering the precalciner and absorbing the heat from the combustion of pulverized coal with the rise of the flue gas flow. From Figure 5c,d, it can be found that O2 is violently consumed immediately after being injected from the tertiary air duct, while the CO2 brought in by the flue gas is diluted by the tertiary air and then gradually increased due to the violent combustion of pulverized coal. The CO2 concentration in the middle of the precalciner is reduced because of the dilution of the tertiary air, but the O2 brought in by the tertiary air continues to react with the unburned combustible material to produce a large amount of CO2, so the concentration of O2 in the upper part of the precalciner continues to decrease and the concentration of CO2 continues to increase. In general, the oxygen injected into the precalciner is basically consumed and converted into CO2, and CaCO3 is also basically decomposed, with only a small amount of CaCO3 leaves from the outlet. According to Equation (16), the decomposition rate of CaCO3 in the precalciner is 92.72%. In addition, Figure 5 shows that the reaction rates of pulverized coal combustion and CaCO3 decomposition in the section from the burnout area to the outlet are very slow, so the airflow in this section is smooth and the variation of the concentration of each component is small. In addition, the temperature range in this section is within the SNCR temperature window and the variation is small, as shown in the previous analysis. Therefore, this section is the most suitable area for the SNCR denitrification reaction. Moreover, after being injected, the reductant solution can be better mixed with the flue gas containing NOx, thus leading to a more complete reaction.
Figure 6a,b represent the distribution of CaCO3 and CaO in the precalciner for natural gas injections of 0%, 2.5%, 5%, 7.5%, and 10%, respectively. In general, the decomposition rate of CaCO3 increases because the natural gas injection increases the average temperature and range of the high temperature region in the precalciner. Table 5 shows the decomposition rates of CaCO3 in the precalciner with different injection amounts of natural gas. As can be seen from Table 5, the decomposition rate of CaCO3 increases with the increase of natural gas injection, but all basically meet the standard of decomposition rate in actual production (85%–95%). Therefore, the decomposition rates of raw materials in this study are basically in line with the actual production requirements, and the data are valuable for research and analysis.

4.3. Influencing Factors of NOx Reduction

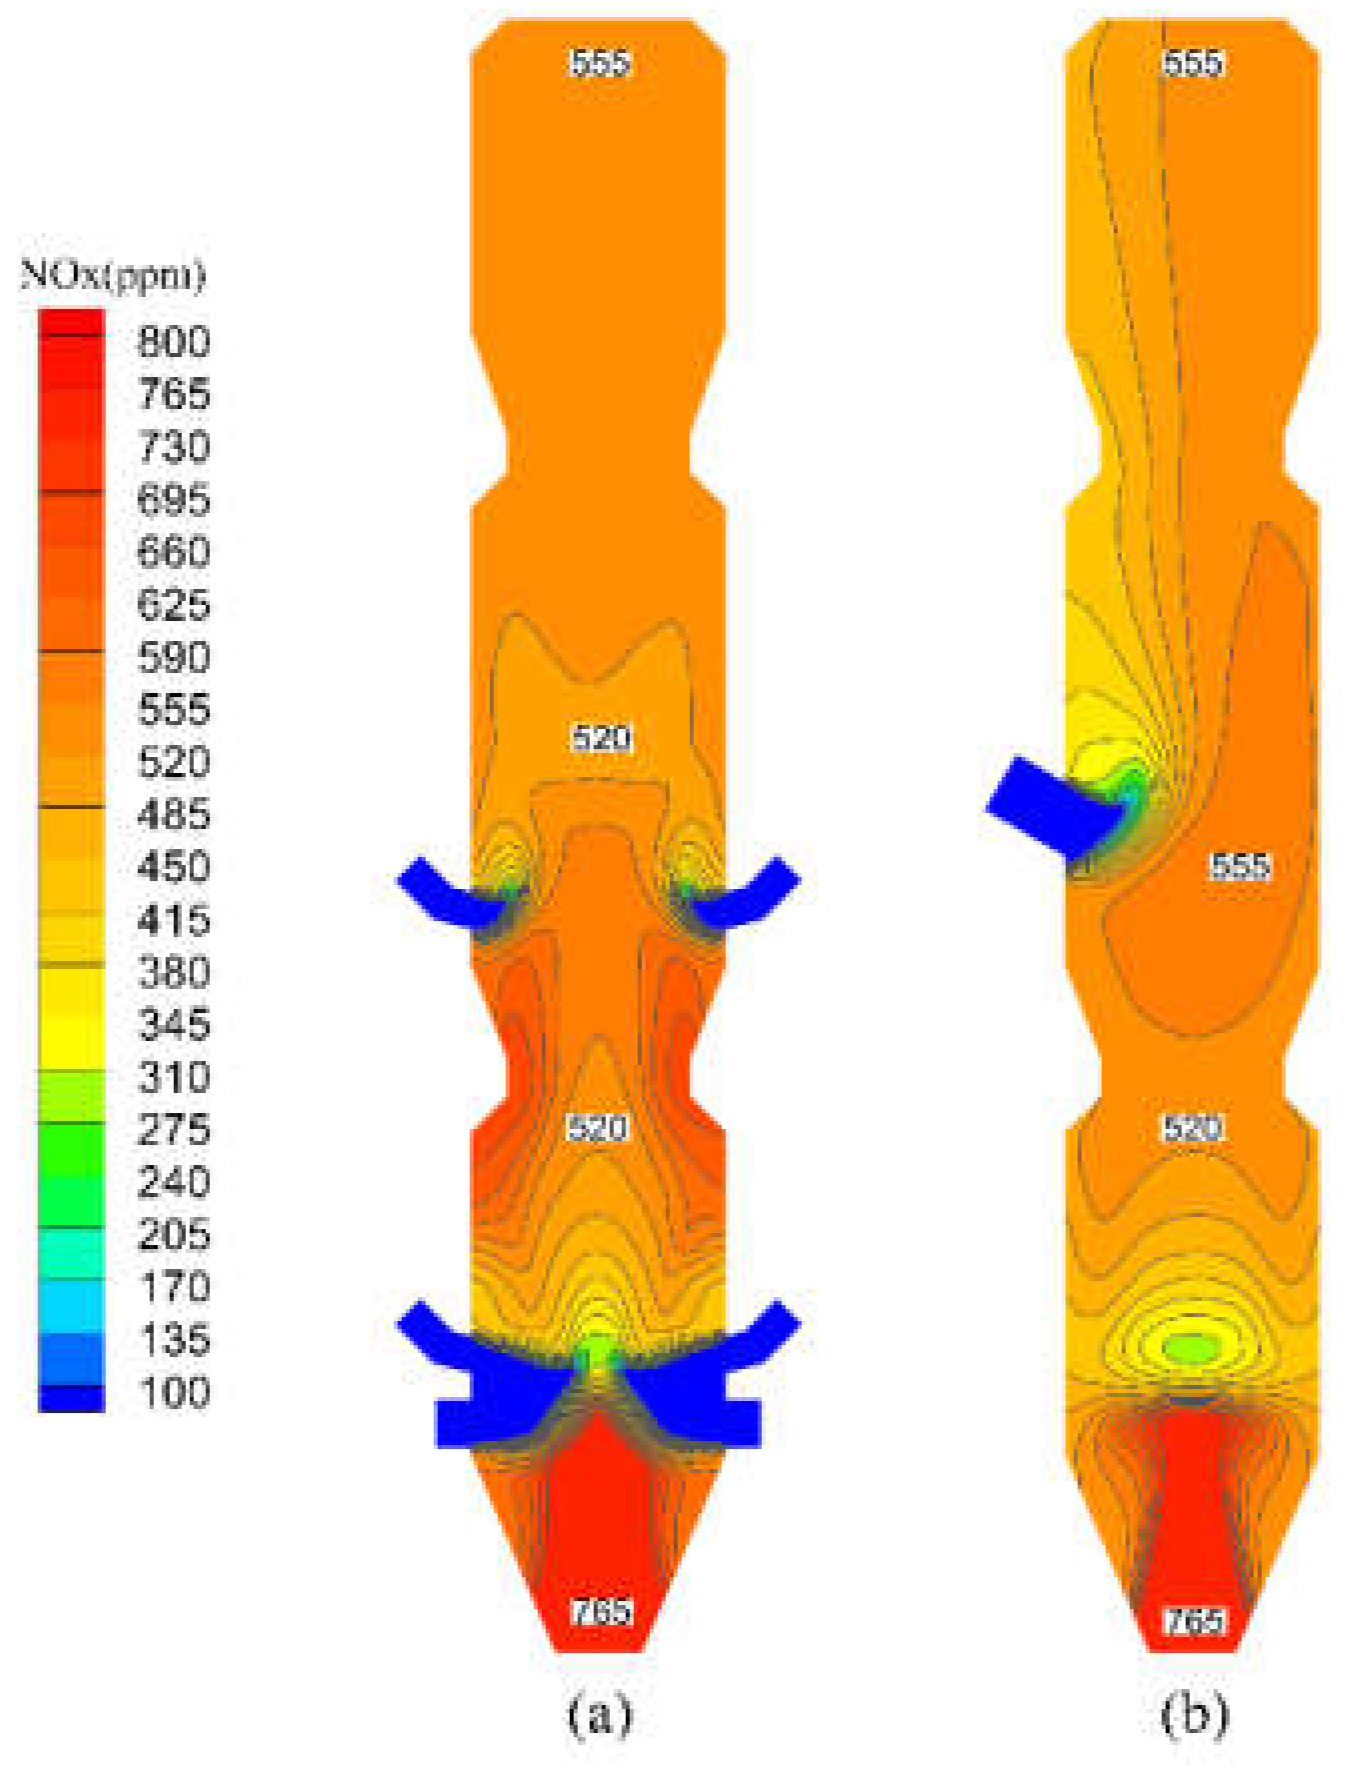
4.3.1. Analysis and Optimization of SNCR Process

The distribution of NOx in the precalciner is shown in Figure 7. The NOx in the precalciner mainly comes from fuel NOx from pulverized coal combustion and thermal NOx from the rotary kiln. The NOx concentration in the bottom area of the precalciner is approximately 750 ppm, where the NOx is mainly thermal NOx from the rotary kiln. As the flue gas rises, the inner diameter of the precalciner gradually expands, and due to the dilution of the tertiary air, the concentration of NOx decreases rapidly, reaching a minimum of approximately 280 ppm near the tertiary air. Then, the concentration of NOx in the main combustion area begins to rise rapidly because with the oxygen brought in by the tertiary air, the pulverized coal burns violently, thus producing a large amount of fuel NOx. Then, the NOx concentration started to decrease, because the air classification design of the precalciner made the pulverized coal burn incompletely and produced CO, which reduced part of the NOx, and the air brought in by the upper tertiary air also diluted the NOx concentration. After the flue gas reaches the middle column, CO and the incomplete combustion of pulverized coal particles are mixed with the upper tertiary air and continue to burn, and NOx begins to increase, thus forming a locally high concentration area, the concentration in the local area is about 560 ppm. After leaving the burnout area, the NOx concentration still increases slowly because of the continuous combustion of pulverized coal particles, but the growth rate gets slower and slower, and the NOx concentration at the outlet is 531.33 ppm.
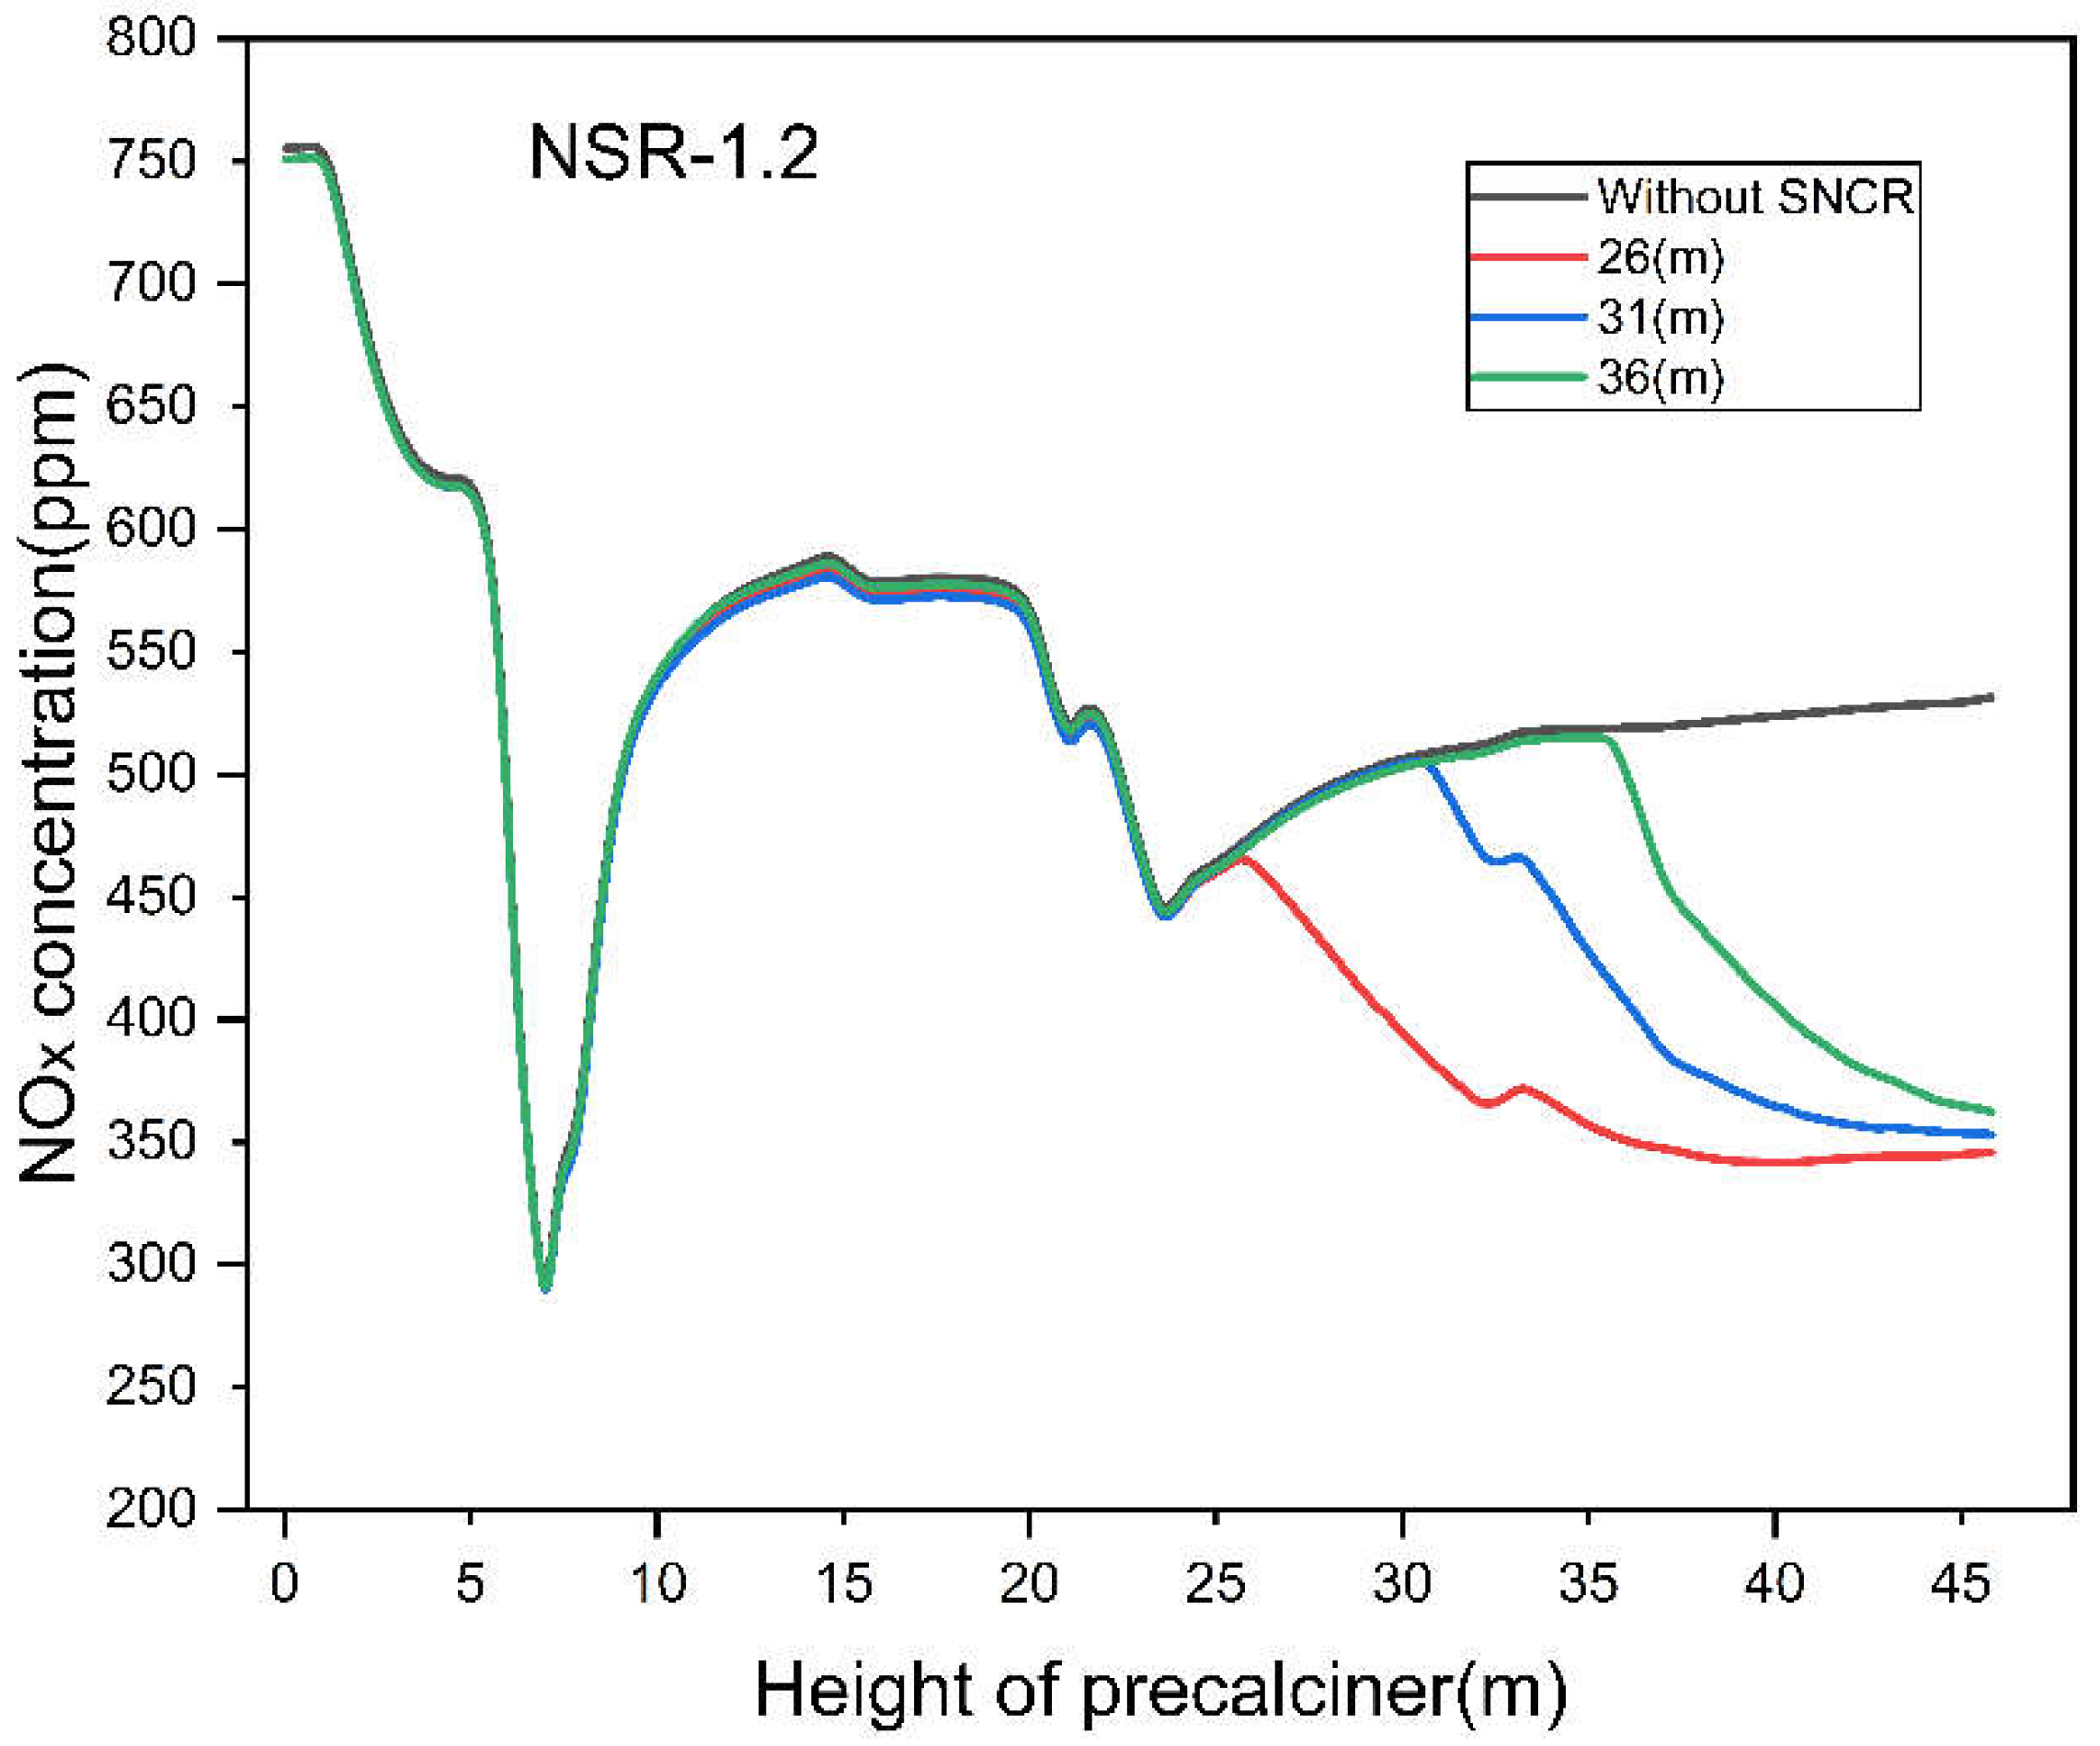
Figure 8 shows the variation of the average NOx concentration along the height in the precalciner after SNCR denitrification with different reductant injection heights at an ammonia-to-nitrogen ratio (NSR) of 1.2. In accordance with the previous discussion, the area between the burnout area and the outlet (25–46 m) is the most favorable area for the mixing and reaction of the reductant and the flue gas due to its stable flow field, uniform temperature distribution, and compliance with SNCR requirements. Therefore, three different ammonia injection heights (26 m, 31 m, and 36 m) in this zone, with a variation gradient of 5 m, were selected for SNCR the denitrification simulation study. It can be seen from Figure 8 that when the reductant is injected, the NOx in the flue gas immediately starts the reduction reaction, leading to a sharp drop of the NOx concentration in a very short time. This is mainly because, due to the high injecting velocity, the reductant can penetrate deeply into the flue gas and mix with the flue gas quickly, and then the reduction reaction occurs. After this, the remaining small amount of reductant continues to rise and react with the NOx in the precalciner. However, at this time, the reductant can only mix and react with NOx in a slow diffusion manner, so the decreasing trend of NOx concentration begins to slow down. At the same time, there is a local increase in NOx concentration when passing through the indentation area. It can be seen from the figure that the higher the height of the reductant injection, the faster the rate of NOx reduction. This is mainly because the higher the height is, the closer it is to the precalciner outlet, where the flow and component fields are more stable, and the concentration of NOx in the flue gas is also higher, which is more favorable to the reduction reaction. However, the simulation results show that the NOx concentrations at the outlet of the precalciner for different ammonia injection heights are 345.84 ppm, 353.16 ppm, and 362.50 ppm, respectively, indicating that the NOx concentration at the outlet increases with the increase of height. This is because the higher the height of the ammonia injection port, the shorter the time for the reduction reaction between the reductant and NOx. Therefore, the reductant does not have enough time to mix and react with the remaining flue gas after reducing the NOx in the flue gas near the ammonia injection port, thus reducing the total NOx reduction rate. In addition, the shortened reaction time allows a large amount of reductant to be carried out of the precalciner by the gas flow before it is completely consumed. Moreover, the higher the injection height, the higher the NH3 escape amount, reaching a maximum of 8.61 mg/m3. With a larger NSR, there will be more unreacted reductant, resulting in more NH3 escape. In general, the injection height of the reducing agent should be controlled within a certain range. Considering that the location of the reductant injection should avoid the indentation area and avoid the increase of ammonia escape caused by the short residence time of the reductant, the height of the reductant injection should be set within the range of 26–30 m of the precalciner.
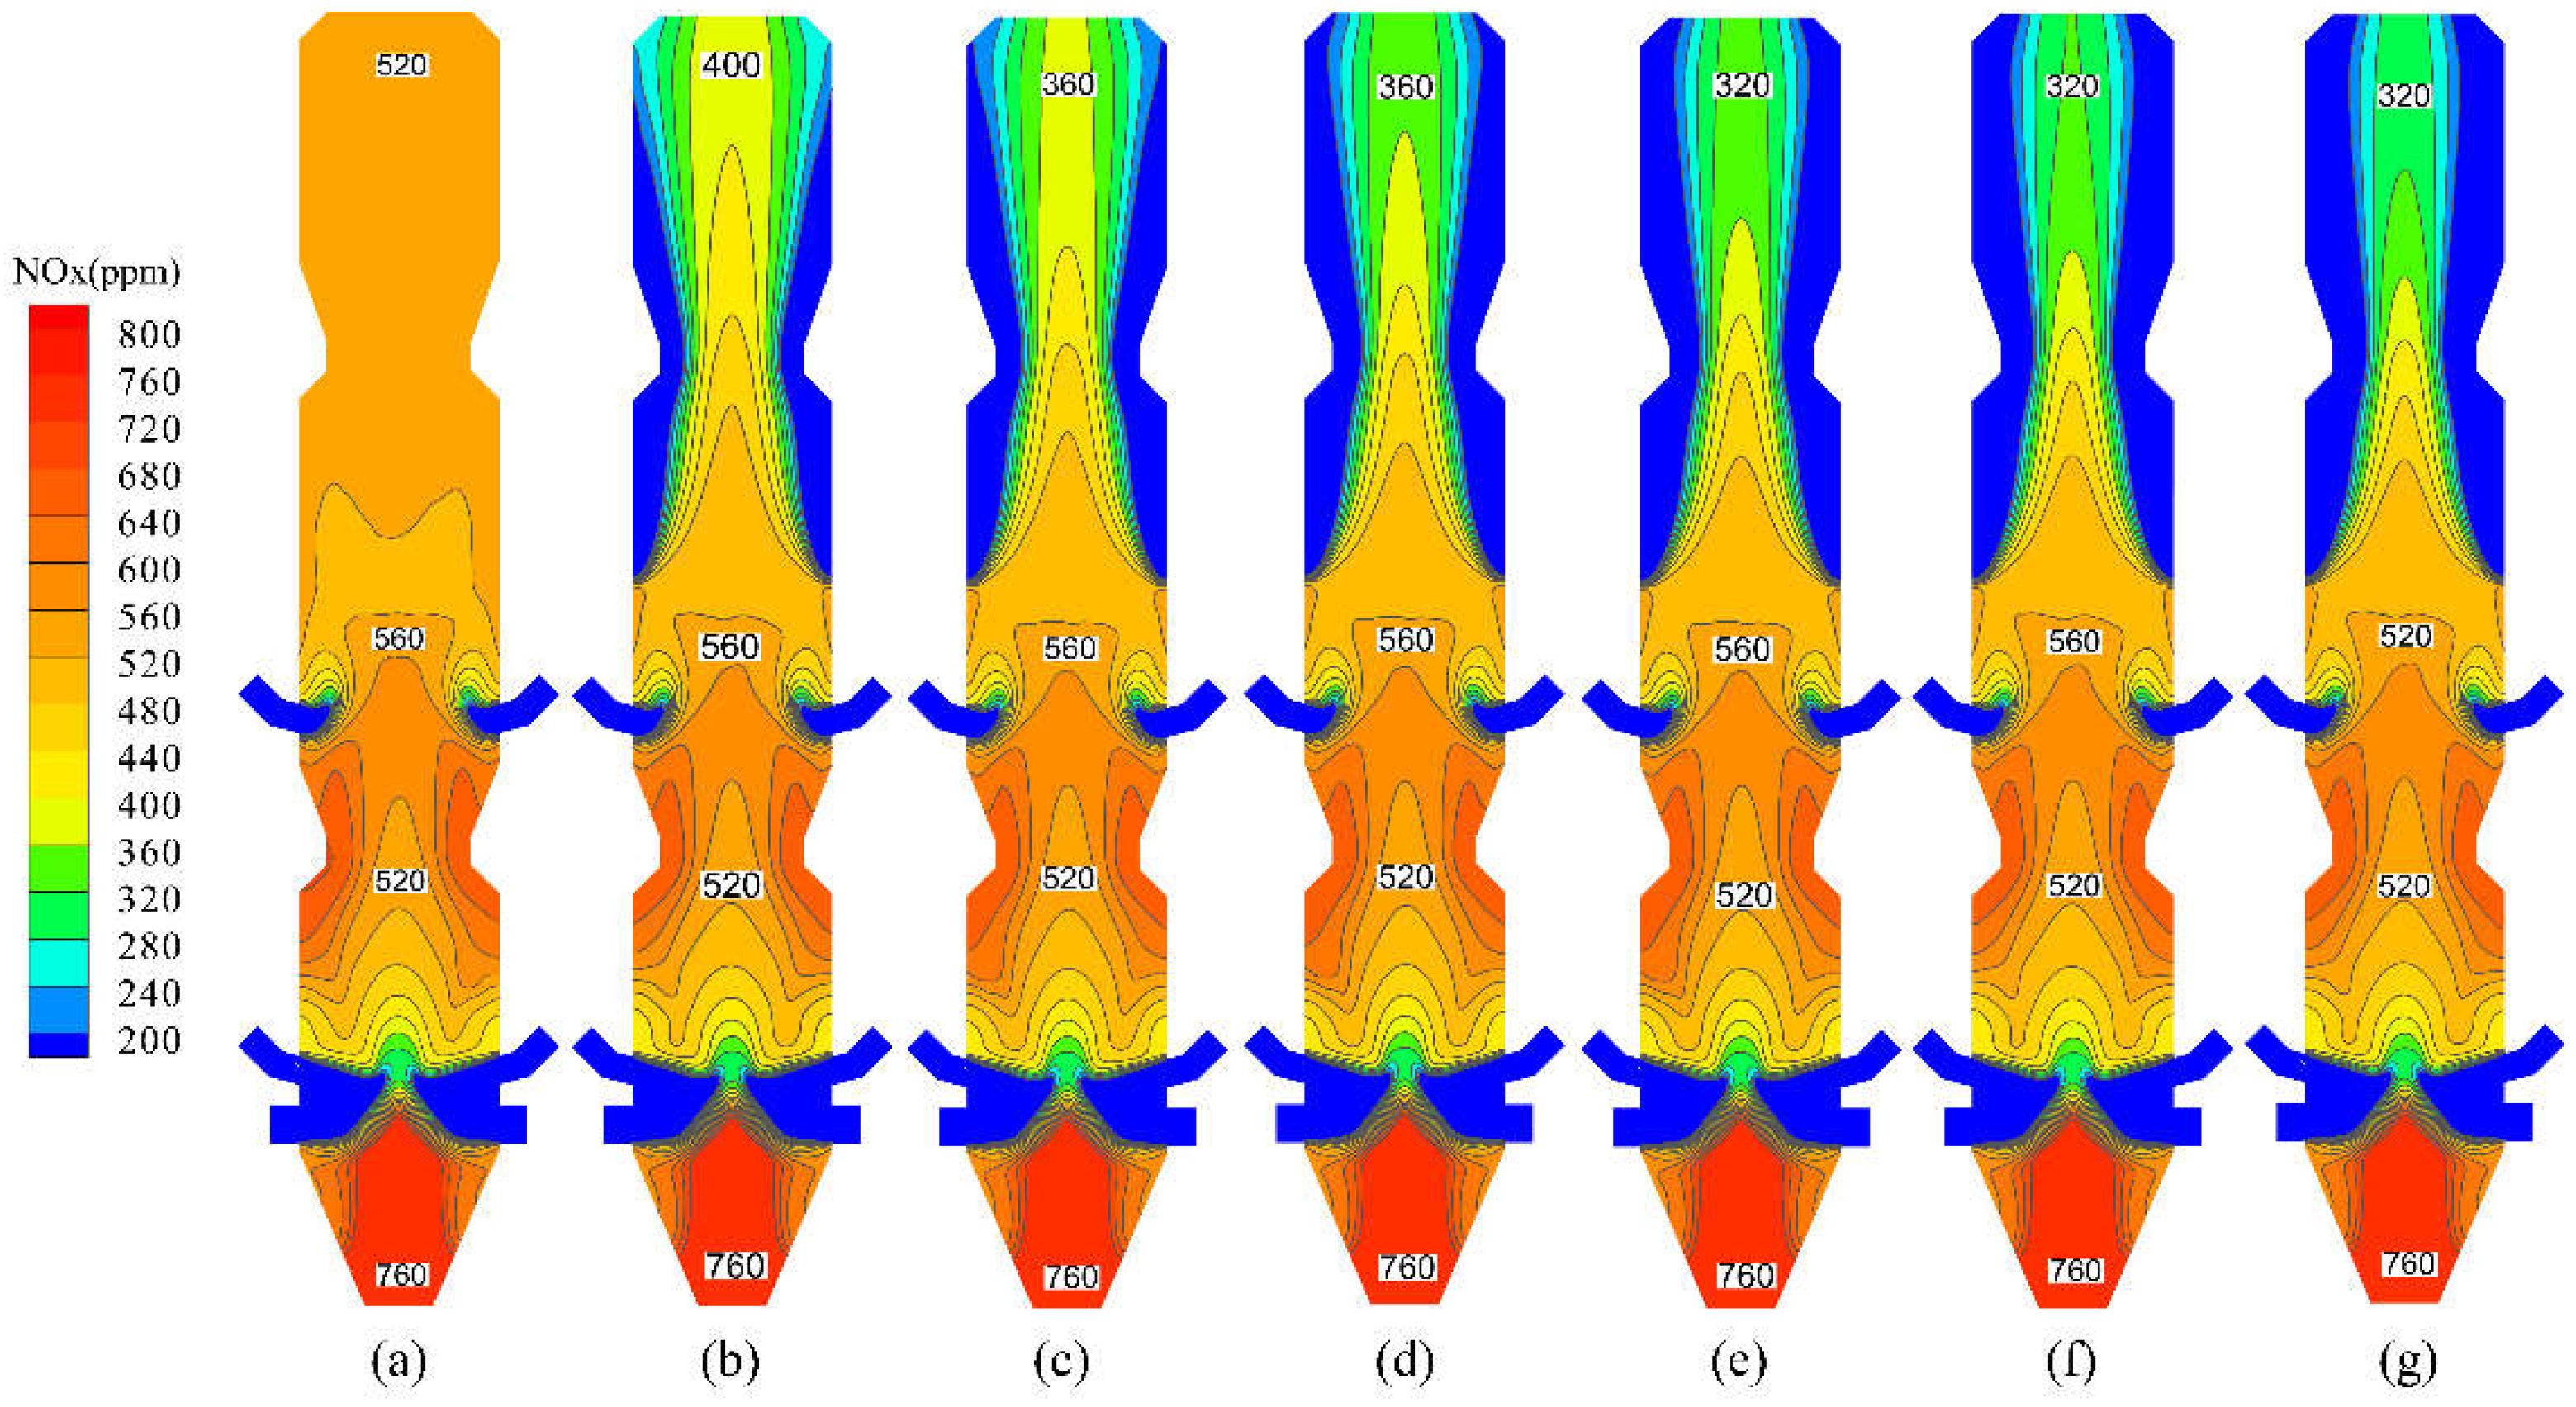
Figure 9 shows the distribution of NOx in the precalciner at different reductant injection amounts. It can be seen from Figure 9 that the reduction reaction with NOx starts immediately after the reductant is injected symmetrically from both sides of the precalciner at the height of Z = 26 m, consuming NOx in a large quantity in the area near the reductant injection port. At the same time, the concentration of NOx in the upper column of the precalciner decreases due to the further mixing and reaction of the reductant with the flue gas. 
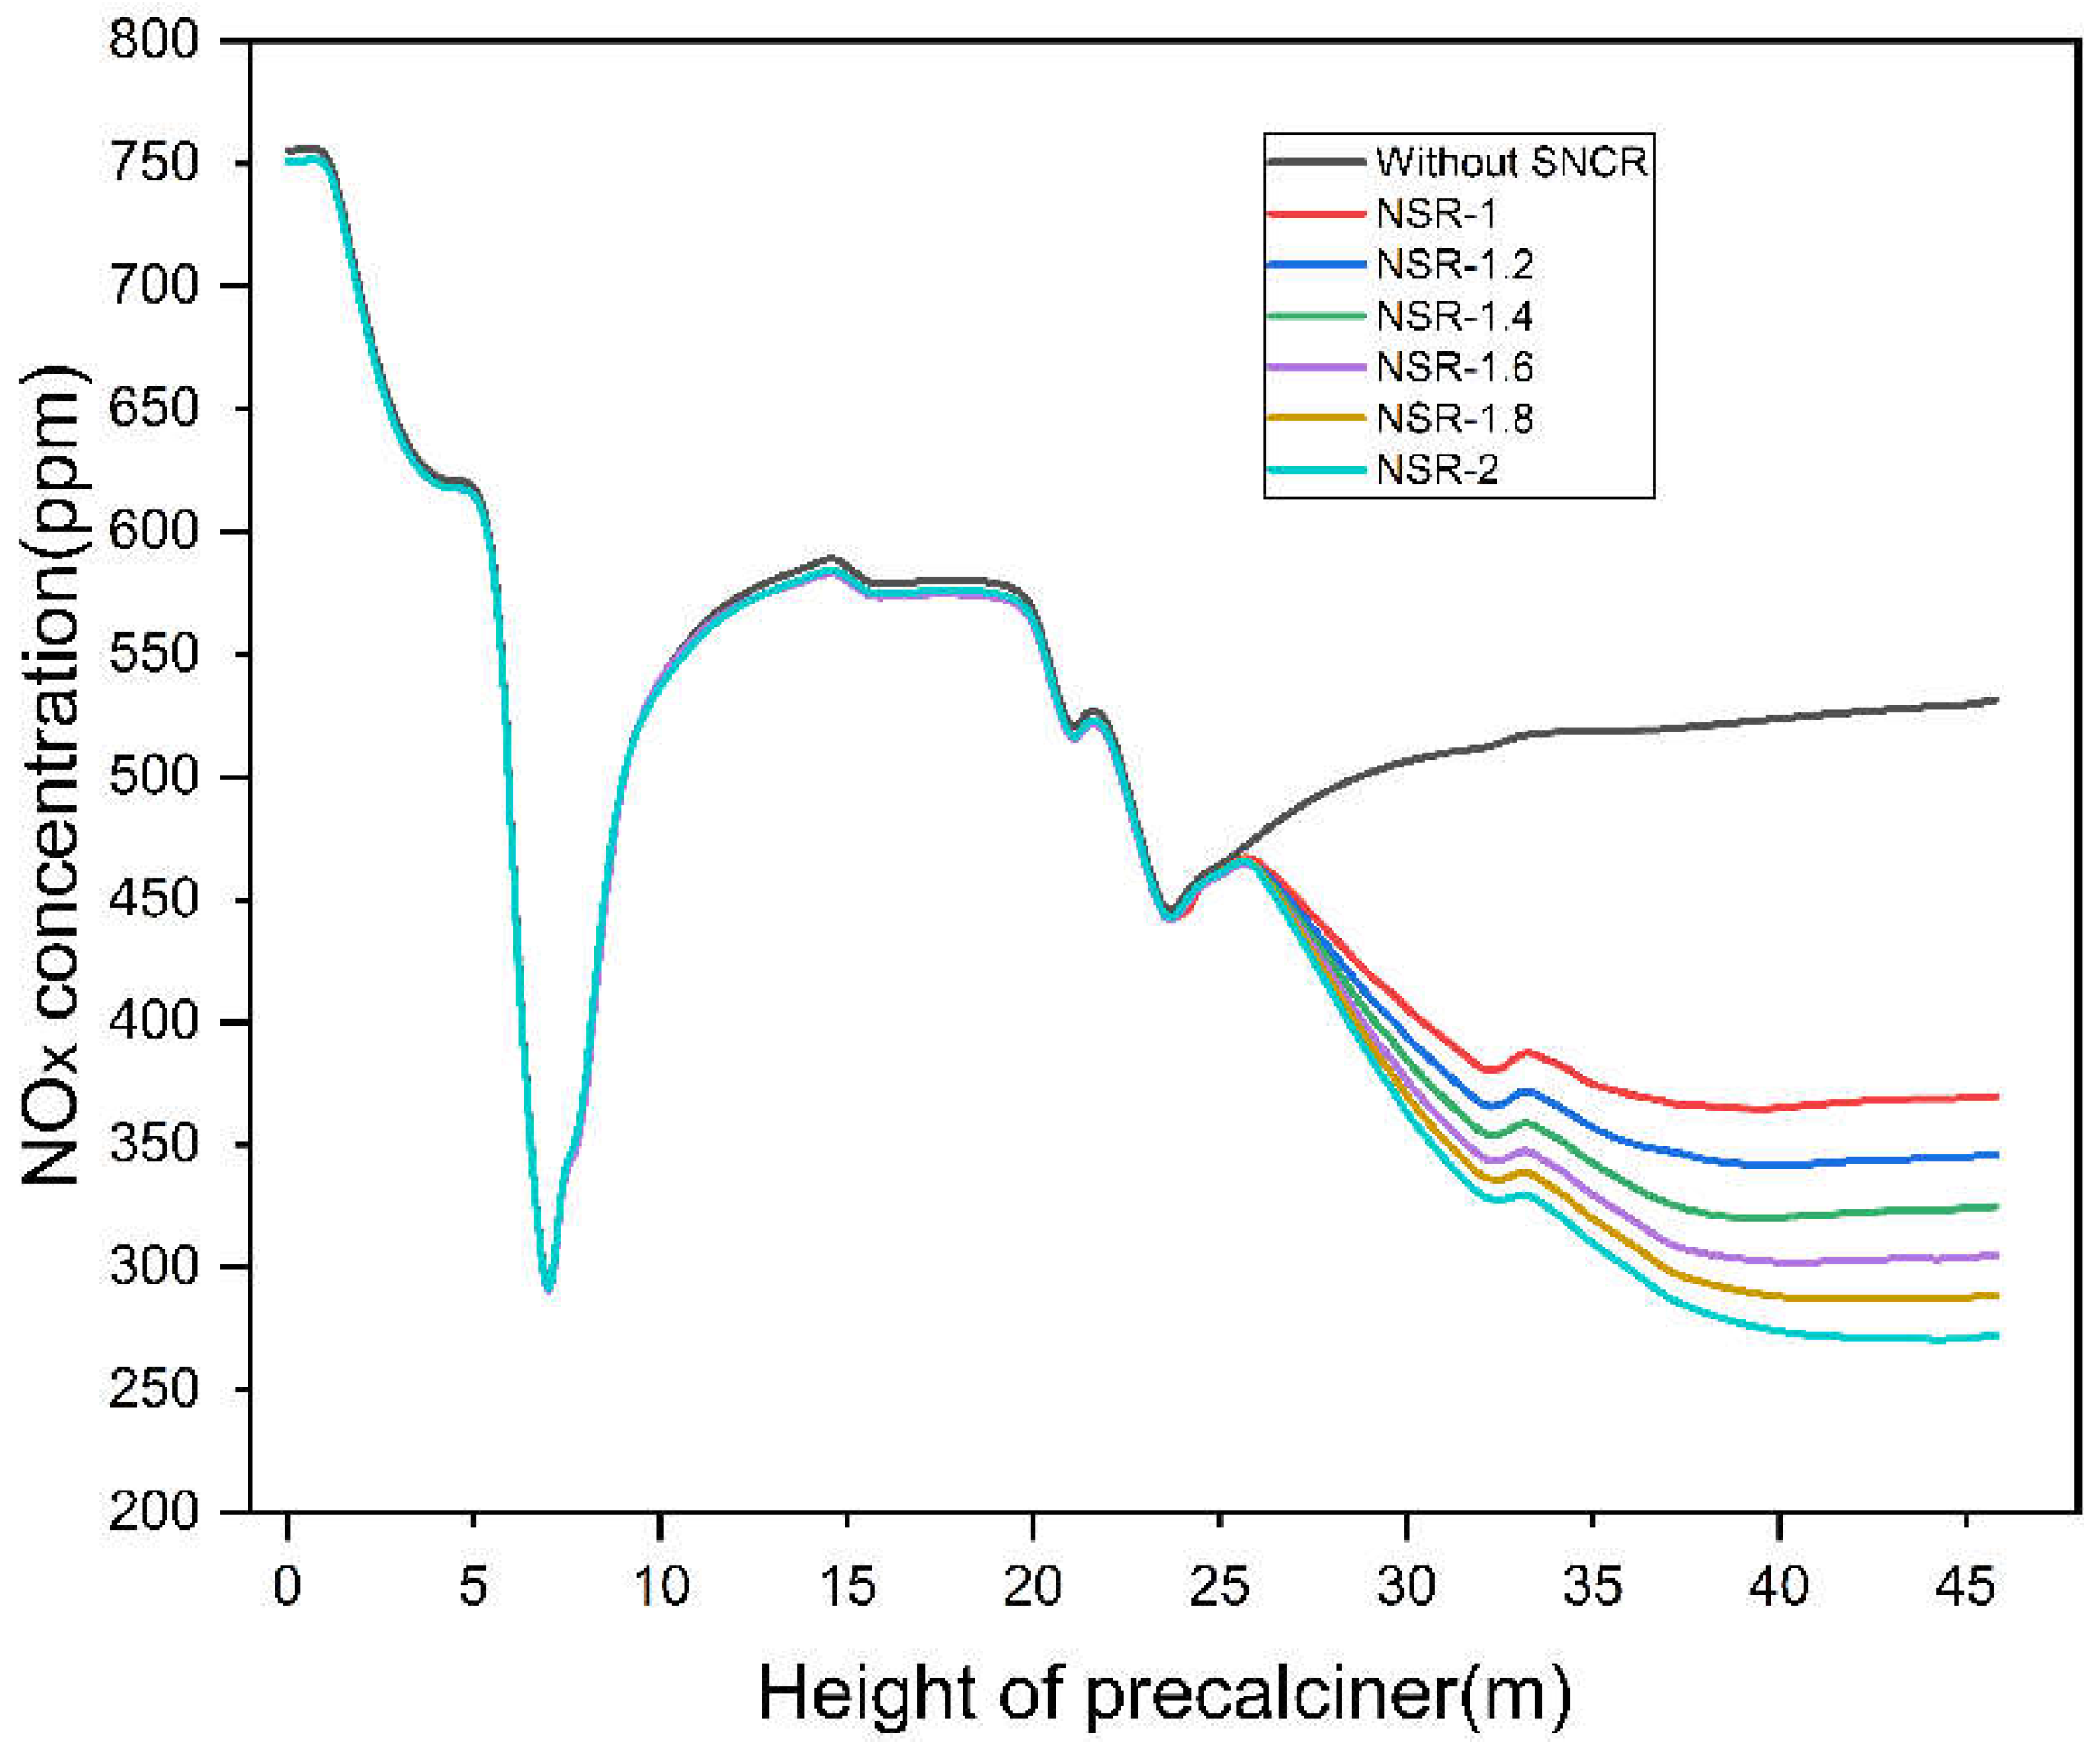
Figure 10 shows the variation of the average concentration of NOx along the height in the precalciner at different reductant injection amounts. Notably, the figure reveals that the SNCR process is divided into two stages: the first stage is in the 26–37 m region of the precalciner, and the second stage in the region of 37–46 m. In the first stage, the reductant is injected with high initial velocity so that it can penetrate the flue gas and mix with more NOx after injection. The concentration of the reductant near the nozzle is higher than required for the reduction reaction (except for the relatively lower concentration at the indentation), so this is a rapid stage for SNCR denitrification, which makes the NOx concentration decrease rapidly. In fact, most of the NOx is reduced in this stage. Meanwhile, it can be found that the larger the NSR is, the more the amount of injected reductant is, the faster the NOx is reduced in this stage, and the more the total amount of NOx is reduced. In the second stage, the mixing of the reductant and NOx in this stage depends on the diffusion of the reductant. Due to the greatly reduced concentration of reductant owing to the rapid consumption in the previous stage, the reductant does not diffuse or mix with NOx in time, i.e., the local reduction is stagnant. Therefore, the reduction reaction proceeds slowly in this stage. The larger the NSR, the higher the amount of reductant injection, the longer the denitrification duration of this stage, and the more NOx is reduced. In general, the NOx concentration at the outlet shows a positive correlation with the NSR in a stepwise manner. According to the simulated results, the NOx concentrations at the outlet of the precalciner under different NSR are 370.11 ppm, 346.04 ppm, 325.94 ppm, 304.90 ppm, 288.03 ppm and 272.06 ppm, respectively; the calculated NOx reduction rates of each group are 30.34%, 34.9%, 38.66%, 42.62%, 45.79% and 48.8%, respectively, all of which meet the NOx emission standards. However, a larger NSR means more reductant is injected, and the ammonia escape is also larger. In addition, in other numerical simulation studies on SNCR denitrification in precalciner, it has been demonstrated that ammonia escape increases significantly when the NSR is too large [8]. In particular, according to the simulation results, when the NSR are 1.8 and 2, the ammonia fugitive amounts are 10.11 mg/m3 and 11.22 mg/m3, respectively, and such a large amount of NH3 escape can cause serious pollution problems. After considering the denitrification efficiency, cost, and NH3 escape of SNCR, the NSR should be between 1 and 1.6 for SNCR denitrification.

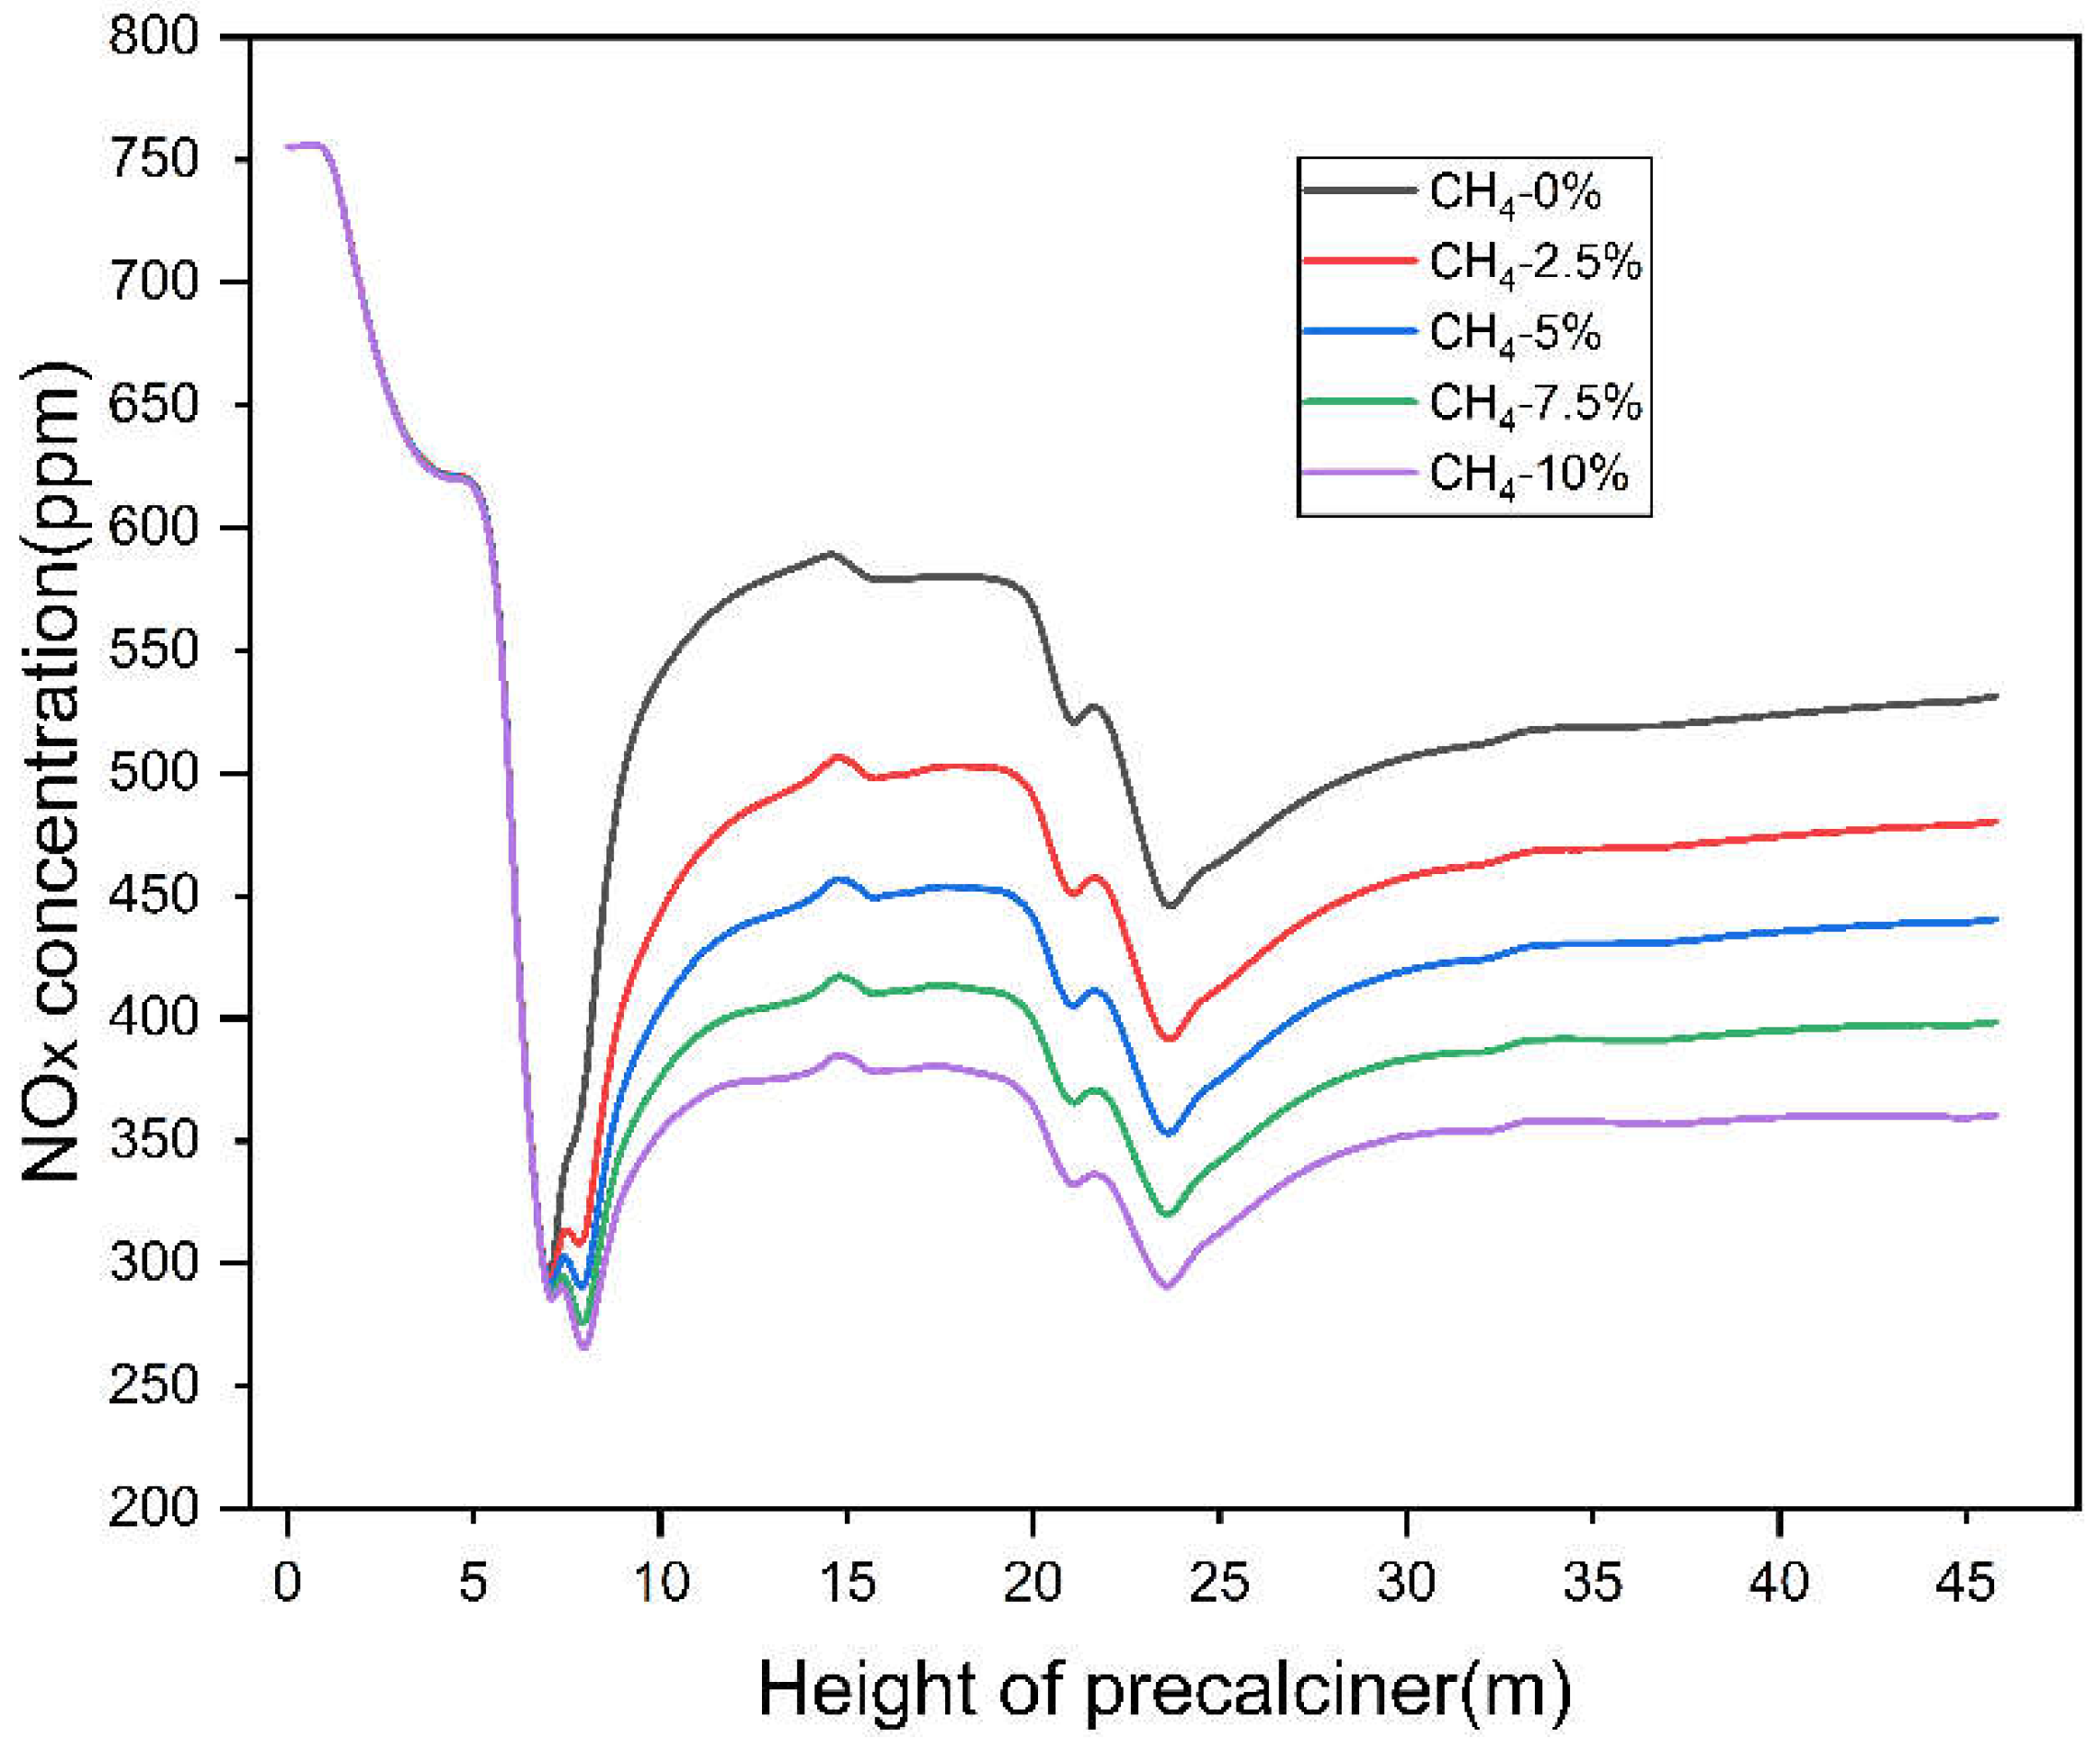
4.3.2. Analysis of Denitrification of Injected Natural Gas

Figure 11 shows the variation of NOx concentration along the height in the precalciner with different injection amounts of natural gas. 
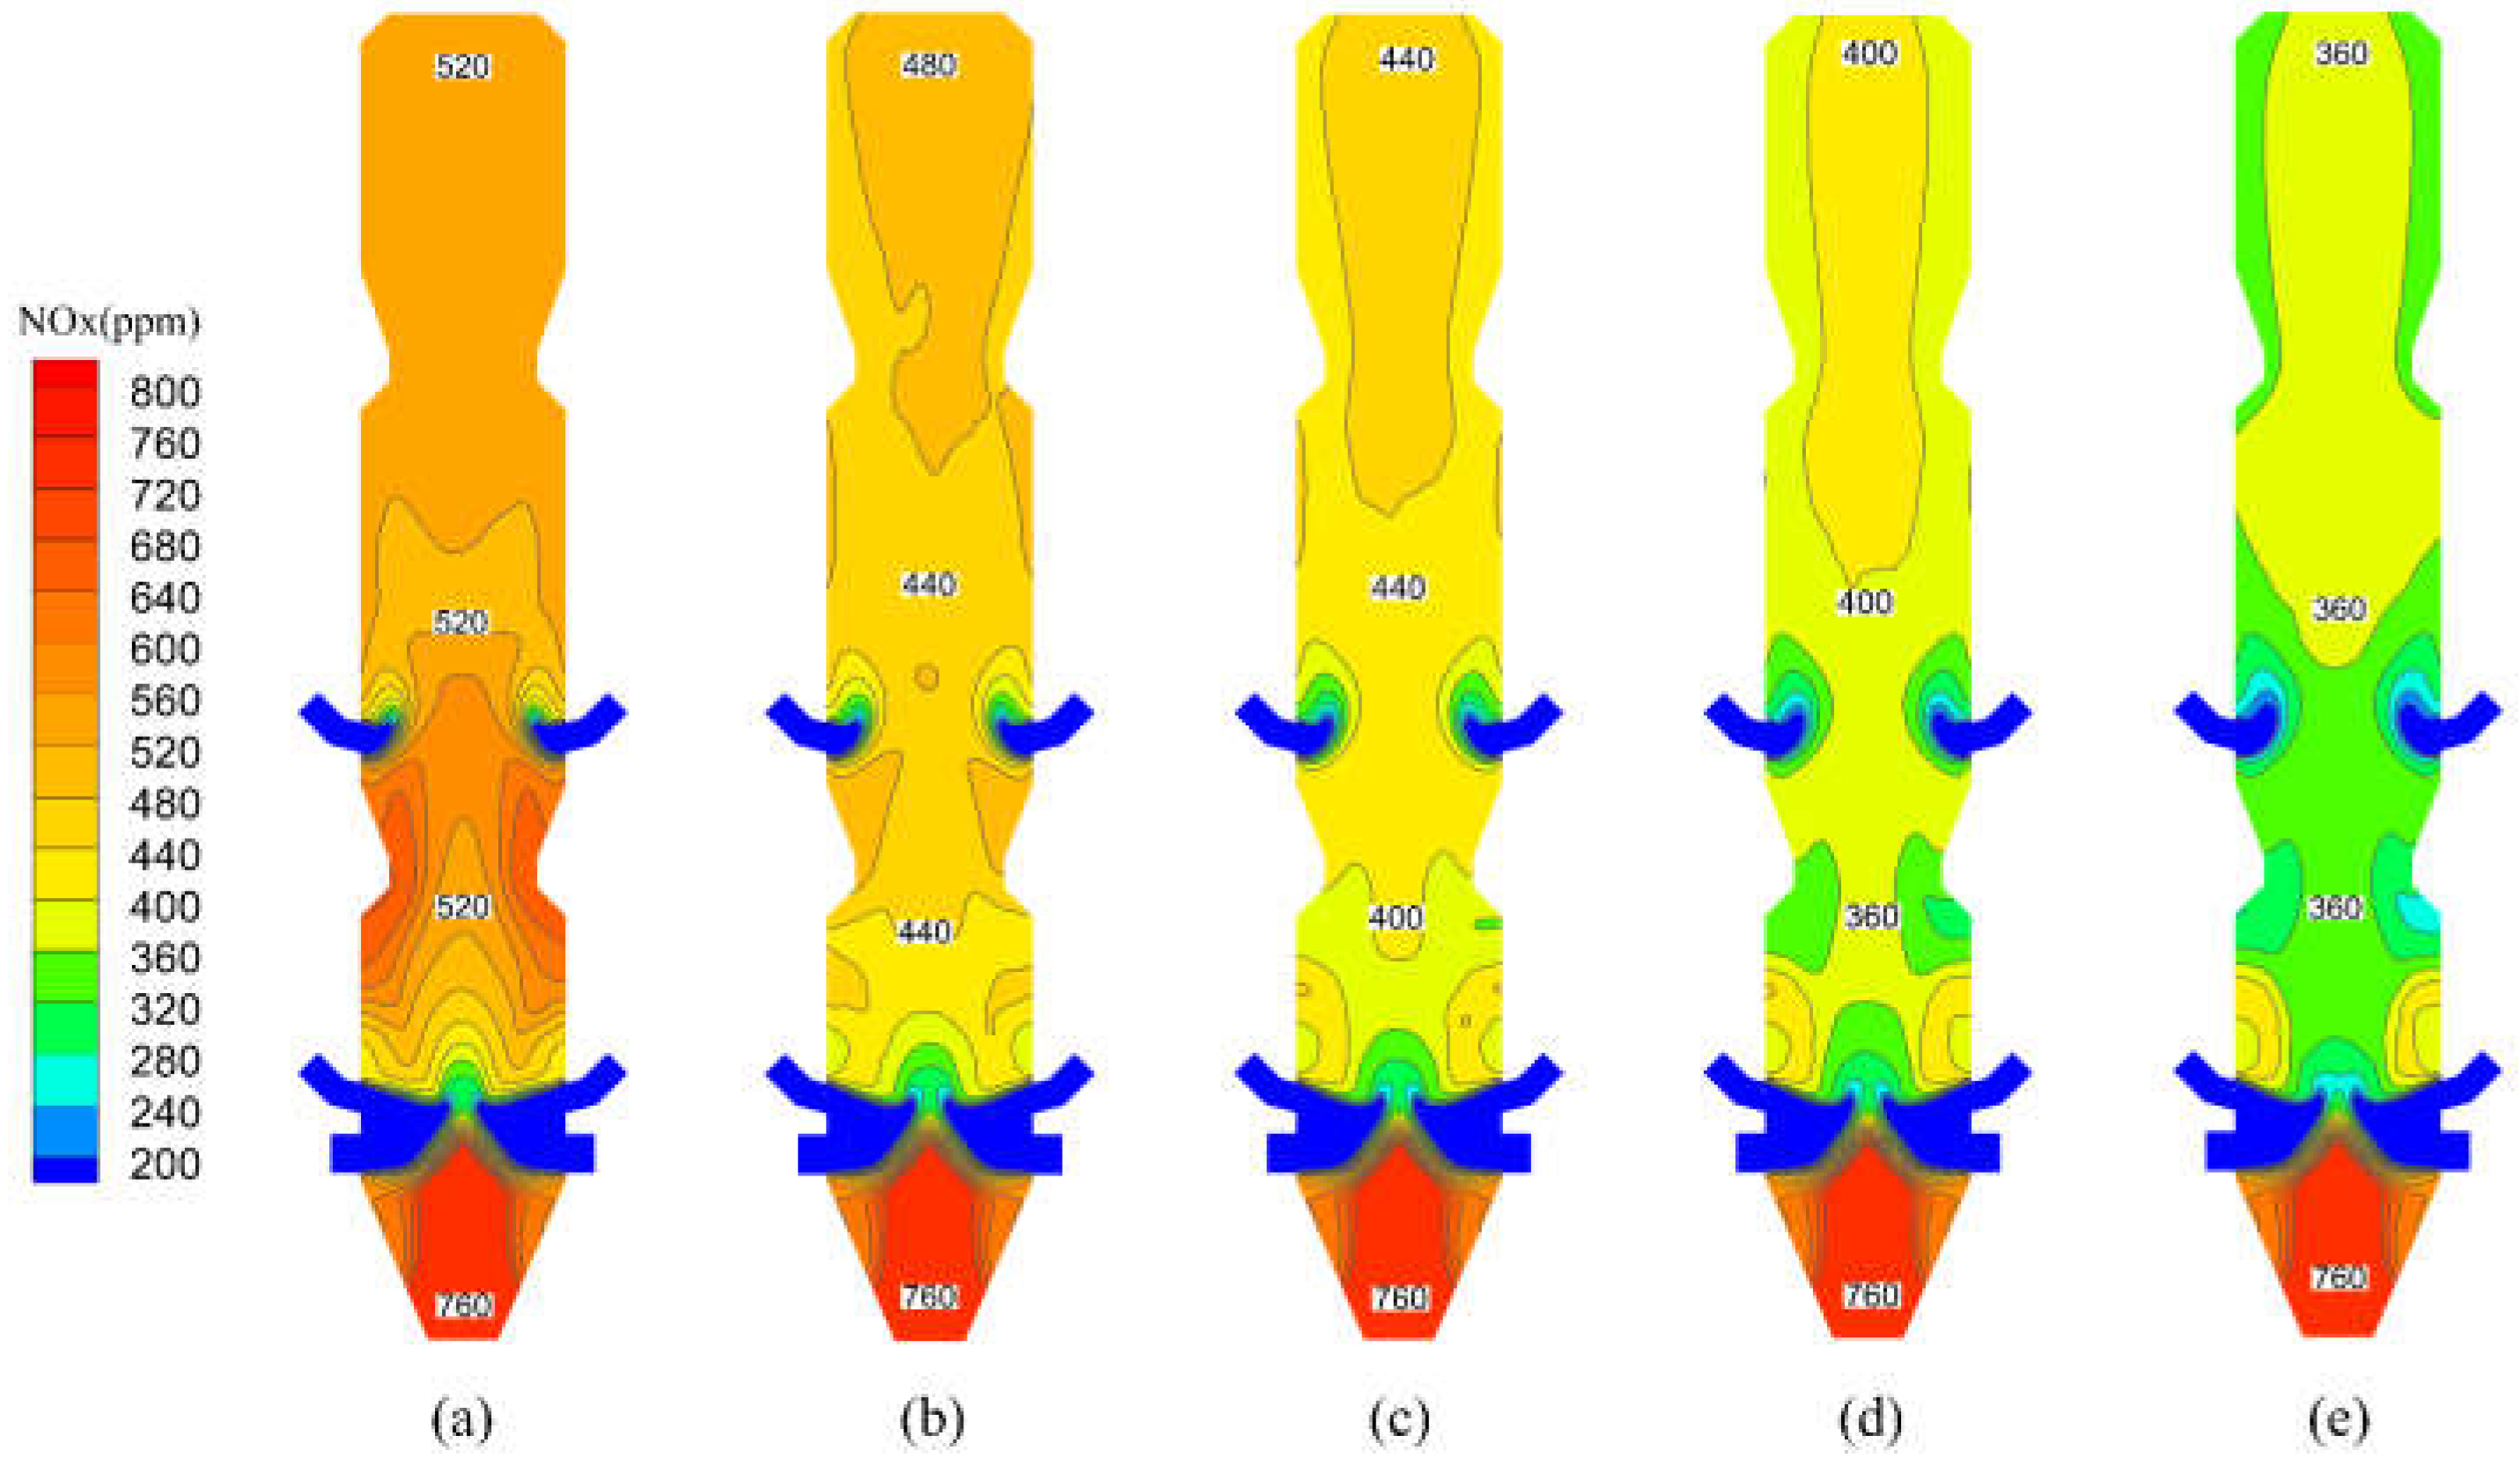
Figure 12 reveals the distribution of NOx in the precalciner after natural gas injection. From these two figures, it can be observed that the natural gas injection reduces the NOx generation in the precalciner, which leads to a decreased average NOx concentration and more uniform NOx distribution. Figure 11 shows that the NOx distribution in the area from the precalciner inlet to the tertiary air is not affected by the natural gas injection, and the changes of NOx distribution are mainly concentrated in the area of 8–25 m. In the main combustion zone, the NOx concentration decreases rapidly after the injection of natural gas, and the more natural gas is injected, the lower the concentration of NOx is, and the more uniform the distribution of NOx is. Correspondingly, in Figure 12, the average NOx concentration decreases significantly at the height of approximately 8 m in the precalciner, and the more natural gas is injected, the greater the decrease in concentration, which is due to the reduction reaction between the natural gas and NOx immediately after the injection. In the area of 8–15 m, the NOx concentration increases rapidly, because a large amount of fuel NOx was generated by the mixed combustion of pulverized coal and the tertiary air, and the average NOx concentration reaches the maximum at the height of 15 m. However, the injection of natural gas reduces the increasing speed of the NOx concentration in this area, with the NOx concentrations being approximately 510 ppm, 460 ppm, 410 ppm, and 380 ppm at the height of 15 m. As the amount of natural gas injected increases, the amount and rate of NOx generation becomes lower. This phenomenon, besides the reason that natural gas has a reducing effect on NOx, is also due to the rapid combustion of natural gas consuming a large amount of oxygen, which reduces the excess air coefficient in the main combustion zone. Under a low excess air coefficient, the amount of CO produced during the combustion of pulverized coal in the main combustion zone increases, and as a reductant, CO reacts with NOx, which reduces the concentration of NOx. At the same time, H2O, as a main product of CH4 combustion, can be converted to H2 at high temperatures, which can also reduce NOx [37]. In general, the reduction rate of NOx in the precalciner is positively related to the amount of natural gas injected: the higher the amount of injected natural gas, the higher the NOx reduction efficiency. According to the simulation results, the NOx concentrations at the precalciner outlet after natural gas injection are 480.515 ppm, 440.583 ppm, 398.539 ppm, and 360.501 ppm, respectively, while the NOx concentration at the precalciner outlet without denitrification is 531.33 ppm. Based on the simulation results, it is calculated that the NOx reduction rates in the precalciner with different natural gas injection amounts are 9.56%, 17.08%, 24.99%, and 32.15% respectively, which indicates that the natural gas injection can effectively reduce the NOx emission from the precalciner.

4.3.3. Analysis of Combined Denitrification

In addition to the effect of natural gas on the generation and reduction of NOx in the precalciner, this study also investigated the efficiency of natural gas reburning denitrification when applied in combination with SNCR technology. 
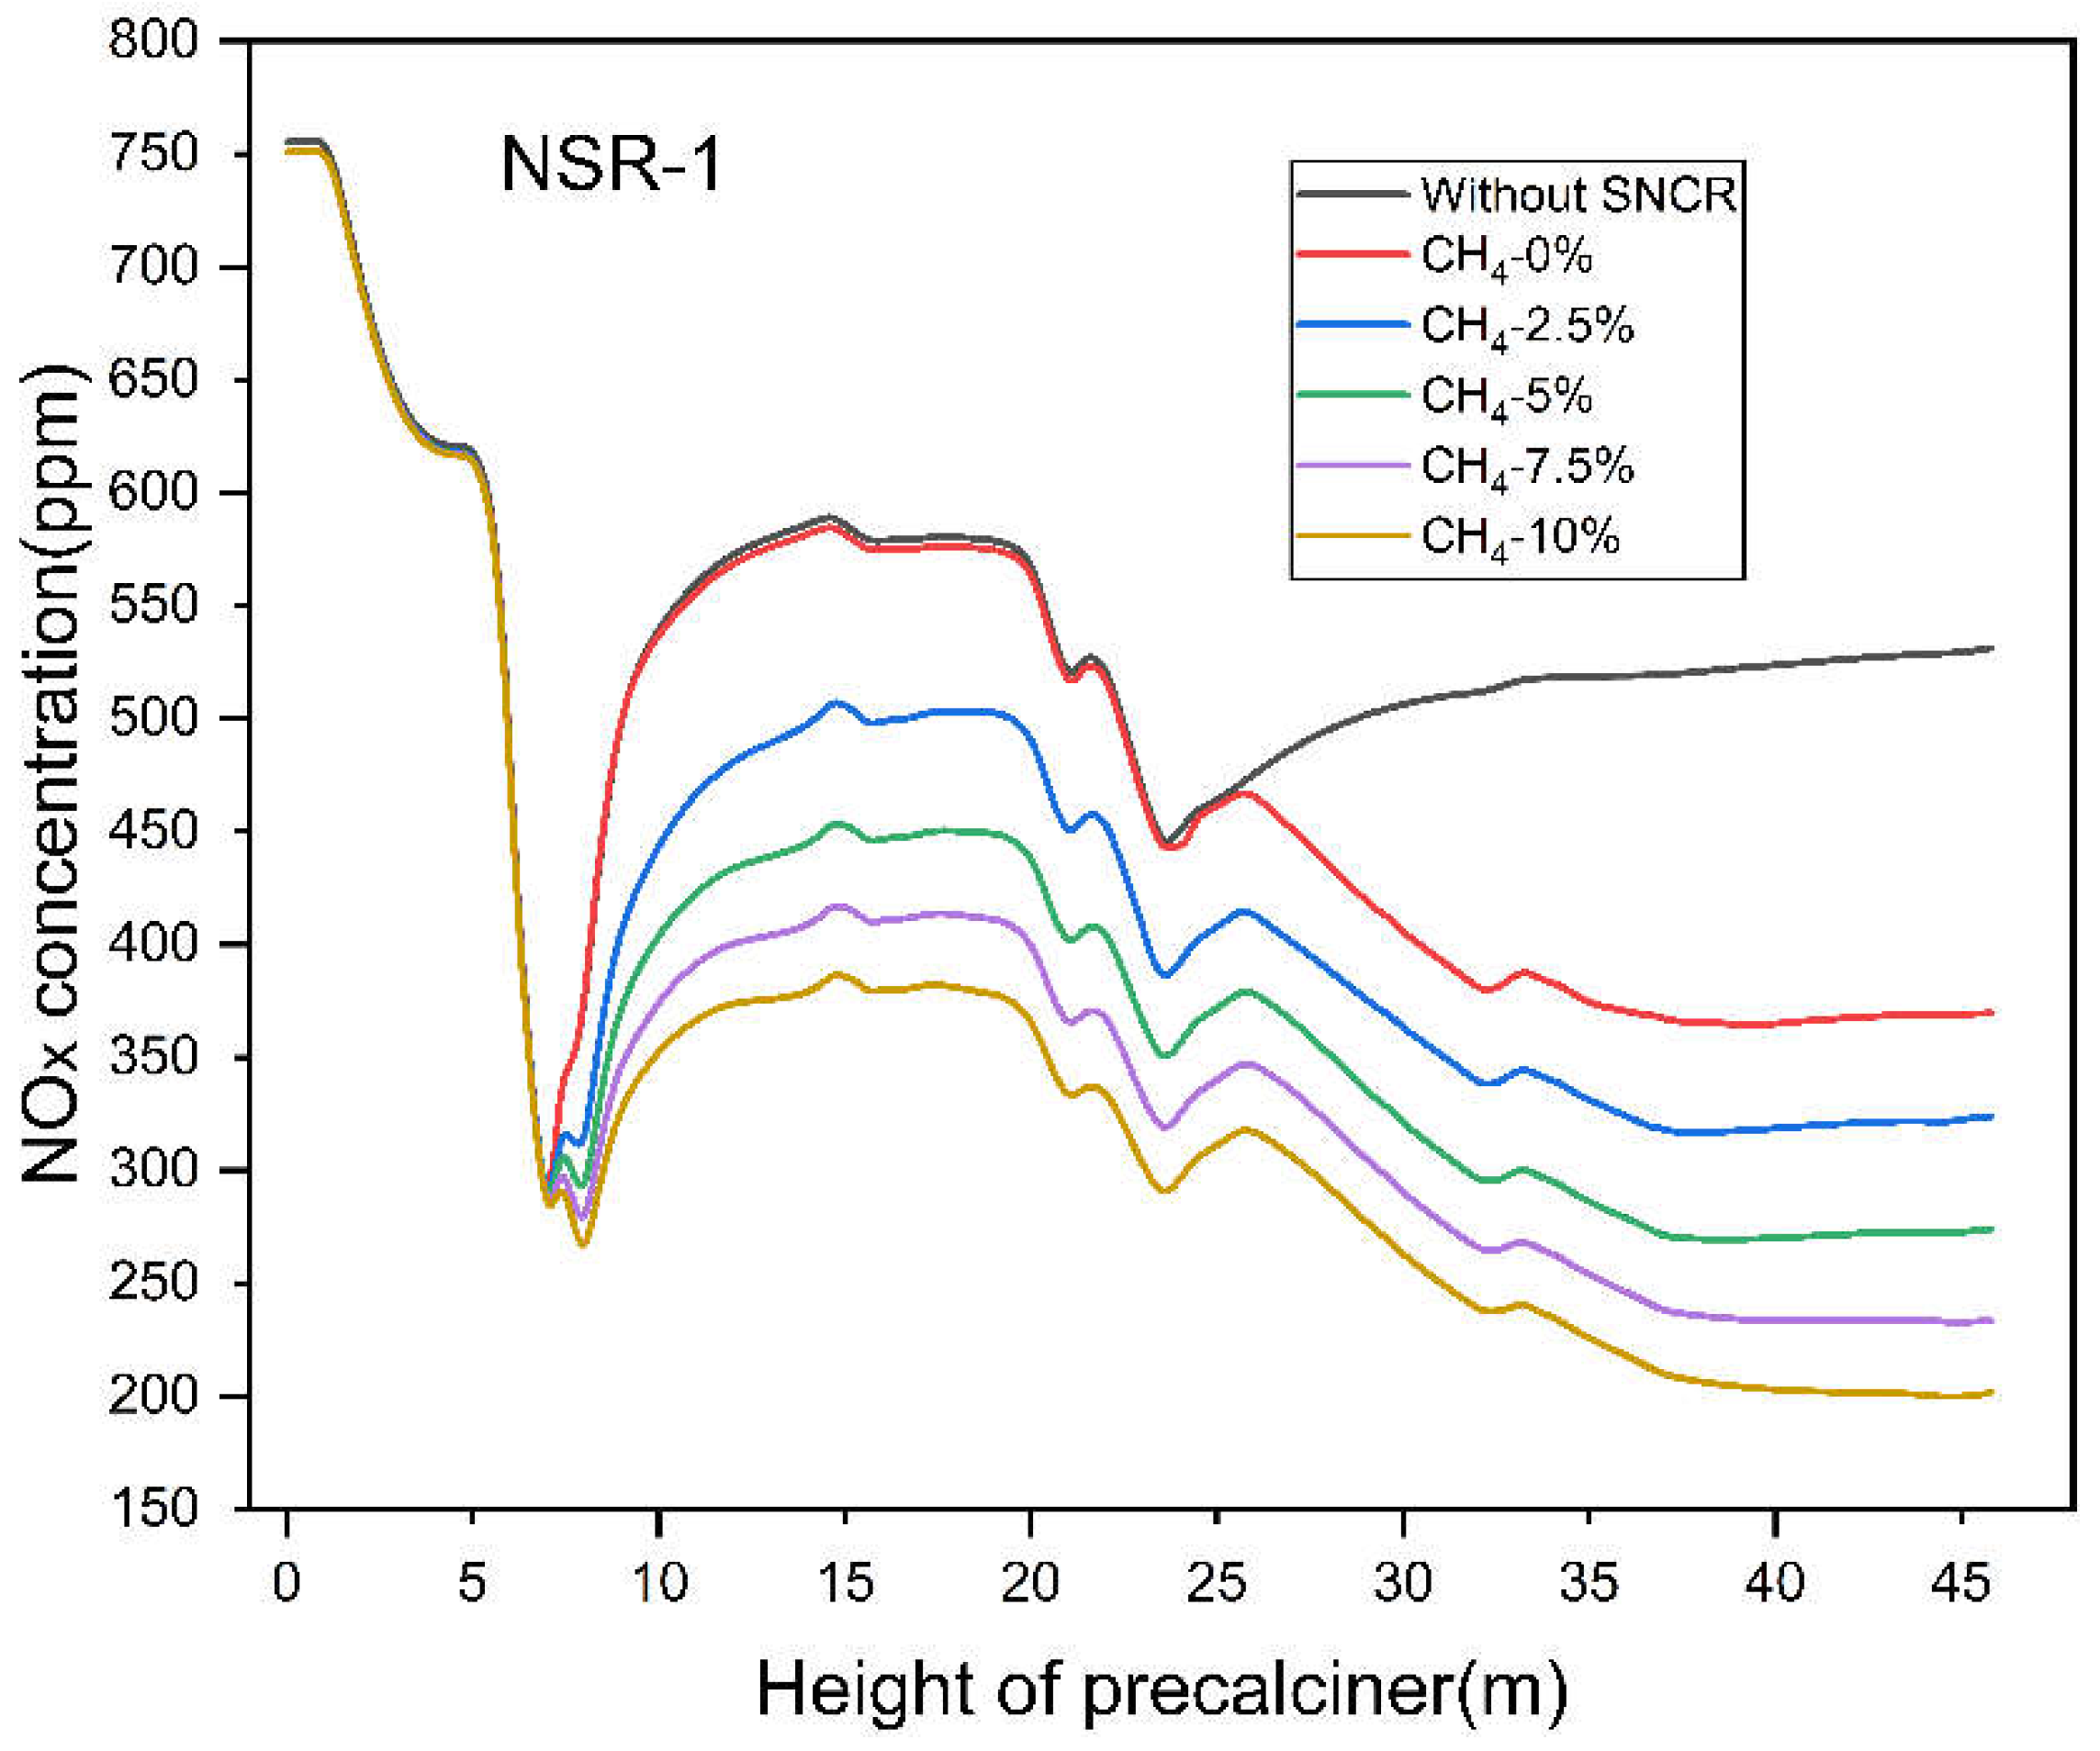
Figure 13 shows the variation of NOx concentration along the height in the precalciner for combined denitrification. The NSR of SNCR for combined denitrification is 1, the height of reductant injection is 26 m, and the natural gas injection amounts are 2.5%, 5%, 7.5%, and 10%, respectively.
From Figure 13, it can be seen that the trend of NOx concentration in the area between 8 and 25 m in the precalciner after combined denitrification is very close to that in Figure 12. The area after 25 m is the SNCR denitrification area, and the NOx concentration starts to decrease rapidly from 25 m onward. Moreover, the higher the natural gas injection, the faster the NOx concentration decreases. Even in the diffusive reduction phase, where NOx reduction is weak, the rate of NOx decline becomes faster. After comparing Figure 13 with Figure 12, it can be seen that natural gas reburning denitrification has a facilitating effect on SNCR technology. It can also be seen that the efficiency of combined denitrification is higher than the efficiency of natural gas reburning denitrification alone. According to the simulation results, the NOx concentrations at the outlet after combined denitrification are 323.87 ppm, 273.96 ppm, 233.27 ppm, and 201.97 ppm, respectively. The calculated NOx reduction rates for each group are 39.05%, 48.44%, 56.1%, and 61.98%, respectively, which shows that the combined denitrification technology has a good denitrification effect. In contrast, the NOx reduction rate of SNCR denitrification is only 30.34%, much less than that of combined denitrification.
In summary, the denitrification effect of the combined denitrification technology is better than reburning denitrification alone or SNCR denitrification alone. In addition, the NOx reduction rate of SNCR denitrification alone at a NSR of 2 is 48.8%, while the NOx reduction rate of combined denitrification technology at a NSR of 1 with 5% natural gas injection is 48.44%, indicating that combined denitrification can significantly reduce the amount of reductant at a similar NOx reduction rate. According to the results of the above study, the combined denitrification technology, if put into practice, can save 50% of the urea-reductant dosage with the same denitrification rate, which requires an additional 5% of the pulverized coal mass of LNG. At the same time, because the combined denitrification increases the decomposition rate of raw material, the amount of pulverized coal in the rotary kiln can be reduced, thus reducing the cost of cement firing. All of this means that the combined denitrification technology does not significantly impact the cost of the denitrification process while maintaining the denitrification efficiency.
In addition, in a similar denitrification simulation study, researchers combined the new denitrification technology with conventional SNCR denitrification and conducted denitrification simulation studies. The results showed that this different form of combined denitrification technology also greatly improved the denitrification rate [38]. Therefore, combined denitrification is a promising technology.

5. Conclusions

In this study, the operation of a TTF (Trinal-sprayed) type precalciner was firstly simulated numerically using commercial Fluent software. The results show that in the precalciner, the pulverized coal combustion zone mainly includes the main combustion zone near the lower part of the tertiary air and the combustion zone near the upper part of the tertiary air. The heat absorption decomposition reaction of CaCO3 is also mainly concentrated in these two zones. The temperature at the outlet of the precalciner is 1269.18 K, which is similar to the actual measurement result of 1217 K. The same CaCO3 decomposition rate is 92.72%, which is consistent with the actual production in the range of feedstock decomposition rates (90%–95%), and these also verify the reliability of the simulation. Among the influencing factors of the SNCR process, the reductant injection height and injection flow rate have the greatest effect on NOx reduction efficiency and ammonia escape. The simulation results show that the temperature inside the furnace is uniform and can meet the needs of SNCR reaction in the 26–30 m height area. At the same time, the flow field and component distribution inside the furnace are stable and conducive to the mixing and reaction of reductant and flue gas. Moreover, there is enough time for the reductant to react with the NOx after injection, which will not cause excessive residue of the reductant. Therefore, the height of reductant injection is set in the area of 26–30 m precalciner height. Within the suitable height of reductant injection, the higher the NSR, the higher the NOx reduction rate. However, the larger the NSR, the larger the amount of remaining unreacted reductant will be, which eventually increases the ammonia escape amount. Therefore, the NSR should be controlled between 1 and 1.6 to ensure denitrification efficiency. The denitrification rate reached the maximum value of 42.62% under the optimal conditions of 26 m reductant injection height and 1.6 NSR.
This paper also studied and analyzed the effectiveness of natural gas co-combustion denitrification. The results showed that natural gas co-combustion could effectively reduce NOx generation, and the denitrification rate reached a maximum of 32.15% when the natural gas injection was 10%. Simulation results of combining natural gas with SNCR for co-denitrification showed that the denitrification effect of co-denitrification was better than that of the single denitrification process. Under the condition of NSR of 1 and natural gas injection of 10%, the denitrification rate was improved by 29.83% and 31.64–61.98% compared to SNCR only or co-combustion denitrification only, respectively. Moreover, less reductant is used in co-denitrification, so the problem of exceeding ammonia emissions can be avoided. In summary, it can be found that SNCR technology has been further process optimized, while natural gas co-combustion denitrification technology has the potential to be applied in precalciner. Moreover, with the increasing pressure for environmental protection, the application prospects of co-denitrification technology will be more extensive to cope with the more stringent emission standards.

Author Contributions

H.K. provided research ideas and directed the study. Y.Y. refined the study protocol and performed the simulations and analysis of the results, writing, and editing the manuscript. G.W. was responsible for the validation of the model. J.W. and X.Z. were responsible for the data collection for the cement plant testing work. All authors have read and agreed to the published version of the manuscript.

Funding

This work was supported by the general institute of building materials research of China (No. 2017YFC0210801).

Conflicts of Interest

The authors declare that they have no conflicts of interest to report regarding the present study.

Nomenclatures

Aeffective surface area of particle (m2)
a absorption coefficient
C mass flow rate (kg/s)
D 0 diffusion rate (mol/s)
DTurbulent kinetic energy (J)
dpparticle diameter (m)
Fforce (N)
Gincident radiation (W/m2)
KKinetic rate
kTurbulent kinetic energy (m2/s2)
mweight (kg)
nrefractive index of the medium
Ppressure (Pa)
q r radiation flux (W)
R e Reynolds number
Rreaction rate constant (s−1)
Ttemperature (K)
uvelocity (m/s)
Greek symbols
εTurbulent dissipation rate (m2/s3)
ηdecomposition rate (%)
μTurbulent viscosity
ρdensity (kg/m3)
σ s scattering coefficient
σ Stefan-Boltzmann constant W/(m2·K⁴)
Subscripts
jbelonging to jth substances
pparticle parameters
xadded value
rradiation parameters
vvolatiles

References

  1. Lei, Y.; Zhang, Q.A.; Nielsen, C.; He, K.B. An Inventory of Primary Air Pollutants and Co2 Emissions From Cement Production in China, 1990–2020. Atmos. Environ. 2011, 45, 147–154. [Google Scholar] [CrossRef]
  2. Vignesh, R.; Ashok, B. Critical Interpretative Review On Current Outlook and Prospects of Selective Catalytic Reduction System for De-Nox Strategy in Compression Ignition Engine. Fuel 2020, 276, 117996. [Google Scholar] [CrossRef]
  3. Xu, Y.Y.; Zhang, Y.; Wang, J.C.; Yuan, J.Q. Application of Cfd in the Optimal Design of a Scr-Deno(X) System for a 300 Mw Coal-Fired Power Plant. Comput. Chem. Eng. 2013, 49, 50–60. [Google Scholar] [CrossRef]
  4. Fan, W.D.; Li, Y.; Guo, Q.H.; Chen, C.; Wang, Y. Coal-Nitrogen Release and Nox Evolution in the Oxidant-Staged Combustion of Coal. Energy 2017, 125, 417–426. [Google Scholar] [CrossRef]
  5. Wang, W.S.; Liao, Y.H.; Liu, J.; Huang, Z.H.; Tian, M. Numerical Simulation and Optimization of Staged Combustion and Nox Release Characteristics in Precalciner. J. Therm. Sci. 2019, 28, 1024–1034. [Google Scholar] [CrossRef]
  6. Fan, W.Y.; Zhu, T.L.; Sun, Y.F.; Lv, D. Effects of Gas Compositions On Nox Reduction by Selective Non-Catalytic Reduction with Ammonia in a Simulated Cement Precalciner Atmosphere. Chemosphere 2014, 113, 182–187. [Google Scholar] [CrossRef]
  7. Hu, Z.F.; Jiang, E.C.; Ma, X.Q. Numerical Simulation On Operating Parameters of Sncr Process in a Municipal Solid Waste Incinerator. Fuel 2019, 245, 160–173. [Google Scholar] [CrossRef]
  8. Liu, Y.; Kao, H.T. Numerical Simulation of Urea Based Sncr Process in a Trinal-Sprayed Precalciner. J. Renew. Mater. 2021, 9, 269–294. [Google Scholar] [CrossRef]
  9. Xia, Z.H.; Li, J.; Wu, T.T.; Chen, C.X.; Zhang, X.K. Cfd Simulation of Msw Combustion and Sncr in a Commercial Incinerator. Waste Manag. 2014, 34, 1609–1618. [Google Scholar] [CrossRef]
  10. Javed, M.T.; Irfan, N. Computational Modelling of Nox Removal by Selective Non-Catalytic Reduction. Int. J. Environ. Pollut. 2007, 29, 495–504. [Google Scholar] [CrossRef]
  11. Kang, Z.Z.; Yuan, Q.X.; Zhao, L.Z.; Dai, Y.K.; Sun, B.M.; Wang, T. Study of the Performance, Simplification and Characteristics of Sncr De-Nox in Large-Scale Cyclone Separator. Appl. Therm. Eng. 2017, 123, 635–645. [Google Scholar] [CrossRef]
  12. Li, S.; Ge, Y.F.; Wei, X.L. Experiment On Nox Reduction by Advanced Reburning in Cement Precalciner. Fuel 2018, 224, 226–231. [Google Scholar] [CrossRef]
  13. Bae, S.W.; Roh, S.A.; Kim, S.D. No Removal by Reducing Agents and Additives in the Selective Non-Catalytic Reduction (Sncr) Process. Chemosphere 2006, 65, 170–175. [Google Scholar] [CrossRef]
  14. Fu, S.L.; Song, Q.; Yao, Q. Study On the Catalysis of Caco3 in the Sncr Deno(X) Process for Cement Kilns. Chem. Eng. J. 2015, 262, 9–17. [Google Scholar] [CrossRef]
  15. Fu, S.L.; Song, Q.; Tang, J.S.; Yao, Q. Effect of Cao On the Selective Non-Catalytic Reduction Deno(X) Process: Experimental and Kinetic Study. Chem. Eng. J. 2014, 249, 252–259. [Google Scholar] [CrossRef]
  16. Yao, Y.; Chen, Y. Technical Route to Achieve Ultra-Low Emission of Nitrogen Oxides with Predictive Model of Nitrogen Oxide Background Concentration. Processes 2020, 8, 1104. [Google Scholar] [CrossRef]
  17. Gao, R.D.; Yin, S.Y.; Song, T.; Lu, P. Numerical Simulation of Co-Combustion of Pulverized Coal and Biomass in Ttf Precalciner. Fuel 2023, 334, 126515. [Google Scholar] [CrossRef]
  18. Han, K.H.; Niu, S.L.; Lu, C.M. Experimental Study On Biomass Advanced Reburning for Nitrogen Oxides Reduction. Process Saf. Environ. Prot. 2010, 88, 425–430. [Google Scholar] [CrossRef]
  19. Oluwoye, I.; Zeng, Z.; Mosallanejad, S.; Altarawneh, M.; Gore, J.; Dlugogorski, B.Z. Controlling Nox Emission From Boilers Using Waste Polyethylene as Reburning Fuel. Chem. Eng. J. 2021, 411, 128427. [Google Scholar] [CrossRef]
  20. Zhu, J.K.; Kao, H.T. Numerical Simulation of Co-Combustion of Pulverized Coal and Different Proportions of Refused Derived Fuel in Ttf Precalciner. J. Renew. Mater. 2021, 9, 1329–1343. [Google Scholar] [CrossRef]
  21. Barraza, C.L.; Bula, A.J.; Palencia, A. Modeling and Numerical Solution of Coal and Natural Gas Co-Combustion in a Rotary Kiln. Combust. Sci. Technol. 2012, 184, 26–43. [Google Scholar] [CrossRef]
  22. Kowalewski, D. Emissions and Properties of Bio-Oil and Natural Gas Co-Combustion in a Pilot Stabilised Swirl Burner; University of Toronto (Canada): Toronto, ON, Canada, 2015. [Google Scholar]
  23. Javadi, S.M.; Moghiman, M. Experimental Study of Natural Gas Temperature Effects On the Flame Luminosity and No Emission. Int. J. Spray Combust. Dyn. 2012, 4, 175–184. [Google Scholar] [CrossRef]
  24. Orooji, Y.; Javadi, M.; Karimi-Maleh, H.; Aghaie, A.Z.; Shayan, K.; Sanati, A.L.; Darabi, R. Numerical and Experimental Investigation of Natural Gas Injection Effects On Nox Reburning at the Rotary Cement Kiln Exhaust. Process Saf. Environ. Prot. 2021, 151, 290–298. [Google Scholar] [CrossRef]
  25. Daood, S.S.; Javed, M.T.; Gibbs, B.M.; Nimmo, W. Nox Control in Coal Combustion by Combining Biomass Co-Firing, Oxygen Enrichment and Sncr. Fuel 2013, 105, 283–292. [Google Scholar] [CrossRef]
  26. Su, S.; Xiang, J.; Sun, L.; Zhang, Z.X.; Sun, X.; Zheng, C.G. Numerical Simulation of Nitric Oxide Destruction by Gaseous Fuel Reburning in a Single-Burner Furnace. Proc. Combust. Instig. 2007, 31, 2795–2803. [Google Scholar] [CrossRef]
  27. Gomez, M.A.; Porteiro, J.; de la Cuesta, D.; Patino, D.; Miguez, J.L. Numerical Simulation of the Combustion Process of a Pellet-Drop-Feed Boiler. Fuel 2016, 184, 987–999. [Google Scholar] [CrossRef]
  28. Chernetskiy, M.Y.; Dekterev, A.A. Mathematical Model for Heat Transfer and Combustion in a Pulverized Coal Flame. Combust. Explos. Shock. Waves 2011, 47, 280–288. [Google Scholar] [CrossRef]
  29. Zhang, J.L.; Wang, G.W.; Shao, J.G.; Chen, Y.X.; Yang, T.J. Pulverized Coal Combustion of Nitrogen Free Blast Furnace. J. Iron Steel Res. Int. 2013, 20, 1–5. [Google Scholar] [CrossRef]
  30. Kobayashi, H.; Howard, J.B.; Sarofim, A.F. Coal Devolatilization at High Temperatures. Symp. Int. Combust. 1977, 16, 411–425. [Google Scholar] [CrossRef]
  31. Wei, H.G.; Luo, Y.Q. A Study On the Kinetics of Thermal-Decomposition of Caco3. J. Therm. Anal. 1995, 45, 303–310. [Google Scholar] [CrossRef]
  32. Williams, A.; Pourkashanian, M.; Bysh, P.; Norman, J. Modelling of Coal Combustion in Low-Nox P.F. Flames. Fuel 1994, 73, 1006–1019. [Google Scholar] [CrossRef]
  33. Brouwer, J.; Heap, M.P.; Pershing, D.W.; Smith, P.J. A Model for Prediction of Selective Noncatalytic Reduction of Nitrogen Oxides by Ammonia, Urea, and Cyanuric Acid with Mixing Limitations in the Presence of Co. Symp. Int. Combust. 1996, 26, 2117–2124. [Google Scholar] [CrossRef]
  34. Javed, M.T.; Irfan, N.; Gibbs, B.M. Control of Combustion-Generated Nitrogen Oxides by Selective Non-Catalytic Reduction. J. Environ. Manag. 2007, 83, 251–289. [Google Scholar] [CrossRef] [PubMed]
  35. Bowman, C.T. Chemistry of Gaseous Pollutant Formation and Destruction; John Wiley & Sons: Hoboken, NJ, USA, 1991; Volume 250. [Google Scholar]
  36. Taniguchi, M.; Kamikawa, Y.; Okazaki, T.; Yamamoto, K.; Orita, H. A Role of Hydrocarbon Reaction for Nox Formation and Reduction in Fuel-Rich Pulverized Coal Combustion. Combust. Flame 2010, 157, 1456–1466. [Google Scholar] [CrossRef]
  37. Li, S.; Wei, X.; Guo, X. Effect of H2O Vapor On No Reduction by Co: Experimental and Kinetic Modeling Study. Energy Fuels 2012, 26, 4277–4283. [Google Scholar] [CrossRef]
  38. Zhang, L.; Wei, X.; Zhang, Z.; Li, S. Modeling De-No X by Injection Ammonia in High Temperature Zone of Cement Precalciner. J. Therm. Sci. 2021, 30, 636–643. [Google Scholar] [CrossRef]
Figure 1. Structural model (a) and grid (b) of the precalciner.
Processes 11 01377 g001
Figure 2. Velocity vector in the precalciner (a) X = 0, (b) Y = 0.
Processes 11 01377 g002
Figure 3. Temperature contour in precalciner (a) X = 0, (b) Y = 0.
Processes 11 01377 g003
Figure 4. Temperature contours in the precalciner at different natural gas injection rates: (a) CH4-0%, (b) CH4-2.5%, (c) CH4-5%,(d) CH4-7.5%,(e) CH4-10%.
Processes 11 01377 g004
Figure 5. Distribution of components in the precalciner: (a) CaCO3, (b) CaO, (c) CO2, (d) O2.
Processes 11 01377 g005
Figure 6. Mass fraction of CaCO3 and CaO in the precalciner at different injection rates of natural gas (a) CaCO3, (b) CaO.
Processes 11 01377 g006
Figure 7. Concentration of NOx in the precalciner (a) X = 0, (b) Y = 0.
Processes 11 01377 g007
Figure 8. Variation of NOx along the height in the precalciner after SNCR denitrification at different injection heights.
Processes 11 01377 g008
Figure 9. NOx concentration distribution in the precalciner under different NSRs: (a) NSR-0, (b) NSR-1, (c) NSR-1.2, (d) NSR-1.4, (e) NSR-1.6, (f) NSR-1.8, (g) NSR-2.
Processes 11 01377 g009
Figure 10. Variation of NOx concentration along the height in precalciner with different NSRs.
Processes 11 01377 g010
Figure 11. NOx concentration distribution in the precalciner after natural gas injection (a) CH4-0%, (b) CH4-2.5%, (c) CH4-5%, (d) CH4-7.5%, (e) CH4-10%.
Processes 11 01377 g011
Figure 12. Variation of NOx concentration along the height in the precalciner after natural gas injection.
Processes 11 01377 g012
Figure 13. Variation of NOx concentration along the height in the precalciner during combined denitrification.
Processes 11 01377 g013
Table 1. Proximate analysis and elemental analysis of the data of coal.
Proximate Analysis/wt%Elemental Analysis/wt%Qnet,ar/MJ·kg−1
MdafVdafAdafFCdafCdafHdafOdafNdafSdaf
1.8728.4814.7354.9270.19.7817.261.791.0724.61
Table 2. Raw material compositions/wt%.
Burning LossSiO2Al2O3Fe2O3CaOMgO
35.3712.273.742.6343.960.17
Table 3. Comparison of the temperature at the outlet of the precalciner with different mesh quantity.
Mesh Quantity663,748875,8221,018,7041,209,2641,465,940
Temperature(K)1251.481265.961269.181271.241277.97
Table 4. Comparison of simulated and measured data.
Temperature (K)CO2 (Mass Fraction)O2 (Mass Fraction)NOx (ppm)
Predicted value126922.09%1.32%574.1
Measured value121722.6%1.36%551
Error4.3%2.26%2.94%4.2%
Table 5. Decomposition rate of CaCO3 at different natural gas injection amounts.
Natural Gas Injection VolumeCH4-0%CH4-2.5%CH4-5%CH4-7.5%CH4-10%
Decomposition rate92.72%93.71%94.20%94.65%95.02%
Disclaimer/Publisher’s Note: The statements, opinions and data contained in all publications are solely those of the individual author(s) and contributor(s) and not of MDPI and/or the editor(s). MDPI and/or the editor(s) disclaim responsibility for any injury to people or property resulting from any ideas, methods, instructions or products referred to in the content.

