
Study on Flow Characteristics of Hydraulic Suction of Seabed Ore Particles

Abstract
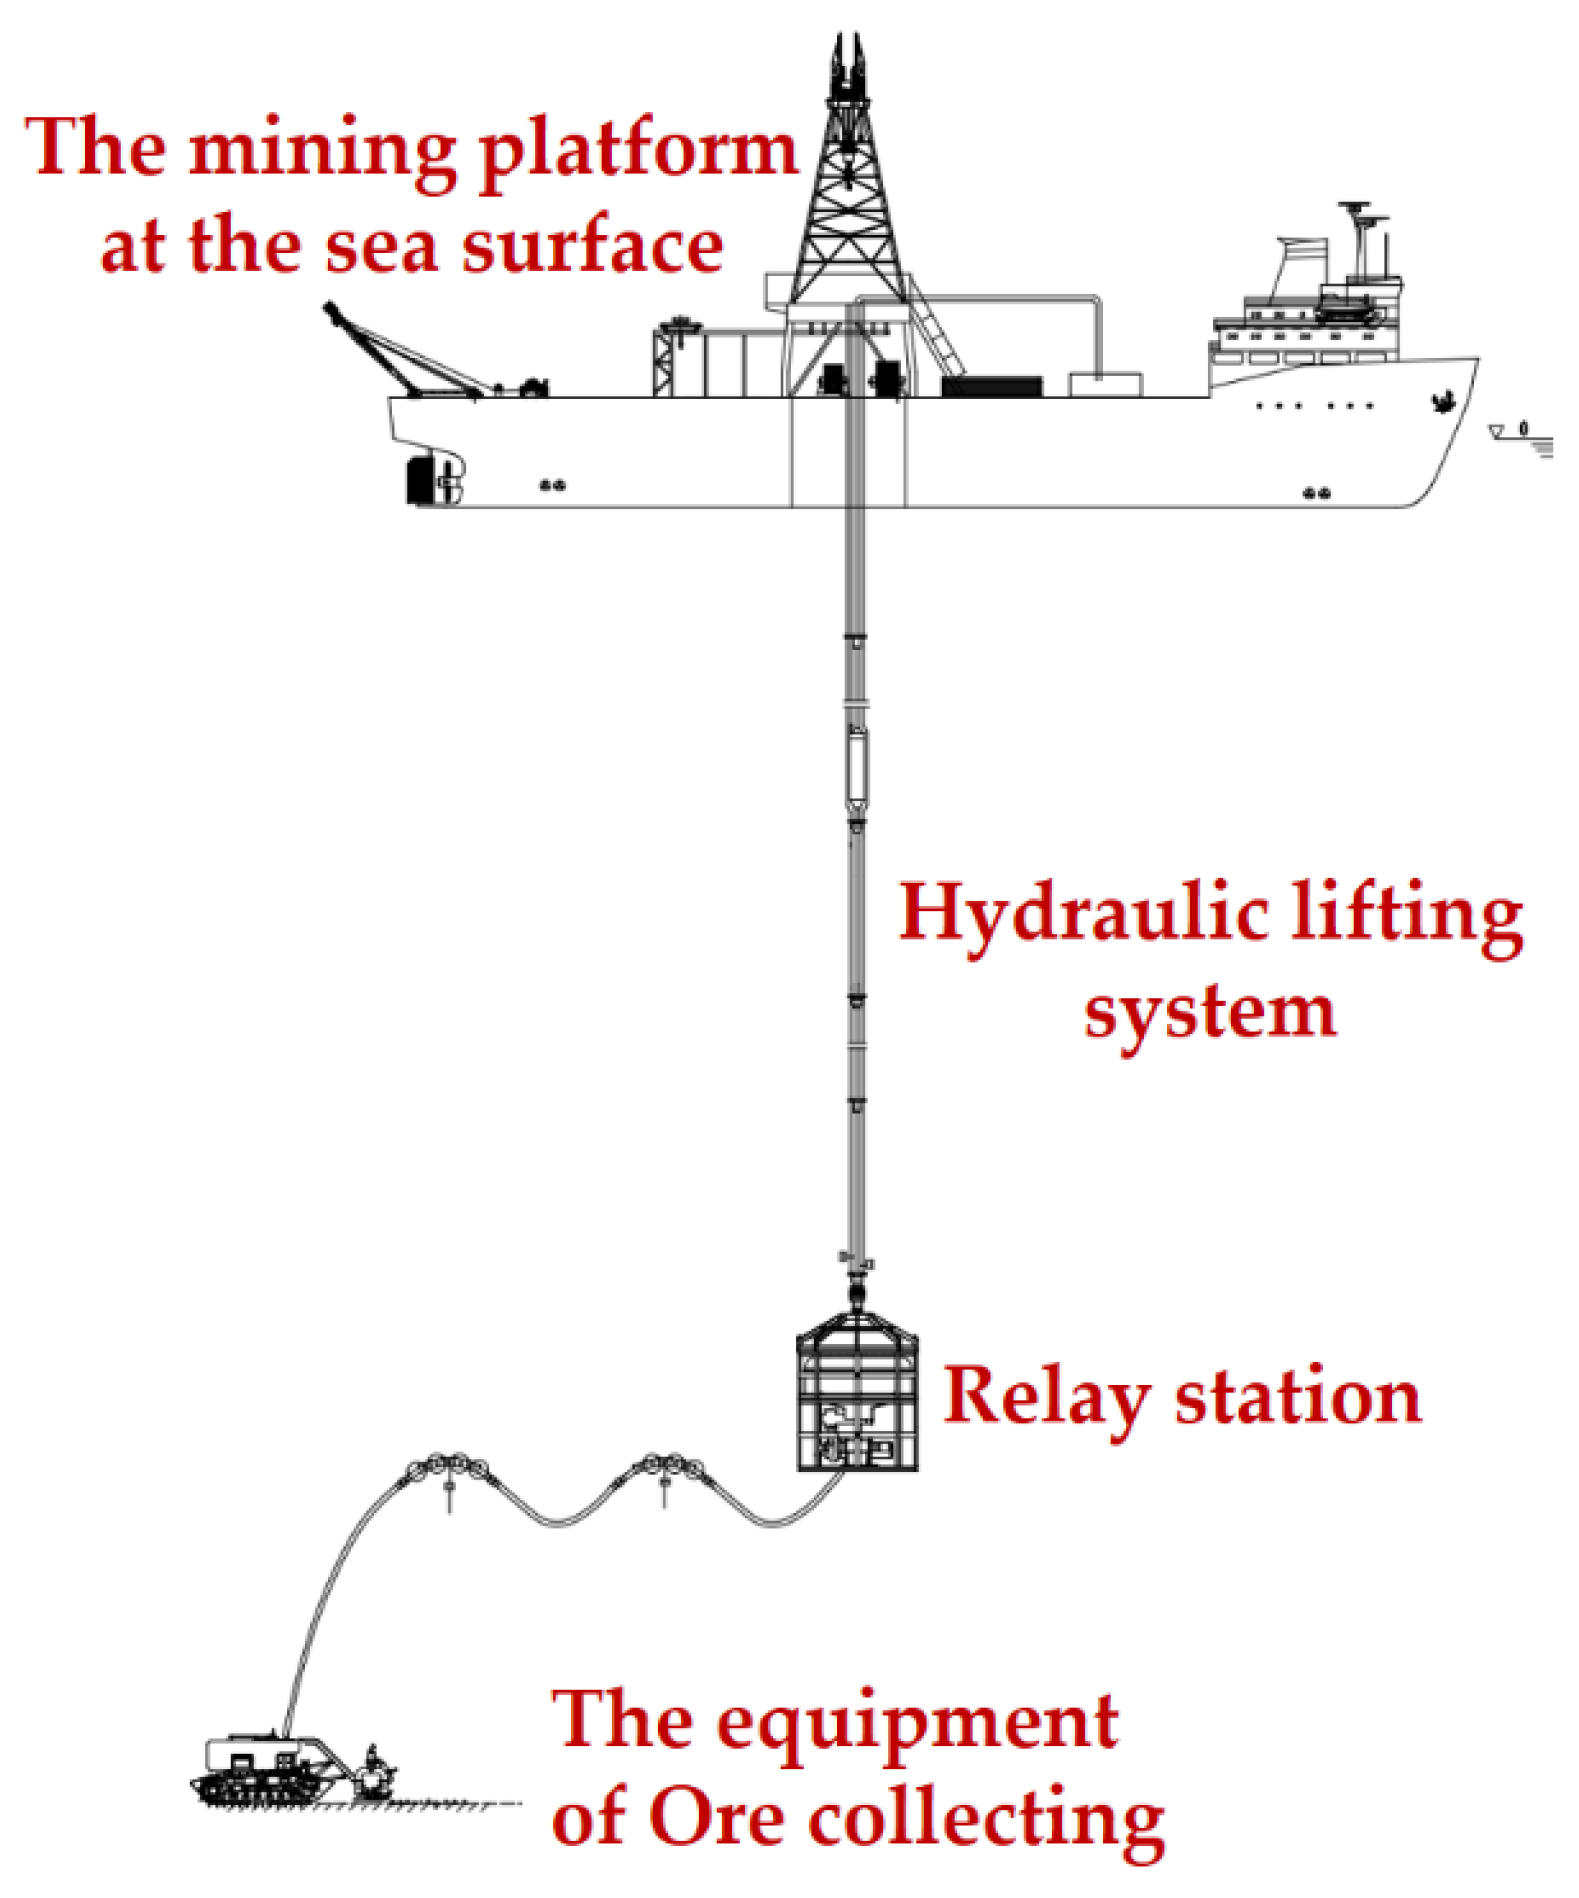
:1. Introduction
2. Materials and Methods
2.1. Mathematical Model
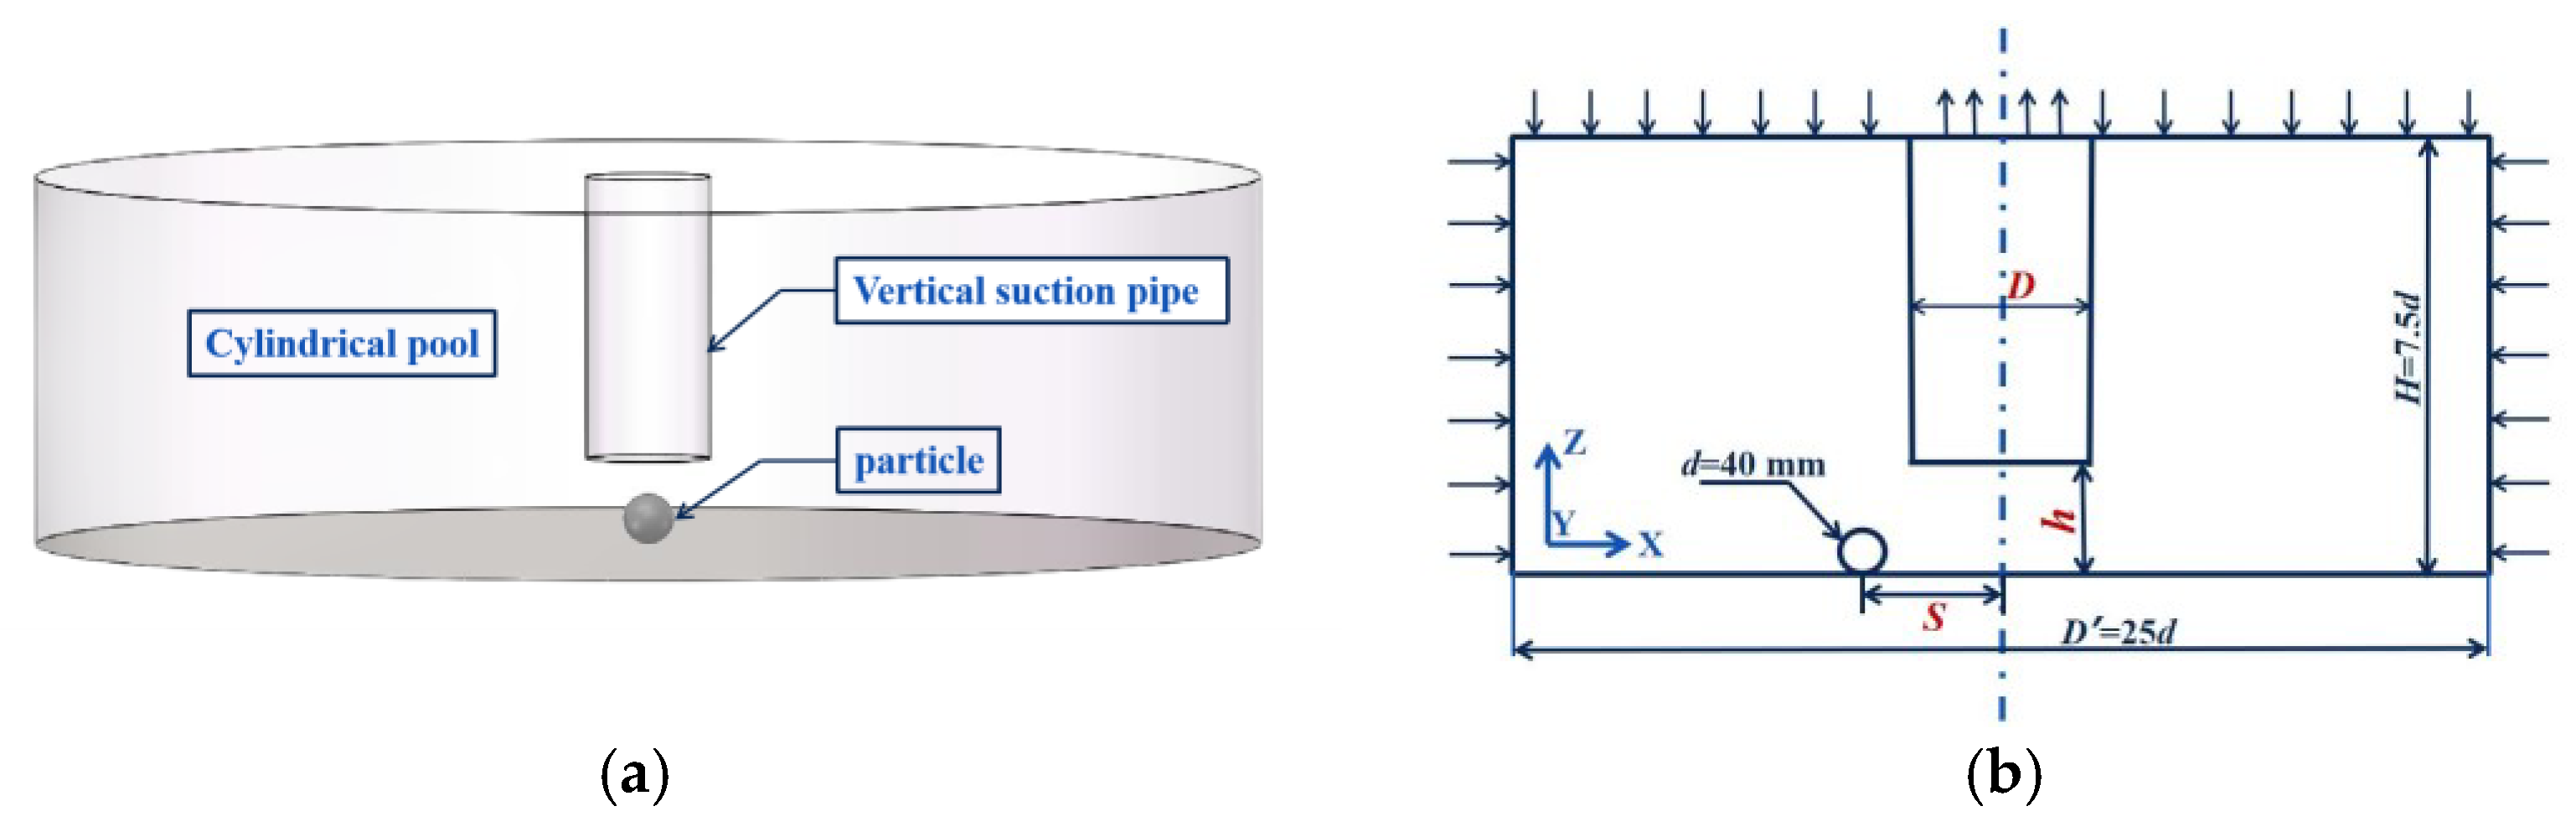
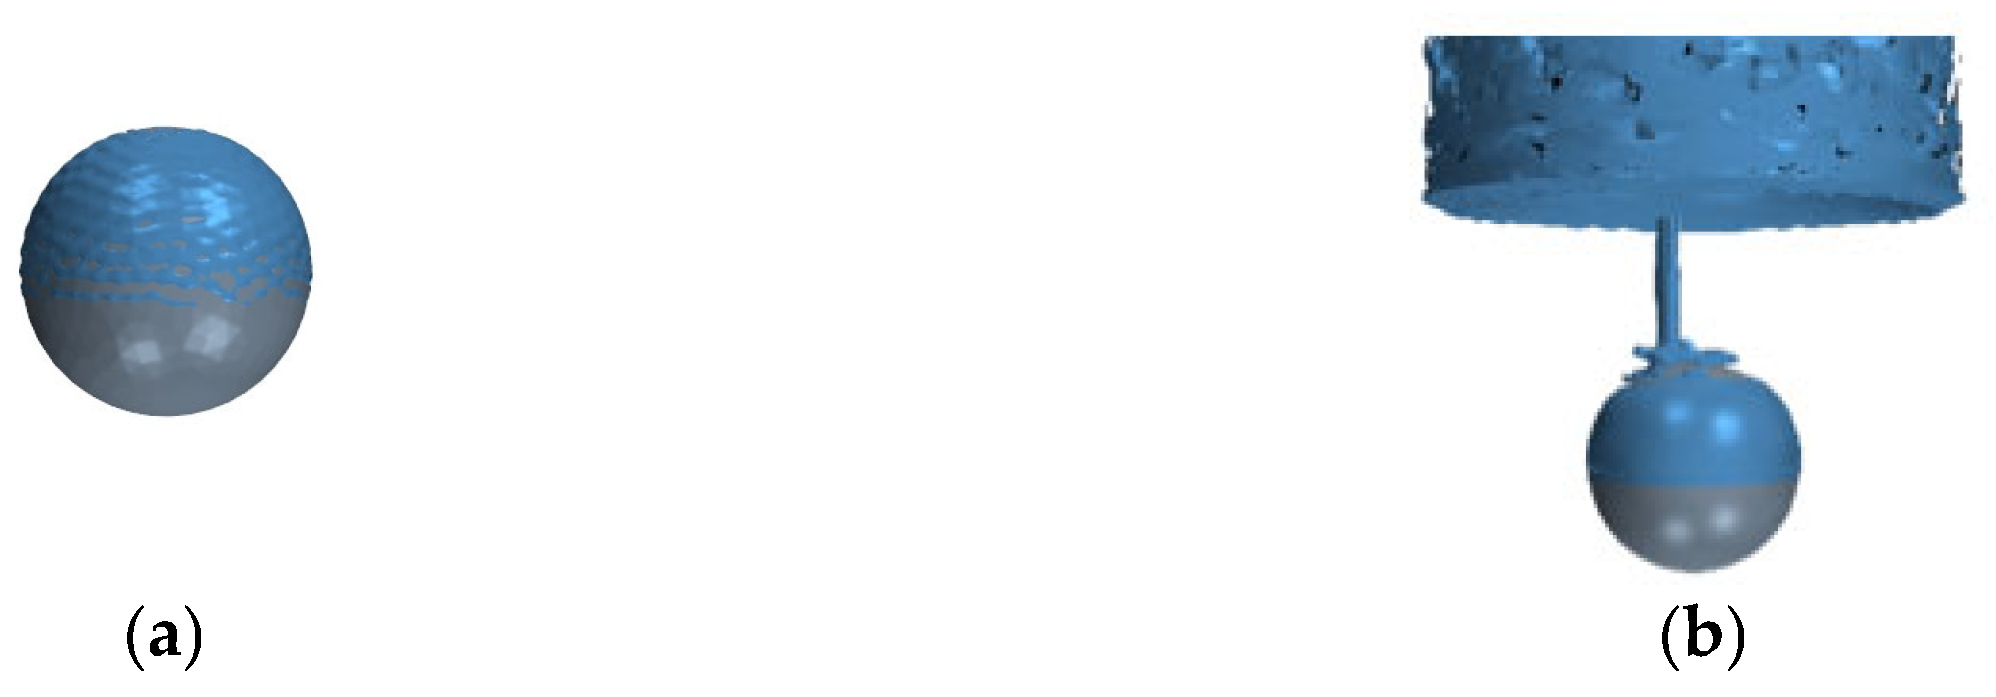
2.2. Physical Modeling and Meshing
2.3. Boundary Conditions and Basic Assumptions
2.4. Algorithm Verification of Model
3. Results and Discussion
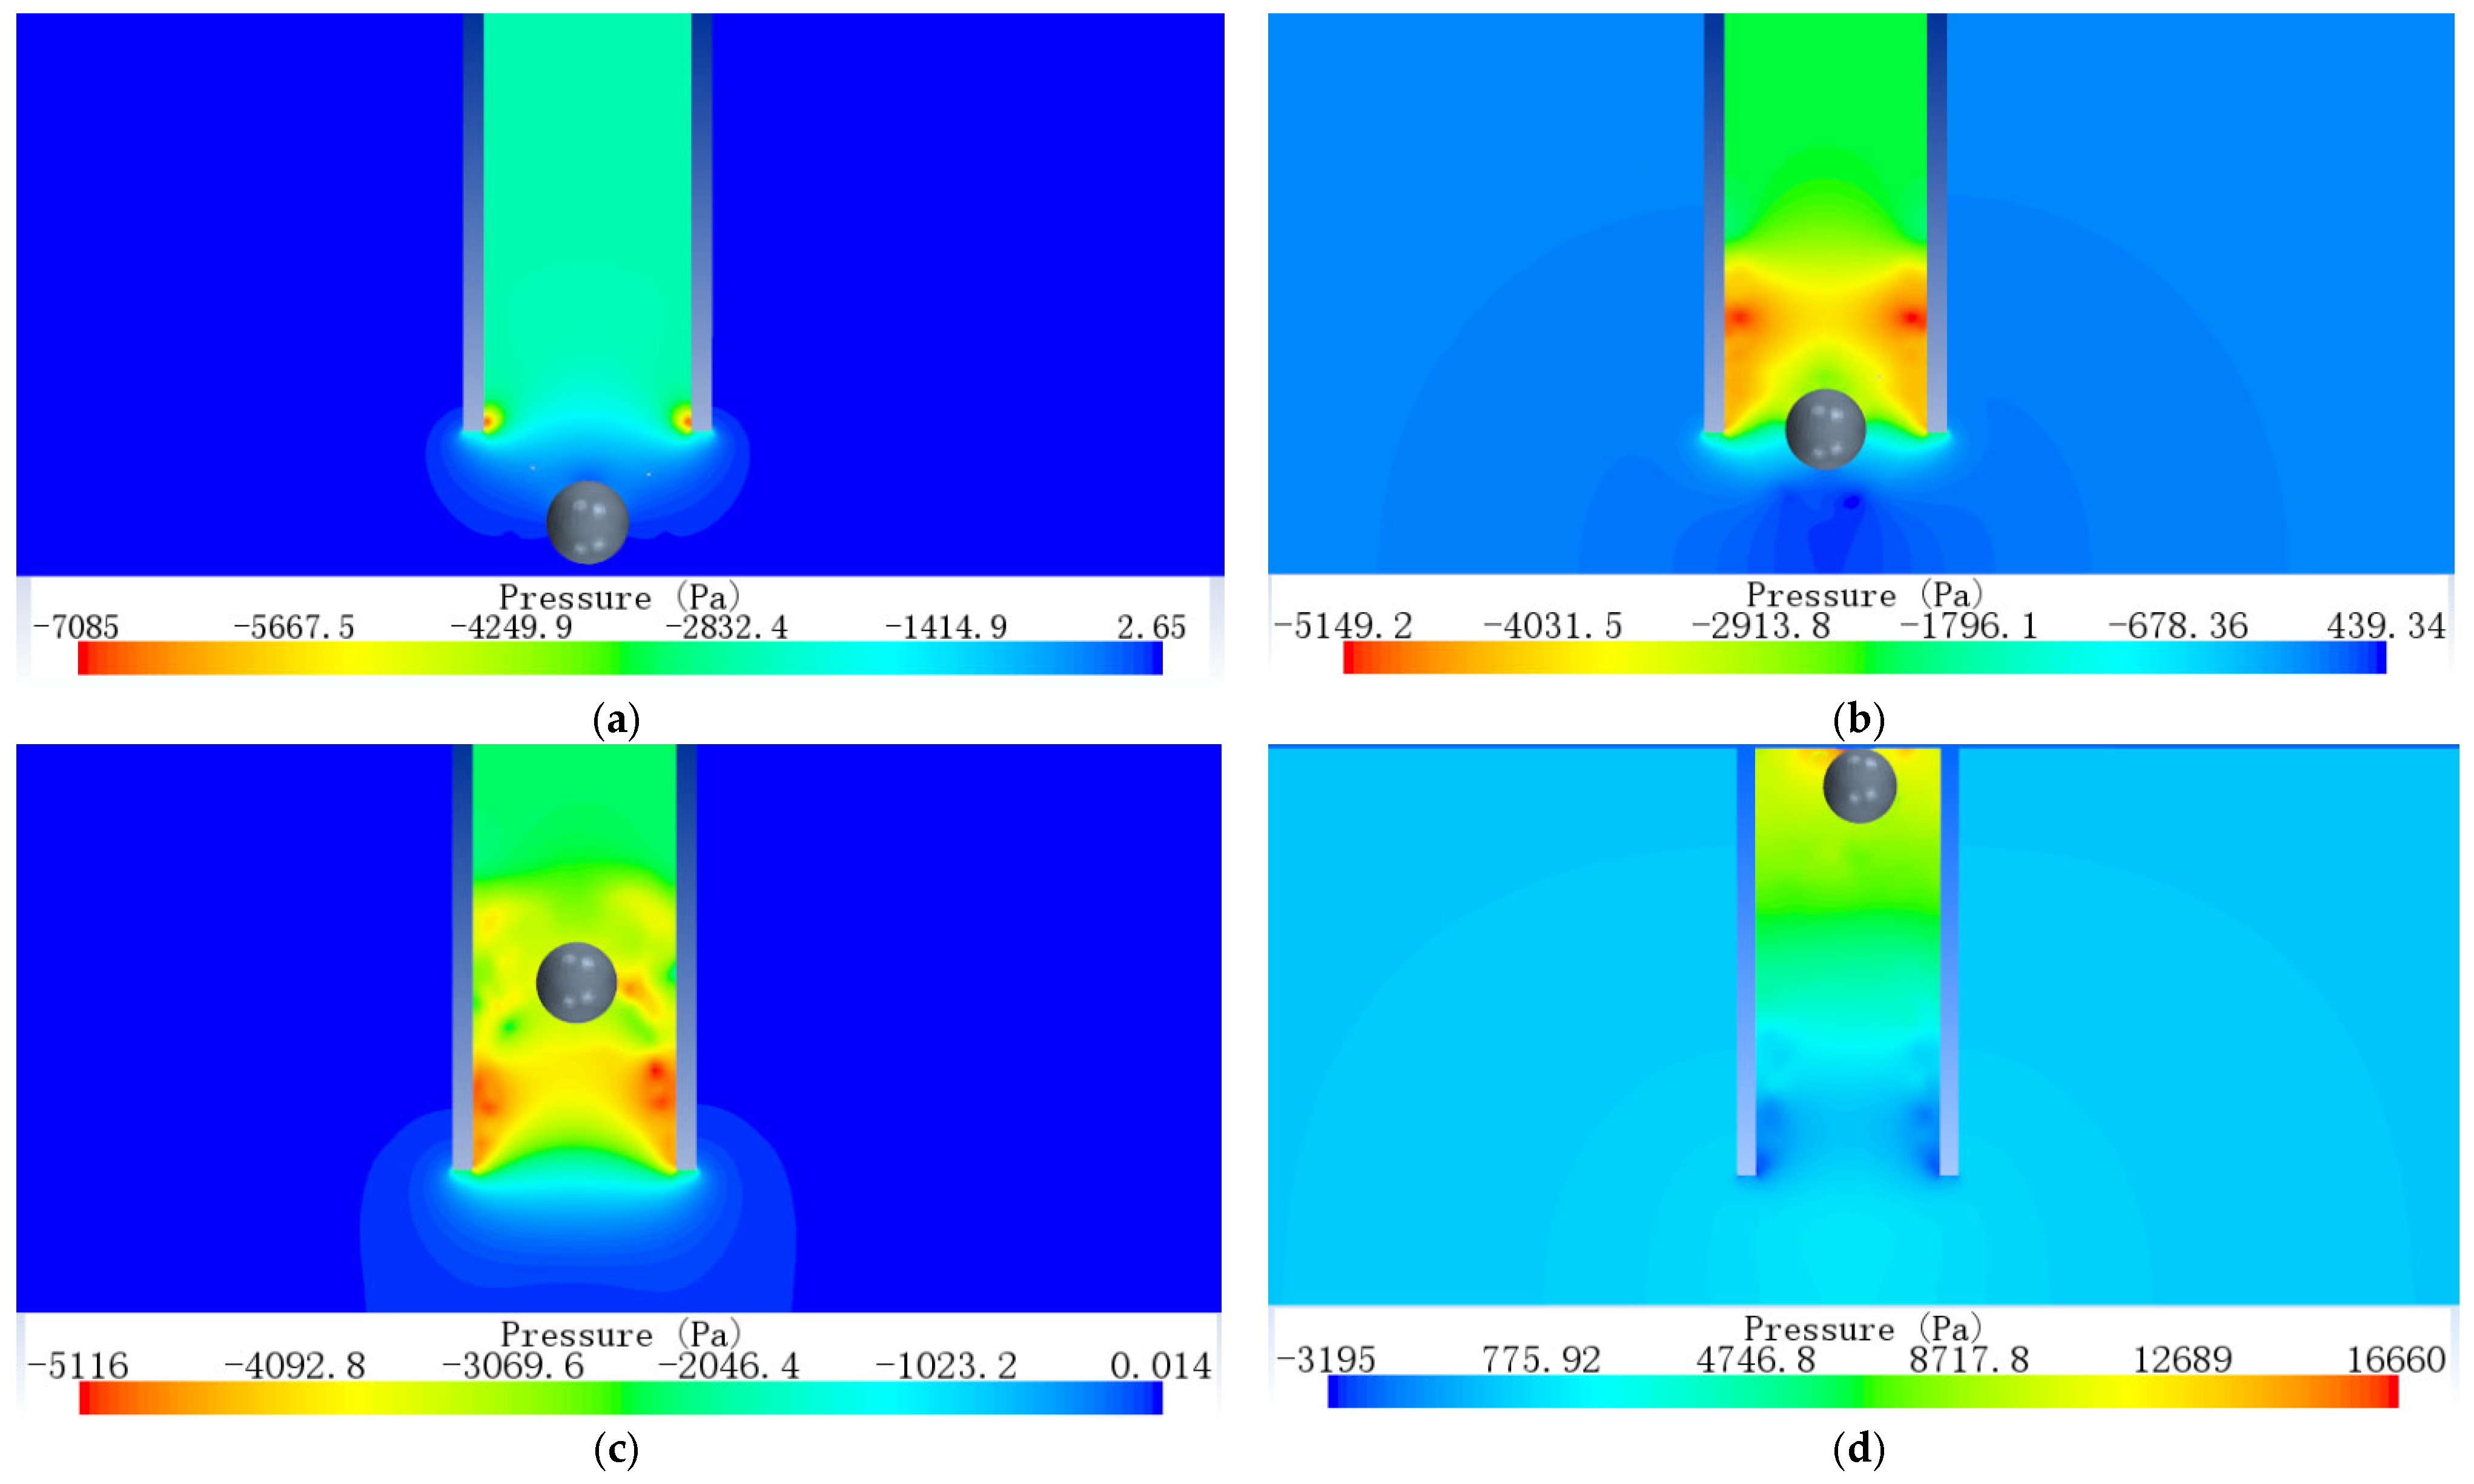
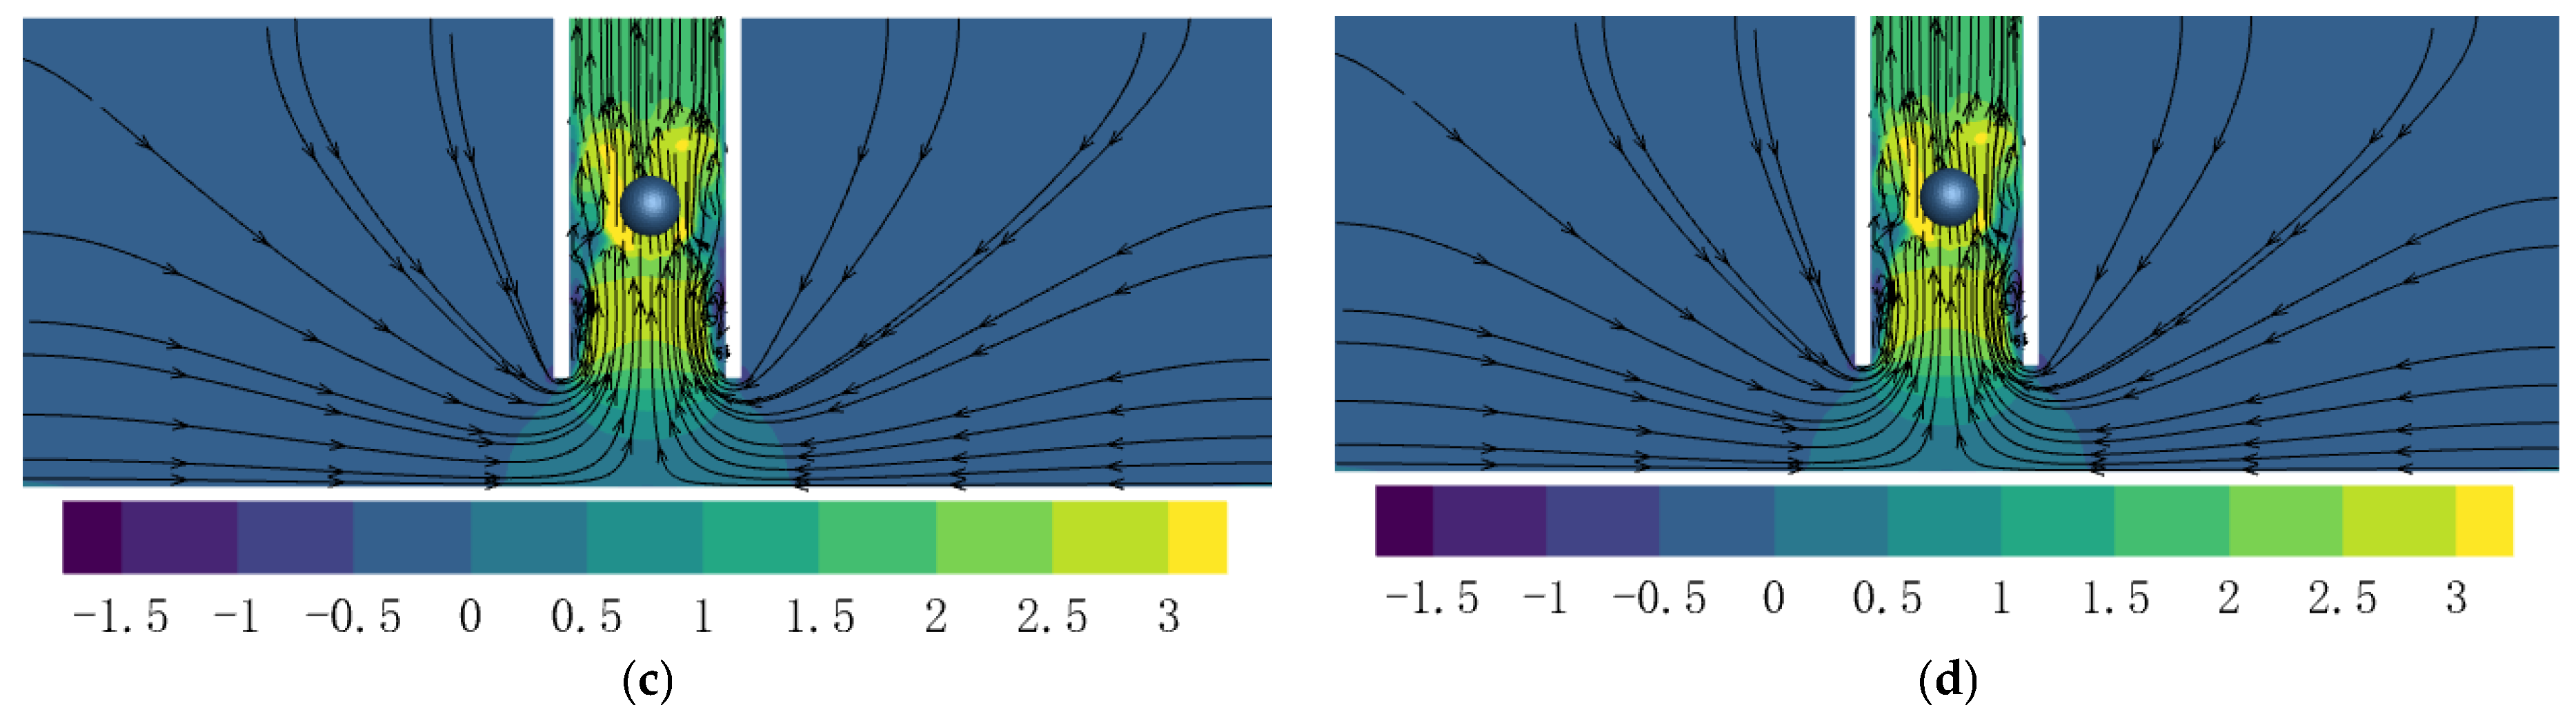
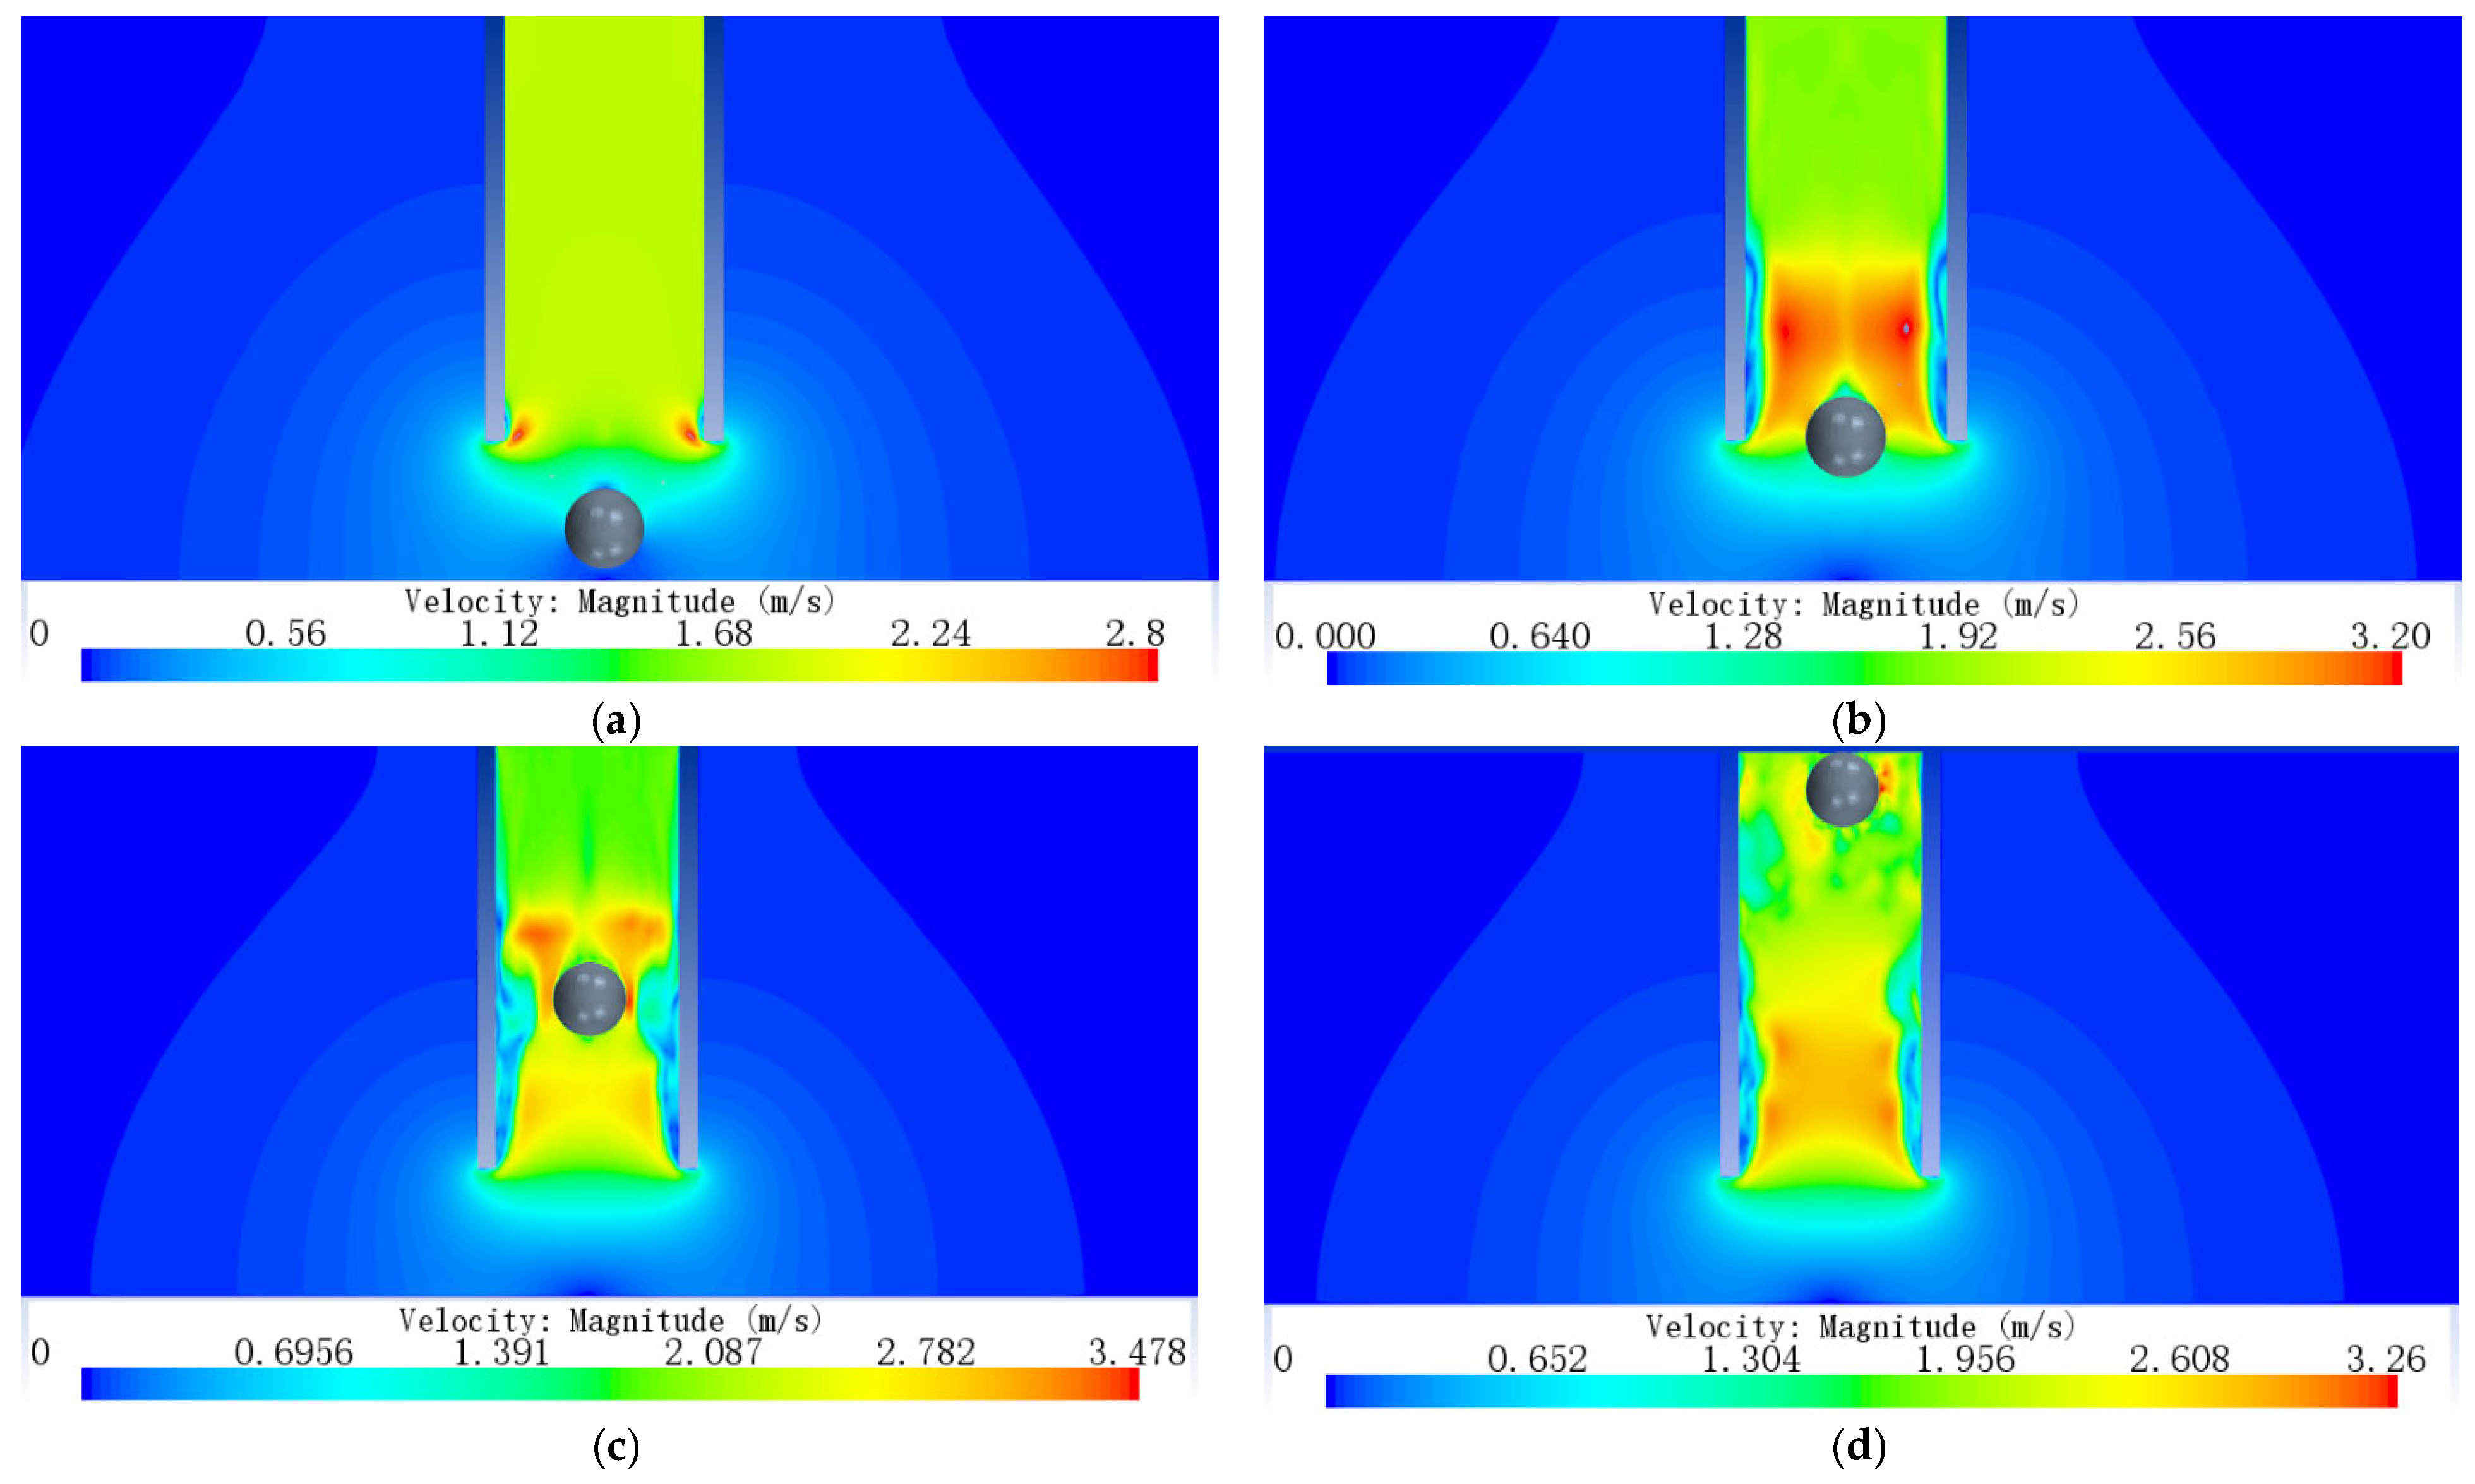
3.1. Flow Field Characteristic Analysis
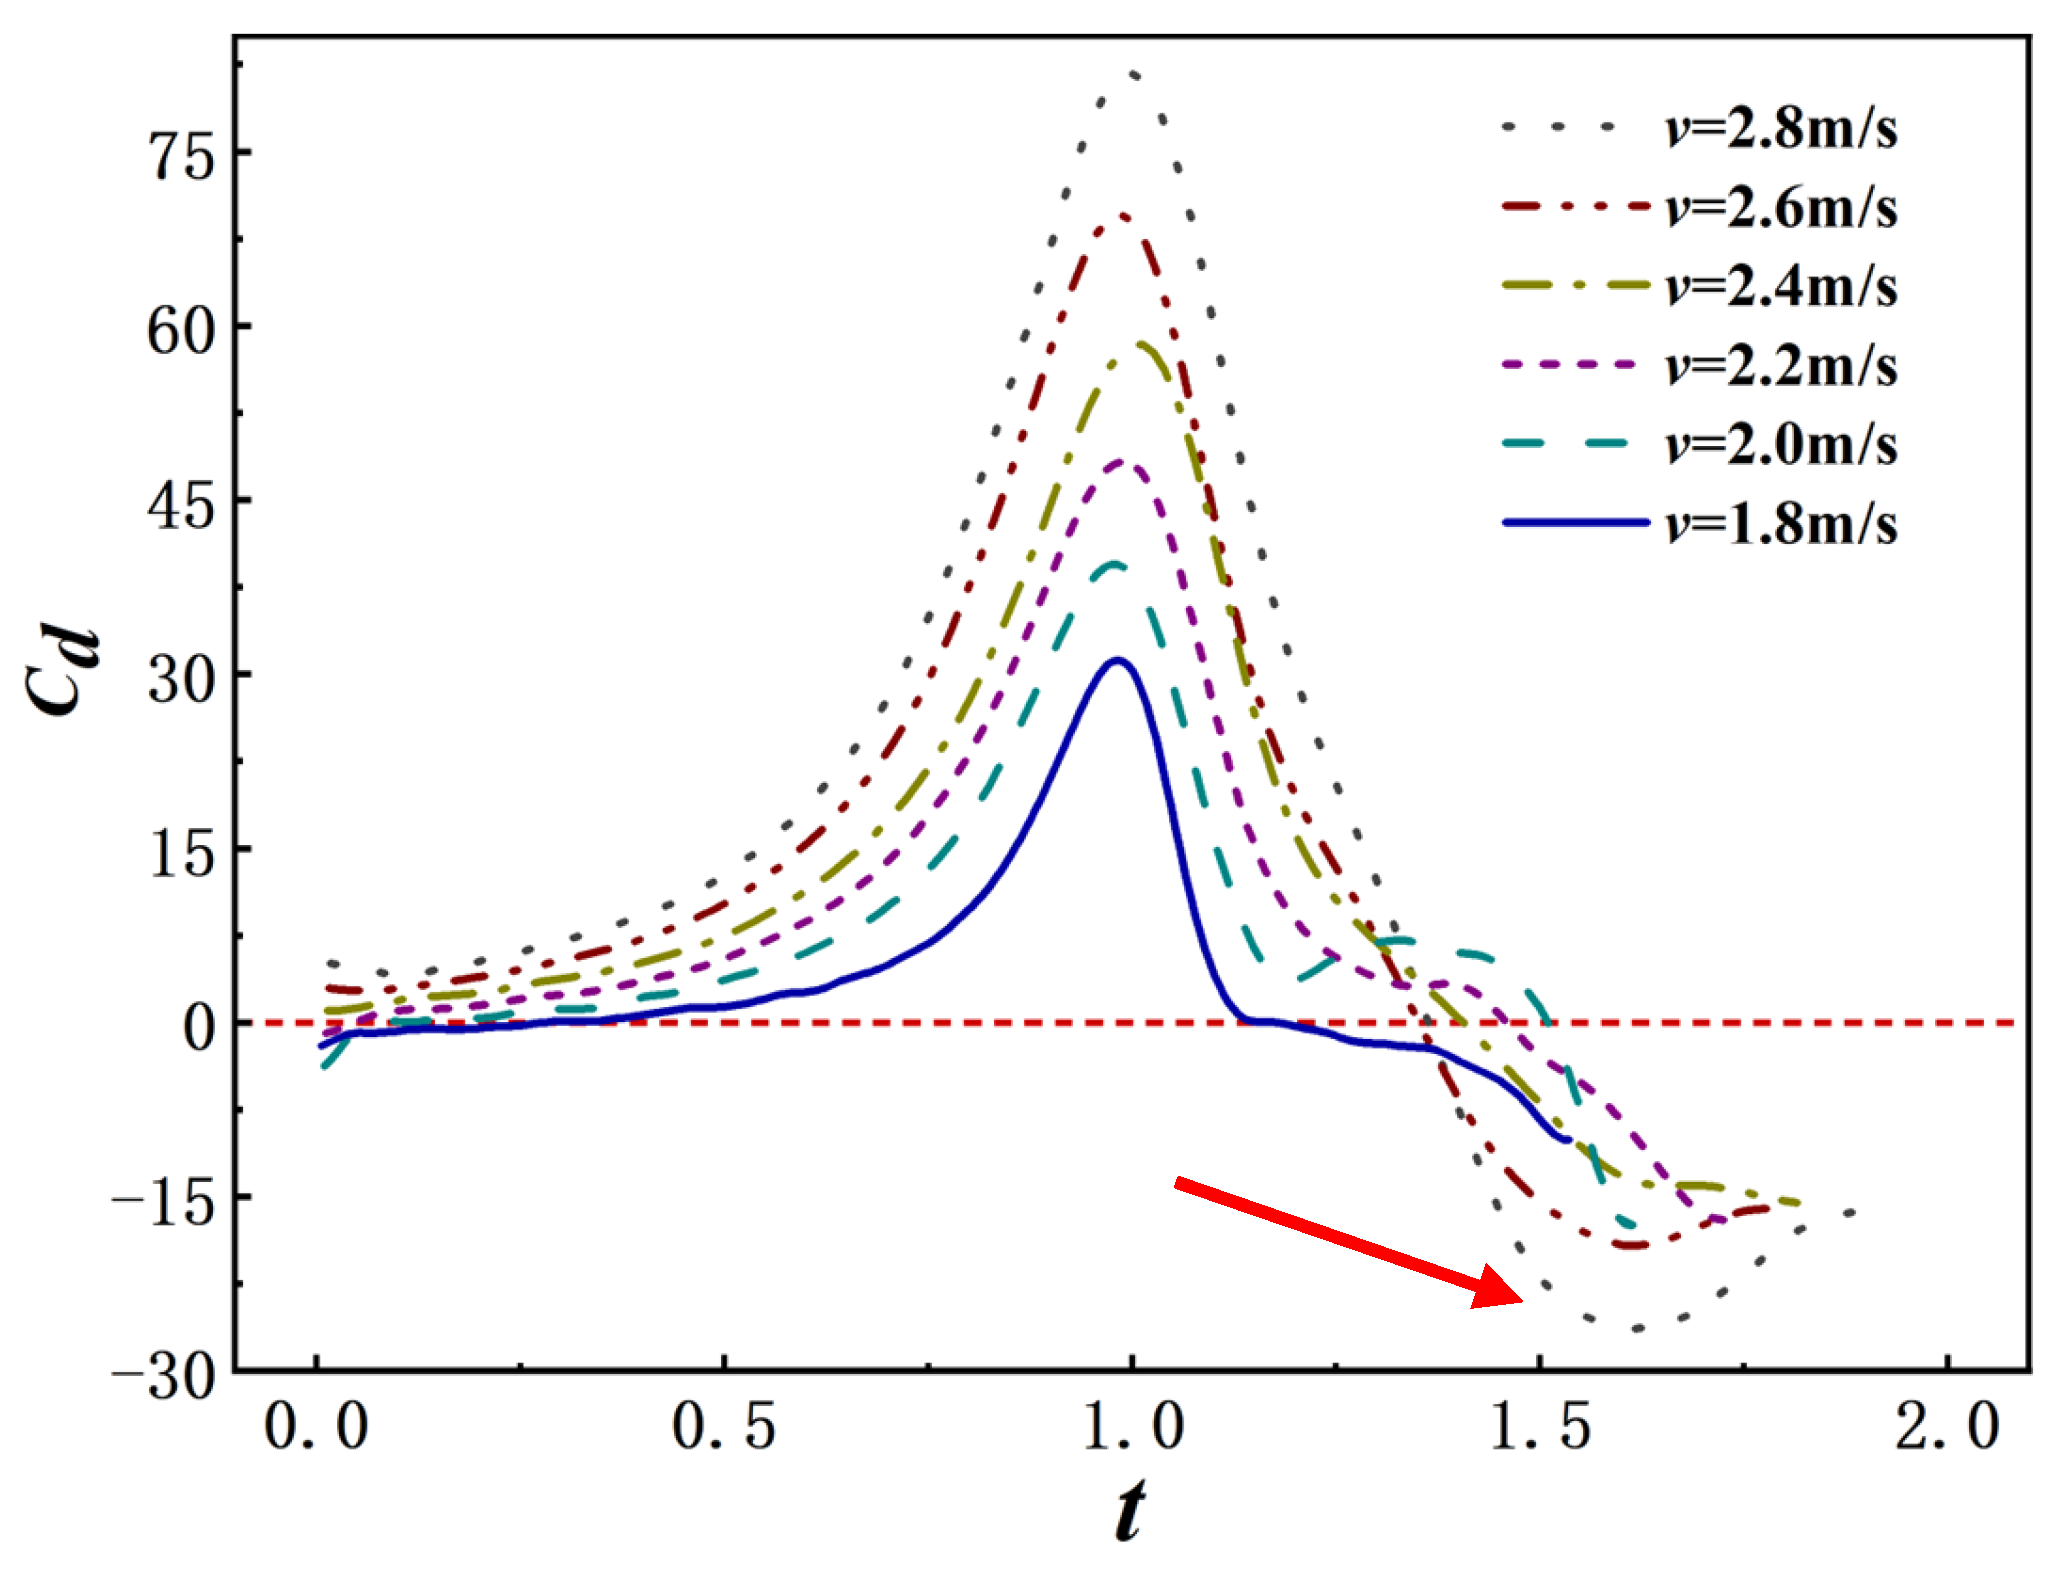
3.2. Analysis of Particle Motion Characteristics
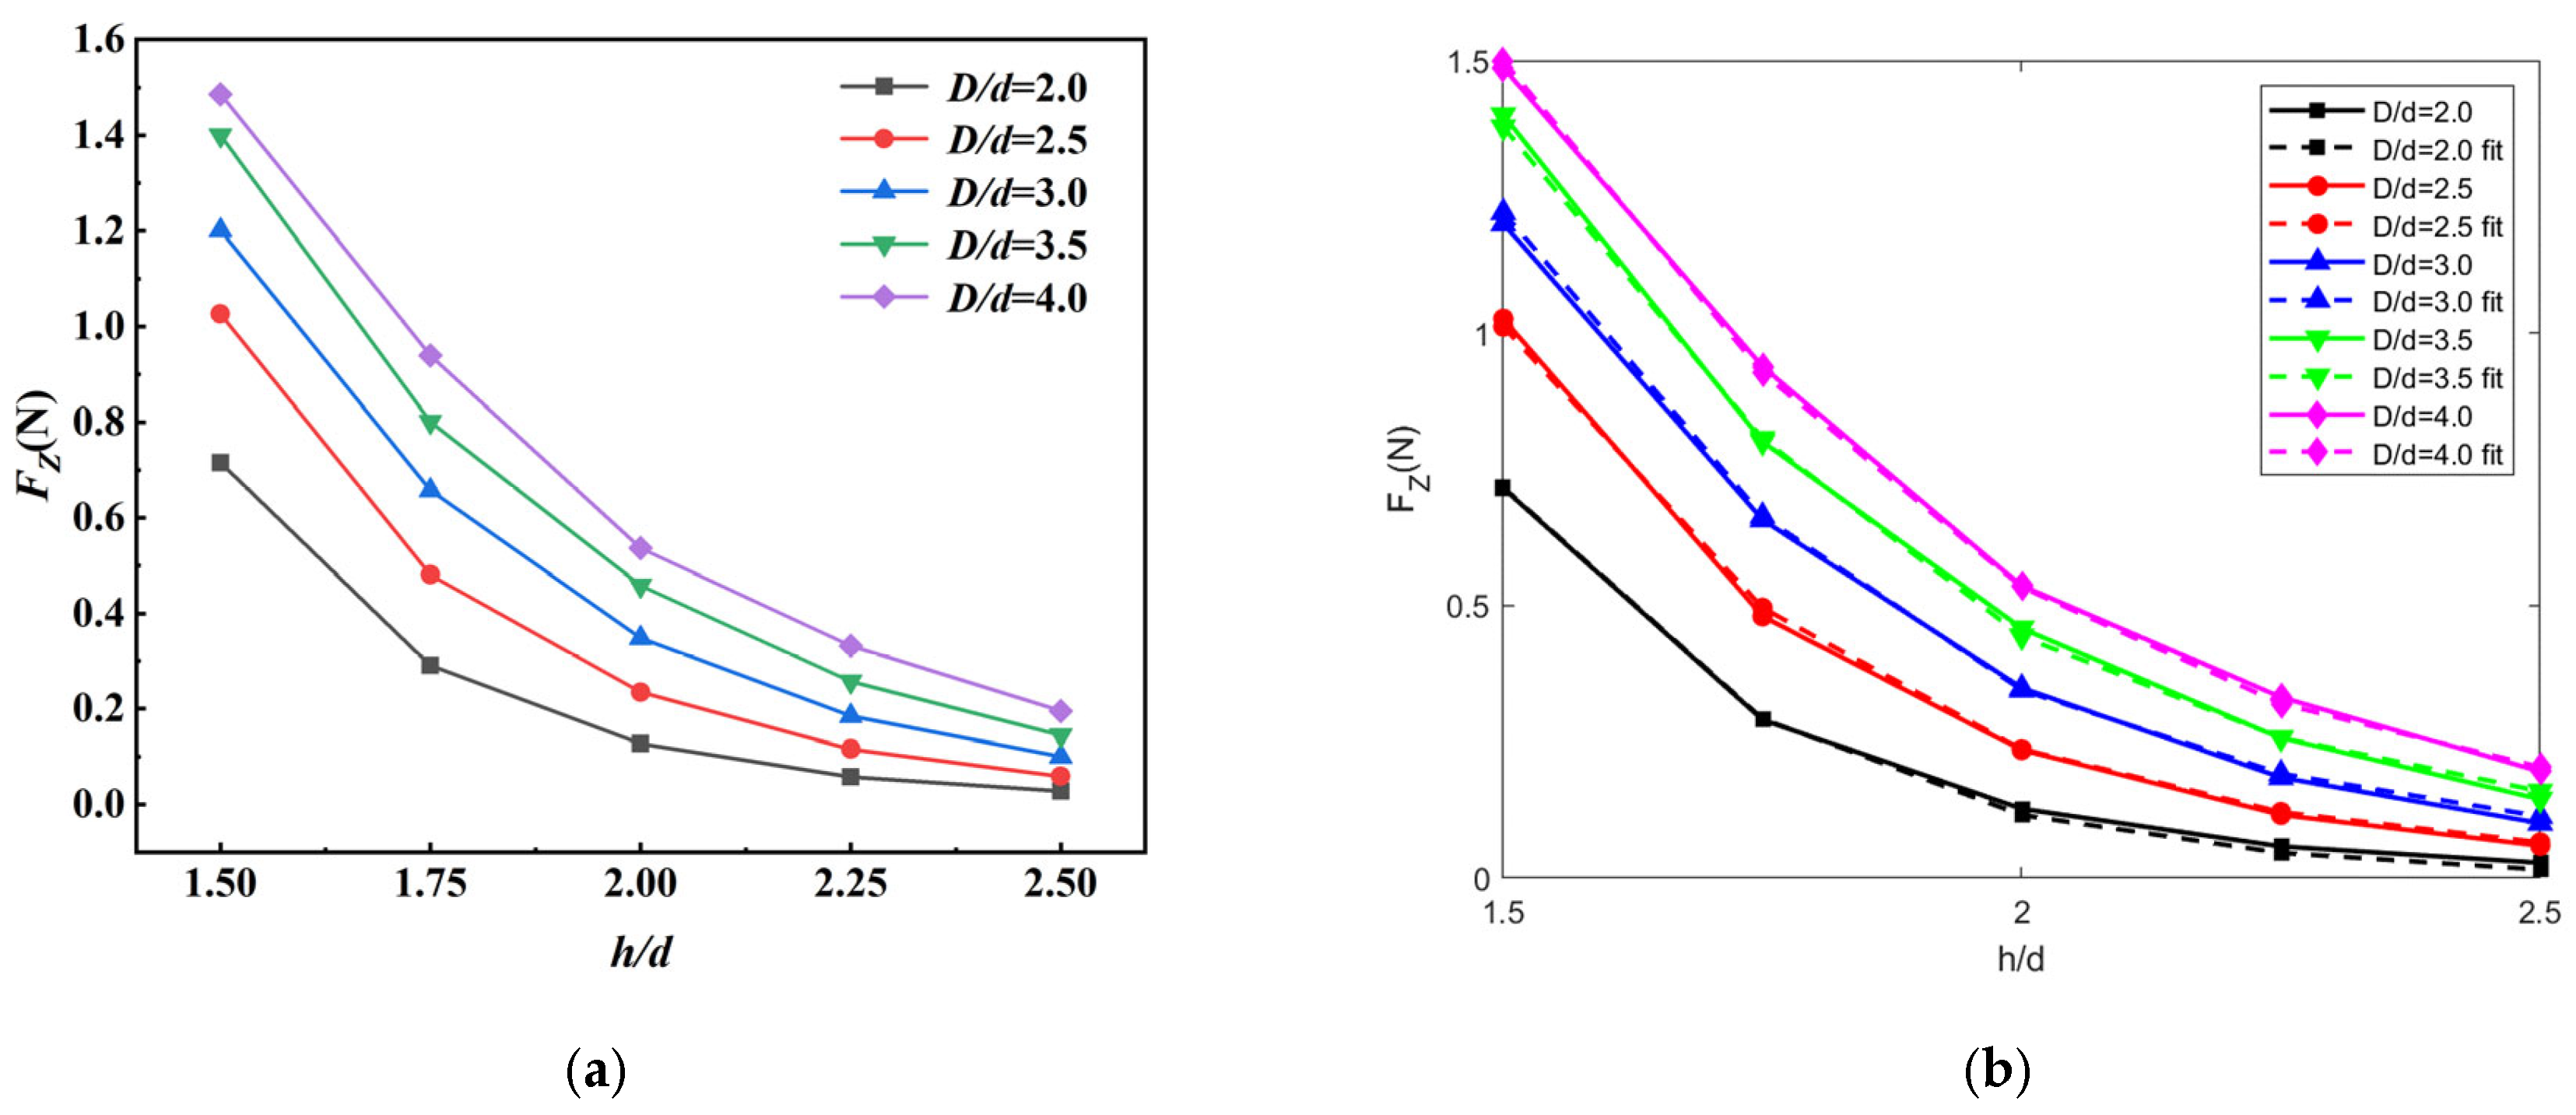
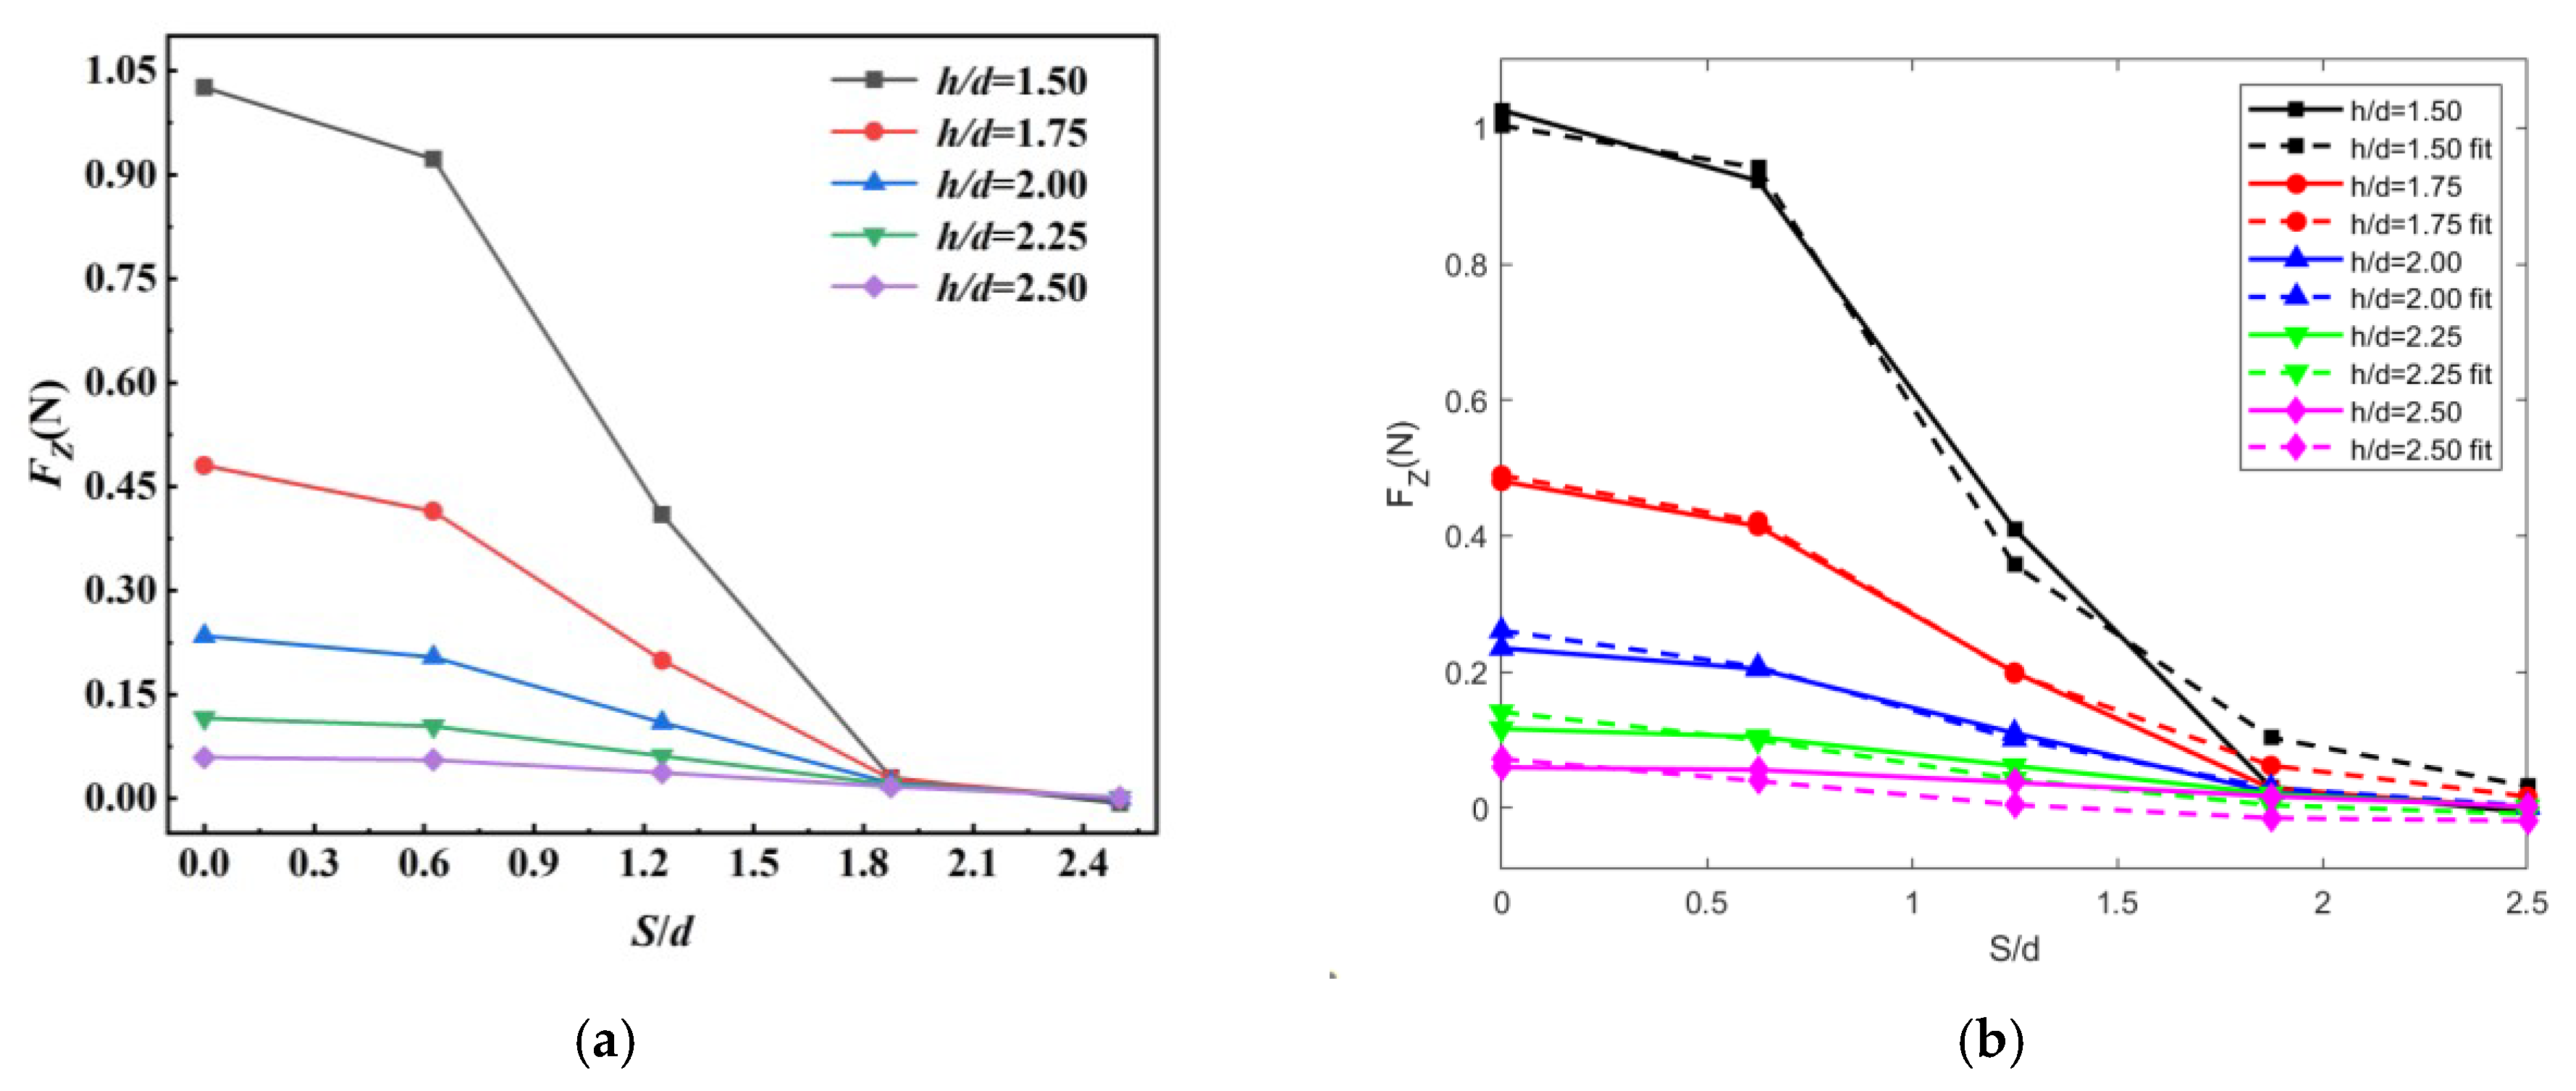
3.3. Vertical Force Analysis of Particles
4. Conclusions
Author Contributions
Funding
Data Availability Statement
Conflicts of Interest
References
- Beyond mining. Nat. Geosci. 2011, 4, 653. [CrossRef]
- Hein, J.R.; Mizell, K.; Koschinsky, A.; Conrad, T.A. Deep-ocean mineral deposits as a source of critical metals for high- and green-technology applications: Comparison with land-based resources. Ore Geol. Rev. 2013, 51, 1–14. [Google Scholar] [CrossRef]
- Mudd, G.M. The Environmental sustainability of mining in Australia: Key mega-trends and looming constraints. Resour. Policy 2009, 35, 98–115. [Google Scholar] [CrossRef]
- Lusty, P.A.; Murton, B.J. Deep-Ocean Mineral Deposits: Metal Resources and Windows into Earth Processes. Elements 2018, 14, 301–306. [Google Scholar] [CrossRef]
- Abramowski, T.; Urbanek, M.; Baláž, P. Structural Economic Assessment of Polymetallic Nodules Mining Project with Updates to Present Market Conditions. Minerals 2021, 11, 311. [Google Scholar] [CrossRef]
- Jones, D.O.B.; Simon-Lledó, E.; Amon, D.J.; Bett, B.J.; Caulle, C.; Clément, L.; Connelly, D.P.; Dahlgren, T.G.; Durden, J.M.; Drazen, J.C.; et al. Environment, ecology, and potential effectiveness of an area protected from deep-sea mining (Clarion Clipperton Zone, abyssal Pacific). Prog. Oceanogr. 2021, 197, 102653. [Google Scholar] [CrossRef]
- Maciąg, Ł.; Harff, J. Application of multivariate geostatistics for local-scale lithological mapping—Case study of pelagic surface sediments from the Clarion-Clipperton Fracture Zone, north-eastern equatorial Pacific (Interoceanmetal claim area). Comput. Geosci. 2020, 139, 104474. [Google Scholar] [CrossRef]
- Petersen, S.; Krätschell, A.; Augustin, N.; Jamieson, J.; Hein, J.R.; Hannington, M.D. News from the seabed—Geological characteristics and resource potential of deep-sea mineral resources. Mar. Policy 2016, 70, 175–187. [Google Scholar] [CrossRef]
- Moore, G.W. Handbook of Marine Mineral Deposits. Eos Trans. Am. Geophys. Union 2000, 81, 411–413. [Google Scholar] [CrossRef]
- Hein, J.R.; Conrad, T.A.; Dunham, R.E. Seamount Characteristics and Mine-Site Model Applied to Exploration- and Mining-Lease-Block Selection for Cobalt-Rich Ferromanganese Crusts. Mar. Georesources Geotechnol. 2009, 27, 160–176. [Google Scholar] [CrossRef]
- Mero, J.L. section of geological sciences: Mineral resources of the sea. Trans. N. Y. Acad. Sci. 1964, 26, 525–544. [Google Scholar] [CrossRef]
- Oebius, H.U.; Becker, H.J.; Rolinski, S.; Jankowski, J.A. Parametrization and evaluation of marine environmental impacts produced by deep-sea manganese nodule mining. Deep. Sea Res. Part II Top. Stud. Oceanogr. 2001, 48, 3453–3467. [Google Scholar] [CrossRef]
- Chung, J.S. Advances in Manganese-Nodule Mining Technology. Mar. Technol. Soc. J. 1985, 19, 39–44. [Google Scholar]
- Herrouin, G.; Lenoble, J.P.; Charles, C.; Mauviel, F.; Bernard, J.; Taine, B. A manganese nodule industrial venture would be profitable: Summary of a 4-year study in France. In Proceedings of the 21st Annual Offshore Technology Conference, OTC 1989, Houston, TX, USA, 1–4 May 1989; pp. 321–332. [Google Scholar]
- Zhao, S.N.; Liu, F. Research on deep sea mining technology in Germany. Met. Mines 1995, 6, 14–17. (In Chinese) [Google Scholar]
- Liu, L. Study on the Mechanical Characteristics of Solid-Liquid Two-Phase Flow by Hydraulic Lifting in Deep Sea Mining. Ph.D. Thesis, Shanghai Jiao Tong University, Shanghai, China, 2019. (In Chinese). [Google Scholar]
- Ma, W.; Zhang, K.; Du, Y.; Liu, X.; Shen, Y. Status of Sustainability Development of Deep-Sea Mining Activities. J. Mar. Sci. Eng. 2022, 10, 1508. [Google Scholar] [CrossRef]
- Alhaddad, S.; Helmons, R. Sediment Erosion Generated by a Coandă-Effect-Based Polymetallic-Nodule Collector. J. Mar. Sci. Eng. 2023, 11, 349. [Google Scholar] [CrossRef]
- Ziyu, Y.; Guocheng, Z.; Longfei, X.; Mingyue, L. Comparative Study on Collection Performance of Three Nodule Collection Methods in Seawater and Sediment-seawater Mixture. Appl. Ocean. Res. 2021, 110, 102606. [Google Scholar]
- Zhang, Y.Y.; Dai, Y.; Zhu, X. Numerical Investigation of Recommended Operating Parameters Considering Movement of Polymetallic Nodule Particles during Hydraulic Lifting of Deep-Sea Mining Pipeline. Sustainability 2023, 15, 4248. [Google Scholar] [CrossRef]
- Shih, T.-H.; Liou, W.W.; Shabbir, A.; Yang, Z.; Zhu, J. A new k-ϵ eddy viscosity model for high reynolds number turbulent flows. Comput. Fluids 1995, 24, 227–238. [Google Scholar] [CrossRef]
- Chen, Y.; Xiong, H.; Cheng, H.; Chen, Y. Experimental study on the incipient motion of a single spherical particle in hydraulic collecting. Zhongnan Daxue Xuebao (Ziran Kexue Ban) J. Cent. South Univ. (Sci. Technol.) 2019, 50, 2831–2839. [Google Scholar] [CrossRef]
- Zhao, G.; Xiao, L.; Lu, H.; Chen, Z. A case study of hydraulic collecting a single spherical particle. In Proceedings of the 27th International Ocean and Polar Engineering Conference, ISOPE 2017, San Francisco, CA, USA, 25–30 June 2017; pp. 30–38. [Google Scholar]
- Zhao, G.C.; Xiao, L.F.; Zhao, W.J. Numerical and experimental study on vertical force of ball in suction flow field. In Proceedings of the 14th National Conference on Hydrodynamics and the 28th National Symposium on Hydrodynamics, Changchun, Jilin, China, 8 October 2017; pp. 476–482. (In Chinese). [Google Scholar]
- Zhao, G.; Xiao, L.; Peng, T.; Zhang, M. Experimental Research on Hydraulic Collecting Spherical Particles in Deep Sea Mining. Energies 2018, 11, 1938. [Google Scholar] [CrossRef]
- Sobota, J.; Boczarski, S.; Petryka, L.; Kotlinski, R.; Stoyanova, V. Slip Velocity in Nodules Vertical Flow—Experimental Results. In Proceedings of the Fourth (2001) Isope Ocean Mining Symposium, Szczecin, Poland, 23–27 September 2001; pp. 127–131. [Google Scholar]
- Shen, Y.H. Minimum lifting velocity of solid—Liquid two—Phase flow in vertical pipe. J. Univ. Sci. Technol. Beijing 1999, 519–522. (In Chinese) [Google Scholar] [CrossRef]
- Yang, N.; Tang, H. Several considerations of the design of the hydraulic pick-up device. In Proceedings of the Fifth (2003) Isope Ocean Mining Symposium, Tsukuba, Japan, 15–19 September 2003; pp. 119–122. [Google Scholar]
- Lee, M.; Cho, S.-g.; Choi, J.-S.; Kim, H.-W.; Hong, S.; Lee, T.H. Metamodel-Based Multidisciplinary Design Optimization of a Deep-Sea Manganese Nodules Test Miner. J. Appl. Math. 2012, 2012, 326954. [Google Scholar] [CrossRef]
- Hu, Q.; Chen, J.; Deng, L.; Kang, Y.; Liu, S. CFD-DEM Simulation of Backflow Blockage of Deep-Sea Multistage Pump. J. Mar. Sci. Eng. 2021, 9, 987. [Google Scholar] [CrossRef]
- Lim, S.J.; Kim, J.W.; Jung, S.T.; Cho, H.Y.; Lee, S.H. Deep Seawater flow Characteristics Around the Manganese Nodule Collecting Device. Procedia Eng. 2015, 116, 544–551. [Google Scholar] [CrossRef]
- Jin, W.B.; Huang, X.P.; Gao, W.P. Experimental study on minimum Conveying speed of large particle material in vertical pipe. Min. Res. Dev. 1997, 17–20. (In Chinese) [Google Scholar] [CrossRef]
- Xiong, H.; Chen, Y.; Yang, N.; Xiao, J.; Li, L. Numerical study on settling and floating movements of a sphere particle flowing in a vertical pipe. In Proceedings of the 28th International Ocean and Polar Engineering Conference, Sapporo, Japan, 10–15 June 2018; pp. 176–182. [Google Scholar]
- Pougatch, K.; Salcudean, M. Numerical modelling of deep sea air-lift. Ocean. Eng. 2008, 35, 1173–1182. [Google Scholar] [CrossRef]
- Tauviqirrahman, M.; Jamari, J.; Susilowati, S.; Pujiastuti, C.; Setiyana, B.; Pasaribu, A.H.; Ammarullah, M.I. Performance Comparison of Newtonian and Non-Newtonian Fluid on a Heterogeneous Slip/No-Slip Journal Bearing System Based on CFD-FSI Method. Fluids 2022, 7, 225. [Google Scholar] [CrossRef]
- Zhu, H.P.; Zhou, Z.Y.; Yang, R.Y.; Yu, A.B. Discrete particle simulation of particulate systems: Theoretical developments. Chem. Eng. Sci. 2007, 62, 3378–3396. [Google Scholar] [CrossRef]
- Chen, Y.; Xiong, H.; Cheng, H.; Yu, C.; Xie, J. Effect of particle motion on the hydraulic collection of coarse spherical particles. Acta Mech. Sin. 2019, 36, 72–81. [Google Scholar] [CrossRef]
- Wei, W.; Wang, Y.; Tao, T.; Chen, X.; Hu, N.; Ma, Y.; Yan, Q. A Study on Using Location-Information-Based Flow Field Reconstruction to Model the Characteristics of a Discharging Valve in a Hydrodynamic Retarder. Machines 2023, 11, 460. [Google Scholar] [CrossRef]
- Ammarullah, M.I.; Hartono, R.; Supriyono, T.; Santoso, G.; Sugiharto, S.; Permana, M.S. Polycrystalline Diamond as a Potential Material for the Hard-on-Hard Bearing of Total Hip Prosthesis: Von Mises Stress Analysis. Biomedicines 2023, 11, 951. [Google Scholar] [CrossRef] [PubMed]
- Jamari, J.; Ammarullah, M.I.; Santoso, G.; Sugiharto, S.; Supriyono, T.; Permana, M.S.; Winarni, T.I.; van der Heide, E. Adopted walking condition for computational simulation approach on bearing of hip joint prosthesis: Review over the past 30 years. Heliyon 2022, 8, e12050. [Google Scholar] [CrossRef] [PubMed]
- CD-adapco. User Guide, STAR-CCM+; CD-adapco: Melville, NY, USA, 2016. [Google Scholar]
- Salaha, Z.F.M.; Ammarullah, M.I.; Abdullah, N.N.A.A.; Aziz, A.U.A.; Gan, H.-S.; Abdullah, A.H.; Abdul Kadir, M.R.; Ramlee, M.H. Biomechanical Effects of the Porous Structure of Gyroid and Voronoi Hip Implants: A Finite Element Analysis Using an Experimentally Validated Model. Materials 2023, 16, 3298. [Google Scholar] [CrossRef]
- Liu, L.; Gai, K.; Yang, J.; Guo, X. Numerical Investigation on the Dynamics of Mixture Transport in Flexible Risers during Deep-Sea Mining. J. Mar. Sci. Eng. 2022, 10, 1842. [Google Scholar] [CrossRef]
- Zhao, G.C.; Xiao, L.F.; Hu, J.C.; Zhao, W.J. Experimental study on the mechanical characteristics of ellipsoidal coarse particles in the flow field of deep-sea hydraulic ore collection. Shipbuilding of China 2020, 61, 81–89. [Google Scholar]
- Hong, S.; Hu, X. Research on Wear Characteristics and Experiment on Internal Through-Passage Components for a New Type of Deep-Sea Mining Pump. Processes 2021, 10, 58. [Google Scholar] [CrossRef]
- Prakoso, A.T.; Basri, H.; Adanta, D.; Yani, I.; Ammarullah, M.I.; Akbar, I.; Ghazali, F.A.; Syahrom, A.; Kamarul, T. The Effect of Tortuosity on Permeability of Porous Scaffold. Biomedicines 2023, 11, 427. [Google Scholar] [CrossRef]
- Putra, R.U.; Basri, H.; Prakoso, A.T.; Chandra, H.; Ammarullah, M.I.; Akbar, I.; Syahrom, A.; Kamarul, T. Level of Activity Changes Increases the Fatigue Life of the Porous Magnesium Scaffold, as Observed in Dynamic Immersion Tests, over Time. Sustainability 2023, 15, 823. [Google Scholar] [CrossRef]


| Case | Number of Meshes | Size of Meshes (mm) | Cell Quality | Time Step (s) | F (N) | Relative Deviation |
|---|---|---|---|---|---|---|
| E1 | 748,849 | 3 | <0.3 | 0.0003 | 0.3469 | |
| E2 | 1,151,745 | 2.7 | <0.3 | 0.0003 | 0.3500 | 0.89% |
| E3 | 1,343,787 | 2.4 | >0.3 | 0.0003 | 0.3524 | 0.69% |
| E4 | 1,602,851 | 2.1 | >0.3 | 0.0003 | 0.3538 | 0.4% |
| Physical Quantity | Numerical Value | Physical Quantity | Numerical Value |
|---|---|---|---|
| Particle density | 2100 kg/m3 | Particle diameter | 40 mm |
| Fluid density | 1000 kg/m3 | Velocity inlet | 2.0–2.8 m/s |
| Pressure outlet | 0.0 Pa | Von Kármán constant | 0.42 KPa |
| SX′/mm | Sy′/mm | SZ′/mm | (SX′+ Sy′)/mm | ||
|---|---|---|---|---|---|
| v = 1.8 m/s | 4.8 | 3.36 | 260 | 8.16 | 0.262 |
| v = 2.0 m/s | 1.17 | 1.23 | 260 | 2.4 | 0.188 |
| v = 2.2 m/s | 0.51 | 1.7 | 260 | 2.21 | 0.161 |
| v = 2.4 m/s | 1.88 | 0.25 | 260 | 2.13 | 0.142 |
| v = 2.6 m/s | 1.08 | 0.21 | 260 | 1.29 | 0.127 |
| h/d | D/d | S/d | |
|---|---|---|---|
| Working condition of the one | 1.5 | 2, 2.5, 3, 3.5, 4 | 0 |
| 1.75 | 2, 2.5, 3, 3.5, 4 | 0 | |
| 2 | 2, 2.5, 3, 3.5, 4 | 0 | |
| 2.25 | 2, 2.5, 3, 3.5, 4 | 0 | |
| 2.5 | 2, 2.5, 3, 3.5, 4 | 0 | |
| Working condition of the two | 1.5 | 2.5 | 0, 0.625, 1.25, 1.875, 2.5 |
| 1.75 | 2.5 | 0, 0.625, 1.25, 1.875, 2.5 | |
| 2 | 2.5 | 0, 0.625, 1.25, 1.875, 2.5 | |
| 2.25 | 2.5 | 0, 0.625, 1.25, 1.875, 2.5 | |
| 2.5 | 2.5 | 0, 0.625, 1.25, 1.875, 2.5 | |
| Working condition of the three | 1.75 | 2 | 0, 0.625, 1.25, 1.875, 2.5 |
| 1.75 | 2.5 | 0, 0.625, 1.25, 1.875, 2.5 | |
| 1.75 | 3 | 0, 0.625, 1.25, 1.875, 2.5 | |
| 1.75 | 3.5 | 0, 0.625, 1.25, 1.875, 2.5 | |
| 1.75 | 4 | 0, 0.625, 1.25, 1.875, 2.5 |
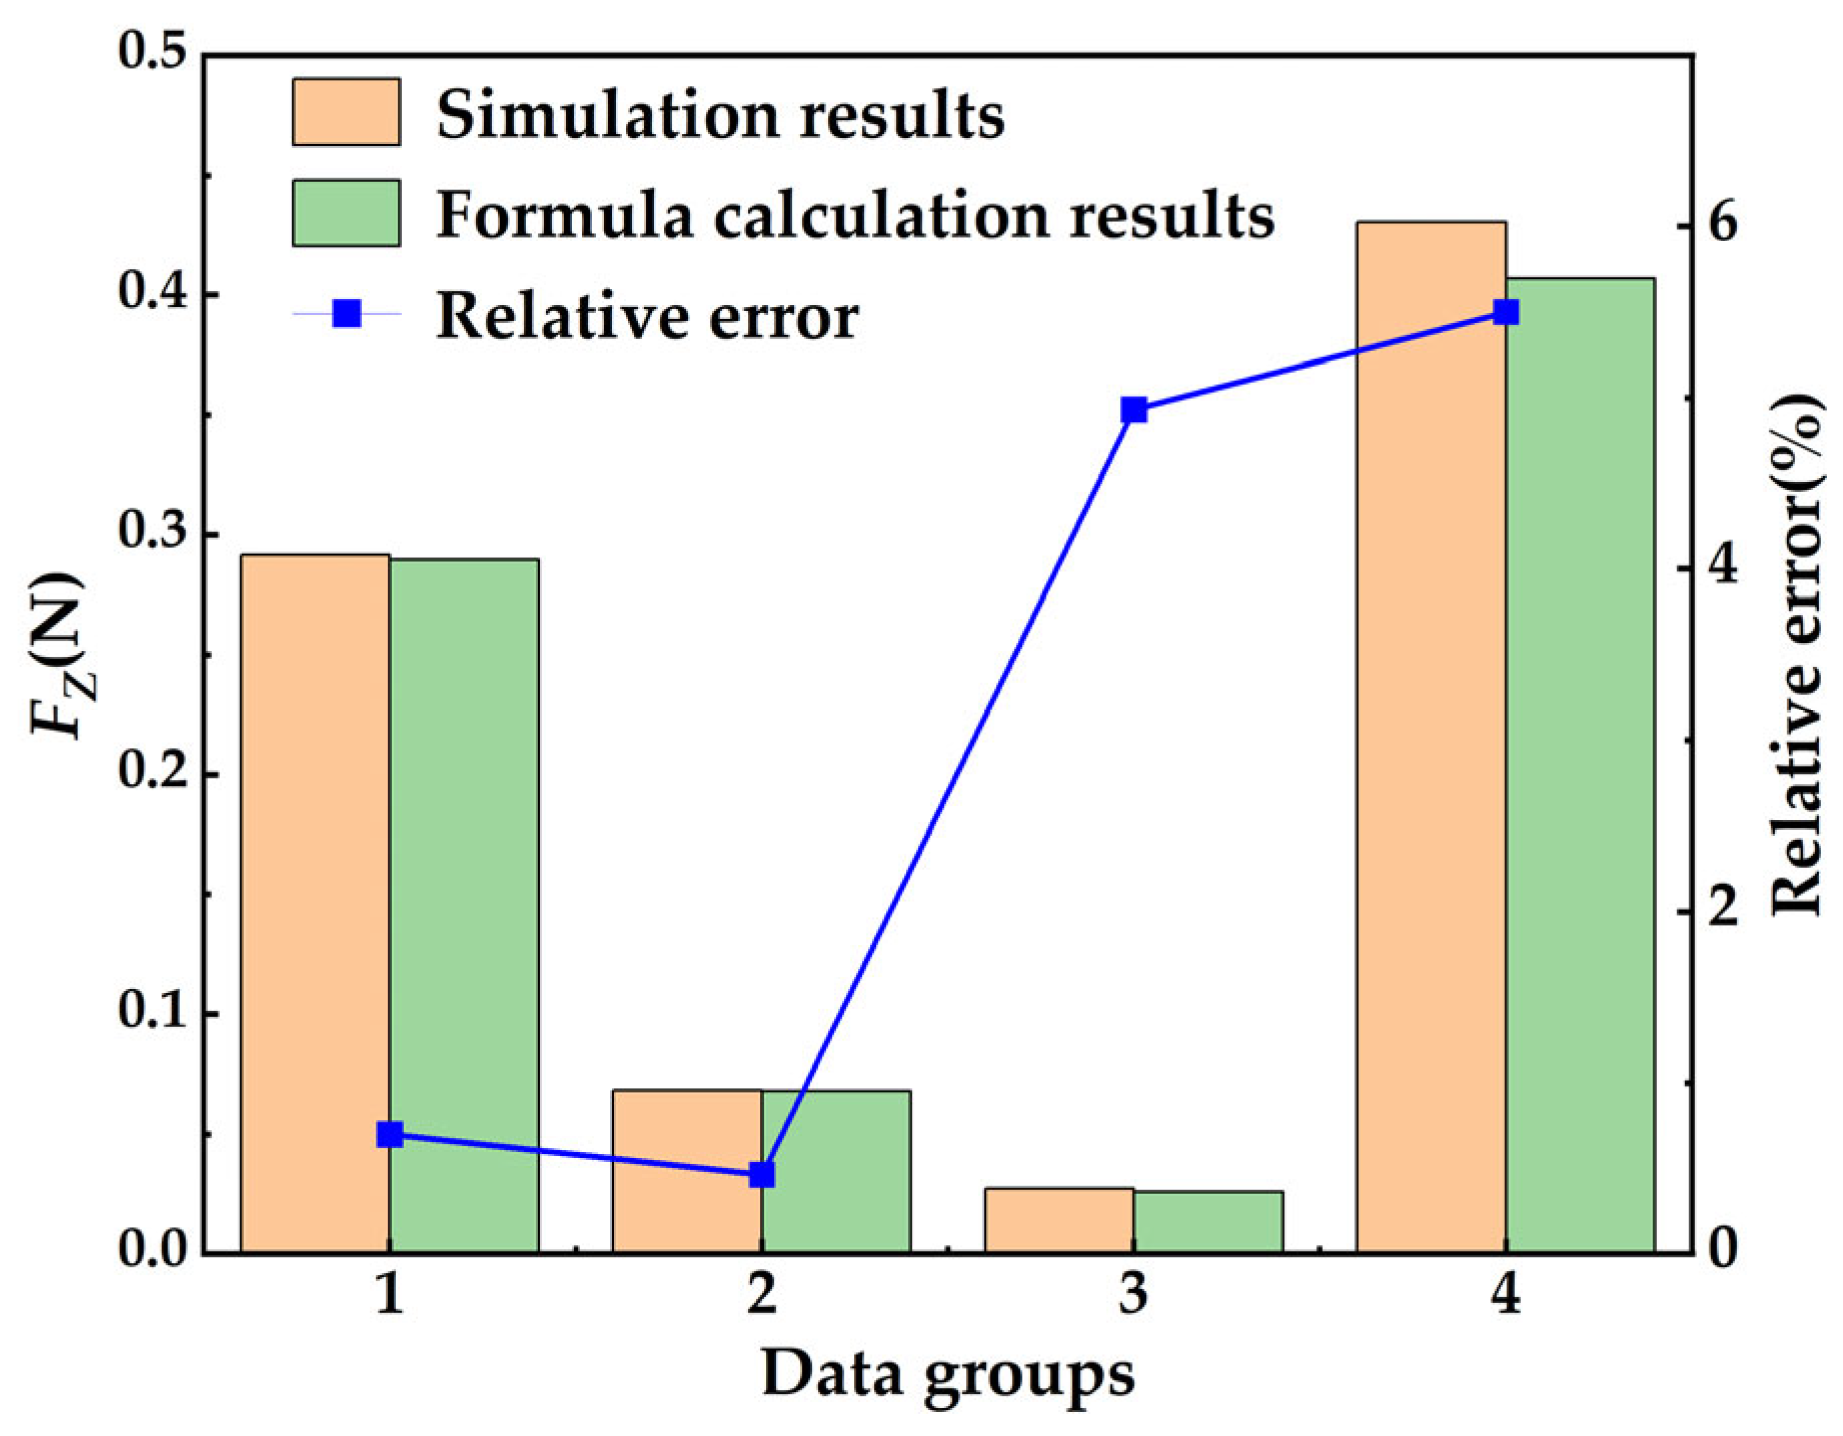
| Data Groups | h/d | D/d | S/d | v (m/s) | Simulation Results (N) | Formula Calculation Results (N) | Relative Error (%) |
|---|---|---|---|---|---|---|---|
| 1 | 1.7 | 2.6 | 1.2 | 2 | 0.29152 | 0.28948 | 0.70 |
| 2 | 2.2 | 2.1 | 0.7 | 2.1 | 0.06850 | 0.068183 | 0.46 |
| 3 | 2 | 2.5 | 1.9 | 2.3 | 0.2723 | 0.025887 | 4.93 |
| 4 | 2.2 | 2.75 | 1 | 2.2 | 0.43049 | 0.40682 | 5.50 |
Disclaimer/Publisher’s Note: The statements, opinions and data contained in all publications are solely those of the individual author(s) and contributor(s) and not of MDPI and/or the editor(s). MDPI and/or the editor(s) disclaim responsibility for any injury to people or property resulting from any ideas, methods, instructions or products referred to in the content. |
© 2023 by the authors. Licensee MDPI, Basel, Switzerland. This article is an open access article distributed under the terms and conditions of the Creative Commons Attribution (CC BY) license (https://creativecommons.org/licenses/by/4.0/).
Share and Cite
Xia, Q.; Jia, H.; Sun, J.; Xi, X.; Cui, J. Study on Flow Characteristics of Hydraulic Suction of Seabed Ore Particles. Processes 2023, 11, 1376. https://doi.org/10.3390/pr11051376
Xia Q, Jia H, Sun J, Xi X, Cui J. Study on Flow Characteristics of Hydraulic Suction of Seabed Ore Particles. Processes. 2023; 11(5):1376. https://doi.org/10.3390/pr11051376
Chicago/Turabian StyleXia, Qiu, Hao Jia, Jiuchun Sun, Xiaoguang Xi, and Jingyu Cui. 2023. "Study on Flow Characteristics of Hydraulic Suction of Seabed Ore Particles" Processes 11, no. 5: 1376. https://doi.org/10.3390/pr11051376