

Experimental Study on Small-Strain Elastic Parameters of Biochar–Methanotroph–Clay Mixture

Abstract
:
1. Introduction
2. Materials and Methods
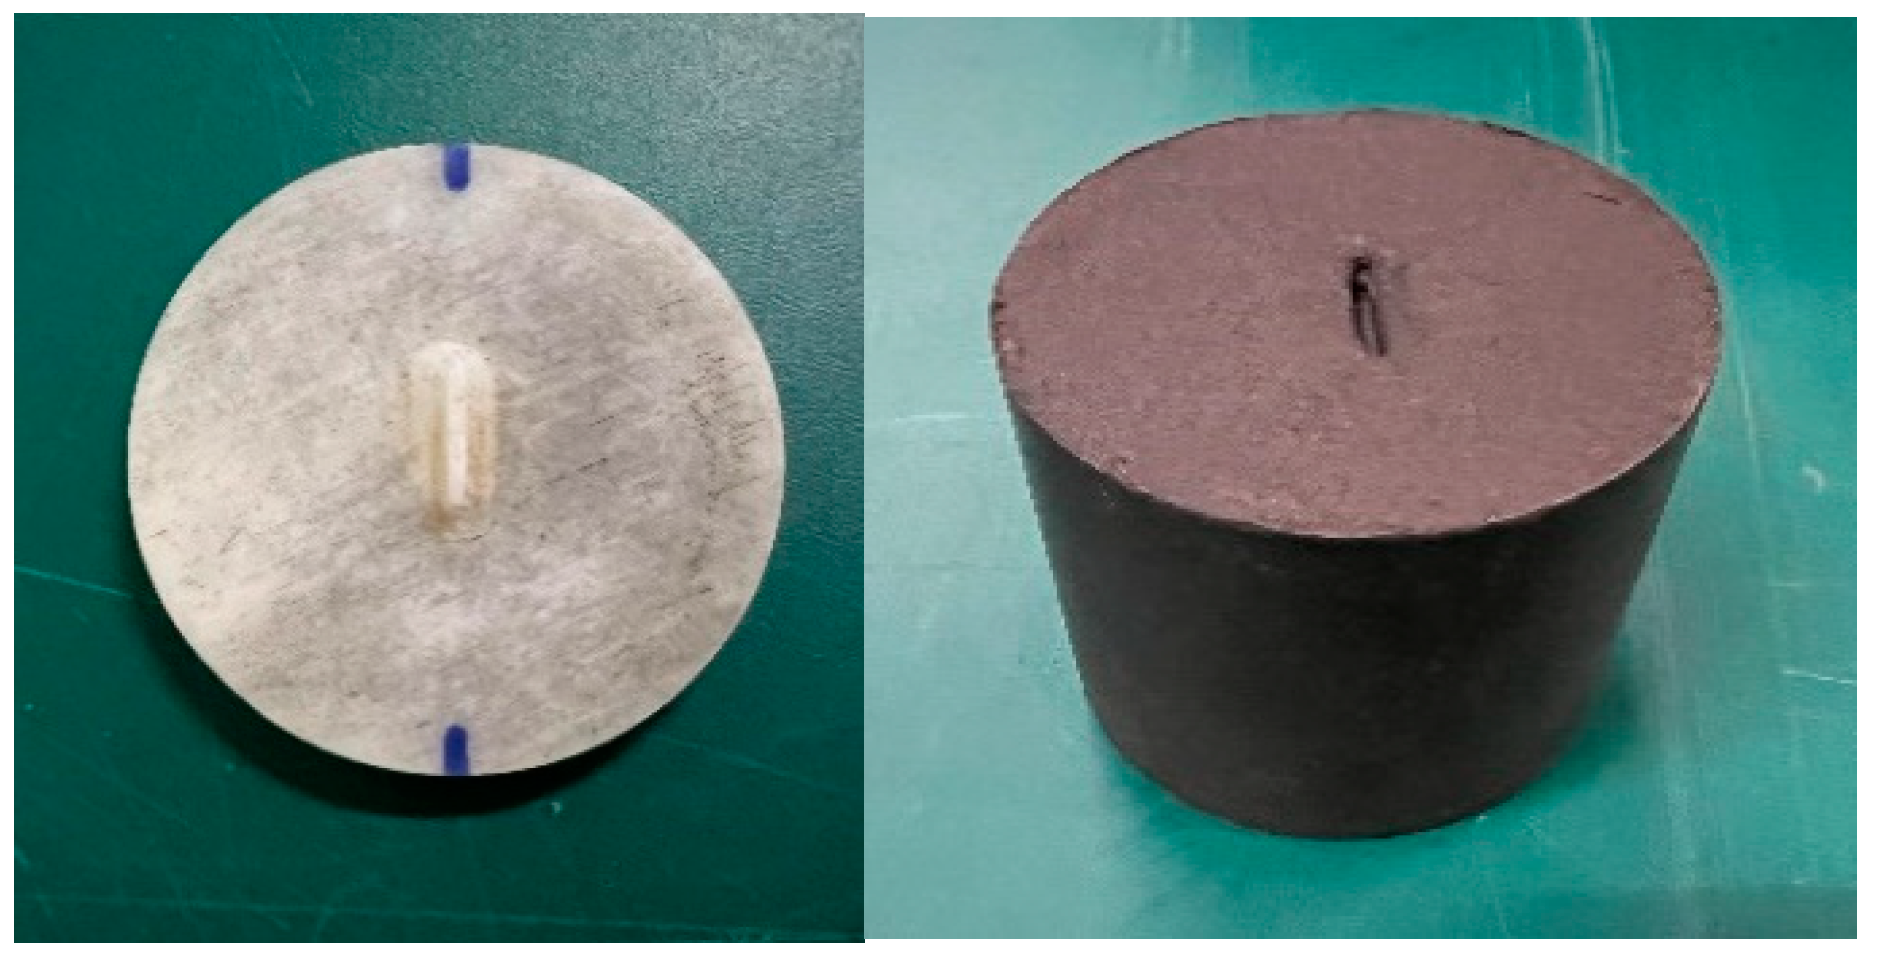
2.1. Materials
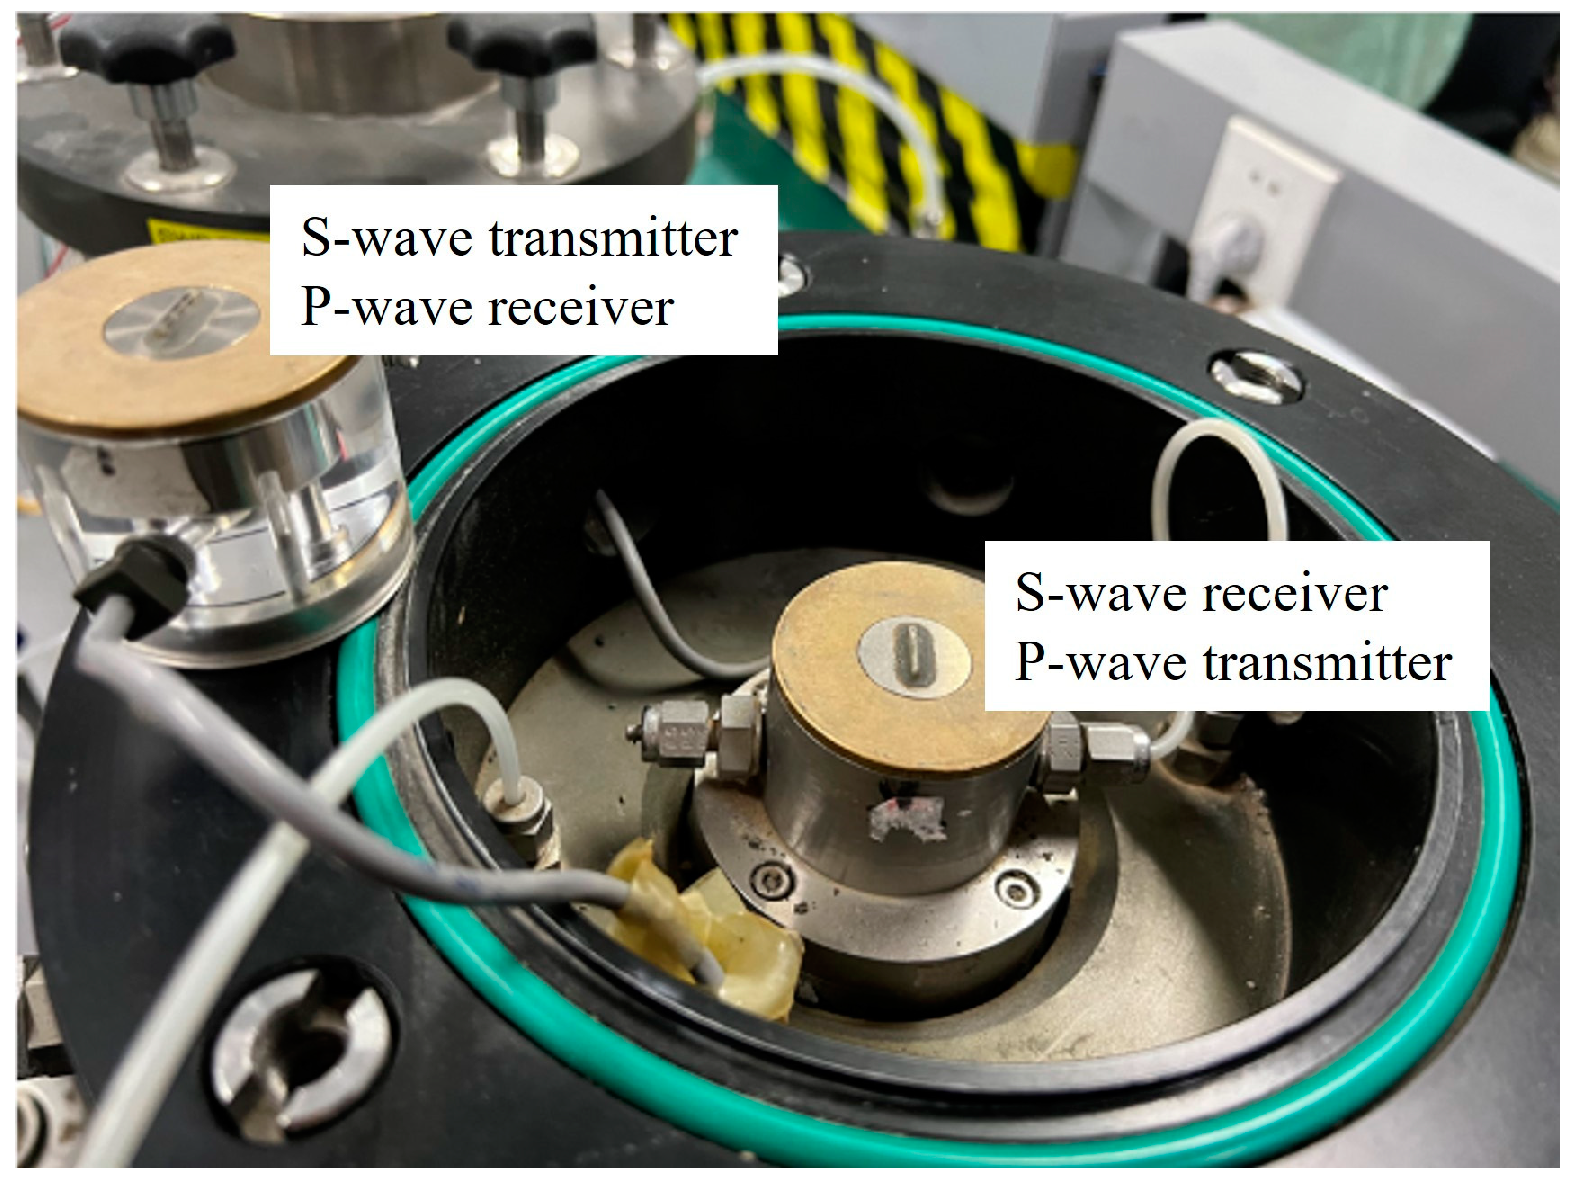
2.2. Apparatus
2.3. Test Method
3. Results
3.1. Maximum Shear Modulus, Maximum Constrained Modulus, and Poisson’s Ratio of the Biochar–Clay Mixture
3.2. Maximum Shear Modulus, Maximum Constrained Modulus, and Poisson’s Ratio of the Biochar–Methanotroph–Clay Mixture
4. Discussion
5. Conclusions
- The maximum shear and constrained modulus of the biochar–clay mixture increased with the increase in dry density, and the increasing trend was most obvious when the biochar content was 15%. The maximum shear and constrained modulus of the biochar–clay mixture increased with the increase in biochar content. When the dry density was 1.64 g/cm3, the increase in biochar content significantly increased the maximum shear and constrained modulus.
- The maximum shear and constrained modulus of the biochar–methanotroph–clay mixture increased with the increase in methane cultivation days, and the higher the biochar content, the more obvious the increasing trend of the maximum shear and constrained modulus.
- The Poisson’s ratio of the biochar–clay mixture tended to increase with the increase in dry density and biochar content, and the Poisson’s ratio increased obviously when the dry density and biochar content was higher. The Poisson’s ratio of the biochar–methanotroph–clay mixture decreased with the increase in methane cultivation days.
Author Contributions
Funding
Data Availability Statement
Acknowledgments
Conflicts of Interest
References
- Alheji, A.K.B.; Yu, J.; Wu, Y.T. Method of dynamic index system for classification and treatment of municipal domestic waste. J. Civil Environ. Eng. 2020, 42, 153–160. [Google Scholar]
- Pachauri, R.K.; Allen, M.R.; Barros, V.R.; Broome, J.; Cramer, W.; Christ, R.; Church, J.A.; Clarke, L.; Dahe, Q.; Dasgupta, P.; et al. Climate Change 2014: Synthesis Report. Contribution of Working Groups I, II and III to the Fifth Assessment Report of the Intergovernmental Panel on Climate Change. J. Roman. Stud. 2014, 4, 85–88. [Google Scholar]
- Reddy, K.; Yaghoubi, P.; Yukselen-Aksoy, Y. Effects of biochar amendment on geotechnical properties of landfill cover soil. Waste Manag. Res. J. Sustain. Circ. Econ. 2015, 33, 524–532. [Google Scholar] [CrossRef]
- Wu, B.; Xi, B.; He, X.; Sun, X.; Li, Q.; Ouche, Q.; Zhang, H.; Xue, C. Methane Emission Reduction Enhanced by Hydrophobic Biochar-Modified Soil Cover. Processes 2020, 8, 162. [Google Scholar] [CrossRef] [Green Version]
- Brindha, R.K.; Vasudevan, N. Methane oxidation capacity of methanotrophs isolated from different soil ecosystems. Int. J. Environ. Sci. Technol. 2017, 15, 1931–1940. [Google Scholar] [CrossRef]
- Sadasivam, B.Y.; Reddy, K.R. Landfill methane oxidation in soil and bio-based cover systems: A review. Rev Environ. Sci. Biotechnol. 2014, 13, 79–107. [Google Scholar] [CrossRef]
- Nikbakht, M.; Sarand, F.B.; Irani, A.E.; Bonab, M.H.; Azarafza, M.; Derakhshani, R. An Experimental Study for Swelling Effect on Repairing of Cracks in Fine-Grained Clayey Soils. Appl. Sci. 2022, 12, 8596. [Google Scholar] [CrossRef]
- Lu, S.G.; Sun, F.F.; Zong, Y.T. Effect of rice husk biochar and coal fly ash on some physical properties of expansive clayey soil (Vertisol). Catena 2014, 114, 37–44. [Google Scholar] [CrossRef]
- Saffari, R.; Habibagahi, G.; Nikooee, E.; Niazi, A. Biological Stabilization of a Swelling Fine-Grained Soil: The Role of Microstructural Changes in the Shear Behavior. Iran. J. Sci. Technol. Trans. Civ. Eng. 2017, 41, 405–414. [Google Scholar] [CrossRef]
- Xue, Q.; Zhao, Y.; Li, Z.Z.; Liu, L. Numerical simulation on the cracking and failure law of compacted clay lining in landfill closure cover system. Int. J. Numer. Anal. Meth. Geomech. 2014, 38, 1556–1584. [Google Scholar] [CrossRef]
- Yang, J.; Yan, X.R. Site response to multi-directional earthquake loading: A practical procedure. Soil Dyn. Earthq. Eng. 2009, 29, 710–721. [Google Scholar] [CrossRef]
- Lu, N.; Kaya, M. A Power Law for Elastic Moduli of Unsaturated Soil. J. Geotech. Geoenviron. Eng. 2013, 140, 46–56. [Google Scholar] [CrossRef]
- Zhang, F.; Yang, Z.J.; Still, B.; Wang, J.; Yu, H.; Zubeck, H.; Petersen, T.; Aleshire, L. Elastic properties of saline permafrost during thawing by bender elements and bending disks. Cold Reg. Sci. Technol. 2018, 146, 60–71. [Google Scholar] [CrossRef]
- Shirley, D.J.; Hampton, L.D. Shear-wave measurements in laboratory sediments. J. Acoust. Soc. Am. 1978, 63, 607–613. [Google Scholar] [CrossRef]
- Rozova, O.N.; Mustakhimov, I.I.; But, S.Y.; Reshetnikov, A.S.; Khmelenina, V.N. Role of the malic enzyme in metabolism of the halotolerant methanotroph Methylotuvimicrobium alcaliphilum 20Z. PLoS ONE 2019, 14, e0225054. [Google Scholar] [CrossRef] [Green Version]
- Teng, H.; Altaf, A.R. Elemental mercury (Hg0) emission, hazards, and control: A brief review. J. Hazard. Mater. Adv. 2022, 5, 100049. [Google Scholar] [CrossRef]
- Altaf, A.R.; Adewuyi, Y.G.; Teng, H.; Gang, L.; Abid, F. Elemental mercury (Hg0) removal from coal syngas using magnetic tea-biochar: Experimental and theoretical insights. J. Environ. Sci. 2022, 122, 150–161. [Google Scholar] [CrossRef]
- Xu, K.; Sun, W.J.; Liu, X.Y.; Yu, C. Methane Reduction Efficiency of Biochar-methanotroph-amended Clay. Arab. J. Geosci. 2022, 15, 909. [Google Scholar] [CrossRef]
- Gu, X.Q.; Yang, J.; Huang, M.S. Laboratory measurements of small strain properties of dry sands by bender element. Soils Found. 2013, 53, 735–745. [Google Scholar] [CrossRef]
- Głuchowski, A.; Skutnik, Z.; Biliniak, M.; Sas, W.; Lo Presti, D. Laboratory Characterization of a Compacted–Unsaturated Silty Sand with SpecialAttention to Dynamic Behavior. Appl. Sci. 2020, 10, 2559. [Google Scholar] [CrossRef] [Green Version]
- Liu, X.; Qin, H.; Lan, H.X. On the relationship between soil strength and wave velocities of sandy loess subjected to freeze-thaw cycling. Soil Dyn. Earthq. Eng. 2020, 136, 106216. [Google Scholar] [CrossRef]
- Ruan, B.; Miao, Y.; Cheng, K.; Yao, E.L. Study on the small strain shear modulus of saturated sand-fines mixtures by bender element test. Eur. J. Environ. Civ. Eng. 2021, 25, 28–38. [Google Scholar] [CrossRef]
- Gao, W.; Munoz, R.V.; Ren, T.; Ashto, R.W.; Morin, M.; Clarkc, I.M.; Powlsonc, D.S.; Whalley, W.R. Effect of microbial activity on penetrometer resistance and elastic modulus of soil at different temperatures. Eur. J. Soil Sci. 2017, 68, 412–419. [Google Scholar] [CrossRef] [PubMed] [Green Version]
- GB 50123; Standard for Soil Test Method. Ministry of Water Resources of China: Beijing, China, 2019.
- ASTM D1762-84; Standard test method for chemical analysis of wood charcoal. ASTM International: West Conshohocken, PA, USA, 2007.
- Kallistova, A.Y.; Montonen, L.; Jurgens, G.; Münster, U.; Kevbrina, M.V.; Nozhevnikova, A.N. Culturable psychrotolerant methanotrophic bacteria in landfill cover soil. Microbiology 2013, 83, 109–118. [Google Scholar] [CrossRef]
- Ingale, R.; Patel, A.; Mandal, A. Performance analysis of piezoceramic elements in soil: A review. Sens. Actuators A-Phys. 2017, 262, 46–63. [Google Scholar] [CrossRef]
- Xu, K.; Gu, X.; Hu, C.; Lu, L. Comparison of small-strain shear modulus and Young’s modulus of dry sand measured by resonant column and bender–extender element. Can. Geotech. J. 2020, 57, 1745–1753. [Google Scholar] [CrossRef]
- Li, M.Y.; Sun, W.J.; Huang, Q.; Sun, D.A. Soil-water characteristic of biochar-clay mixture in the full suction range. Rock Soil Mech. 2022, 43, 2717–2725. (In Chinese) [Google Scholar]
- Soból, E.; Gabryś, K.; Zabłocka, K.; Šadzevičius, R.; Skominas, R.; Sas, W. Laboratory Studies of Small Strain Stiffness and Modulus Degradation of Warsaw Mineral Cohesive Soils. Minerals 2020, 10, 1127. [Google Scholar] [CrossRef]
- Keller, L.M.; Seiphoori, A.; Gasser, P.; Lucas, F.; Holzer, L.; Ferrari, A. The pore structure of compacted and partly saturated MX-80 bentonite at different dry densities. Clays Clay Miner. 2014, 62, 174–187. [Google Scholar] [CrossRef]
- Yang, G.C.; Liu, Y.; Chen, P.P. Simulation Analysis of Temperature Effects on the Shear Behavior of Gassy Sand. Geofluids 2022, 2022, 5602833. [Google Scholar] [CrossRef]
- Tisdall, J.M.; Nelson, S.E.; Wilkinson, K.G.; Smith, S.E.; McKenzie, B.M. Stabilisation of soil against wind erosion by six saprotrophic fungi. Soil Biol. Biochem. 2012, 50, 134–141. [Google Scholar] [CrossRef]
- Li, M.Y.; Sun, W.J.; Wang, Y.J.; Sun, D.A.; Tan, Y.Z. Air permeability of biochar-amended clay cover. Arab. J. Geosci. 2021, 14, 732. [Google Scholar] [CrossRef]
- Omoike, A.; Chorover, J. Spectroscopic study of extracellular polymeric substances from Bacillus subtilis: Aqueous chemistry and adsorption effects. Biomacromolecules 2004, 5, 1219–1230. [Google Scholar] [CrossRef]
- Badireddy, A.R.; Korpol, B.R.; Chellam, S.; Gassman, P.L.; Engelhard, M.H.; Lea, A.S.; Rosso, K.M. Spectroscopic characterization of extracellular polymeric substances from Escherichia coli and Serratia marcescens: Suppression using sub-inhibitory concentrations of bismuth thiols. Biomacromolecules 2008, 9, 3079–3089. [Google Scholar] [CrossRef]
- Marc-André, G.; Lafleur, M. From curdlan powder to the triple helix gel structure: An attenuated total reflection-infrared study of the gelation process. Appl. Spectrosc. 2007, 61, 374–378. [Google Scholar] [CrossRef]
- Huang, L.; Jin, Y.N.; Zhou, D.H.; Liu, L.X.; Huang, S.K.; Zhao, Y.Q.; Chen, Y.C. A Review of the Role of Extracellular Polymeric Substances (EPS) in Wastewater Treatment Systems. Int. J. Environ. Res. Public Health 2022, 19, 12191. [Google Scholar] [CrossRef]
- Tan, X.L.; Zhang, G.P.; Yin, H.; Reed, A.H.; Furukawa, Y. Characterization of particle size and settling velocity of cohesive sediments affected by a neutral exopolymer. Int. J. Sediment Res. 2012, 27, 473–485. [Google Scholar] [CrossRef]


| Specific Gravity Gs | Liquid Limit wL/% | Plastic Limit wP/% | Plasticity Index Ip | Maximum Dry Density ρdmax/(g/cm3) | Optimum Moisture Content wopt/% |
|---|---|---|---|---|---|
| 2.71 | 42.04 | 24.00 | 18.04 | 1.63 | 22.00 |
| Specific Surface Area (m2/g) | Specific Gravity Gs | Bulk Density ρb/(g/cm3) | pH |
|---|---|---|---|
| 385.60 | 1.99 | 0.55 | 7.70 |
| Proximate Composition/% | Ultimate Composition/% | |||||
|---|---|---|---|---|---|---|
| Ash Content | Volatile Matter | Fixed Carbon | C | O | N | S |
| 18.80 | 66.11 | 15.09 | 50.46 | 48.74 | 0.80 | 0.00 |
Disclaimer/Publisher’s Note: The statements, opinions and data contained in all publications are solely those of the individual author(s) and contributor(s) and not of MDPI and/or the editor(s). MDPI and/or the editor(s) disclaim responsibility for any injury to people or property resulting from any ideas, methods, instructions or products referred to in the content. |
© 2023 by the authors. Licensee MDPI, Basel, Switzerland. This article is an open access article distributed under the terms and conditions of the Creative Commons Attribution (CC BY) license (https://creativecommons.org/licenses/by/4.0/).
Share and Cite
Zhang, S.; Sun, W.; Xu, K.; Liu, D. Experimental Study on Small-Strain Elastic Parameters of Biochar–Methanotroph–Clay Mixture. Processes 2023, 11, 982. https://doi.org/10.3390/pr11040982
Zhang S, Sun W, Xu K, Liu D. Experimental Study on Small-Strain Elastic Parameters of Biochar–Methanotroph–Clay Mixture. Processes. 2023; 11(4):982. https://doi.org/10.3390/pr11040982
Chicago/Turabian StyleZhang, Shuyun, Wenjing Sun, Kun Xu, and Deyang Liu. 2023. "Experimental Study on Small-Strain Elastic Parameters of Biochar–Methanotroph–Clay Mixture" Processes 11, no. 4: 982. https://doi.org/10.3390/pr11040982