Article

Surface Crack Detection of Steel Structures in Railroad Industry Based on Multi-Model Training Comparison Technique

1
Department of Information Engineering, Nanjing University of Aeronautics and Astronautics Jincheng College, Nanjing 211156, China
2
Department of Mechanical and Electrical Engineering and Automation, Nanjing University of Aeronautics and Astronautics Jincheng College, Nanjing 211156, China
3
Department of Geography and Bioinformatics, Nanjing University of Posts and Telecommunications, Nanjing 210023, China
*
Authors to whom correspondence should be addressed.
Processes 2023, 11(4), 1208; https://doi.org/10.3390/pr11041208
Submission received: 23 March 2023 / Revised: 10 April 2023 / Accepted: 10 April 2023 / Published: 14 April 2023

Abstract

:
A method of steel structure surface crack identification based on artificial intelligence technology is proposed to solve the problem that steel cracks can not be detected and forewarned in time when they appear in the railway industrial environment. The appearance of steel cracks greatly weakens the stability of steel structures, and will seriously endanger the safety of the railway industry if it is not detected and repaired in time. However, the common steel crack detection methods cannot achieve real-time monitoring of steel structures. In order to monitor the surface of steel structure in real-time and explore the recognition effect and model the advantages of common classification neural network models for surface cracks of railway industrial steel, this study evaluates the network model with multiple indicators and parameters under two experimental conditions. In this study, the steel surface cracks in the railway industrial environment are taken as samples, and the steel cracks are identified through the neural network model. For large-volume datasets, the recognition accuracy of the three network models has reached 97%, of which the YOLOv5 model has the best comprehensive recognition ability, and the C-Alex model has the best performance and convergence speed in small-volume datasets. This study explores the application prospects of models under different scenarios, proving that the three models can effectively detect steel surface cracks in real-time, and at the same time, it will pave the way for the development and application of artificial intelligence multi-model fusion technology in the field of the railway industry.

1. Introduction

1.1. What Is Steel Structure

Steel structures have now developed into one of the main types of building structures and there are a series of advantages over traditional building structure types such as high strength, light weight, high reliability, high seismic performance and short construction period. They are widely used in construction projects such as houses, bridges and ports, and road construction [1].

1.2. Effect of Cracks on Steel

While steel structures are widely used in different fields, the disadvantages are also gradually magnified in the application. Due to the poor corrosion resistance of steel structure buildings, especially in wet environments, corrosion and fatigue cracking of components may occur at a high rate, which will lead to problems such as short axle, derailment, etc., and there are road hazards in railway industrial production.
Cracks on the surface weaken the stability in the railroad industrial transport load-bearing application, which makes the overall strength of the railroad transport environment decrease, and even cause local fractures around the cracks, which seriously affects the safety of railroad transport [2]. In May 2021, cracks were found at the metal joints between several car bodies and the chassis in the vehicles manufactured by a company, and a large range of vehicles was shut down by the related operating companies, causing extremely serious losses. Therefore, the problems of environmental corrosion and fatigue of steel structures under long-term loading in railroad industrial applications are also gaining attention. Considering all the hazards of fatigue cracking on the surface of steel structures, railroad companies generally carry out regular inspections of the presence of cracks and their condition [3].

1.3. Current Crack Detection Research and Comparison

Common steel crack detection techniques include ray detection, ultrasonic detection, magnetic particle detection, penetration detection, and holographic detection [4]. Due to the high maintenance cost of steel structures used in the railway industry, and the harsh use conditions of some methods, it is not conducive to complete detection for a long time. By conventional inspection methods, the damage of the target steel structure can only be detected in a certain period of time in the previous cycle, long interval times cycles and regular inspection strategies that cannot achieve real-time tracking detection and timely warning of cracking history [5]. However, the existence of cracks will lead to overall building structure safety hazards, so the use of artificial intelligence methods to detect cracks on steel surfaces has a very wide range of application prospects in the relevant fields. In order to continuously grasp the damage of the target steel structure, it is also necessary to use artificial intelligence related technology for long-term real-time dynamic detection. Artificial intelligence recognition technology has a wide range of applications, high efficiency, low cost and other advantages that can achieve real-time dynamic detection of the full process of target performance.
The neural network model of artificial intelligence is similar to the neural network of the brain. In the vision of a neural network, the information presented in the image is mapped into parameter sets in the form of grayscale or RGB values, and the model is trained according to the parameter sets provided to it by a large number of images in order to complete the relevant classification work [6].
At present, artificial intelligence recognition technology is gradually being applied in the railway industry. Recently, the team of Ningxia University has carried out detection research on steel surface cracks based on the improved YOLOv4 model, which provides a certain direction for the patrol inspection of the railway transportation department, facilitates the maintenance of staff, and effectively guarantees railway safety. However, most studies of related AI detection use only one model at present, which will lead to limitations in training and detection. At the same time, it is difficult to carry out special processing operations for special samples. In this study, three models are used for detection, which not only ensures the recognition performance of a single model but also greatly adapts to the crack samples which are complex and changeable.
In Research on Pavement Crack Detection Based on Computer Vision, Dr. Cheng proposed an adaptive unsupervised crack detection method based on artificial intelligence technology and realized a road crack detection system that can target the situation of missed detection and error detection [7]. The research of experts such as Cheng, as a precedent for the application of artificial intelligence recognition methods in ordinary road environments, provides certain reference values for subsequent research. In the railway industrial environment, the causes and types of steel surface cracks are more complex than ordinary road surfaces, and the traditional methods of road crack detection cannot fully meet the needs of the railway industrial scene [7]. Therefore, artificial intelligence recognition technology also has certain application potential in the railway industrial field.
Based on the contributions made by Cheng and other experts in relevant fields [7], this research takes the microscopic disease of steel structure surface fatigue crack in the railway industry as the research scenario, and through the analysis of multiple neural network models in the detection of railway industrial steel surface crack, discusses the future steel structure surface crack detection mode based on artificial intelligence multi model technology. It also discusses its advantages in the application of railway engineering, aiming to improve the management and maintenance level of steel structure apparent fatigue cracks in the field of railway engineering, provide some technical support for the digitalization and systematization of fatigue crack management and maintenance, and pave the way for the wider application of artificial intelligence technology in the industrial field.

2. Preparation Materials and Identification Methods

2.1. Material Preparation

In this study, steel surface cracking is the object of study, and all steel cracking images are from field railroad industrial scenarios. The total dataset of 12,000 steel crack images (1600 × 256 resolution) consists of 20% special steel surface crack types (Special) and 80% normal steel surface crack types (Normal) to facilitate simulation and classification of the dataset for practical application scenarios. Special steel surface cracks are caused by both “inclusions” and “scarring”, while conventional steel cracks are caused by “delamination”, “scratches”, and “longitudinal cracks”. Cracks in conventional steel are caused by common defect factors such as “delamination”, “grab marks”, “longitudinal cracks”, “tail and cross cracks” and “indentation” [8].
In order to investigate the detailed performance characteristics and comprehensive recognition effects of three neural models, VGG16, C-Alex and Yolov5, in several specific scenarios of steel surface cracks, three neural network models were built in Pytorch [9] framework and then pre-trained and tested to check whether the environment and model and other related factors were wrong in the pre-preparation process.
The hardware training facility used for neural network training and operation is a desktop computer with an Inter (R) core (TM) i7-10900K CPU@3.60 GHZ processor, an NVIDIA GeForce RTX 2060 graphic processing unit, and 32 GB of running memory.
The image acquisition of the steel structure surface in the field scene is carried out using a computer, which controlled a tracking intelligent vehicle, which is equipped with a Wi-Fi module for communication with the computer.

2.2. Steel Crack Identification Method

In this study, labeling is used to frame and label the target samples in the images before training, and special fatigue cracks are labeled by class differential method, and the relevant “xml label files” are generated after the completion of labeling as the datasets sample for the neural network model. Some of the dataset samples are taken as a training set and deployed on the three models for training and the trained model is used as a test set to test the weight file.
The steel surface crack datasets are mostly neutral in color, and the steel cracks under different lighting conditions show more obvious grayscale differences with their surrounding steel surfaces, which will have large errors when using conventional color single feature recognition. In this study, the range of gray value difference between the steel surface areas and the concentration state of the distribution of the gray difference existence area are the main criteria, and the crack existence area is marked with a red rectangular prediction box.
It is determined by the model whether the current prediction target is a positive sample based on the confidence during the detection process, so the confidence level threshold is selected with respect to the evaluation data such as the precision and recall rate of the model. When the percentage of positive examples in a single prediction frame reaches the confidence threshold, it is considered a successful detection (non-missing defect). When the percentage of positive examples in a single prediction frame exceeds the confidence threshold, the sample is considered a successful identification (non-missing sample).
In order to reduce the influence of light scattering and reflection, the RGB data set is normalized and then converted into a grayscale map by the weighted average method, so that the model can read the grayscale values uniformly [10,11]. R, G, and B are the normalized RGB values, respectively, and Gray represents the gray value. The grayscale value is calculated as follows.
Gray = 0.299 R + 0.578 G + 0.114 B
A tracker intelligent vehicle is equipped with a camera to collect the image of the steel structure surface. Tracker intelligent vehicles will drive according to the planned route in advance. The computer sends a signal to drive the tracking smart car to collect the surface image of the target steel structure. The collected image is then sent back to the computer through the Wi-Fi module as the detection target, and the computer identifies and marks the steel cracks in the sample.

3. Neural Network Model

3.1. Model Introduction

The Yolov5 neural network model mainly consists of Backbone, Neck and Head components, following the online enhancement of mosaic images proposed by Yolov4, which aims to increase the number of small and medium-sized targets in a single batch [12]. In terms of loss function, three components, category loss, target loss and regression loss, are used by Yolov5 to guide the training [13].
The VGG network model used in the steel crack detection experiments is VGG16, which consists of 13 convolutional layers, 5 pooling layers and 3 fully connected layers. The convolutional layers are stacked with multiple 3 × 3 and 2 × 2 convolutional kernels instead of the traditional large convolutional kernels [14]. The parameters and computation are successfully reduced by the small convolutional kernels instead of the large convolutional kernels, and RMSProp is used as an optimizer so that the model can be better adapted to complex activation function variables with high complexity computations [15].

3.2. Model Improvement

In this study, based on the experiments and conclusions of the articles [16,17], the corresponding part of the original Alex model is improved and a new C-Alex model is designed based on the original Alex model. The improved model replaces the traditional stochastic gradient descent optimizer with the AdaDelta optimizer by adding a channel shuffle convolution layer after the fourth layer and a max pooling layer with overlapping properties near the end.
The channel shuffle convolutional layer makes the output convolutional features combine with different channel features, increasing the diversity of features in each group of convolutional layers and improving the network feature extraction capability [18]. The max pooling method is helpful to reduce the ambiguous effects of average pooling and enrich the feature parameters [19]. Compared to the random pooling layer used in the traditional model, the max pooling layer used by C-Alex can achieve a substantial reduction in noise interference [20].
The use of the AdaDelta optimizer allows for fast descent gradients and complete regression [21]. The AdaDelta algorithm does not have a learning rate as a hyperparameter, it replaces the learning rate in the RMSProp algorithm by using a term about the exponentially weighted moving average of the squared updates of the independent variables [22,23]. This makes it possible to extract image features efficiently in a short period of time. The gradient descent simulation process of the AdaDelta optimizer is shown in Figure 1.
In the convergence process, according to the image observation of the node motion trajectory, it is known that the convergence process from outside to inside has a great step length in the initial iteration, which undoubtedly greatly improves the optimization speed and makes it easier for the gradient descent algorithm to find the range where the minimum value exists; it gradually slows down the iteration step length when approaching the target, reduces the number of values taken, and improves the iteration efficiency. The convergence nodes are represented by x1 and x2 in the plane.
Additionally, in order to avoid excessive accumulation of second-order momentum and ending the full training process early, the optimizer algorithm does not accumulate all historical gradients but only focuses on the descent gradients in the past time window [24]. The optimization algorithm expression is as follows. Where α is the learning rate, ω is the parameter to be optimized, m is the first-order momentum, and V is the second-order momentum.
ω t + 1 = ω t α m t / V t
For learning efficiency and recognition ability, the C-Alex model uses the Charis activation function, which is an improved function based on Sigmoid, retaining some intervals to buffer the growth rate, but the Charis activation function, as a segmented function, is in a non-saturated state compared to the Sigmoid function as a saturated activation function, reducing the probability of error in the output due to the disappearance of the gradient. At the same time, it is guaranteed to have a high growth rate in the case of large positive output values [25]. From the analysis of the experimental data in [26], it is found that the Charis activation function has a higher recognition accuracy than other activation functions under the condition that the training material is very small. Especially for the recognition of the same object, it has an advantage in the tracking of an object with a small amount of sampling.

4. Model Evaluation Parameter Criteria

Four mainstream metrics were used for model evaluation: precision, accuracy, recall [27], and F1-source. Accuracy represents the percentage of the total number of correct predictions; precision represents the ratio of the number of steel cracks correctly detected by the model to the number of predicted steel cracks; recall represents the percentage of all steel surface crack targets correctly predicted in the sample and F1-score combines precision and recall with certain weights according to actual needs as a comprehensive model evaluation metric in a specific environment.
The main parameter criteria for the evaluation metrics are TP (Truth_Positive), FP (False_Positive), TN (Truth_Negative) and FN (False_Negative) [28]. Where TP represents the number of positive examples predicted as positive by the model, FP represents the number of negative examples predicted as positive by the model, FN represents the number of positive examples predicted as negative by the model, and TN represents the number of positive examples predicted as negative by the model.
The expressions for the evaluation metrics of accuracy, recall, precision and trade-off accuracy are as follows, respectively.
A c c u r a c y = ( T P + T N ) ( T P + T N + F P + F N )
R e c a l l = T P T P + F N
Precision = TP TP + FP
F1-Score: β is the weight bias variable, representing the weight of the recall rate is β times the accuracy rate.
In the actual application scenario of the railroad industry, when calculating the trade-off accuracy, the corresponding weight assignment can be made to each experimental data by adjusting the β value of trade-off accuracy so that the trade-off accuracy has a higher evaluation share [29]. When β is 1, the accuracy rate has the same share as the recall rate; when β is greater than 1, the recall rate has more weight in the feedback in the experiment and when β is less than 1, the accuracy rate has more weight in the feedback in the experiment [30].
When only testing the model, the accuracy rate and recall rate have the same status, that is, the F1 score is approximate to the accuracy rate. In the specific scenarios of the actual railway industry, the negative effects and painful costs caused by steel crack accidents are often far greater than the low costs caused by missing defects. This situation makes the frequency of error detection in the model exceed that of missed detection under the condition of the same error rate, that is, make appropriate pursuit for the recall rate, strengthen the generalization ability of the model, so as to reduce the possibility of missing detection. At the same time, the weight of Recall in the F1-score is higher than that of Precision.

5. Comparative Study of Model Characteristics

5.1. Research Perspective

In order to explore the multifaceted performance of different neural network models in different railroad industrial application scenarios, it is tested in this study that the effect of three neural network models on the recognition of conventional steel cracks and sporadic fine distributed steel cracks under the condition of small data sets, and the advantages and characteristics of the three models are analyzed for application.

5.2. Data Description and Analysis

The large volume of data in the study reduces the possibility of a connection between the three types of datasets, making the test set fully encapsulated compared to the training and validation sets, and ensuring the quality of the test set for model evaluation.
The model Hyper parameter settings and datasets properties of the first part are shown in Table 1. The dataset type is conventional steel cracking.
The total number of positive examples in the training set is 2500, and the best training example model is taken as the study model to explore the best balance between recall and accuracy by weighing the accuracy as the main index. The confidence threshold (Confidence) of the corresponding model is determined when the F1-score takes the maximum value, and the data of the model passing the test set under this condition are shown in Table 2.
The accuracy of all three models in the test set is higher than 97%, indicating that for steel surface cracks, all three types of models have good recognition ability. Using F1-score as the comprehensive evaluation criterion for the models, the Yolov5 model outperforms the other two models when the confidence level corresponds to the peak of the trade-off accuracy. The F1-score peaks at a confidence level of 0.63 in the Yolov5 model and the best balance of accuracy and recall is formed at this confidence level when the accuracy rate is 98.75% and the recall rate is 99.74%. As the confidence level gradually adjusted downward, more samples and noise are selected, causing the recall rate to trend slowly upward, with the precision rate decreasing the most between the confidence level of 0.4 threshold and 0.5 threshold. It is shown in Figure 2 that the relationship between the recall rate and precision rate is in the Yolov5 model.
It can be found in Figure 2 that the precision rate is inversely related to the recall rate when the confidence level decreases. In the statistics of features versus confidence, it is found that positive examples with positive predictions have much higher confidence than negative examples being detected as positive.
According to the relevant evaluation criteria formula with the recognition image, when the positive examples with positive prediction results are the same, the feedback of the model to the negative examples is an important factor affecting the two types of evaluation parameters. The less the feature content carried in the image, the lower the confidence when it is predicted as a positive example. When the confidence level decreases, the observation of sample prediction types shows that FN decreases, FP increases significantly, and TP in the recall rate decreases in the proportion of the total examples with a correct prediction, leading to a decrease in the recall rate. It is shown in Figure 3 that the negative examples (FP) are predicted as positive by the Yolov5 model when the confidence is lower than 0.5.
In this negative example, the overall gray difference of the picture is large, which is easy to be regarded as a positive example by the model object. However, compared with the real positive example picture of a steel crack, the negative example has fewer characteristics in the gray area concentration, which will lead to its error detection as a positive example only when the confidence is lower than the threshold.
Accuracy is an important indicator to assess the model’s ability to identify under noise interference such as light. The C-Alex model and the Yolov5 model have similar accuracy rates while ensuring higher recall, reflecting the lower risk of error and missed steel crack detection for both models trained on large data volumes. VGG16 has a higher confidence level than the other two models when the trade-off accuracy reaches its peak, showing that the model trade-off VGG16 model has a higher confidence level than the other two models at the peak of the trade-off accuracy, showing a higher feature recognition ability for a single common cracked steel crack sample at the peak of the model trade-off accuracy. It can be seen in Figure 4 the relationship between accuracy and confidence in the VGG16 network model.
Due to the low content of example features of the error detection case, the content of negative examples of positive predictions will decrease as the confidence level rises, making TP have a larger share of the accuracy rate, thus making the accuracy rate proportional to the confidence level relationship when the confidence level increases.
Several evaluation parameters of the Yolov5 model and the C-Alex model are close to each other, and when both models obtain the maximum value of the trade-off accuracy, the accuracy and recall of Yolov5 are higher than that of C-Alex, while the confidence is lower than that of the C-Alex model. Observing the images of both models before and after pooling, it is found that the C-Alex model has a more obvious noise presence sporadically distributed around the samples before pooling, and the noise is significantly reduced and the sample features are amplified after the images go through multiple max-pooling layers, which indicates that the C-Alex model is better than the Yolov5 model in terms of resistance to noise interference. The comparison of the C-Alex model before and after pooling the images several times was shown in Figure 5 and Figure 6, respectively.
After comparing the two sets of plots it can be more obviously found that after the image goes through Alex’s max pooling layer, most of the noise is eliminated and the max pooling layer effectively reduces the interference of noise on the sample, improves the recognition accuracy and increases the quality of the recognized sample.
The super-reference settings and dataset attributes for the second part are shown in Table 3 using a small volume dataset. Noise such as light has a large impact on the sporadically distributed steel crack pictures, and the model needs to extract its features accurately to screen the impact of the difference in gray value caused by light reflection.
The total number of positive examples in the training set is 300, and the training period is 10 rounds. The sample size and training period of the datasets is much less than the normal training mode, making the final round of training the best training sample model.
Considering the railroad industrial application scenario, the impact of industrial steel crack error detection is often lower than that of missed detection, this part of the study makes a moderate bias of the trade-off accuracy toward the recall rate based on the proportion of positive example volume. For the noise with uncertainty, the positive example judgment should be an appropriately increased β value in the trade-off accuracy, so that the confidence level corresponding to the peak of the trade-off accuracy is reduced compared with the initial one, in order to quantitatively increase the probability of successful identification. It can be shown in Table 4 that the data of the model passes the test set when the F1 score reaches the peak.
The data in the table shows that the C-Alex model under the training condition of a small number of datasets has obvious advantages over the other two models in the accuracy rate. The recall rate of short-term training feedback is higher, which reflects that the C-Alex model has strong short-term learning ability and can extract image features more quickly. The Yolov5 model is better than the VGG16 model in this research scenario due to its more complex structure and other factors.
The VGG16 and C-Alex models are also served as improvements to the Alex model, and in combination with the model structure, the AdaDelta optimization algorithm and Charis activation function of C-Alex can improve the learning ability and learning efficiency. In the steel crack recognition training comparison test with the original model, the C-Alex model is higher than the original model in terms of accuracy, precision and recall, reflecting the overall effect of the research improvement is more obvious, in which the accuracy rate of the improved model is more than 16.1% higher than the original model.
The restriction of data sets reduces the confidence of the three models. Combined with the conclusion of the article [31], it is found that the Charis activation function has stronger feedback on image features, which is convenient for mapping the image eigenvalue to the next layer. The simulation process of planar feature mapping under the influence of the activation function was shown in Figure 7.
In the identification of localized and dispersed steel cracks, the structure of the VGG16 model gives it a more prominent advantage in this area, with the highest confidence level among the three models when the trade-off accuracy reaches its peak, showing that the model has a higher extraction rate of localized and subtle features and can better classify noise from positive examples.

6. Conclusions and Outlook

6.1. Conclusions

With the rapid development of deep learning in recent years, its extensive application value has also been reflected. Many scientific research teams have applied artificial intelligence recognition technology to the field of the railway industry. In this research, an artificial intelligence recognition method based on steel surface cracks is proposed. Three models are selected and some models are improved to carry out multi-angle research; the multi-scene performance and model characteristics of the three models in steel crack recognition are analyzed in multiple directions. The conclusions of the study are as follows.
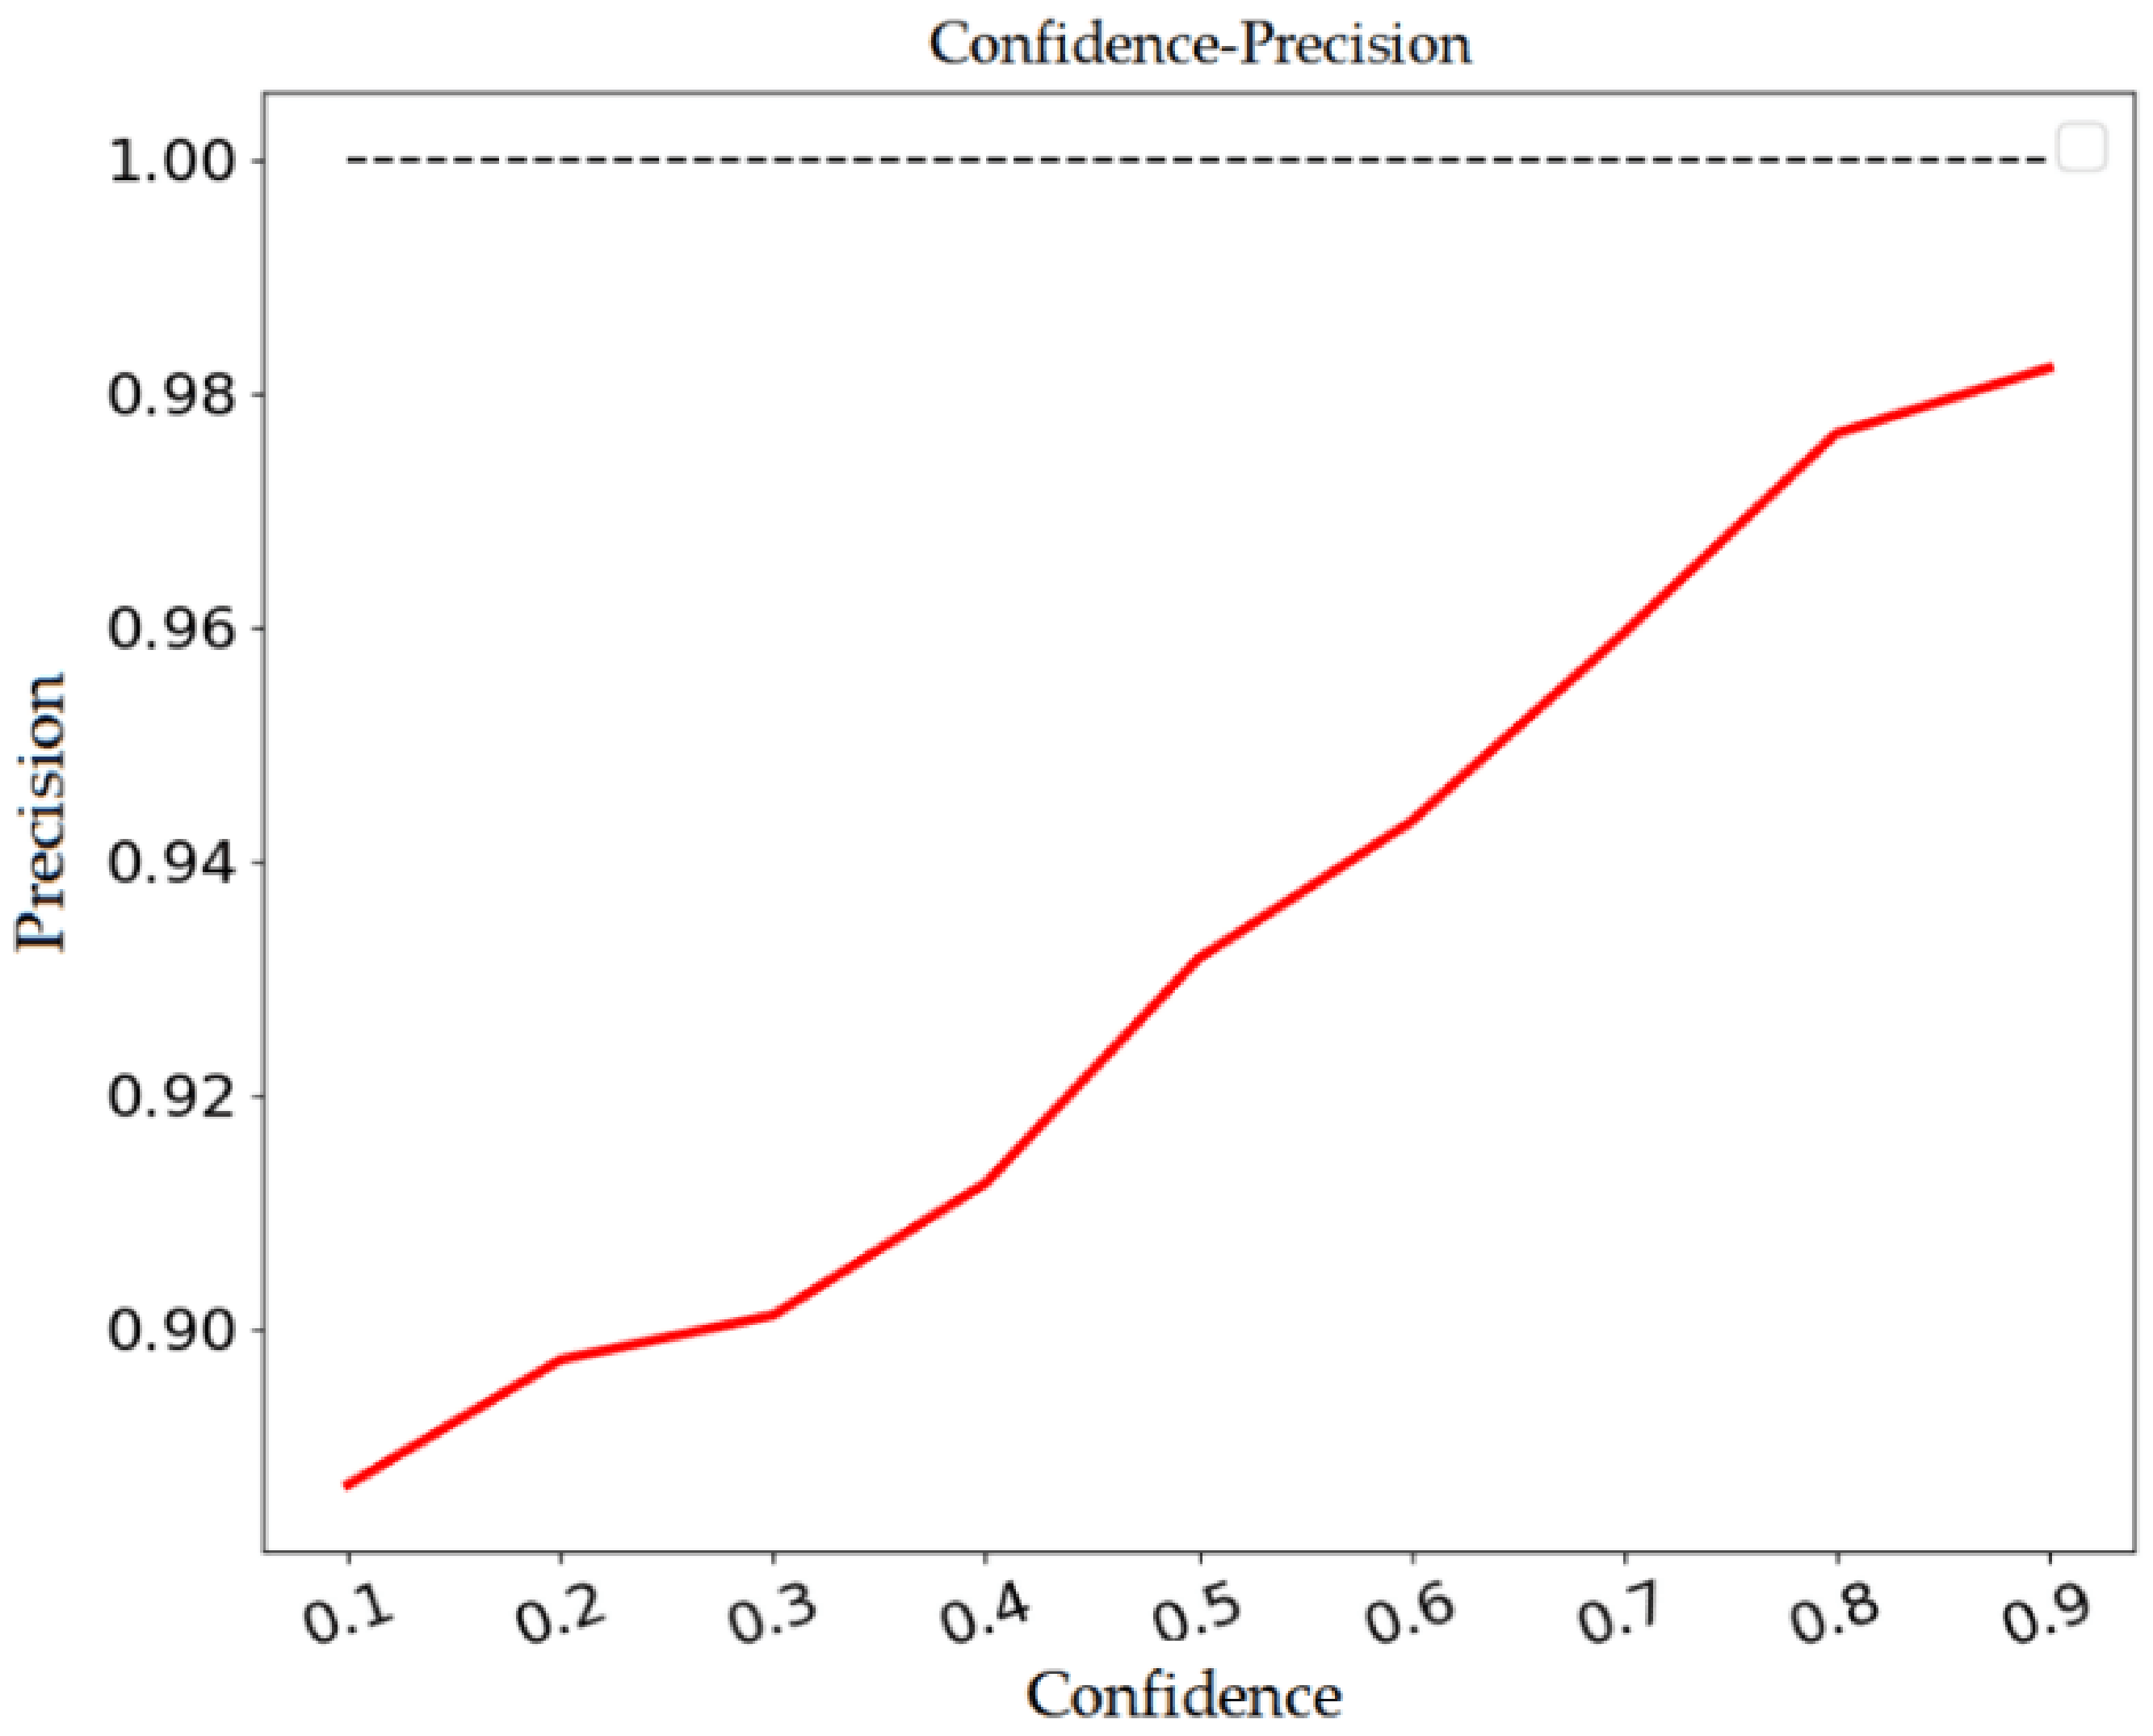
  • All three neural network models can effectively identify steel surface cracks with accuracy and trade-off accuracy higher than 97.5%, and the confidence level when the trade-off accuracy reaches the peak is higher than 0.6.
  • The Yolov5 model has better recognition ability under the training of large datasets, and the VGG16 model can extract the detailed features of the image more accurately and reduce the interference of noise effectively.
  • The C-Alex model is able to extract image features faster than the other two models under the training conditions with a small sample size of the datasets and shows a higher transfer efficiency of the features.
  • The artificial intelligence steel crack detection method, which uses the grayscale value set performance state and the grayscale difference threshold as the basis for judgment, significantly reduces the parameter content, shortens the calculation time, and improves the data transfer efficiency. Test experiments prove that this method can effectively detect steel surface cracks.
According to the reference [32], at present, various artificial intelligence recognition technologies based on different models are applied in the railway industry with an average accuracy of 90%, which has good recognition performance. This research has been improved on the basis of previous studies. Under the condition of large volume data sets, the accuracy exceeds the average level, which meets the demand for steel crack detection accuracy in the railway industry field and has good application prospects.

6.2. Outlook

This research has made improvements on the basis of previous studies, using a variety of neural network models for testing and comparison, which has certain application value and potential. However, the artificial intelligence recognition method used in this study still has some error detections. In future research on artificial intelligence recognition of railway steel cracks, the artificial intelligence recognition method of multi-model composite detection will be adopted in combination with the model characteristics to make corresponding improvements in terms of error detection and missing detection [33], further improve the recognition speed, analyze and use the characteristics of different models to complement each other, and improve the overall recognition ability and efficiency. In the future, we will expand the application scenarios of AI recognition technology, so that AI technology can better serve the industrial field.

Author Contributions

Conceptualization, W.L. and S.W.; methodology, K.C.; software, Y.C.; validation, S.W., L.L. and W.L.; formal analysis, Z.H.; investigation, K.C.; resources, Y.S. and C.C.; data curation, W.L.; writing—original draft preparation, K.C.; writing—review and editing, K.C.; visualization, Y.C. and H.J.; supervision, S.W.; project administration, P.Z.; All authors have read and agreed to the published version of the manuscript.

Funding

This research received no external funding.

Data Availability Statement

The datasets used and/or analyzed during the current study are available from the corresponding author on reasonable request.

Acknowledgments

This work is supported by Nanjing University of Aeronautics and Astronautics Jincheng College. The authors would like to thank all editors and anonymous reviewers for their valuable comments and suggestions.

Conflicts of Interest

The authors declare no conflict of interest.

References

  1. Cheng, F.; Wang, W.; Qiu, C.X.; Hu, S.; MacRae, G.A.; Eatherton, M.R. Seismic resilient steel structures: A review of research, practice, challenges and opportunities. J. Constr. Steel Res. 2022, 191, 107172. [Google Scholar] [CrossRef]
  2. Wang, Y.; Yuan, L.C.; Zhang, S.J.; Sun, C.; Wang, W.; Yang, G.; Li, Q.; Wei, Y. The influence of combined gradient structure with residual stress on crack-growth behavior in medium carbon steel. Eng. Fract. Mech. 2019, 209, 369–381. [Google Scholar] [CrossRef] [Green Version]
  3. Manios, E.; Pissas, M. A new cracks detection device for magnetic steels. EPJ Web Conf. 2014, 75, 6013. [Google Scholar] [CrossRef] [Green Version]
  4. Pascoe, J.A.; Zarouchas, D.S.; Alderliesten, R.C.; Benedictus, R. Using acoustic emission to understand fatigue crack growth within a single load cycle. Eng. Fract. Mech. 2018, 194, 281–300. [Google Scholar] [CrossRef] [Green Version]
  5. Thomas, H.M.; Heckel, T.; Hanspach, G. Advantage of a combined ultrasonic and eddy current examination for railway inspection trains. OR Insight 2007, 49, 341–344. [Google Scholar] [CrossRef]
  6. Ketelaere, B.D.; Wouters, N.; Kalfas, L.; van Belleghem, R.; Saeys, W. A fresh look at computer vision for industrial quality control. Qual. Eng. 2022, 34, 152–158. [Google Scholar] [CrossRef]
  7. Cheng, F. Research on Pavement Crack Detection Based on Computer Vision; Beijing Jiaotong University: Beijing, China, 2018. [Google Scholar]
  8. Ding, S.Y. Analysis and prevention of cracks in t-beam of post tensioned France railway. Sci. Technol. Inf. 2014, 9, 276–277. [Google Scholar]
  9. Mathews, R.P.; Panicker, M.R.; Hareendranathan, A. vid-SAMGRAH: A PyTorch framework for multi-latent space reinforcement learning driven video summarization in ultrasound imaging. Softw. Impacts 2021, 10, 100185. [Google Scholar] [CrossRef]
  10. Akhmatovich, K.; Turakulovich, K.Z.; Zokir, I.S.u.; Husniya, S. Normalization of facial occlusion in face recognition. Int. J. Innov. Technol. Explor. Eng. (IJITEE) 2019, 8, 2523–2527. [Google Scholar] [CrossRef]
  11. Hassan, M.; Shaikh, M.S.; Jatoi, M.A. Image quality measurement-based comparative analysis of illumination compensation methods for face image normalization. Multimed. Syst. 2021, 28, 511–520. [Google Scholar] [CrossRef]
  12. Chen, X.L.; Lian, Q.W.; Chen, X.L.; Shang, J. Surface crack detection method for coal rock based on improved YOLOv5. Appl. Sci. 2022, 12, 9695. [Google Scholar] [CrossRef]
  13. Yang, Z.; Li, L.; Luo, W.T. PDNet: Improved YOLOv5 Nondeformable disease detection network for asphalt pavement. Comput. Intell. Neurosci. 2022, 2022, 5133543. [Google Scholar] [CrossRef]
  14. Xu, Q.Q.; Zhu, Z.Y.; Ge, H.L.; Zhang, Z.; Zang, X. Effective face detector based on YOLOv5 and superresolution reconstruction. Comput. Math. Methods Med. 2021, 2021, 7748350. [Google Scholar] [CrossRef]
  15. Deng, T.M.; Liu, X.H.; Mao, G.T. Improved YOLOv5 based on hybrid domain attention for small object detection in optical remote sensing images. Electronics 2022, 11, 2657. [Google Scholar] [CrossRef]
  16. Chen, K.; Wang, S.; Cao, H. A new artificial intelligence recognition technology based on convolutional neural networks. In Proceedings of the 2022 IEEE 23rd International Symposium on a World of Wireless, Mobile and Multimedia Networks (WoWMoM), Belfast, UK, 4–17 June 2022; pp. 515–520. [Google Scholar] [CrossRef]
  17. Wu, R.; Li, S.; Du, D.; Liu, W. Patent Application, Processing Method and Apparatus for Single-Channel Convolution Layer, and Processing Method and Apparatus for Multi-Channel Convolution Layer, for Approval (USPTO 20150371359). USPTO 20150371359, 24 December 2015. [Google Scholar]
  18. Ai, T.; Shi, J.F.; Xiang, W. Application of the improved AlexNet model in the detection of glass shell defects. Manuf. Autom. 2020, 42, 54–56+60. [Google Scholar]
  19. Li, C.; Wang, Q.; Liu, X.B.; Hu, B. An attention-based CoT-ResNet with channel shuffle mechanism for classification of alzheimer’s disease levels. Front. Aging Neurosci. 2022, 14, 930584. [Google Scholar] [CrossRef]
  20. Ma, Z.Y.; Chang, D.L.; Li, X.X. Channel max pooling layer for fine-grained vehicle classification. arXiv 2019, arXiv:1902.11107. [Google Scholar]
  21. Qu, Z.J.; Yuan, S.G.; Chi, R.; Chang, L.C.; Zhao, L. Genetic optimization method of pantograph and catenary comprehensive monitor status prediction model based on Adadelta deep neural network. IEEE Access 2019, 7, 23210–23221. [Google Scholar] [CrossRef]
  22. Yue, X.C.; Liu, Q.C. Improved FunkSVD algorithm based on RMSProp. J. Circuits Syst. Comput. 2022, 31, 2250139. [Google Scholar] [CrossRef]
  23. Zeiler, M.D. ADADELTA: An adaptive learning rate method. arXiv 2012, arXiv:1212.5701. [Google Scholar]
  24. Lv, J.X.; Yan, L.J.; Chu, S.C.; Cai, Z.-M.; Pan, J.-S.; He, X.-K.; Xue, J.-K. A new hybrid algorithm based on golden eagle optimizer and grey wolf optimizer for 3D path planning of multiple UAVs in power inspection. Neural Comput. Appl. 2022, 34, 11911–11936. [Google Scholar] [CrossRef]
  25. Abdeljawad, A.; Grohs, P. Integral representations of shallow neural network with rectified power unit activation function. Neural Netw. 2022, 155, 536–550. [Google Scholar] [CrossRef] [PubMed]
  26. Njima, W.; Zayani, R.; Ahriz, I.; Terre, M.; Bouallegue, R. Beyond stochastic gradient descent for matrix completion based indoor localization. Appl. Sci. 2019, 9, 2414. [Google Scholar] [CrossRef] [Green Version]
  27. Matore, M.E.E.M. Rasch model assessment for bloom digital taxonomy applications. Comput. Mater. Contin. 2021, 68, 1235–1253. [Google Scholar] [CrossRef]
  28. An, F.P.; Liu, J.E. Pedestrian re-identification algorithm based on visual attention-positive example generation network deep learning model. Inf. Fusion 2022, 86–87, 136–145. [Google Scholar] [CrossRef]
  29. Zachary, D.; Locke, E.; Hoda, M.; Moravek, D.; Phan, K.; Stratton, A.; Kingwell, S.; Wai, E.K.; Phan, P. Using a national surgical database to predict complications following posterior lumbar surgery and comparing the area under the curve and F1-score for the assessment of prognostic capability. Spine J. 2021, 21, 1135–1142. [Google Scholar] [CrossRef]
  30. AlBeladi, A.A.; Muqaibel, A.H. Evaluating compressive sensing algorithms in through-the-wall radar via F1-score. Int. J. Signal Imaging Syst. Eng. 2018, 11, 164–171. [Google Scholar] [CrossRef]
  31. Chen, H.; Bohush, S.I.R.; Ablameyko, S. Choice of activation function in convolutional neural networks for person re-identification in video surveillance systems. Program. Comput. Softw. 2022, 48, 312–321. [Google Scholar] [CrossRef]
  32. Peng, C.J.; Li, T.T.; Hou, Y.R.; Xu, H.M. Research status and development trends of crack recognition based on machine learning. Sci. GuangXi 2021, 28, 215–228. [Google Scholar] [CrossRef]
  33. Baldassarre, G.; Santucci, V.G.; Cartoni, E.; Caligiore, D. The architecture challenge: Future artificial-intelligence systems will require sophisticated architectures, and knowledge of the brain might guide their construction. Behav. Brain Sci. 2017, 40, e254. [Google Scholar] [CrossRef]
Figure 1. Gradient descent simulation process of AdaDelta optimizer.
Processes 11 01208 g001
Figure 2. Relationship between recall rate and precision rate.
Processes 11 01208 g002
Figure 3. Negative example predicted as positive by Yolov5.
Processes 11 01208 g003
Figure 4. The relationship between accuracy and confidence in VGG16.
Processes 11 01208 g004
Figure 5. The image before pooling.
Processes 11 01208 g005
Figure 6. The image after pooling.
Processes 11 01208 g006
Figure 7. Planar feature mapping simulation process.
Processes 11 01208 g007
Table 1. Hyper parameter settings for the first part of the study model.
ModelBatchInitial Learning RateOptimizerTraining Cycles
Yolov5160.01SGD100
VGG16160.01RMSProp100
C-Alex160.01AdaDelta100
Table 2. Various evaluation parameters of the three models.
ModelPrecision AccuracyRecallF1-ScoreConfidence Score
Yolov50.98750.99240.99740.99240.63
VGG160.97700.97610.97520.97610.83
C-Alex0.98510.98830.99160.98850.71
Table 3. Model Hyper parameter settings in the second part of the study.
ModelBatchInitial Learning Rate Optimizer Training Epochs
Yolov540.01SGD10
VGG1640.01Rmsprop10
C-Alex40.01AdaDelta10
Table 4. Parameters evaluated for each of the three models through the test set.
ModelPrecisionAccuracyRecallF1-ScoreConfidence Score
yolov50.860.90.840.930.31
VGG160.690.740.890.820.58
C-Alex0.960.930.90.920.54
Disclaimer/Publisher’s Note: The statements, opinions and data contained in all publications are solely those of the individual author(s) and contributor(s) and not of MDPI and/or the editor(s). MDPI and/or the editor(s) disclaim responsibility for any injury to people or property resulting from any ideas, methods, instructions or products referred to in the content.

