Article

Development of a Zero-Dimensional Model for a Low-Speed Two-Stroke Marine Diesel Engine with Exhaust Gas Bypass and Performance Evaluation

1
Maritime College, Tianjin University of Technology, Tianjin 300384, China
2
College of Power and Energy Engineering, Harbin Engineering University, Harbin 150001, China
3
Department of Thermal and Fluid Engineering, Faculty of Engineering Technology (ET), University of Twente, 7522 NB Enschede, The Netherlands
4
Dalian Marine Diesel Co., Ltd., Dalian 116083, China
*
Author to whom correspondence should be addressed.
Processes 2023, 11(3), 936; https://doi.org/10.3390/pr11030936
Submission received: 16 January 2023 / Revised: 11 March 2023 / Accepted: 16 March 2023 / Published: 19 March 2023
(This article belongs to the Section Energy Systems)

Abstract

:
Most large commercial vessels are propelled by low-speed two-stroke diesel engines due to their fuel economy and reliability. With increasing international concern about emissions and the rise in oil prices, improvements in engine efficiency are urgently needed. In the present work, a zero-dimensional model for a low-speed two-stroke diesel engine is developed that considers the exhaust gas bypass and geometry structures for the gas exchange model. The model was applied to a low-speed two-stroke 7G80 ME-C9 marine diesel engine and validated with engine shop test data, which consisted of the main engine performance parameters and cylinder pressure diagrams at different loads. The simulation results were in good agreement with the experimental data. Thus, the model has the ability to predict engine performance with good accuracy. After model validation, the variations in compression ratio, fuel injection timing, exhaust gas bypass valve opening portion, exhaust valve opening timing, and exhaust valve closing timing effects on engine performance were tested. Finally, the influence level of different parameters on engine performance was summarized, which can be used as a reference to determine the reasons for high fuel consumption in some cases. The developed engine performance model is considerable in digital twins for performance simulation, health management, and optimization.

1. Introduction

The shipping industry faces a number of challenges from policies, regulations, and operation competition, including decarbonization, non-GHG emissions reduction, the rise in fuel price, and the increasingly stringent IMO and regional (emission control zones) emission regulations [1,2,3,4,5]. The advancement in digital twins can be combined with health management, fault diagnosis, engine energy efficiency evaluation, and optimization to help deal with the faced challenges in maritime industry [6,7,8,9]. The diesel engine performance model with fast response speed and high accuracy is vital and the basis of digital twins. Thus, based on the engine performance model, improving engine efficiency and reducing emissions can be an effective way to achieve energy savings and emissions reduction. In the past few decades, diesel engines have attained a leading position in marine applications, where more than 99% of large commercial vessels adopt low-speed two-stroke diesel engines as the prime mover for their propulsion systems, because of the advantages of fuel economy and reliability [10,11]. Meanwhile, the two-stroke diesel engine consumes most of the fuel in an ocean-going ship [1,12], so improving the efficiency of the two-stroke diesel engine is especially important for ship fuel savings. Thus, research work should be conducted to study the low-speed two-stroke diesel engine’s performance and reduce fuel consumption [1,13,14,15].
Improvements in the efficiency of the engine can be obtained in design and operation [1,14,16]. In the design respect, engine manufacturers have conducted a great deal of work. For fuel injection timing, exhaust valve opening (EVO) timing and exhaust valve closing (EVC) timing, the camshaft control is replaced by electronic control to improve the engine efficiency of the design operation point. Furthermore, innovative combustion systems with innovative injection strategies [17,18] as well as alternative fuels [19] can improve CO2 and other emissions (especially NOx emissions). Meanwhile, electronic control makes it much easier to adjust the injection timing, EVO timing, and EVC timing, which makes it more meaningful to study the effect of parameter variation effects on engine performance.
The exhaust boiler, waste heat recovery system, and turbocharge system are used to utilize exhaust energy to improve the whole efficiency of the ship. With the objective of improving engine performance at low loads, retrofitting packages for turbochargers and the implementation of variable geometry turbines have also been presented [10].
Experimental research is quite expensive and time-consuming due to the large size of the low-speed two-stroke diesel engine. Meanwhile, it costs much less to develop an engine model to study engine performance in the design and operation phases. Recently, more and more scholars and companies are paying attention to engine performance analysis, operation optimization, and health management, which are the same concepts to a certain extent [20,21,22,23,24,25]. Therefore, this paper aims at providing theoretical insights into the low-speed two-stroke diesel engine’s thermal performance, which will be helpful for the design and operation of the engine in practice.
According to different application scenarios and research purposes, different types of diesel engine models were developed, such as the mean value engine model (MVEM), zero-dimensional model, one-dimensional model, and three-dimensional model [1,26]. MVEMs are usually used in marine engine simulators and the simulation of the whole propulsion system, where a fast calculation speed is needed for real-time responses. With the in-cylinder thermodynamic processes simplified as a continuous flow process, MVEMs are able to simulate the average performance of engine parameters over the whole operating cycle, but the crank angle based on parameters such as the in-cylinder pressure, temperature, exhaust gas mass flow rate, and scavenging air mass flow rate cannot be captured [27,28,29,30,31]. There were several investigations where parts of the sub-models were developed in one-dimensional form and with very good results [32,33,34]. These models are used when engine detection fails or to improve engine diagnosis, including the viability of zero-dimensional models of some devices connected with more complex one-dimensional engine models. For the engine’s thermal performance evaluation, one-dimensional models permit little improvement in the engine’s thermal performance simulation, but they increase the model’s complexity and calculation time. Three-dimensional models consider the working medium variation in spatial distribution and usually use CFD to simulate the spatial distribution of pressure and temperature. They are usually associated with high accuracy and used in the design of engine components. However, they simulate only a part of the engine system, such as the cylinder, gas exchange period, and vibration, due to model’s complexity and calculation time [35,36,37,38,39,40]. Zero-dimensional models are widely used in the study of engines’ thermal performance because they are capable of predicating the in-cylinder parameters as well as the average performance of the whole cycle with accuracy and a suitable calculation time [41,42,43,44,45,46,47]. Thus, the zero-dimensional model is a good solution for diesel engine performance analysis and optimization, regardless of the accuracy or calculation time.
Larsen et al. [48] developed a zero-dimensional model that was validated and had high accuracy regarding the exhaust temperature for the research of waste heat recovery systems, but the gas exchange period was not considered. Payri et al. [49] built a zero-dimensional model between intake valve closing and EVO, which, however, could not be used to analyze some parameters’ variation effects on engine system performance, such as that of the turbocharger. Hountalas [50] built an engine model considering the turbocharger and applied it to a two-stroke diesel engine. In addition, the model studied the engine performance under faults. However, the gas exchange model was built with a great deal of simplification and could not predict the scavenge receiver pressure, exhaust receiver pressure, and transient inlet and outlet mass flow rates, as well as their effects on engine performance. Lamaris et al. [10] developed a zero-dimensional model and a diagnostic model technique for marine diesel engines, which also entailed a large amount of simplification for the gas exchange.
The models mentioned above have permitted a great deal of work on engine models and performance analysis based on engine engineering principles. According to different purposes, the diesel engine has been simplified to different degrees. Scholars have conducted a large amount of research on the performance of diesel engines, especially the in-cylinder process, using zero-dimensional, quasi-dimensional, and three-dimensional models. This achievement in digital twins offers a solution with less time and cost in dealing with health management, performance evaluation, and optimization, the challenges faced in the shipping industry. Thus, a diesel engine performance model with fast response speed and high accuracy is vital. In this study, a zero-dimensional model that considers a detailed gas exchange model, as well as an EGB model, is established for a low-speed two-stroke diesel engine. Then, the model is applied to a two-stroke marine diesel engine and validated with shop test measurements on the main engine performance parameters, as well as cylinder pressure diagrams at different loads. Finally, the effects of the compression ratio, fuel injection timing, exhaust gas bypass valve opening portion, exhaust valve opening timing, and exhaust valve closing timing variations on engine performance are studied and summarized. The model established can be used as a platform for the development of digital twins, which can reduce the time and cost compared with those of engine performance optimization based on experiments.

2. Model Description

Figure 1 shows a schematic of a low-speed two-stroke diesel engine with EGB. This section introduces the main hypotheses and the engine cylinder model, as well as sub-models such as the turbocharger model, scavenge and exhaust receiver models, and the gas properties model to provide the thermal boundary to the cylinder model.

2.1. Basic Hypotheses

  • The pressure is assumed to be uniform in the cylinder, scavenge receiver, and exhaust receiver, as the velocities of both fluid and flame are much smaller than that of sound [49,51].
  • Perfect gas behavior is assumed. This assumption is reasonable for thermal performance calculation since the errors are negligible [52].
  • Two species of gas medium, air and stoichiometric combustion products, are considered [51]. All gas is considered the mixing of air and stoichiometric combustion products.
  • A mean uniform temperature is assumed for the calculation of internal energy, which provides sufficient accuracy for the thermal performance simulation of the engine system [51].

2.2. Engine Cylinder Model

The thermodynamic state in the cylinder is calculated with angular resolution by the energy conservation equation, mass conversation, and the perfect gas state equation [34,51]. The internal energy variation is equal to the sum of work, fuel heat released, heat transfer to the walls, and the energy difference in the incoming and outcoming flows from the scavenge ports and exhaust valves.
The model is specifically established for low-speed two-stroke diesel engines. According to the zero-dimensional model, the energy conservation Equation (1), mass conservation Equation (2), and perfect gas station Equation (3) are as follows:
d U d t = d W d t + d Q H R d t d Q w d t + h i n d m i n d t h o u t d m o u t d t
d m d t = d m i n d t d m o u t d t + d m f d t
p V = m R T
where U is internal energy, W is mechanical work, Q H R is the heat release of fuel, Q w is the heat loss to the cylinder’s surrounding walls, m is mass, h is specific enthalpy, m f is the fuel mass injected into the cylinder, and R is the general gas constant, where the subscripts i n and o u t are the inlet and outlet, respectively.

2.3. Sub-Models

For the calculation of the cylinder temperature, pressure, and mass, some sub-models are needed, which consist of the exhaust receiver model, turbocharger model, air cooler model, scavenge receiver model, etc. These sub-models are the temperature, mass, heat release rate, and heat transfer boundaries of the cylinder model, which are essential for the thermodynamics simulation of the engine.

2.3.1. Exhaust and Scavenge Receivers

The exhaust receiver and scavenge receiver are modeled using the open systems in a control volume [1,51]. By using energy conservation, mass conservation, and perfect gas equations, the dynamic temperatures and pressures of the receivers can be derived. The temperature in the exhaust receiver is very high, so heat transfer is considered. Heat transfer is calculated using a typical Nusselt–Reynolds number correlation for gas in pipes [53], while heat transfer of the scavenge receiver is small that it is not considered, due to the low temperature of the gas in the scavenge receiver.

2.3.2. EGB

In recent years, some low-speed two-stroke diesel engines have been equipped with EGB valves for improved turbocharger efficiency at partial load operation while maintaining the turbocharger speed at safe levels at high loads [31]. The EGB mass is controlled by the EGB valve to adjust the opening area of the valve. The transient EGB mass flow rate is estimated using an adiabatic nozzle as follows [47,49]:
m ˙ b = c b A b x b R b T b , u
where m ˙ is the mass flow rate, c is the flow coefficient, and A is the opening area. Subscript b is the bypass valve, and u is the upstream condition.
Here, x b = 2 k b ( k b 1 ) [ p b , d p b , u 2 k b p b , d p b , u k b + 1 k b ] ; when p b , d p b , u < ( 2 k b + 1 ) k b k b 1 , x b = ( 2 k b + 1 ) k b k b 1 2 k b k b + 1 .
Additionally, k is the specific heat ratio, and subscript d is the downstream condition.

2.3.3. Turbocharger

The complete compressor map and turbine mass flow map were used in the model construction process to ensure that the turbocharger responds to reality during different loads’ simulation or convergence processes. For the application of the diesel engine, there are two turbochargers, whose types are MAN TCA66-21.
The compressor map provides four parameters’ interrelations that determine the compressor’s performance, i.e., the turbocharger speed, corrected flow rate, pressure ratio, and efficiency. If two of the specific parameters are known, the other two can be interpolated according to the database extracted from the state map. Since the parameters of the performance map are given in corrected values, it is necessary to perform a conversion between the corrected and the real values [54]. The power consumption and outlet temperature are derived by using the compressor pressure ratio and efficiency [55].
For the turbine, the flow rate is modeled with the turbine swallowing map, which provides the relation between the swallowing capacity and the expansion ratio. Since there is no efficiency map for modeling, a semi-empirical formula is used, which fits the model well [51] and is as follows:
η t η t , m a x = 0.2124 + 4.5601 v r 4.9414 v r 2 + 1.1779 v r 3
where v r is the speed ratio and η is efficiency. Subscripts t and m a x are the turbine and maximum, respectively.
The gas outlet temperature and the torque of the turbine are calculated by using turbine efficiency, expansion ratio, and turbine mass flow rate [51].
When the diesel engine works at a stable station, the compressor, turbine, and bypass flow rates will achieve mass balance. The mass balance of the turbocharge is different from that in the normal case due to the existence of EGB. There are two turbochargers and two compressors, so the mass balance formulation is as follows:
2 m ˙ c + m ˙ f = 2 m ˙ t + m ˙ b
where subscript c is the compressor.
Turbine speed can be derived from the shaft dynamic equation, which represents the conservation of the angular momentum equation in the shaft line [1,51].

2.3.4. Air Cooler

Air cooler pressure drop and efficiency are functions of mass flow [1]. However, the mass flow rate usually does not have measurement value and fluctuates in the calculation, which will increase the simulation time to a certain extent. Meanwhile, the air cooler mass flow nearly linearly changes with the diesel engine load, so the pressure drop and efficiency can be written with the changes in engine load as
ε = 1 b l 2
p a c = d l 2
where air cooler efficiency ε is defined as
ε = T a , i n T a , o u t T a , i n T c m , i n
where b , d are constants for adjustment with the experimental measurements, l is the engine load, and ∆ is the difference. Meanwhile, subscripts a c , a , c m denote the air cooler, air, and cooling medium, respectively.

2.3.5. Gas Exchange

The gas exchange process includes the exhaust gas expiring into the exhaust receiver and the charged fresh air entering into the cylinder for combustion in the next cycle. The gas exchange has a large influence on the thermodynamic calculation of the diesel engine, especially for low-speed two-stroke diesel engines, because a two-stroke diesel engine does not have separate exhaust and intake processes, as with a four-stroke diesel engine. Meanwhile, the gas exchange determines the temperature and pressure at EVC, which has an important effect on engine compression, combustion, and expansion processes. Gas exchange also affects the exhaust gas temperature and mass flow rates, which in turn influence the operation performance of the turbocharger.
In general, scholars have not considered the change in the opening cross-sectional area of the exhaust valves and the scavenging ports with the crank angle [1,13,56], which will not accurately reflect the actual response process between the cylinder and turbocharger, scavenge and exhaust receivers. In order to simulate the thermal performance more accurately, the exhaust and scavenge process models were developed by considering the inlet and exhaust area changes with the crank angle.
It is similar to calculating the mass flow rates of the exhaust gas exiting and fresh air entering the cylinder. The exhaust and scavenge mass flow rates can be estimated by means of an isentropic flow [47,49]:
m ˙ i n = c i n A i n x i n R i n , u T i n , u
m ˙ o u t = c o u t A o u t x o u t R o u t , u T o u t , u
where x i n = 2 k i n ( k i n 1 ) [ p i n , d p i n , u 2 k i n p i n , d p i n , u k i n + 1 k i n ] and x o u t = 2 k o u t ( k o u t 1 ) [ p o u t , d p o u t , u 2 k o u t p o u t , d p o u t , u k o u t + 1 k o u t ] ; when p o u t , d p o u t , u < ( 2 k o u t + 1 ) k o u t k o u t 1 , x o u t = ( 2 k o u t + 1 ) k o u t k o u t 1 2 k o u t k o u t + 1 .
The instantaneous scavenge ports’ opening area and exhaust valve opening area are as follows:
A i n = H s p B s p s i n β
A o u t = p i · H e c o s σ D e + H e s i n σ c o s σ
where H is the transient opening height, B is the width, β is the inclination of the scavenge ports, p i is the circumference ratio, D is the disc outer diameter, and σ is the exhaust valve seat cone angle. The subscripts s p and e are the scavenge ports and exhaust valve, respectively.

2.3.6. Heat Release Rate

Combustion is very important because it has a large influence on the work and temperature. There are different types of combustion models in the literature. The Wiebe function is one of the best-known models. The double Wiebe function cannot describe the complex fuel–air mixing in the combustion process for the diesel engine, but it can provide a realistic heat release for thermodynamic calculation [56,57], and the double Wiebe function is as follows:
1 ω d Q H R d t = 6.9 Q p c θ p c M p c + 1 θ S O C p c θ p c M p c exp 6.9 θ S O C p c θ p c M p c + 1 + 6.9 Q d c θ d c M d c + 1 θ S O C d c θ d c M d c exp 6.9 θ S O C d c θ d c M d c + 1
where ω is the engine angular velocity, θ is the combustion duration, S O C is the start of combustion, M is the combustion shape factor, and θ is the crank angle degree. The subscripts p c and d c are pre-mixed combustion and diffusion combustion, respectively.

2.3.7. Heat Transfer

The heat transfer between the trapped gas in the cylinder and its surrounding walls is calculated by convective heat transfer, assuming a constant value for the cylinder walls’ temperature [51]:
d Q w d t = α A w T T w
where subscript w is the cylinder wall. For heat transfer coefficient α to the cylinder surrounding walls, the widely used Woschni correlation is applied [1,58]:
α = 127.93 C 0 ( p 10 5 ) 0.8 w 0.8 D 0.2 T 0.53
where w is a representative velocity, which takes the mean piston speed and the combustion-induced turbulence into account. C 0 is a constant to be adjusted for the specified engine according to the experimental data.

2.3.8. Gas Properties

The thermal properties of the gas in the cylinder and its subsystems are considered as the mixture of air and stoichiometric combustion products. The stoichiometric combustion products are determined by fuel composition. The gas properties in the cylinder model and its sub-models are calculated in the following way:
R = R a X a + R s c p X s c p
c v = c v , a X a + c v , s c p X s c p
where X is the mass fraction. The subscript s c p denotes stoichiometric combustion products; c v , a and c v , s c p are calculated using the interpolation database of air and the stoichiometric combustion products of the fuel used [59].

3. Engine Model Setup and Validation

3.1. Model Setup

The engine model was set up by providing the required input data, including the engine geometric parameters, turbine and compressor state maps, model constants, and the initial condition settings. For the initial condition setting, the experimental data were used, such as the temperature and pressure of scavenge and exhaust receivers. The fuel oil used in the experiment was marine diesel oil (MDO), whose lower heating value (LHV) is 42.92 MJ/kg according to the fuel report.
The combustion model was essential to the engine simulation, and the combustion model constants were validated by using the performance parameters from shop trials. The combustion model had eight constants ( S O C p c , θ p c , Q p c , M p c , S O C d c , θ d c , Q d c , and M d c ) to be adjusted. Meanwhile, for the present work, five model constants were set as fixed values or determined by other model constants, such as M p c = 2 , M d c = 0.8 , θ d c = 80 , S O C d c = 0.5 θ p c , and Q d c = 1 Q p c , as suggested by Wang [60]. Thus, only three model constants needed to be adjusted according to the experimental engine performance data. The calibrated combustion model parameters are shown in Table 1.

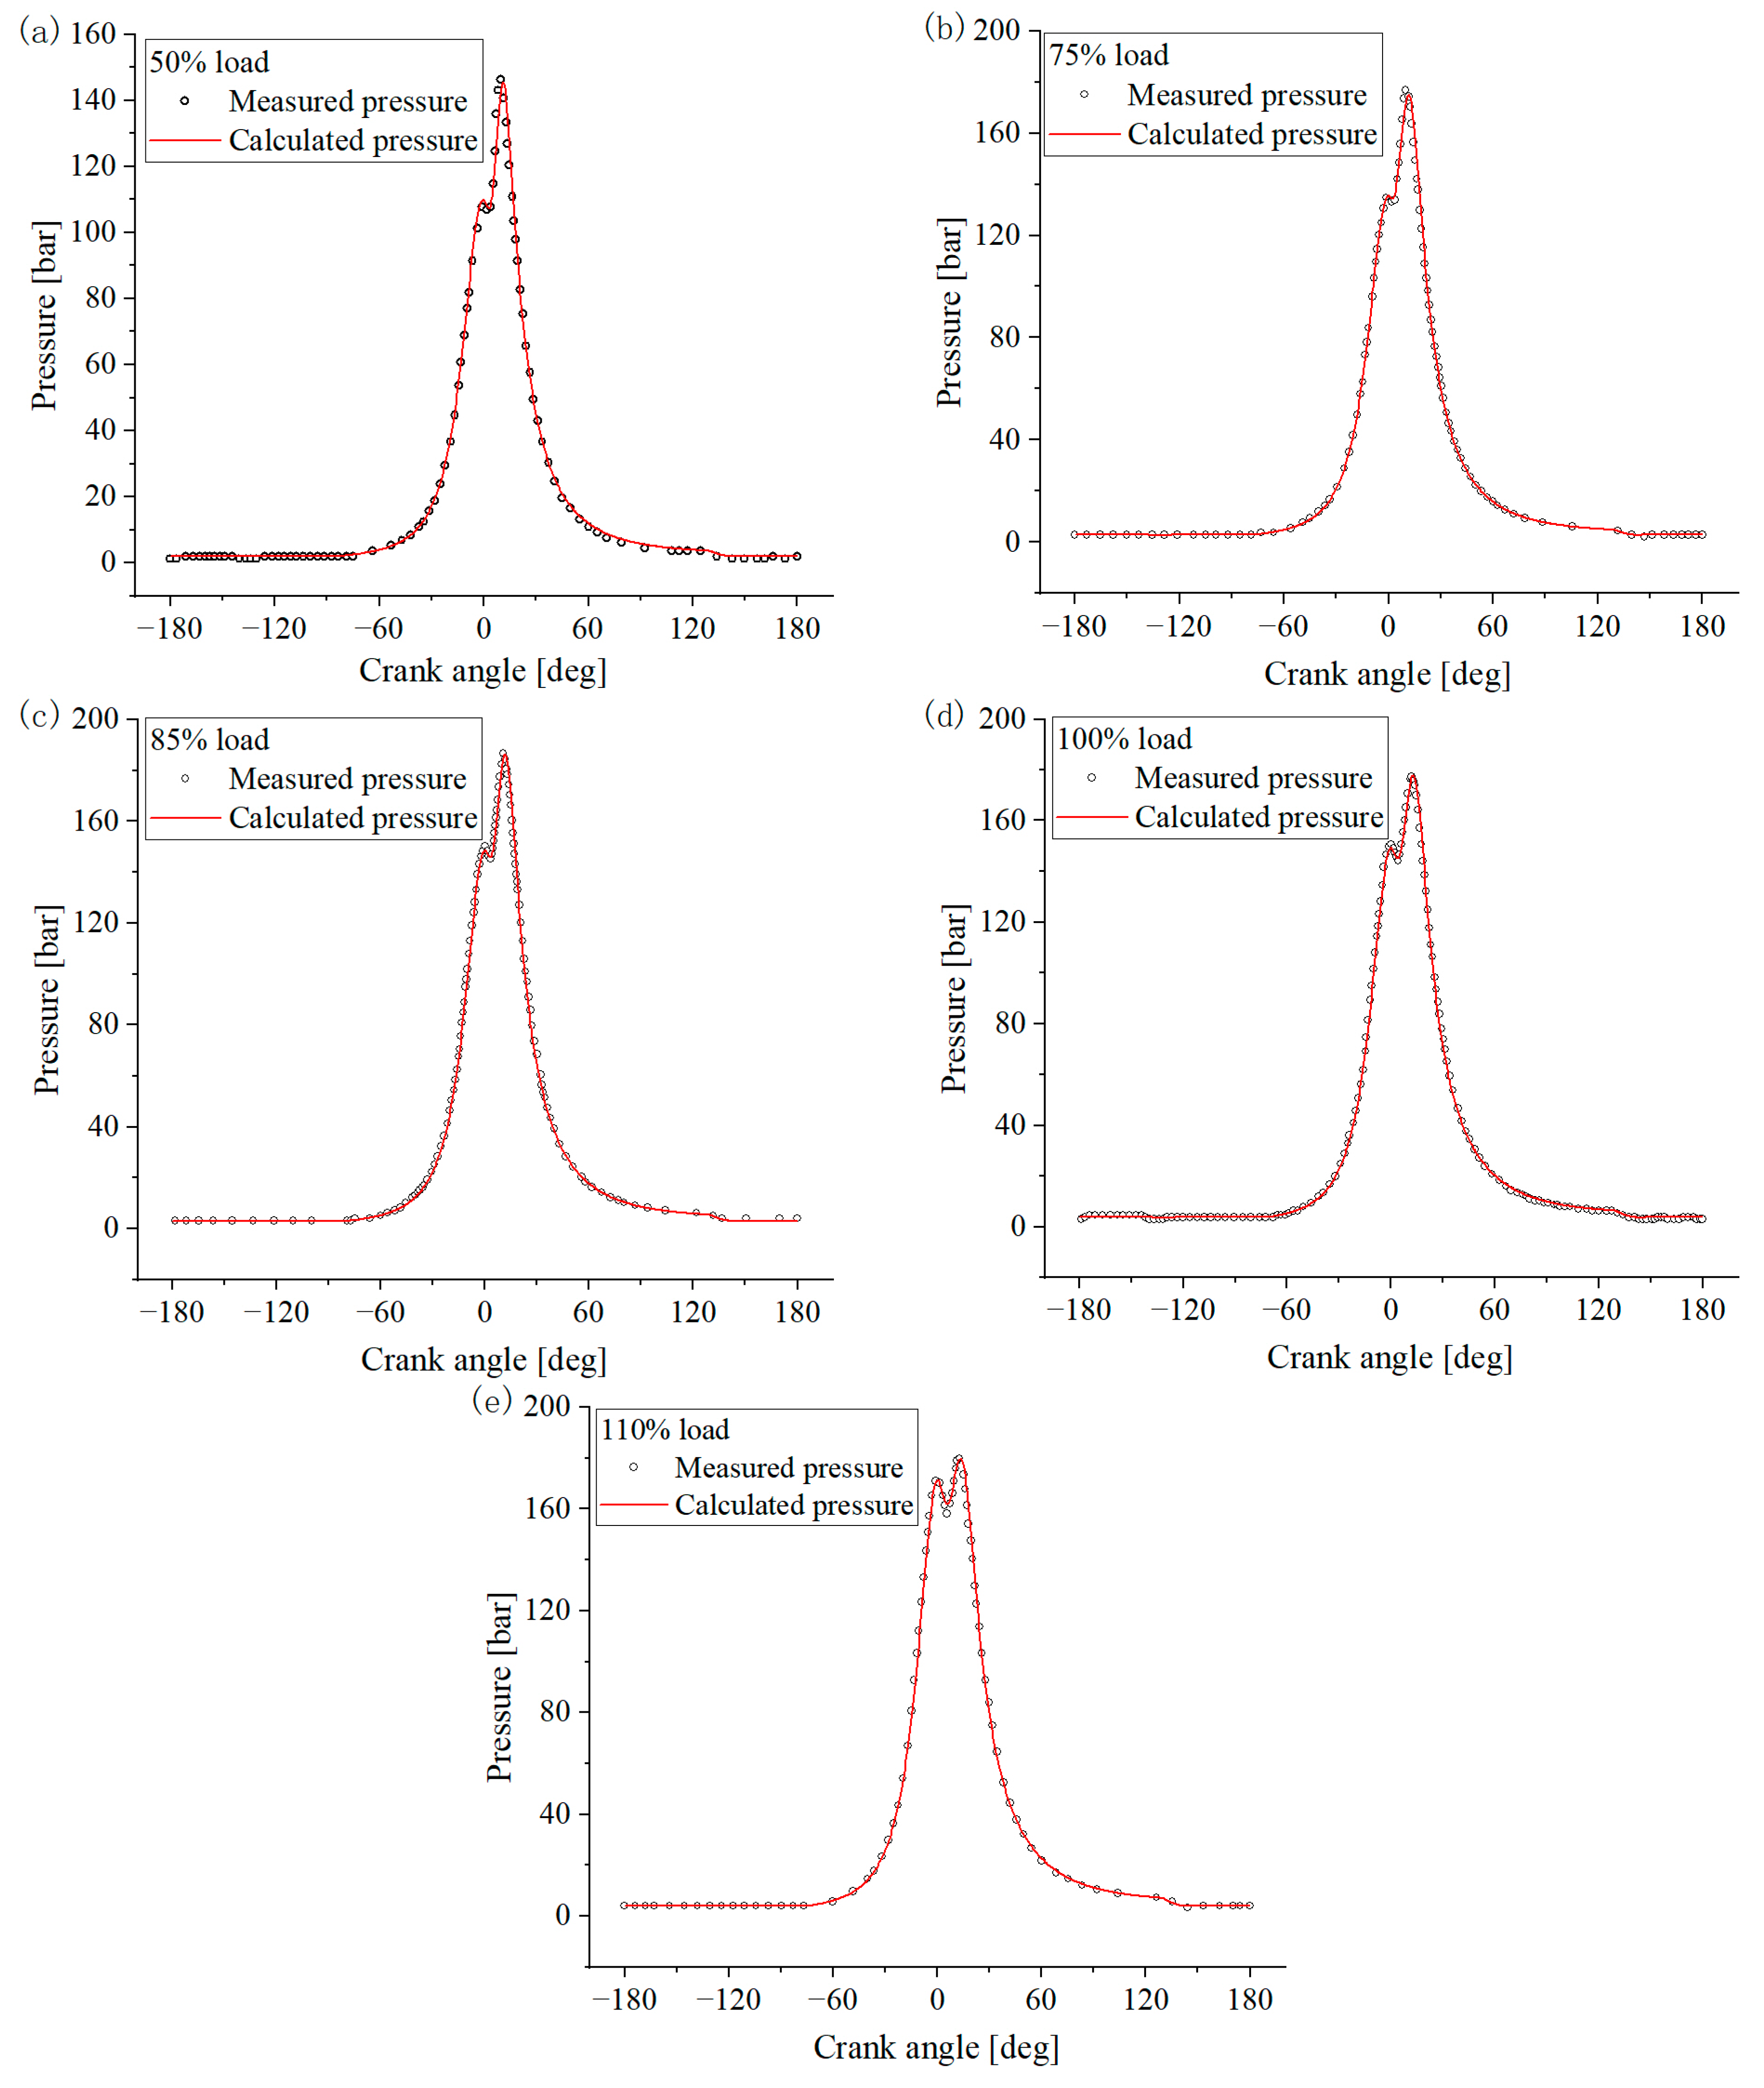
3.2. Model Validation

The proposed model was applied to a low-speed two-stroke diesel engine (7G80 ME-C9.5). Table 2 shows the general characteristics of the diesel engine. The diesel engine consists of seven cylinders in line with a rated power of 21,000 kW at 58 rpm. There are two constant-pressure turbochargers that supply the high-pressure exhaust gas from the exhaust receiver to drive the two turbines to work. In turn, the air is compressed by the two compressors and then cooled by the air coolers before it enters the scavenge receiver. The engine shop test was used in validation, which was obtained from data reports of the official shop trials. Validation of the model was carried out by comparing simulation and experimental main parameters’ mean values and in-cylinder pressure traces.
Figure 2 shows the comparison between the simulation values and the shop test measurements for the main performance parameters at different loads (load 50%, 75%, 85%, 100%, and 110%). The error bars indicate the ±5% tolerance for the SFOC (specific fuel oil consumption) and ±15% tolerance for the exhaust temperature, specified by the manufacturer [48]. It can be seen in Figure 2 that the simulation values of the main performance parameters at different loads were in good agreement with the shop test measurements. Meanwhile, values from the SFOC and the exhaust temperature were all within the error bars.
Cylinder pressure diagrams at different loads (load 50%, 75%, 85%, 100%, and 110%) were used to further verify the model. Figure 3 shows the comparison between the simulation pressure diagrams and the measured pressure values. At different loads, the simulation results were in good agreement with the measurement, which confirmed the ability of the model to predict the main performance parameters and the cylinder pressure with good accuracy. Therefore, it was considered that the model had sufficient accuracy to be used as a simulation platform to simulate thermal performance under different conditions.

4. Results and Discussion

This study had two main goals. One was the validation of the accuracy of the engine model considering the bypass model and geometry structure for the gas exchange model, which was introduced in the previous section. The other one was to analyze the influence of some parameters on the engine performance. It was impossible to analyze the effects of all the types of parameters on engine performance, so only the most common ones were studied. These parameters were either easy to change or changed themselves because of degradation. The expansion process has a large influence on engine power and other main performance parameters, and many marine engine performance management software companies monitor the expansion pressure at a 50-degree crank angle after TDC (top dead center). In the present work, the expansion pressure was defined as the cylinder pressure at a 50-degree crank angle after TDC. The effect of the parameters on engine performance was studied at 21,000 kW at 58 rpm.
The parameters used to analyze their effects on engine performance were as follows:
  • At present, the effect of CR (compression ratio) variations was analyzed. It was studied from 85% to 115% of the normal value (32.7). A variation in CR can be caused by the replacement of the cylinder head gasket connecting the rod gasket and deposit in the cylinder.
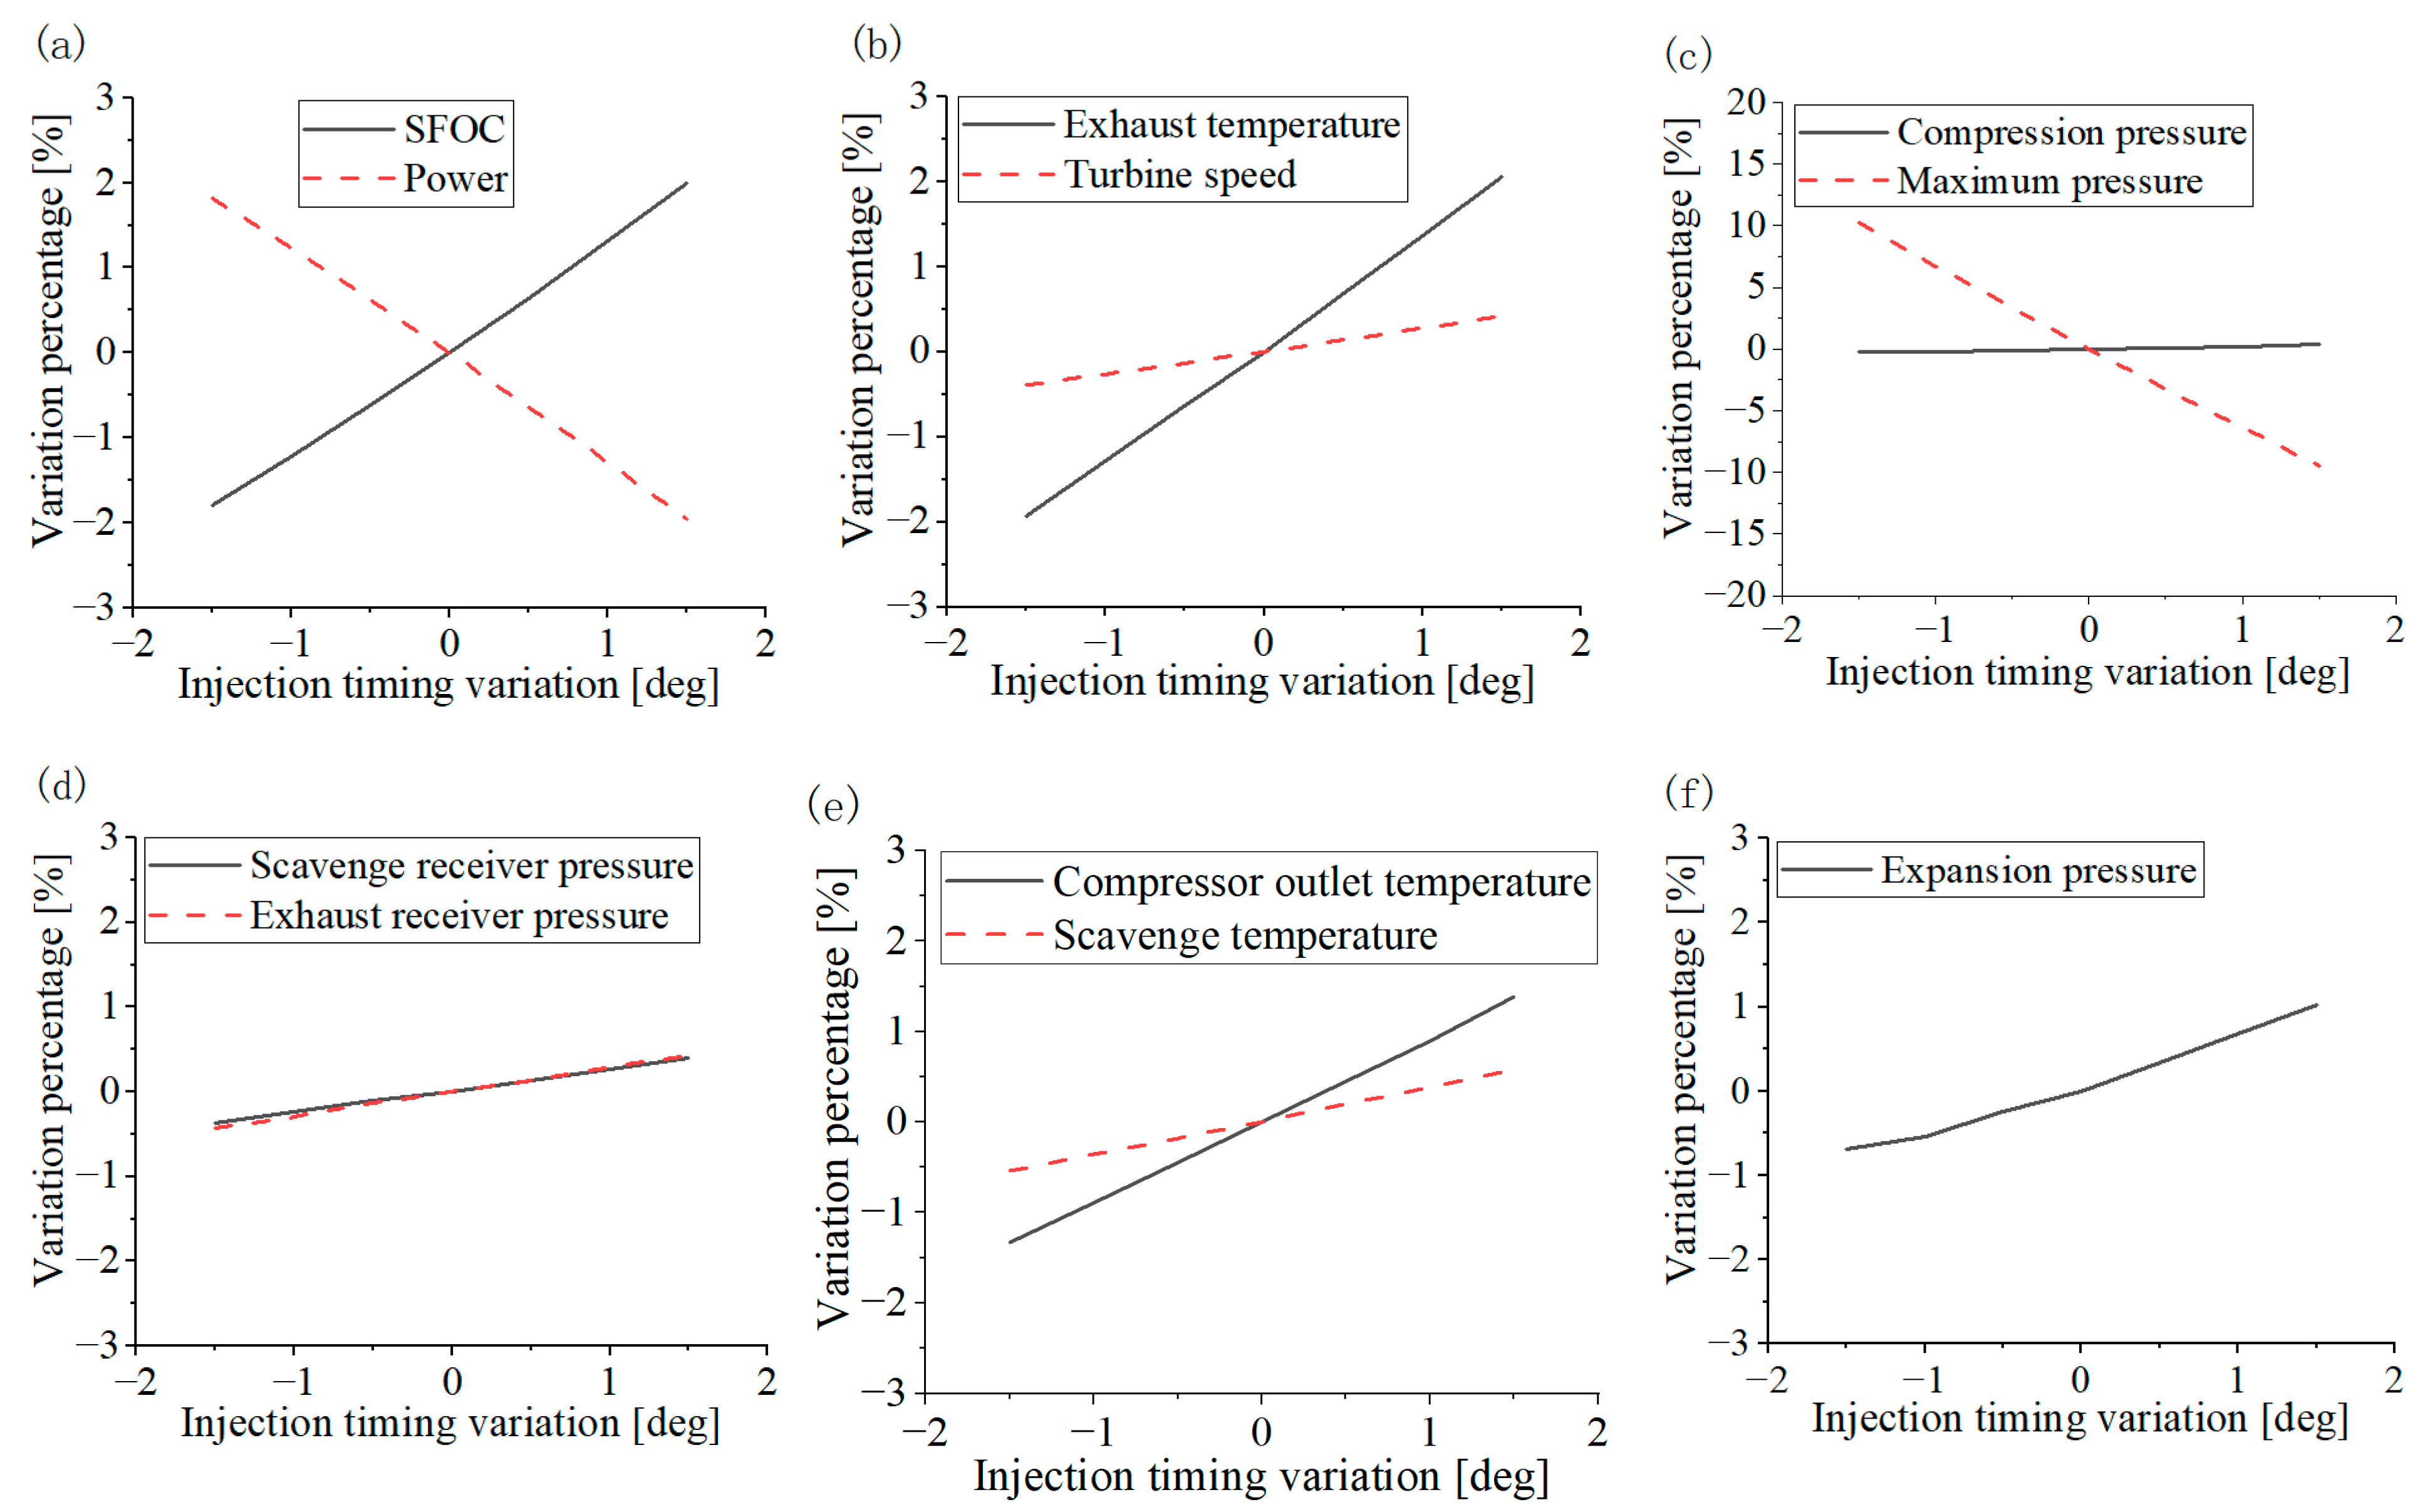
  • The influence of injection timing variations was studied by changing the timing from −1.5 degrees to 1.5 degrees of the normal value. Injection timing can be varied by an electronically controlled fuel unit.
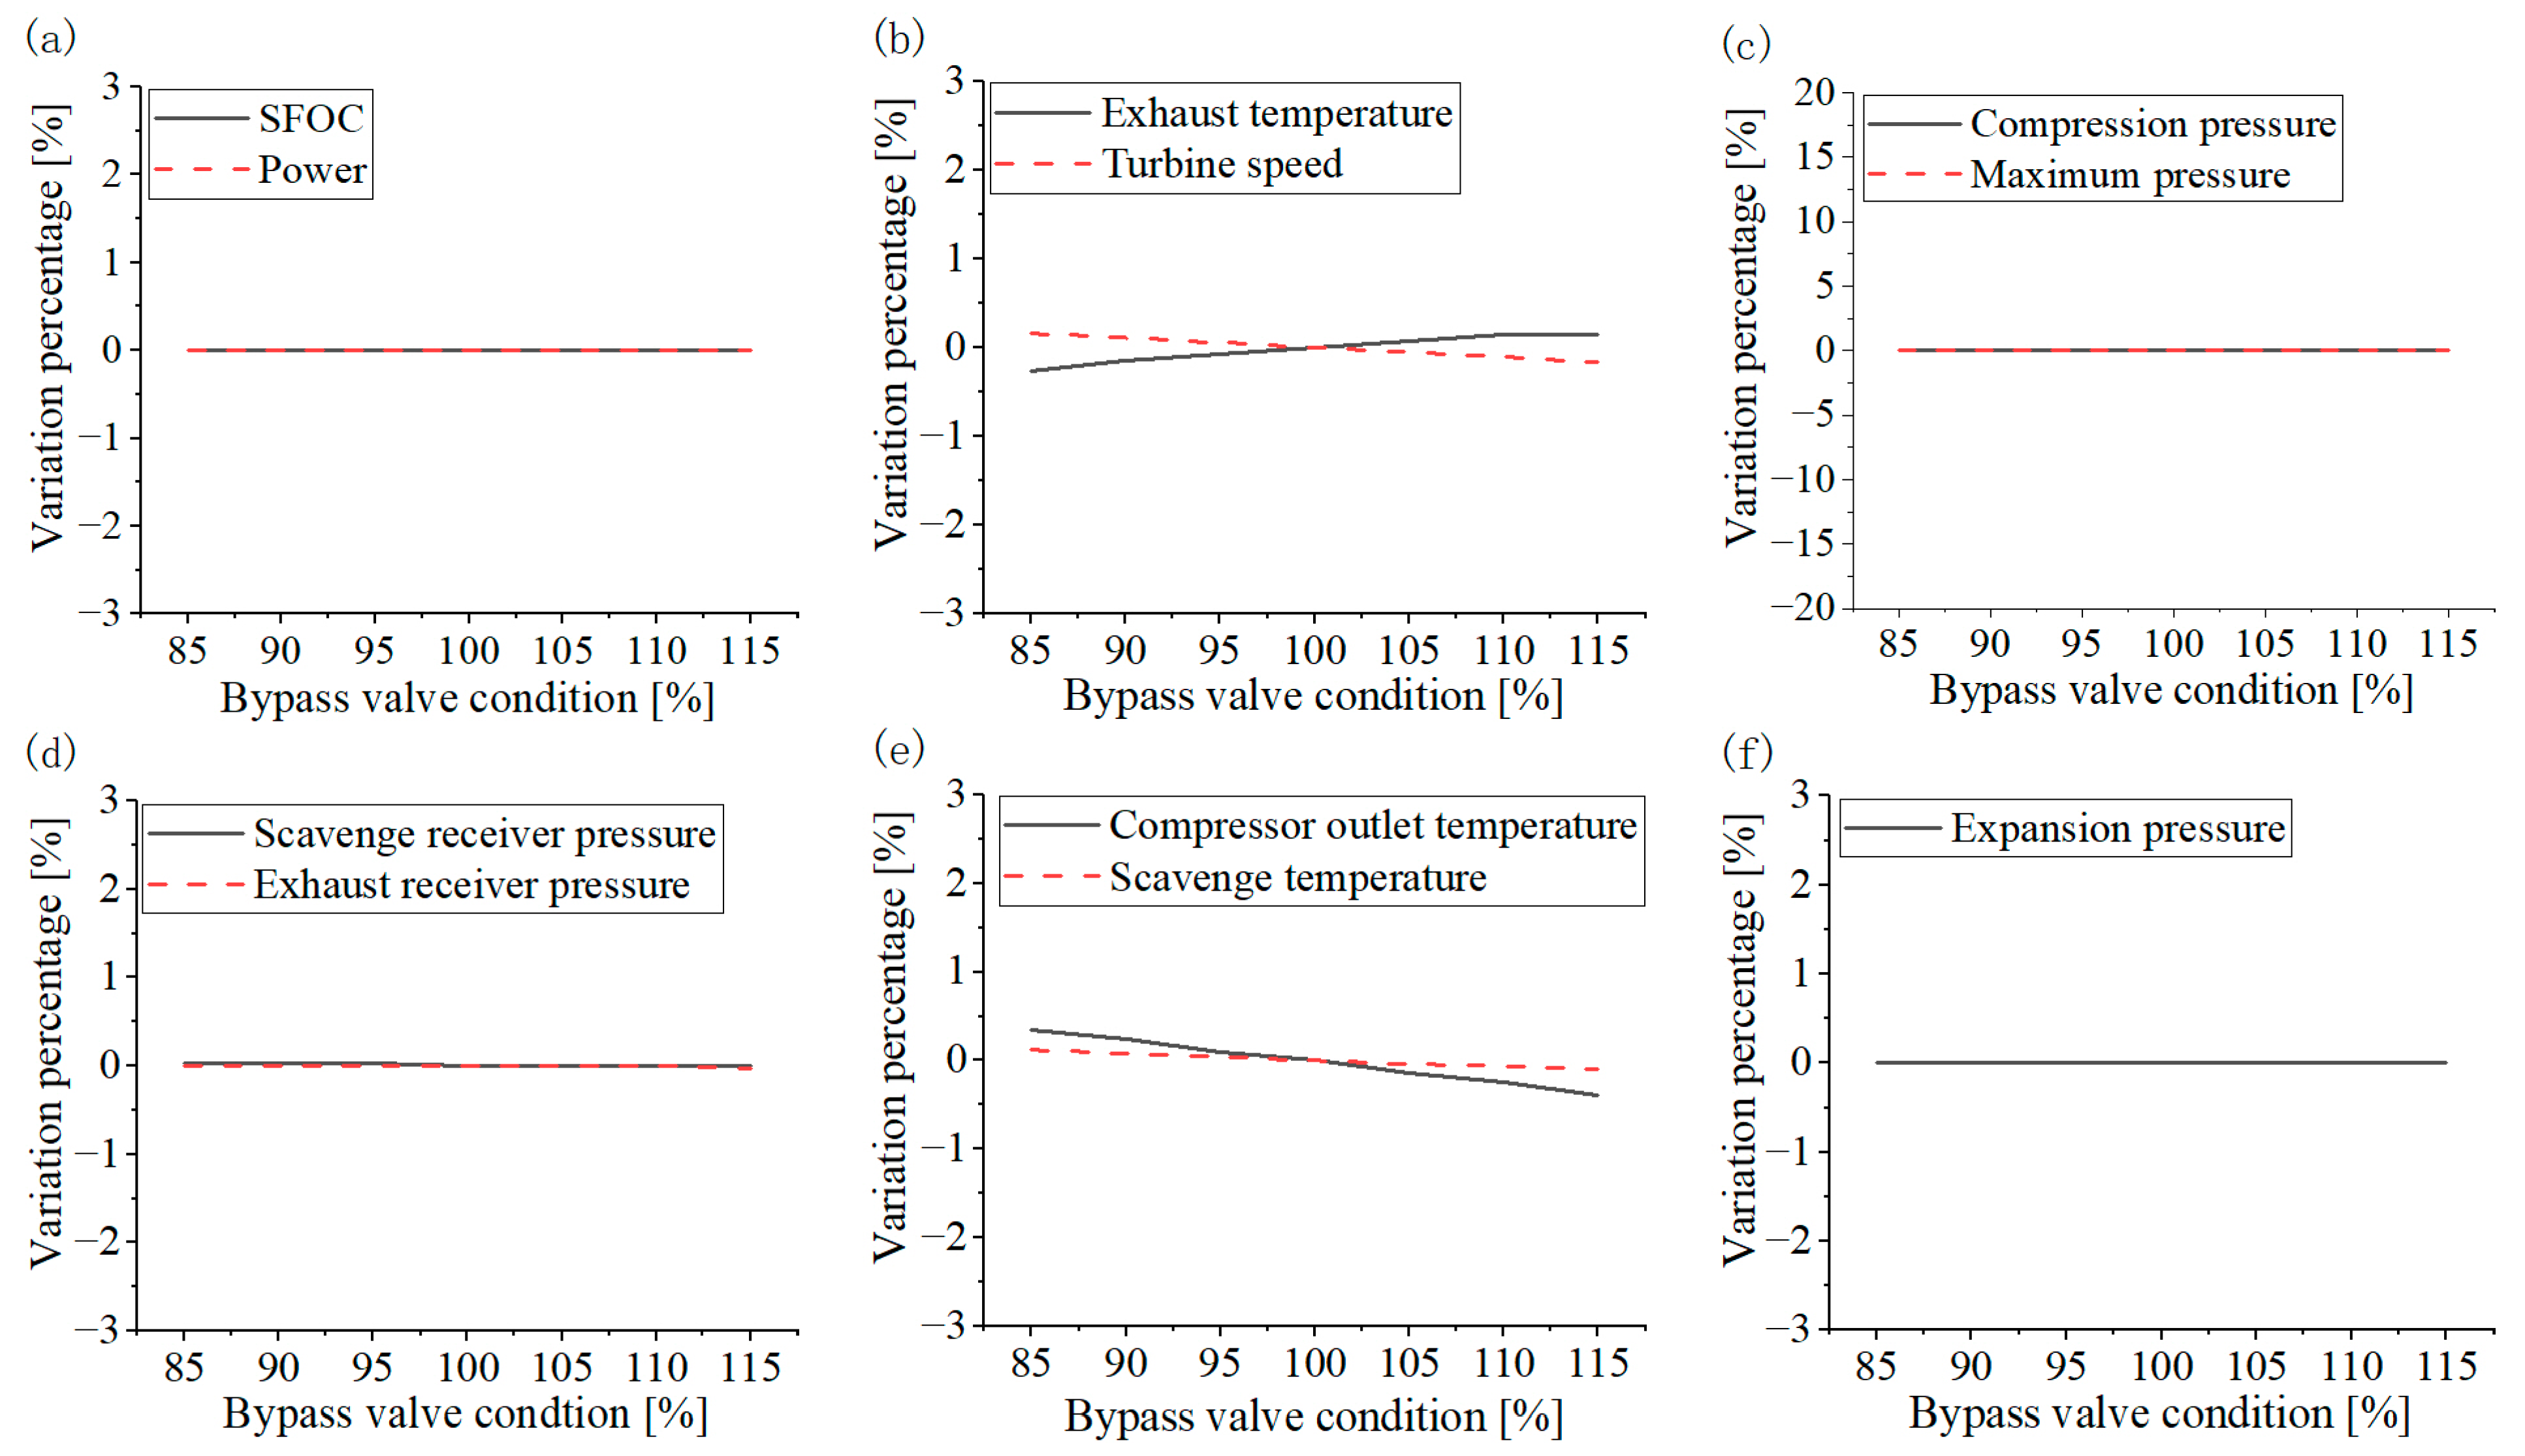
  • The bypass valve effect was discussed by changing the opening portion of the bypass valve. It was analyzed from 85% to 115% of the normal value. The variation in the opening portion may be caused by the electronically controlled EGB valve opening size and deposit in the EGB.
  • The influence of EVC timing variations was considered by changing the timing from −5 degrees to 5 degrees of the normal value. The variations in EVC timing can be adjusted by the electronically controlled valve unit or the poor seal of hydraulic oil for the exhaust valve.
  • The influence of EVO timing variations was investigated by varying the timing from −1 degree to 5 degrees of the normal value. The variations in EVO timing can be controlled by the electronically controlled valve unit or the poor seal of hydraulic oil for the exhaust valve.
For the variation in injection timing, EVC timing and EVO timing, a negative value and positive value indicate the corresponding timing in advance and delay, respectively. The change in the parameters may cause the maximum pressure or temperature to exceed the limits. Due to the theoretical nature of the analysis, the exceeding of mechanical and thermal loads was not considered. In the subsequent discussions, all input parameters in the model were unchanged, except for the parameter variations being studied.

4.1. Effect of Compression Ratio on Engine Performance

Figure 4 shows the engine’s main performance parameters’ variations with CR changes. The variation in CR was 85% to 115% of the normal value.
As shown in Figure 4, with the increase in CR, the SFOC decreased and the power increased. The compression pressure and maximum pressure also increased sharply with the increase in CR, which caused a higher cylinder temperature during the combustion and expansion process and higher power. With more produced power and more heat loss due to the higher mean cylinder temperature, less energy was left for the exhaust gas. Thus, the turbine speed, scavenge receiver pressure, exhaust receiver pressure, compressor outlet temperature, and scavenge temperature all decreased with the increase in CR. However, the expansion pressure almost remained constant with the CR variation. The CR significantly affected most of the performance parameters, as seen in Figure 4.

4.2. Effect of Injection Timing on Engine Performance

It is well known that injection timing has a significant influence on engine performance, such as SFOC, power, and exhaust temperature. Figure 5 reveals the injection timing effect on the engine’s main performance parameters. The variation in injection timing was from −1.5 to 1.5 degrees of the normal value.
As shown in Figure 5, the decrease in the injection timing resulted in a decrease in SFOC and an increase in power and maximum pressure, which was similar to that of the CR increase. However, the compression pressure almost remained stable, which was different from the CR variation. Similar to CR changes, with the decrease in injection timing, more power was produced and more heat was lost to the cylinder walls, so less energy was left for the exhaust gas, resulting in a lower exhaust temperature. Meanwhile, less exhaust gas energy meant that turbine speed, scavenge receiver pressure, exhaust receiver pressure, compressor outlet temperature, and scavenge temperature all decreased with the decrease in injection timing. The expansion pressure also decreased with the injection timing decrease because fuel heat release brought forward caused the pressure to lower in the later stage of the combustion process.

4.3. Effect of EGB Valve on Engine Performance

A few decades ago, marine engines did not have EGB valves. Moreover, there are few studies on the effect of the EGB valve opening portion on an engine’s performance.
Figure 6 shows how the opening proportion of the bypass valve affected the engine’s performance. The variation in the opening proportion of the bypass valve was 85% to 115% of the normal value. As shown in Figure 6, with the increase in opening proportion, the SFOC, power, compression pressure, maximum pressure, scavenge receiver pressure, exhaust receiver pressure, and expansion pressure were almost unchanged. Turbine speed, compressor outlet temperature, and scavenge temperature slightly decreased with the increase in opening proportion due to more exhaust gas passing through the EGB valve and less exhaust gas passing through the turbine. As exhaust gas temperature is the combined gas temperature of the gas after the turbine and the bypass gas, the exhaust gas temperature slightly increased with the opening proportion increase. The opening proportion had little or no effect on the engine’s performance since the bypass mass proportion was very small. The mass flow of bypass was 1.07 kg/s, and the whole exhaust mass flow was 43.13 kg/s at a normal bypass valve setting for the applied engine at 100% load. The bypass valve can be useful for the turbocharger to select the proper operation point with high efficiency and avoid the overspeed of the turbocharger at high loads.

4.4. Effect of EVC Timing on Engine Performance

Recently, electronically controlled valve units have been used to control the EVO and EVC timings instead of cams, which makes it much easier to adjust EVC timing and EVO timing.
The EVC has a strong influence because, for a two-stroke engine, the EVC (and not IVC in four-stroke engines) determines the trapped condition and effective compression ratio. It would be useful for authors to consider these in the future. Figure 7 shows the EVC timing’s influence on the engine’s main performance parameters. The variation range of EVC timing was from −5 degrees to 5 degrees of the normal value. As shown in Figure 7, the later EVC timing caused a sharp decrease in the compression and maximum pressure, because there was less time left for the compression process. In fact, the variation in EVC timing affected the effective compression ratio. Moreover, the SFOC increased and power decreased with the increase in the EVC timing, which was similar to that of the CR decrease. The later the EVC timing, the smaller the effective compression ratio. With less power produced, the exhaust temperature increased with the EVC timing increase, which in turn resulted in the increase in turbine speed, scavenge receiver pressure, exhaust receiver pressure, compressor outlet temperature, and scavenge temperature. Expansion pressure also decreased because the compression pressure and maximum pressure decreased with the increase in EVC timing.
The engine’s fuel consumption could be reduced by properly closing the exhaust valve in advance, which is also confirmed in Figure 2. As shown in Figure 2, the scavenge pressure at 85% load was lower than that at 100% load, but the compression pressure and maximum pressure at 85% load were higher than that at 100% load. Moreover, the SFOC at 85% load was lower than at 100% load. Since the compression ratio was the same, the compression pressure at 85% load was larger than at 100% load because of EVC timing in advance. Although earlier EVC timing reduces fuel consumption, the timing cannot be too early because of the mechanical and thermal load limits of the engine. As shown in Figure 7, EVC timing had a strong effect on most of the engine’s performance parameters.

4.5. Effect of EVO Timing on Engine Performance

Figure 8 reveals the EVO timing’s effect on engine performance. The variation range of EVO timing was from −1 degree to 5 degrees of the normal value. Initially, the range was set from −5 degrees to 5 degrees of the normal value. However, when the variation was smaller than −2 degrees, the cylinder pressure was lower than that of the exhaust receiver pressure when the exhaust valve opened, which was unreasonable.
It can be seen in Figure 8 that the increase in EVO timing scarcely affected the engine performance parameters, except for a slight increase in power and a decrease in SFOC. This result may be different from our expectation that the longer the expansion process, the more power produced. However, the later the exhaust valve opens, the worse the ventilation quality of the cylinder.

4.6. Summary of the Effects of Different Parameters

Table 3 shows the effect levels of different parameter settings on diesel engine performance. A strong positive influence is denoted by ‘‘++’’, a slightly positive effect by ‘‘+’’, a strong negative influence by ‘‘− −’’, a slightly negative effect by ‘‘−’’, and almost no effect by ‘‘ο’’.
As shown in Table 3, fuel consumption decreased with a CR increase, injection timing decrease, or EVC timing decrease. On the other hand, if the engine’s performance parameters deviates largely from the engine reference in the engine manual or the average of all cylinders, some references can be consulted, as shown in Table 3. If a cylinder’s power is much smaller than the average of all cylinders, the reason may be a smaller CR, later injection timing, or later EVC timing. Moreover, if compression pressure, maximum pressure, and expansion pressure are checked, the reason can be found. A later injection timing may be the reason if a cylinder’s maximum pressure is much lower than the average value and its compression pressure is almost the same as the average value. If a cylinder’s compression and maximum pressure are both smaller than the engine’s average value, it may be caused by a smaller CR or later EVC timing. Then, the expansion pressure may be checked, and a smaller CR may be the reason if a cylinder’s expansion pressure is almost the same as the average value. Otherwise, an EVC timing delay may be caused if a cylinder’s expansion pressure is smaller than the average value.

5. Conclusions

In the present work, a zero-dimensional model was developed to simulate an engine’s thermal performance. Exhaust gas bypass was considered in the model. Meanwhile, the geometry of scavenging ports and the exhaust valve was also considered, which can help to simulate different parameters’ effects on engine intake and exhaust mass flows and the turbocharger. The model was applied to a low-speed two-stroke marine diesel engine. The main conclusions of the study are as follows:
(1)
The model validated some engine performance parameters as well as cylinder pressure diagrams at 50%, 75%, 85%, 100%, and 110% load. The results obtained were in good agreement with the measurements. From the comparison of the calculated results with the official shop test, the model has the capability to predict the main performance parameters and the cylinder pressure with good accuracy.
(2)
After validation, the model was used to analyze some parameters’ effects on engine performance. Namely, the effects of compression ratio, injection timing, exhaust gas bypass valve opening portion, exhaust valve closing timing, and exhaust valve opening timing variations on engine performance were studied. Compression ratio, injection timing, and exhaust valve closing timing had strong effects on the engine’s thermal performance, while the exhaust gas bypass valve opening portion and exhaust valve opening timing had little effect on the engine’s main performance.
(3)
The effect level of different parameter settings on diesel engine performance was also examined. From the analysis, a high engine cylinder SFOC may be caused by different factors, such as a smaller CR, later injection timing, and later exhaust valve closing timing. The reason may be determined if the compression pressure, maximum pressure, and expansion pressure are checked further.
The double Wiebe function was adopted in heat release rate prediction in order to have a high speed, which resulted in relatively low accuracy and could not predict complex combustion deterioration. Future research can focus on the phenomenological spray combustion model to improve engine performance efficiency and to better simulate spray and combustion process.

Author Contributions

Conceptualization, D.Z. and Z.S.; methodology, Z.S.; software, D.Z.; validation, D.Z., Z.S. and N.X.; formal analysis, T.Z.; investigation, L.C. and H.S.; resources, L.C. and H.S.; writing—original draft preparation, D.Z.; writing—review and editing, Z.S.; visualization, T.Z.; supervision, Z.S. All authors have read and agreed to the published version of the manuscript.

Funding

This research received no external funding.

Acknowledgments

Special acknowledgement is given to Anders Ivarsson from the Technical University of Denmark for his helpful suggestions and technical support.

Conflicts of Interest

The authors declared no potential conflicts of interest.

Nomenclature

Acronyms
CRCompression ratio
EGBExhaust gas bypass
EVCExhaust valve closing
EVOExhaust valve opening
LHVLower heating value
MDOMarine diesel oil
MVEMMean value engine model
SFOCSpecific fuel oil consumption
TDCTop dead center
Greek symbols
αHeat transfer rate (W/m2·K)
βInclination of scavenge ports (rad)
Difference (-)
θCombustion duration (rad)
εAir cooler efficiency (-)
ηEfficiency (-)
θCrank angle degree (rad)
σExhaust valve seat cone angle (rad)
ωEngine angular velocity (s−1)
Symbols
AArea (m2)
b,C0,dConstant coefficient (-)
BWidth (m)
cFlow coefficient (-)
cvSpecific heat capacity under constant volume (J/kg·K)
DDisc outer diameter (m)
hSpecific enthalpy (J/kg)
HHeight (m)
kSpecific heat ratio (-)
lLoad (-)
mMass (kg)
MCombustion shape factor (-)
m ˙ Mass flow rate (kg/s)
pPressure (Pa)
piCircumference ratio (-)
QHeat (J)
RGas constant (J/kg·K)
SOCStart of combustion (rad)
TTemperature (K)
UInternal energy (J)
VVolume (m3)
v r Speed ratio (-)
wRepresentative velocity
WMechanical work (J)
XMass fraction (-)
Subscripts
aAir
acAir cooler
bBypass valve
cCompressor
cmCooling medium
dDownstream
dcDiffusion combustion
eExhaust valve
fFuel
HRHeat release
inInlet
maxMaximum
outOutlet
pcPre-mixed combustion
scpStoichiometric combustion products
spScavenge ports
tTurbine
uUpstream
wWall

References

  1. Baldi, F.; Theotokatos, G.; Andersson, K. Development of a combined mean value–zero dimensional model and application for a large marine four-stroke Diesel engine simulation. Appl. Energy 2015, 154, 402–415. [Google Scholar] [CrossRef] [Green Version]
  2. García-Martos, C.; Rodríguez, J.; Sánchez, M.J. Modelling and forecasting fossil fuels, CO2 and electricity prices and their volatilities. Appl. Energy 2013, 101, 363–375. [Google Scholar] [CrossRef] [Green Version]
  3. Zhang, C.; Chen, X. The impact of global oil price shocks on China’s bulk commodity markets and fundamental industries. Energy Policy 2014, 66, 32–41. [Google Scholar] [CrossRef] [Green Version]
  4. Zhang, Y.-J.; Wang, Z.-Y. Investigating the price discovery and risk transfer functions in the crude oil and gasoline futures markets: Some empirical evidence. Appl. Energy 2013, 104, 220–228. [Google Scholar] [CrossRef]
  5. MEPC 63/INF2. Air Pollution and Energy Efficiency-Estimated CO2 Emissions Reduction from Introduction of Mandatory Technical and Operational Energy Efficiency Measures for Ships. IMO: London, UK, 2011.
  6. Tsitsilonis, K.-M.; Theotokatos, G.; Patil, C.; Coraddu, A. Health assessment framework of marine engines enabled by digital twins. Int. J. Engine Res. 2023, 14680874221146835. [Google Scholar] [CrossRef]
  7. Stoumpos, S.; Theotokatos, G. A novel methodology for marine dual fuel engines sensors diagnostics and health management. Int. J. Engine Res. 2021, 23, 974–994. [Google Scholar] [CrossRef]
  8. Hautala, S.; Mikulski, M.; Söderäng, E.; Storm, X.; Niemi, S. Toward a digital twin of a mid-speed marine engine: From detailed 1D engine model to real-time implementation on a target platform. Int. J. Engine Res. 2022, 14680874221106168. [Google Scholar] [CrossRef]
  9. Stoumpos, S.; Theotokatos, G.; Mavrelos, C.; Boulougouris, E. Towards Marine Dual Fuel Engines Digital Twins—Integrated Modelling of Thermodynamic Processes and Control System Functions. J. Mar. Sci. Eng. 2020, 8, 200. [Google Scholar] [CrossRef] [Green Version]
  10. Lamaris, V.; Hountalas, D. A general purpose diagnostic technique for marine diesel engines—Application on the main propulsion and auxiliary diesel units of a marine vessel. Energy Convers. Manag. 2010, 51, 740–753. [Google Scholar] [CrossRef]
  11. Wang, D.; Shi, L.; Zhu, S.; Liu, B.; Qian, Y.; Deng, K. Numerical and thermodynamic study on effects of high and low pressure exhaust gas recirculation on turbocharged marine low-speed engine. Appl. Energy 2020, 261, 114346. [Google Scholar] [CrossRef]
  12. Baldi, F.; Johnson, H.; Gabrielii, C.; Andersson, K. Energy Analysis of Ship Energy Systems—The Case of a Chemical Tanker. Energy Procedia 2014, 61, 1732–1735. [Google Scholar] [CrossRef] [Green Version]
  13. Tang, Y.; Zhang, J.; Gan, H.; Jia, B.; Xia, Y. Development of a real-time two-stroke marine diesel engine model with in-cylinder pressure prediction capability. Appl. Energy 2017, 194, 55–70. [Google Scholar] [CrossRef]
  14. Khan, M.Y.; Giordano, M.; Gutierrez, J.; Welch, W.A.; Asa-Awuku, A.; Miller, J.W.; Cocker, I.D.R. Benefits of Two Mitigation Strategies for Container Vessels: Cleaner Engines and Cleaner Fuels. Environ. Sci. Technol. 2012, 46, 5049–5056. [Google Scholar] [CrossRef] [Green Version]
  15. Feng, L.; Tian, J.; Long, W.; Gong, W.; Du, B.; Li, D.; Chen, L. Decreasing NOx of a Low-Speed Two-Stroke Marine Diesel Engine by Using In-Cylinder Emission Control Measures. Energies 2016, 9, 304. [Google Scholar] [CrossRef] [Green Version]
  16. MEPC 62/INF7. Reduction of GHG Emissions from Ships—Marginal Abatement Costs and Cost Effectiveness of Energy-Efficiency Measures. IMO: London, UK, 2011.
  17. Sequino, L.; Belgiorno, G.; Di Blasio, G.; Mancaruso, E.; Beatrice, C.; Vaglieco, B.M. Assessment of the New Features of a Prototype High-Pressure “Hollow Cone Spray” Diesel Injector by Means of Engine Performance Characterization and Spray Visualization; SAE Technical Paper; SAE International: Warrendale, PA, USA, 2018. [Google Scholar]
  18. Svensson, E.; Tuner, M.; Verhelst, S. Influence of Injection Strategies on Engine Efficiency for a Methanol PPC Engine; SAE Technical Paper Series; SAE International: Warrendale, PA, USA, 2019. [Google Scholar]
  19. Sahu, T.K.; Shukla, P.C.; Belgiorno, G.; Maurya, R.K. Alcohols as alternative fuels in compression ignition engines for sustainable transportation: A review. Energy Sources Part A Recovery Util. Environ. Effects 2022, 44, 8736–8759. [Google Scholar] [CrossRef]
  20. Konrad, J.; Lauer, T.; Moser, M.; Lockner, E.; Zhu, J. Engine Efficiency Optimization under Consideration of NOX- and Knock-Limits for Medium Speed Dual Fuel Engines in Cylinder Cut-Out Operation; SAE Technical Paper; SAE International: Warrendale, PA, USA, 2018. [Google Scholar]
  21. Discenzo, F.M.; Nickerson, W.; Mitchell, C.E.; Keller, K.J. Open Systems Architecture Enables Health Management for Next Generation System Monitoring and Maintenance; Development Program White Paper; United Nations Development Program: New York, NY, USA, 2001. [Google Scholar]
  22. Ansari, E.; Shahbakhti, M.; Naber, J. Optimization of performance and operational cost for a dual mode diesel-natural gas RCCI and diesel combustion engine. Appl. Energy 2018, 231, 549–561. [Google Scholar] [CrossRef]
  23. Pham, X.; Noor, M.; Hoang, A. Comparative Analysis on Performance and Emission Characteristic of Diesel Engine Fueled with Heated Coconut Oil and Diesel Fuel. Int. J. Automot. Mech. Eng. 2018, 15, 5110–5125. [Google Scholar] [CrossRef]
  24. Gonca, G.; Hocaoglu, M.F. Performance Analysis and Simulation of a Diesel-Miller Cycle (DiMC) Engine. Arab. J. Sci. Eng. 2019, 44, 5811–5824. [Google Scholar] [CrossRef]
  25. Solmaz, H.; Ardebili, S.M.S.; Aksoy, F.; Calam, A.; Yılmaz, E.; Arslan, M. Optimization of the operating conditions of a beta-type rhombic drive stirling engine by using response surface method. Energy 2020, 198, 117377. [Google Scholar] [CrossRef]
  26. Kumar, S.; Chauhan, M.K. Numerical modeling of compression ignition engine: A review. Renew. Sustain. Energy Rev. 2013, 19, 517–530. [Google Scholar] [CrossRef]
  27. Sui, C.; Song, E.; Stapersma, D.; Ding, Y. Mean value modelling of diesel engine combustion based on parameterized finite stage cylinder process. Ocean Eng. 2017, 136, 218–232. [Google Scholar] [CrossRef] [Green Version]
  28. Theotokatos, G.; Guan, C.; Chen, H.; Lazakis, I. Development of an extended mean value engine model for predicting the marine two-stroke engine operation at varying settings. Energy 2018, 143, 533–545. [Google Scholar] [CrossRef] [Green Version]
  29. Guan, C.; Theotokatos, G.; Zhou, P.; Chen, H. Computational investigation of a large containership propulsion engine operation at slow steaming conditions. Appl. Energy. 2014, 130, 370–383. [Google Scholar] [CrossRef] [Green Version]
  30. Theotokatos, G.; Tzelepis, V. A computational study on the performance and emission parameters mapping of a ship propulsion system. Proc. Inst. Mech. Eng. Part M J. Eng. Marit. Environ. 2015, 229, 58–76. [Google Scholar] [CrossRef] [Green Version]
  31. Zhu, S.; Gu, Y.; Yuan, H.; Ma, Z.; Deng, K. Thermodynamic analysis of the turbocharged marine two-stroke engine cycle with different scavenging air control technologies. Energy 2020, 191, 116533. [Google Scholar] [CrossRef]
  32. Galindo, J.; Serrano, J.; Vera, F.; Cervelló, C.; Lejeune, M. Relevance of valve overlap for meeting Euro 5 soot emissions requirements during load transient process in heavy duty diesel engines. Int. J. Veh. Design. 2006, 41, 343–367. [Google Scholar] [CrossRef]
  33. Vera-García, F.; Pagán Rubio, J.A.; Hernández Grau, J.; Albaladejo Hernández, D. Improvements of a Failure Database for Marine Diesel Engines Using the RCM and Simulations. Energies 2020, 13, 104. [Google Scholar] [CrossRef] [Green Version]
  34. Rubio, J.A.P.; Vera-García, F.; Grau, J.H.; Cámara, J.M.; Hernandez, D.A. Marine diesel engine failure simulator based on thermodynamic model. Appl. Therm. Eng. 2018, 144, 982–995. [Google Scholar] [CrossRef]
  35. Badawy, T.; Henein, N. Three-Dimensional Computational Fluid Dynamics Modeling and Validation of Ion Current Sensor in a Gen-Set Diesel Engine Using Chemical Kinetic Mechanism. J. Eng. Gas Turbines Power 2017, 139, 102810. [Google Scholar] [CrossRef]
  36. Zhou, C.; Jiang, X.; Wang, X. Dynamic Balance Analysis of Crankshaft Based on Three-Dimensional Model. In International Workshop of Advanced Manufacturing and Automation; Springer: Berlin/Heidelberg, Germany, 2018; pp. 592–600. [Google Scholar]
  37. Rakopoulos, C.; Kosmadakis, G.; Pariotis, E. Investigation of piston bowl geometry and speed effects in a motored HSDI diesel engine using a CFD against a quasi-dimensional model. Energy Convers. Manag. 2010, 51, 470–484. [Google Scholar] [CrossRef]
  38. Wu, S.; Zhou, D.; Yang, W. Implementation of an efficient method of moments for treatment of soot formation and oxidation processes in three-dimensional engine simulations. Appl. Energy 2019, 254, 113661. [Google Scholar] [CrossRef]
  39. Jafarmadar, S. Exergy analysis of hydrogen/diesel combustion in a dual fuel engine using three-dimensional model. Int. J. Hydrogen Energy 2014, 39, 9505–9514. [Google Scholar] [CrossRef]
  40. Jafarmadar, S.; Nemati, P. Exergy analysis of diesel/biodiesel combustion in a homogenous charge compression ignition (HCCI) engine using three-dimensional model. Renew. Energy 2016, 99, 514–523. [Google Scholar] [CrossRef]
  41. Yıldız, M.; Çeper, B.A. Zero-dimensional single zone engine modeling of an SI engine fuelled with methane and methane-hydrogen blend using single and double Wiebe Function: A comparative study. Int. J. Hydrogen Energy 2017, 42, 25756–25765. [Google Scholar] [CrossRef]
  42. Hairuddin, A.A.; Yusaf, T.; Wandel, A.P. Single-zone zero-dimensional model study for diesel-fuelled homogeneous charge compression ignition (HCCI) engines using Cantera. Int. J. Automot. Mech. Eng. 2016, 13, 3309–3328. [Google Scholar] [CrossRef]
  43. Catania, A.E.; Finesso, R.; Spessa, E. Predictive zero-dimensional combustion model for DI diesel engine feed-forward control. Energy Convers. Manag. 2011, 52, 3159–3175. [Google Scholar] [CrossRef]
  44. Kim, Y.; Kim, M.; Kim, J.; Song, H.H.; Park, Y.; Han, D. Predicting the Influences of Intake Port Geometry on the Tumble Generation and Turbulence Characteristics by Zero-Dimensional Spark Ignition Engine Model; SAE Technical Paper; SAE International: Warrendale, PA, USA, 2018. [Google Scholar]
  45. Guan, C.; Theotokatos, G.; Chen, H. Analysis of Two Stroke Marine Diesel Engine Operation Including Turbocharger Cut-Out by Using a Zero-Dimensional Model. Energies 2015, 8, 5738–5764. [Google Scholar] [CrossRef] [Green Version]
  46. Finesso, R.; Spessa, E. A real time zero-dimensional diagnostic model for the calculation of in-cylinder temperatures, HRR and nitrogen oxides in diesel engines. Energy Convers. Manag. 2014, 79, 498–510. [Google Scholar] [CrossRef]
  47. Aghdam, E.A.; Kabir, M. Validation of a blowby model using experimental results in motoring condition with the change of compression ratio and engine speed. Exp. Therm. Fluid Sci. 2010, 34, 197–209. [Google Scholar] [CrossRef]
  48. Larsen, U.; Pierobon, L.; Baldi, F.; Haglind, F.; Ivarsson, A. Development of a model for the prediction of the fuel consumption and nitrogen oxides emission trade-off for large ships. Energy 2015, 80, 545–555. [Google Scholar] [CrossRef] [Green Version]
  49. Payri, F.; Olmeda, P.; Martín, J.; García, A. A complete 0D thermodynamic predictive model for direct injection diesel engines. Appl. Energy 2011, 88, 4632–4641. [Google Scholar] [CrossRef]
  50. Hountalas, D.T. Prediction of marine diesel engine performance under fault conditions. Appl. Therm. Eng. 2000, 20, 1753–1783. [Google Scholar] [CrossRef]
  51. Heywood, J.B. Combustion Engine Fundamentals; McGraw-Hill: New York, NY, USA, 1988. [Google Scholar]
  52. Lapuerta, M.; Ballesteros, R.; Agudelo, J.R. Effect of the gas state equation on the thermodynamic diagnostic of diesel combustion. Appl. Therm. Eng. 2006, 26, 1492–1499. [Google Scholar] [CrossRef]
  53. Bejan, A.; Kraus, A.D. Heat Transfer Handbook; John Wiley & Sons: Hoboken, NJ, USA, 2003. [Google Scholar]
  54. Yum, K.K.; Taskar, B.; Pedersen, E.; Steen, S. Simulation of a two-stroke diesel engine for propulsion in waves. Int. J. Nav. Archit. Ocean. Eng. 2017, 9, 351–372. [Google Scholar] [CrossRef] [Green Version]
  55. Watson, N.; Janota, M. Turbocharging the Internal Combustion Engine; Macmillan International Higher Education: London, UK, 1982. [Google Scholar]
  56. Scappin, F.; Stefansson, S.H.; Haglind, F.; Andreasen, A.; Larsen, U. Validation of a zero-dimensional model for prediction of NOx and engine performance for electronically controlled marine two-stroke diesel engines. Appl. Therm. Eng. 2012, 37, 344–352. [Google Scholar] [CrossRef]
  57. Miyamoto, N.; Chikahisa, T.; Murayama, T.; Sawyer, R. Description and analysis of diesel engine rate of combustion and performance using Wiebe’s functions. SAE Trans. 1985, 94, 622–633. [Google Scholar]
  58. Woschni, G. A Universally Applicable Equation for the Instantaneous Heat Transfer Coefficient in the Internal Combustion Engine; SAE Technical Paper; SAE International: Warrendale, PA, USA, 1967. [Google Scholar]
  59. Lapuerta, M.; Armas, O.; Hernández, J. Diagnosis of DI Diesel combustion from in-cylinder pressure signal by estimation of mean thermodynamic properties of the gas. Appl. Therm. Eng. 1999, 19, 513–529. [Google Scholar] [CrossRef]
  60. Wang, H.; Zhang, J.; Zeng, H. Modeling and Simulation of Working Process of Large Low Speed Diesel Engine. J. Dalian Marit. Univ. 2006, 32, 1–4. [Google Scholar]
Figure 1. Sketch of the diesel engine system.
Processes 11 00936 g001
Figure 2. Comparison between shop test and simulation results for the main performance parameters: (a) SFOC and power; (b) Exhaust temperature and turbine speed; (c) Compression and maximum combustion pressure; (d) Scavenge receiver and exhaust receiver pressure; (e) Temperature before and after air cooler.
Processes 11 00936 g002
Figure 3. Comparison between calculated and measured pressure traces of different loads: (a) 50% load at 46 rpm; (b) 75% load at 52.7 rpm; (c) 85% load at 54.9 rpm; (d) 100% load at 58 rpm; (e) 110% load at 59.9 rpm.
Processes 11 00936 g003
Figure 4. The effect of compression ratio on engine’s main performance parameters: (a) SFOC and power; (b) Exhaust temperature and turbine speed; (c) Compression and maximum combustion pressure; (d) Scavenge receiver and exhaust receiver pressure; (e) Temperature before and after air cooler; (f) Expansion pressure.
Processes 11 00936 g004
Figure 5. The effect of injection timing on engine’s main performance parameters: (a) SFOC and power; (b) Exhaust temperature and turbine speed; (c) Compression and maximum combustion pressure; (d) Scavenge receiver and exhaust receiver pressure; (e) Temperature before and after air cooler; (f) Expansion pressure.
Processes 11 00936 g005
Figure 6. The effect of the EGB valve opening portion on engine’s main performance parameters: (a) SFOC and power; (b) Exhaust temperature and turbine speed; (c) Compression and maximum combustion pressure; (d) Scavenge receiver and exhaust receiver pressure; (e) Temperature before and after air cooler; (f) Expansion pressure.
Processes 11 00936 g006
Figure 7. The effect of EVC timing on engine’s main performance parameters: (a) SFOC and power; (b) Exhaust temperature and turbine speed; (c) Compression and maximum combustion pressure; (d) Scavenge receiver and exhaust receiver pressure; (e) Temperature before and after air cooler; (f) Expansion pressure.
Processes 11 00936 g007
Figure 8. The effect of EVO closing timing on engine’s main performance parameters: (a) SFOC and power; (b) Exhaust temperature and turbine speed; (c) Compression and maximum combustion pressure; (d) Scavenge receiver and exhaust receiver pressure; (e) Temperature before and after air cooler; (f) Expansion pressure.
Processes 11 00936 g008
Table 1. Calibrated combustion model parameters.
ParametersLoad (%)
507585100110
Q p c 0.880.920.830.750.78
θ p c 18.022.020.023.025
S O C p c −0.1−0.10.30.30.5
Table 2. Specification of diesel engine.
ParametersValues
Rated power 21,000 kW
Rated speed58 rpm
Number of cylinders7
Cylinder bore900 mm
Stroke3720 mm
Connecting rod length3720 mm
Displacement volume 1.87 m3
Compression ratio 32.7:1
Turbocharger typeTCA66-21*2
Bypass valve diameter61 mm
Number of air coolers2
LHV4.292 × 107 J/kg
Fire order1-7-2-5-4-3-6
Table 3. Different parameter settings’ effects on diesel engine performance.
ParametersCR IncreaseInjection Timing IncreaseBypass Valve IncreaseEVC Timing IncreaseEVO Timing Increase
SFOC− −++ο++
Power++− −ο− −+
Exhaust temperature− −+++++ο
Turbine speed+− −+ο
Compression pressure++− −ο− −ο
Maximum pressure++οο− −ο
Scavenge receiver pressure+ο+ο
Exhaust receiver pressure+ο+ο
Compressor outlet temperature− −++++ο
Scavenge temperature++ο
Expansion pressureο+ο− −ο
Disclaimer/Publisher’s Note: The statements, opinions and data contained in all publications are solely those of the individual author(s) and contributor(s) and not of MDPI and/or the editor(s). MDPI and/or the editor(s) disclaim responsibility for any injury to people or property resulting from any ideas, methods, instructions or products referred to in the content.

