Article

Risk Assessment of Concentralized Distribution Logistics in Cruise-Building Imported Materials

1
School of Transportation and Logistics Engineering, Wuhan University of Technology, Wuhan 430063, China
2
National Engineering Research Center for Water Transport Safety, Wuhan University of Technology, Wuhan 430063, China
3
Shanghai Waigaoqiao Shipbuilding Co., Ltd., Shanghai 200000, China
*
Author to whom correspondence should be addressed.
Processes 2023, 11(3), 859; https://doi.org/10.3390/pr11030859
Submission received: 31 December 2022 / Revised: 8 March 2023 / Accepted: 9 March 2023 / Published: 13 March 2023
(This article belongs to the Special Issue Risk Assessment and Reliability Engineering of Process Operations)

Abstract

:
The concentralized distribution logistics in cruise-building imported materials (CDL-CIMs) constitute a complex process that requires a high degree of coordination between the multi-link and multi-participator. Delayed delivery, materials damaged, and cost overruns occur because of increasing uncertainties and risks, which may cause disjointedness in cruise construction planning. Therefore, it is essential to conduct a risk assessment of the CDL-CIMs to examine their adverse impacts on cruise construction. Drawing on the advantages of the failure modes and effects analysis (FMEA) method in risk assessment, an effective and efficient model is developed using a novel hybrid method in this paper, namely the rule-based Bayesian network (RBN) and utility function. The approach has its superiorities in dealing with vague and uncertainty risk information. In addition, the risk parameters from multiple perspectives concerning “occurrence likelihood”, “detection”, “delayed schedule”, “damaged quality”, and “additional cost” facilitate the understanding of the risk characteristics of the CDL-CIMs. The applicability and robustness of the proposed method are demonstrated by an empirical study for the first cruise constructed in China. The results reveal that the highest-priority threats are the poor management for the actors in the logistics chain (MR1), human errors (MR5), limited storage ability and poor environment of warehouse (ER2), and ignorance of good handling practices during the operation of loading and unloading (OR2). The conclusion can provide insight into the implementation of risk response strategies for cruise-building logistics management in China and other countries.

1. Introduction

Cruise, known as “maritime mobile city”, integrating the functions of navigation, sightseeing, tourism, leisure and entertainment, plays an increasing role in the fields of the tourism and maritime sectors [1]. China’s cruise industry has experienced rapid growth and accounted for more than 50% of all Asian cruise passenger traffic during the last few years, and it is expected to reach 10 million by 2026 [2,3]. In the case of the imbalance between the supply and demand of the international cruise-building industry, it is timely to develop cruise-building for China. However, it should be noted that the supporting industry chain related to cruise construction is mainly focused on Italy, Germany, Finland and other European countries [4]. Coupled with China′s inexperience in cruise construction for the first time, as such, the high-quality materials used for cruise-building heavily rely on maritime imports [3]. Due to the strict schedule control of the cruise construction and its characteristics of high-risk workflow that may cause severe risk consequences, examining the concentralized distribution logistics in cruise-building imported materials (CDL-CIM) from the perspective of risk management is essential to delineate a comprehensive picture of cruise-building logistics risks and uphold the sustainability of cruise construction.
The cruise construction is a typical project-based industry. The cruise shipyard starts production after receiving orders from shipowners and signing contracts. In order to connect procurement and production and ensure the timely delivery of imported materials, the concentralized distribution logistics in cruise-building are extremely important, integrating the functions of “transportation, storage and distribution”. Compared with the ordinary merchant ship-building, the imported materials of cruise-building, with more diverse types and quantities, relate to many suppliers and are widely distributed geographically [5]. After receiving the arrival notice, the cruise shipyard will coordinate with other participants in the logistics chain, such as with ports, shipping companies, customs, and third-party logistics companies. Materials are transported from the port terminal to the shipyard for storage, and then, materials are selected from the warehouse for centralization according to the materials requisition list of the production department and then they are distributed to the production site using specialized equipment. Due to the multi-level logistics process, as well as the multi-role supply and demand coordination, the CDL-CIMs face a variety of risks that cause severe risk consequences. From a more specific point of view, materials handling and storage, ship and lorry circulation, human operation, etc., inevitably increase vulnerability and uncertainty. Potential risks could result in different disruptions of delivery; further, the interruption of the concentralized distribution logistics process will impact other links, and even force the cruise construction to be aborted. Therefore, it is imperative to identify the threats of CDL-CIM and assess risks in a comprehensive way, as well as to reveal the prioritization of risks.
At present, only a few of the Western hemisphere and European countries have experience in cruise construction. Some of the only studies [6,7,8] focused on hull design, project management, occupational health and safety, and operation management. There is still a lack of comprehensive research on the risk of concentralized distribution logistics in cruise-building. This paper attempts to address the following three problems to reach two objectives: one is to examine the risks of CDL-CIM, which augments the knowledge of risk management within the context of cruise-building logistics; the other is to develop an appropriate risk assessment methodology to reveal the highly prioritized risks in the CDL-CIM, so as to provide reference for further risk control. The three problems are as follows:
  • What important role does CDL-CIM play in cruise construction?
  • What risk parameters should be considered in risk assessment?
  • How severe are the risks and what is their prioritization?
To solve the aforementioned questions, this paper first establishes a complete list of risk factors through analyzing the concentralized distribution logistics practical process in cruise-building imported materials. Then, we present an improved failure modes and effects analysis (FMEA) approach considering the powerful advantage of FMEA in risk management application. Specifically, risk parameters are expanded from five aspects, including occurrence likelihood (L), detectability (D), delayed schedule (CS), damaged quality (CQ), and additional cost (CC). Meanwhile, a detailed description of the linguistic grades of the parameters is made. Subsequently, a fuzzy belief rule (FBR) is established based on risk parameter structure and weights. Finally, rule-based Bayesian network (RBN) and utility function are employed to calculate and rank the risk index (RIN) of various risks. This method based on integrating the uncertainty reasoning can effectively solve the challenge of insufficient quantitative data. In this way, it contributes to the theoretical references for the further risk controls of CDL-CIMs.
The remainder of this paper is organized as follows. Section 2 provides a brief literature review. Section 3 presents the approach and steps to conduct the risk assessment. Section 4 obtains the risks ranking results of the CDL-CIMs. In addition, the sensitivity analysis is used to validate the proposed methodology, and the results are discussed. Finally, in Section 5, the conclusion of this paper and future research suggestions are pointed out.

2. Literature Review

In this section, the prior research relating to the cruise-building logistics risk is first reviewed, with the aim of reviewing the risks associated with the shipbuilding industry and cruise construction. The next subsection introduces the application of FMEA in risk assessment research, indicating the methodological novelties and gaps. Finally, the summaries that remain to be focused appropriately will be discussed.

2.1. Cruise-Building Logistics Risk

At present, the research on cruise-building mainly focuses on technology and design methods [8]. We can learn from the research on other shipbuilding risks, from both internal and external aspects based on the perspective of the entire shipbuilding industry. Ferreira et al [9] determined 30 risk factors and they believed that internal risks should be focused on. Crispim, Fernandes, and Rego [10] used the Delphi method to determine the risks of military shipbuilding from six aspects, which were purchase contract failure, inaccurate information, insufficient resources, quality, product defect, lack of labor, and the planning and demand disorder. The paper established a framework that combines the visualization chart and Bayesian network for researching shipbuilding risks.
The cruise construction project is a giant system, with a dynamic construction environment, complex technology, and a huge quantity of materials [11]. It should be noted that diverse materials for cruise construction can only be purchased from a limited number of specialized manufacturers who are geographically scattered around the world. The global locations of the materials suppliers along with the characteristic of cruise construction lead to high uncertainty in logistics networks [12]. In regard to the fact that logistics plays an important role in the supply chain, it is believed that the cruise-building supply chain has the unique characteristics of complexity, dynamics, and variability [13] from a risk perspective.
Yue and Zhang [14] put forward that the shipbuilding supply chain risk refers to the negative impact of uncertain factors on the performance of the supply chain, which results in the failure of achieving the operation plan. Furthermore, the authors divided the risks into external environmental risks, including international politics and a poor transportation environment, along with operational risks such as supply risk, organizational risk, and information interruption, etc. Liu et al. [7] studied the supply disruption problem in the cruise-building supply chain caused by supplier information asymmetry. From a risk perspective, Zhu et al. [15] integrated flexibility strategies into the shipbuilding materials supply chain and proposed the risk response for supply, logistics, organization, and quality. Wang et al. [16] constructed two inbound logistics modes based on JIT production to alleviate the cost risk and sustainable risk of cruise-building logistics. Xiang et al. [6] determined occupational health and safety risks in cruise-building logistics. Zheng et al. [11] reported that a change in planning is a common phenomenon in cruise construction, and they established a system dynamics model to evaluate the impact of five types of risks on concentralized distribution logistics in cruise-building, which are namely purchasing planning, warehousing planning, distribution planning, and production planning. In addition, in order to reduce downtime costs risks for spare parts in the logistics of shipbuilding, certain flexibility strategies such as inventory pooling, lateral transshipment, or emergency shipments are proposed to mitigate the risks [12].
It is clear from the above analysis that the existing research efforts have recognized the significance of the risks in shipbuilding or cruise construction; however, the risk related to concentralized distribution logistics in cruise-building or even in ordinary ship building have been lacking.

2.2. FMEA and Its Application in Risk Assessment

FMEA is an effective and useful technique of reliability and risk management, which is initially used in the aerospace industry, and it is developed to fill the enormous demands of reliability and safety [17]. The primary purpose of performing FMEA is to examine potential failure modes that threaten a system’s operation, assess the risk of each failure mode, and present some suggestions to reduce or eliminate these failures. To date, FMEA has been widely applied in various fields, such as the port and marine [18], manufacturing [19], and logistics fields [20].
The risk priority number (RPN) is usually generated to derive the risk prioritization of each failure mode in the FMEA method, which is calculated quantitatively by multiplying three risk criteria for every failure mode, that is, the likelihood of the occurrence (L), detection (D), and severity of consequence (C). The RPN approach is simple to operate and easy to understand; nevertheless, it still has several limitations in practical application [18,21,22]. These inherent defects may be exposed as follows. (1) The weights of three risk parameters are given the same importance. (2) Only three risk parameters are considered to calculate the RPN value, and other risk parameters are neglected in the practical analysis, which may not be able to capture a risk characteristic in specific industrial cases. (3) RPN is obtained by multiplying the crisp numbers (generally from 1 to 5) of the three risk parameters and shows certain incapability in an uncertain environment and is not suitable for the multi-dimensional expression of experts’ evaluation information. (4) The identical RPN can be obtained by adopting the multiplying of risk parameters, but their risk implications are completely diverse, which may hinder the prioritization and provide false information to managers.
To address these issues, researchers have made lots of efforts, and improvements have been suggested in the literature. Different studies [23,24,25] had carried out subjective weighting, objective weighting, and comprehensive weighting to distinguish the relative importance of the risk parameters. Among them, the comprehensive weighting method combining subjective and objective weights of risk parameters not only integrates the subjective experience and knowledge of experts, but also fully considers the objective information. Moreover, it can be effectively applied to various practical situations by setting the weight adjustment coefficient, so it has become a trend method to determine the weight of each risk parameter.
In view of the expression form of risk evaluation information, the fuzzy set theory such as the hesitant fuzzy set [26] and intuitive fuzzy set [27], are widely used in the improved FMEA method. However, because of the uncertainty and complexity of the decision-making environment and the inherent ambiguity of human cognition, experts prefer to conduct risk assessments using qualitative linguistic terms such as “low, average, high”. The Probabilistic Linguistic Term Sets (PLTS) developed by Chai [28] et al. not only allow decision makers to use multiple language terms to express their judgments, but also to reflect different preferences by adding probabilities to different language terms. Huang et al. [29] utilized linguistic distribution assessments (LDA) to express the experts’ evaluation. Utilizing linguistic variables (LVs) to express the risk evaluation effectively avoids the loss of preference information, improves the flexibility of language information expression, and is more suitable for describing the uncertainty of experts’ opinions [30].
On the other hand, various multi-criteria decision-making methods (MCDMs) had been used to determine the priority of the failure mode risk. Shan et al. [31] realized the calculation of RPN by using the uncertainty reasoning cloud model and TOPSIS method. Zhu et al. [32] established the FMEA-RT-PROMETHEE II ranking method to address the risk assessment of green logistics. Unfortunately, the MCDM methods may be less effective in dealing with randomness, which is an essential component for uncertain risk issues. As such, in order to address randomness and fuzziness in a risk assessment simultaneously, Wang et al. [18] proposed the Bayesian network (BBN) to adapt the uncertainty of expert knowledge, and a risk assessment model within FMEA was developed to quantitatively rank the risks in the process of human evacuation from cruise ships. Chang et al. [33] applied the FMEA method in conjunction with a rule-based Bayesian network (RBN) to quantify the risk levels of the hazards in maritime autonomous surface ships.

2.3. Review Summaries

From the above literature review, it can be learned that a variety of risks threaten the sustainability of the cruise-building industry and related fields. The FMEA method was used to address the risk assessment problem of complex systems and has wide applicability in the existing literatures. However, there are still some research gaps that need to be filled:
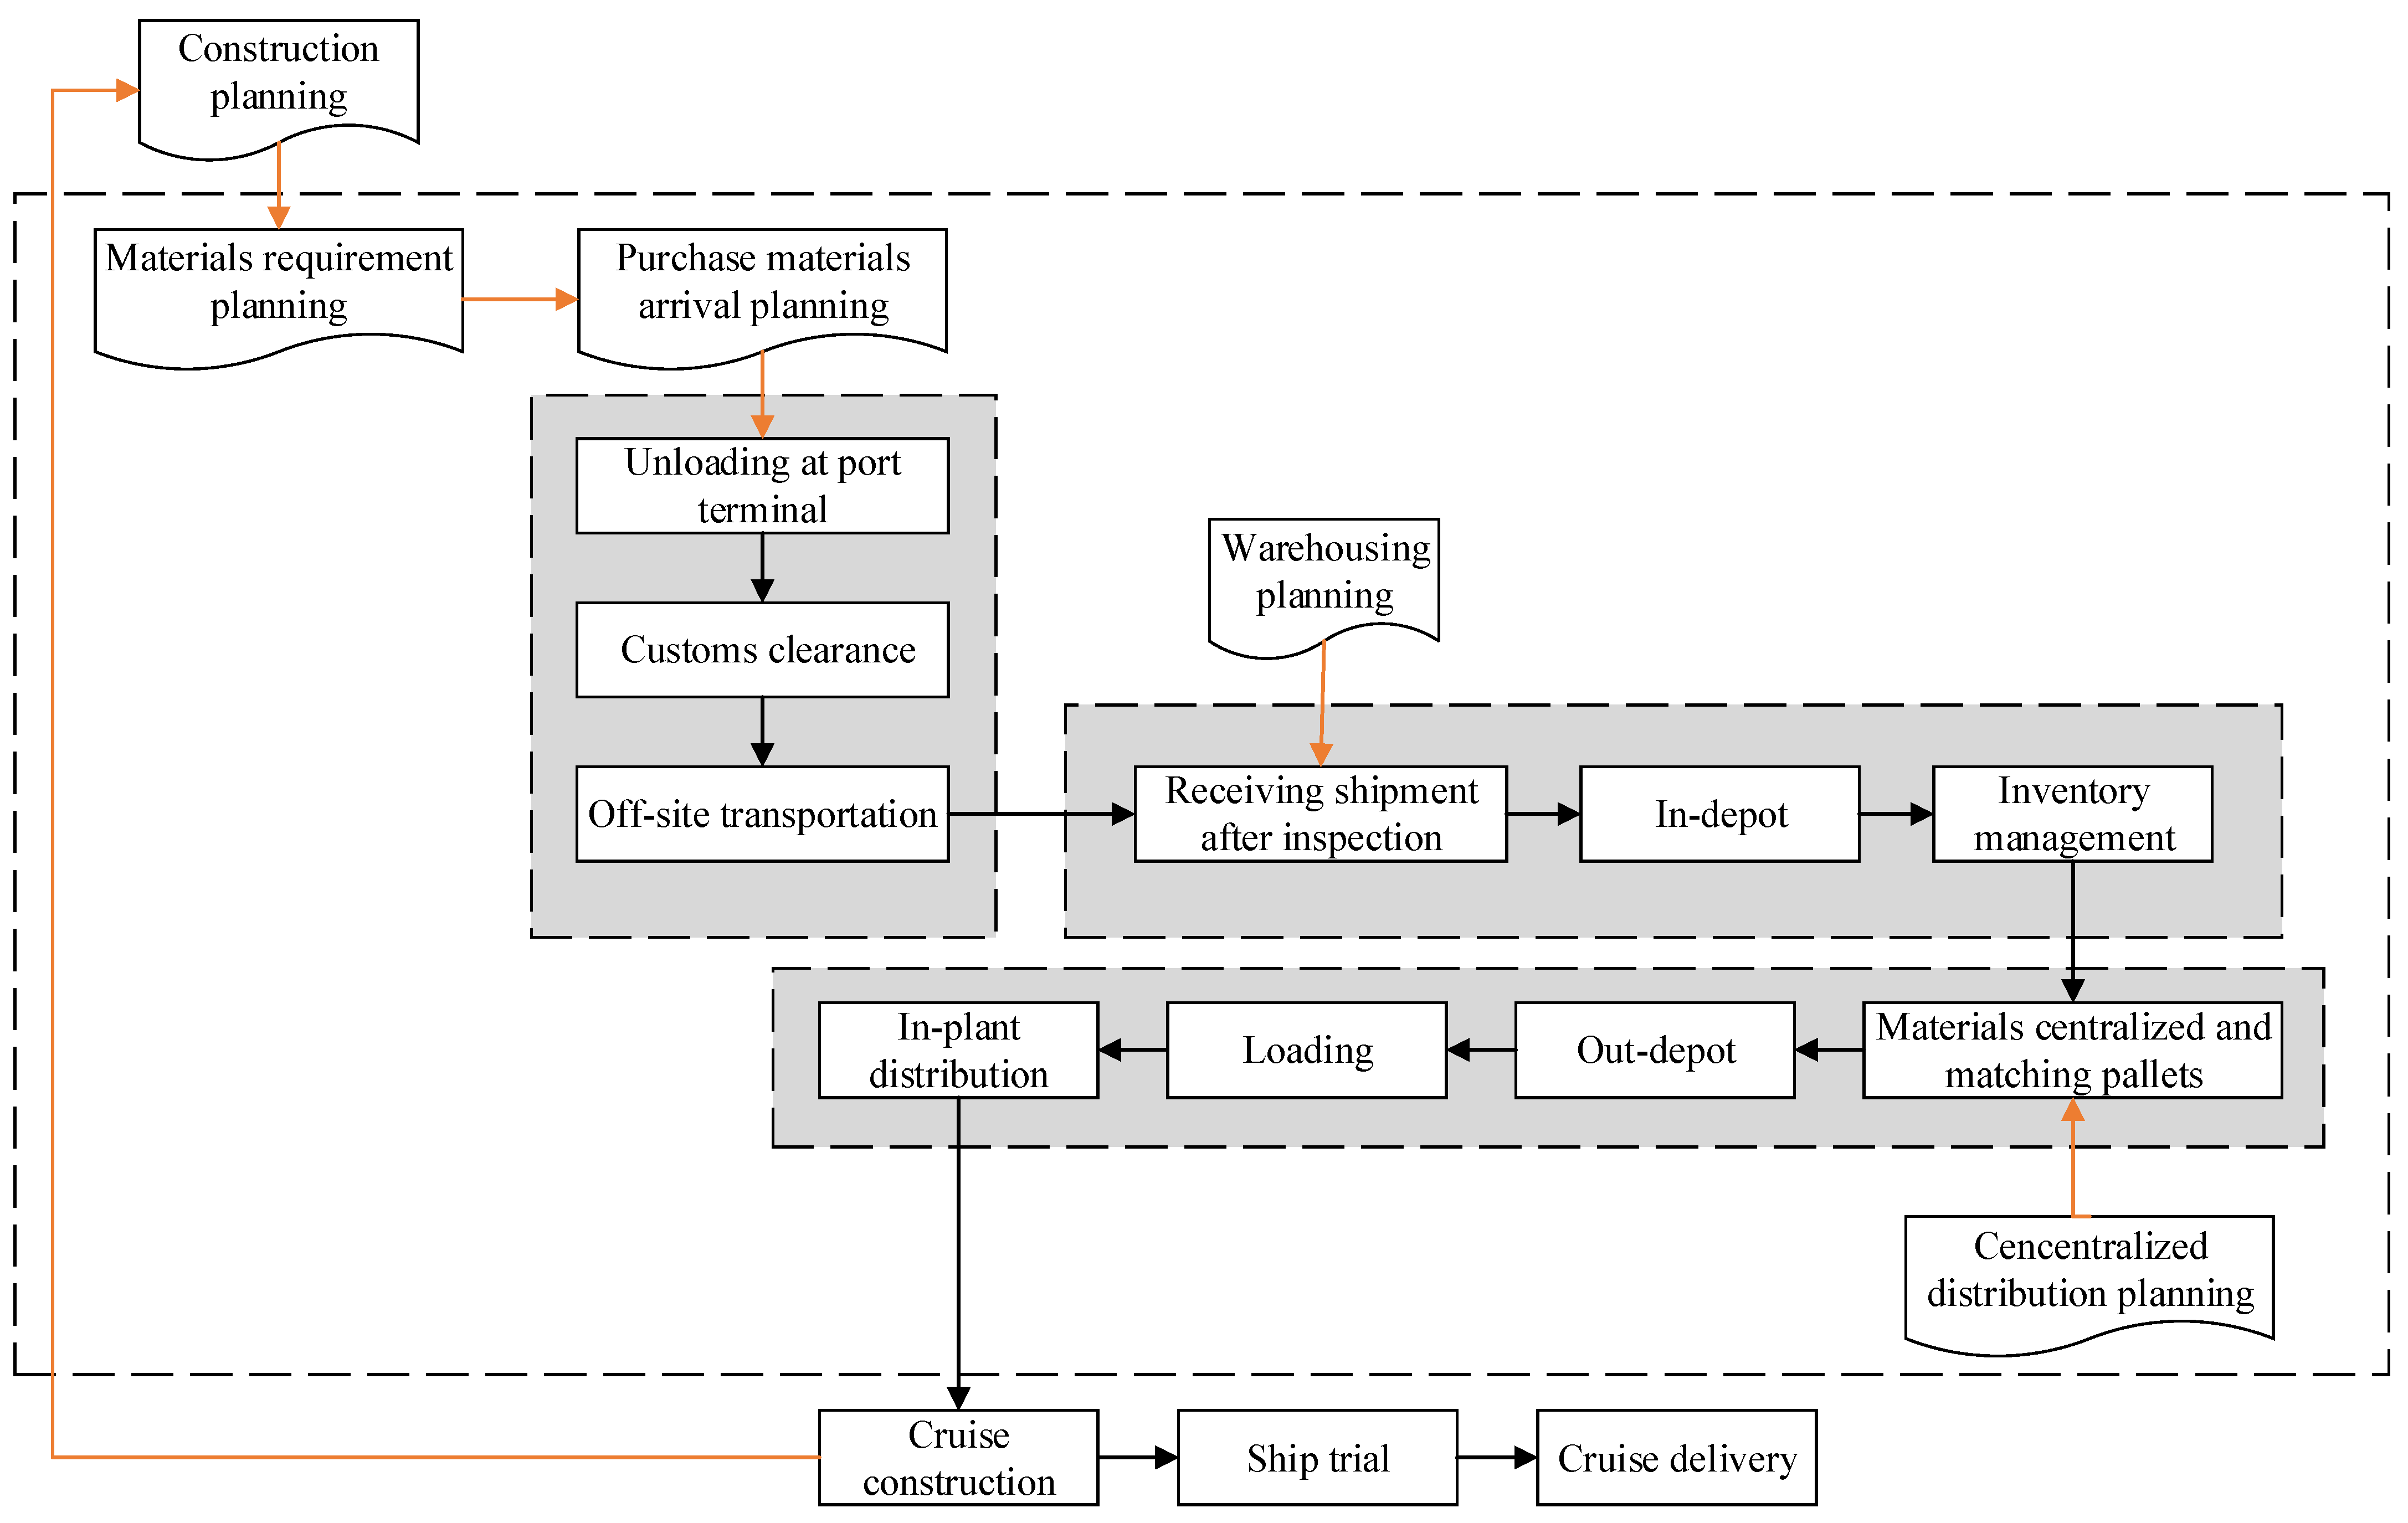
  • Analyzing the process of CDL-CIMs takes into account its importance for improving the continuity of cruise construction.
  • Identifying risks from the perspective of the whole process, namely transportation, storage, and distribution. Further, considering the severity of consequences in multiple perspectives must be achieved.
  • Applying an improved FMEA approach to address the risk assessment problem within uncertainty and vagueness caused by imprecision risk data in the field of CDL-CIMs.

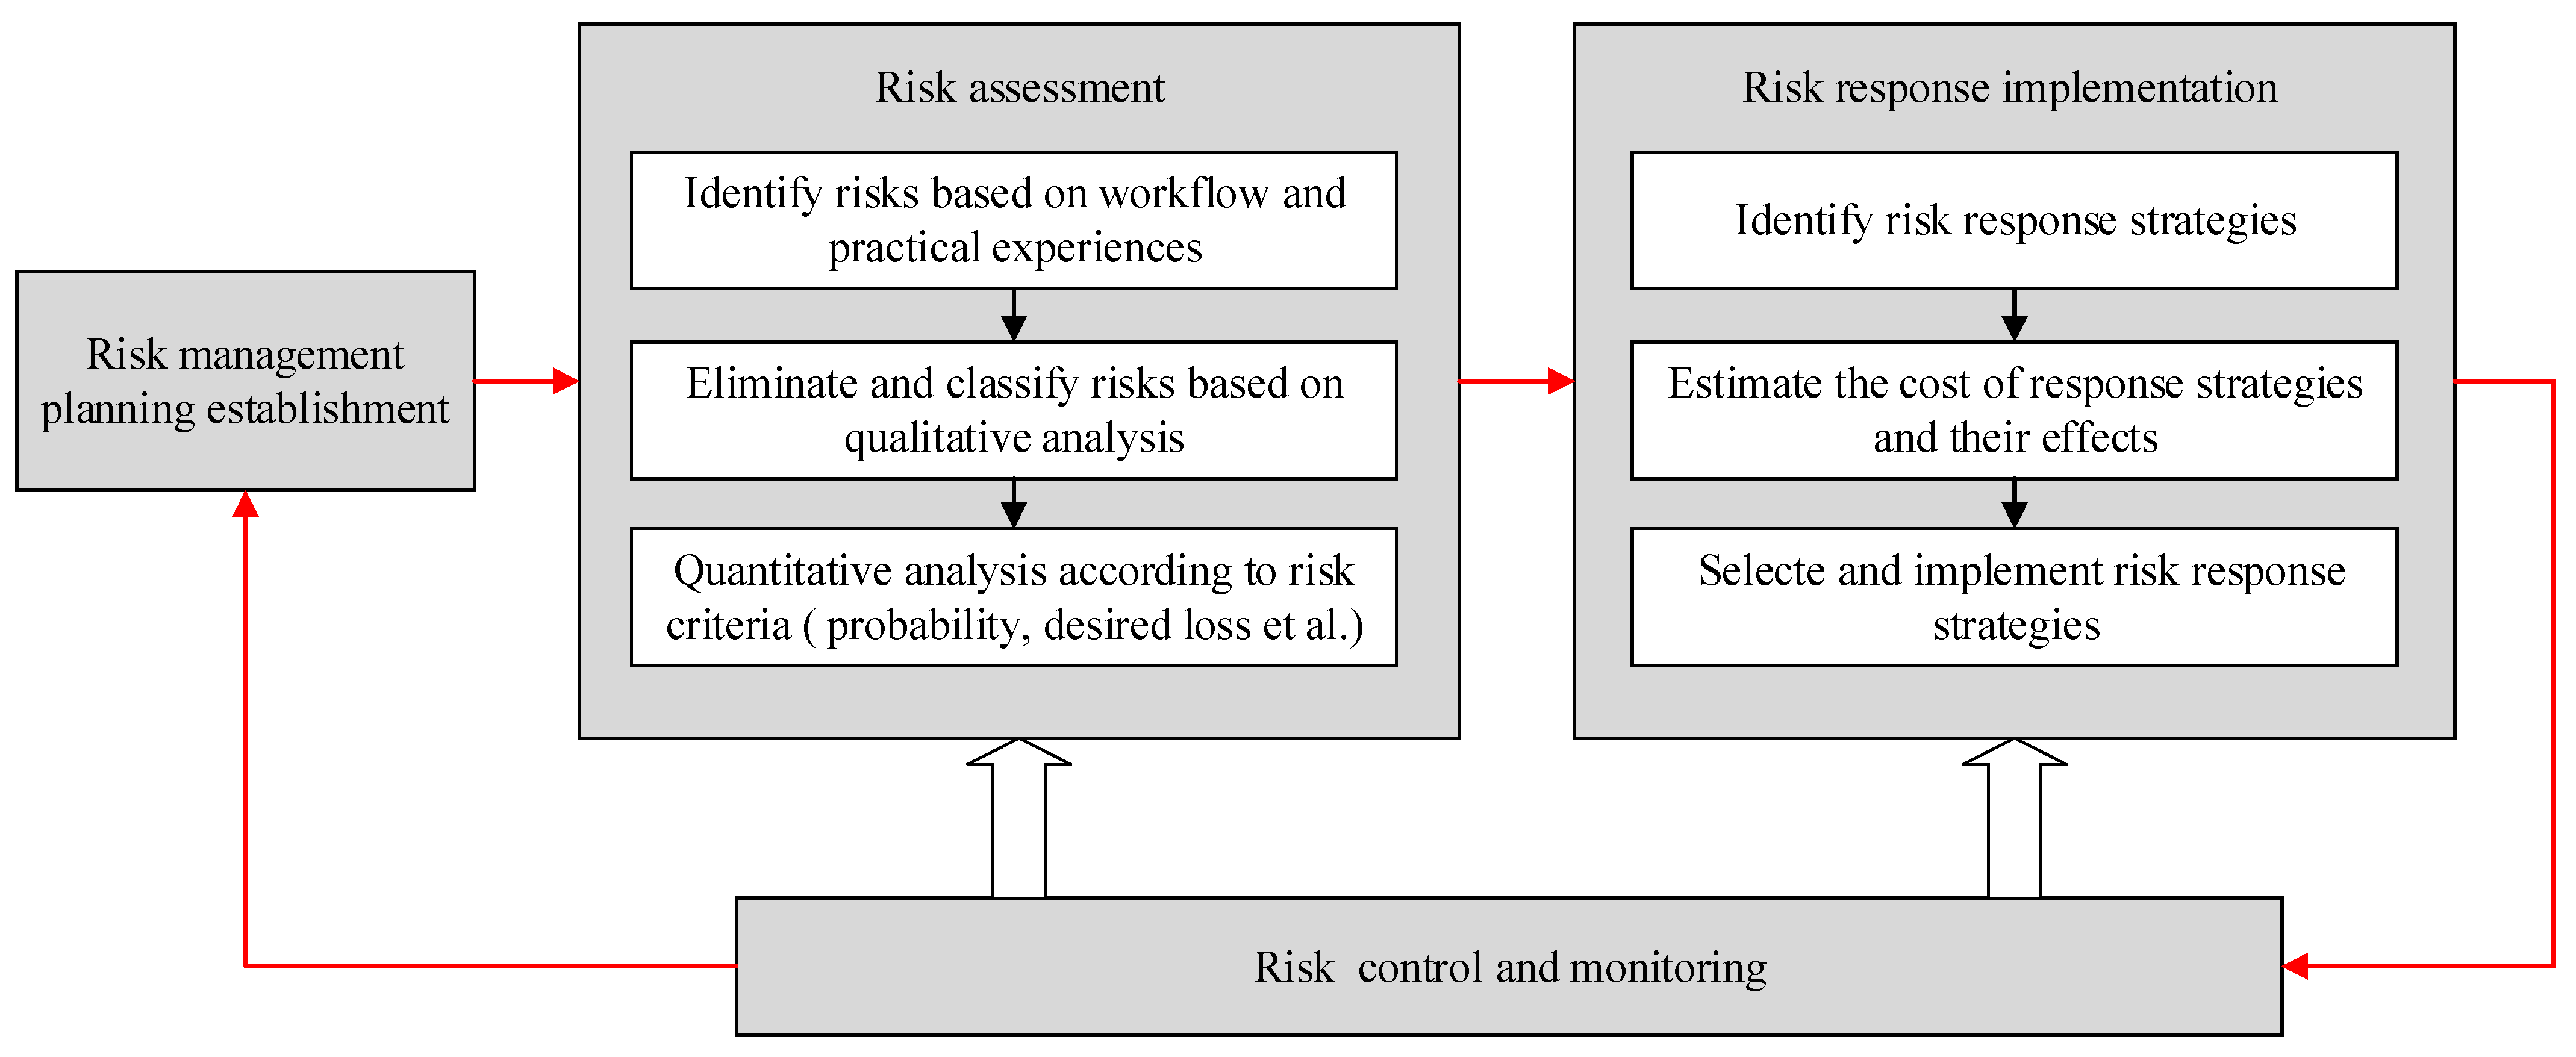
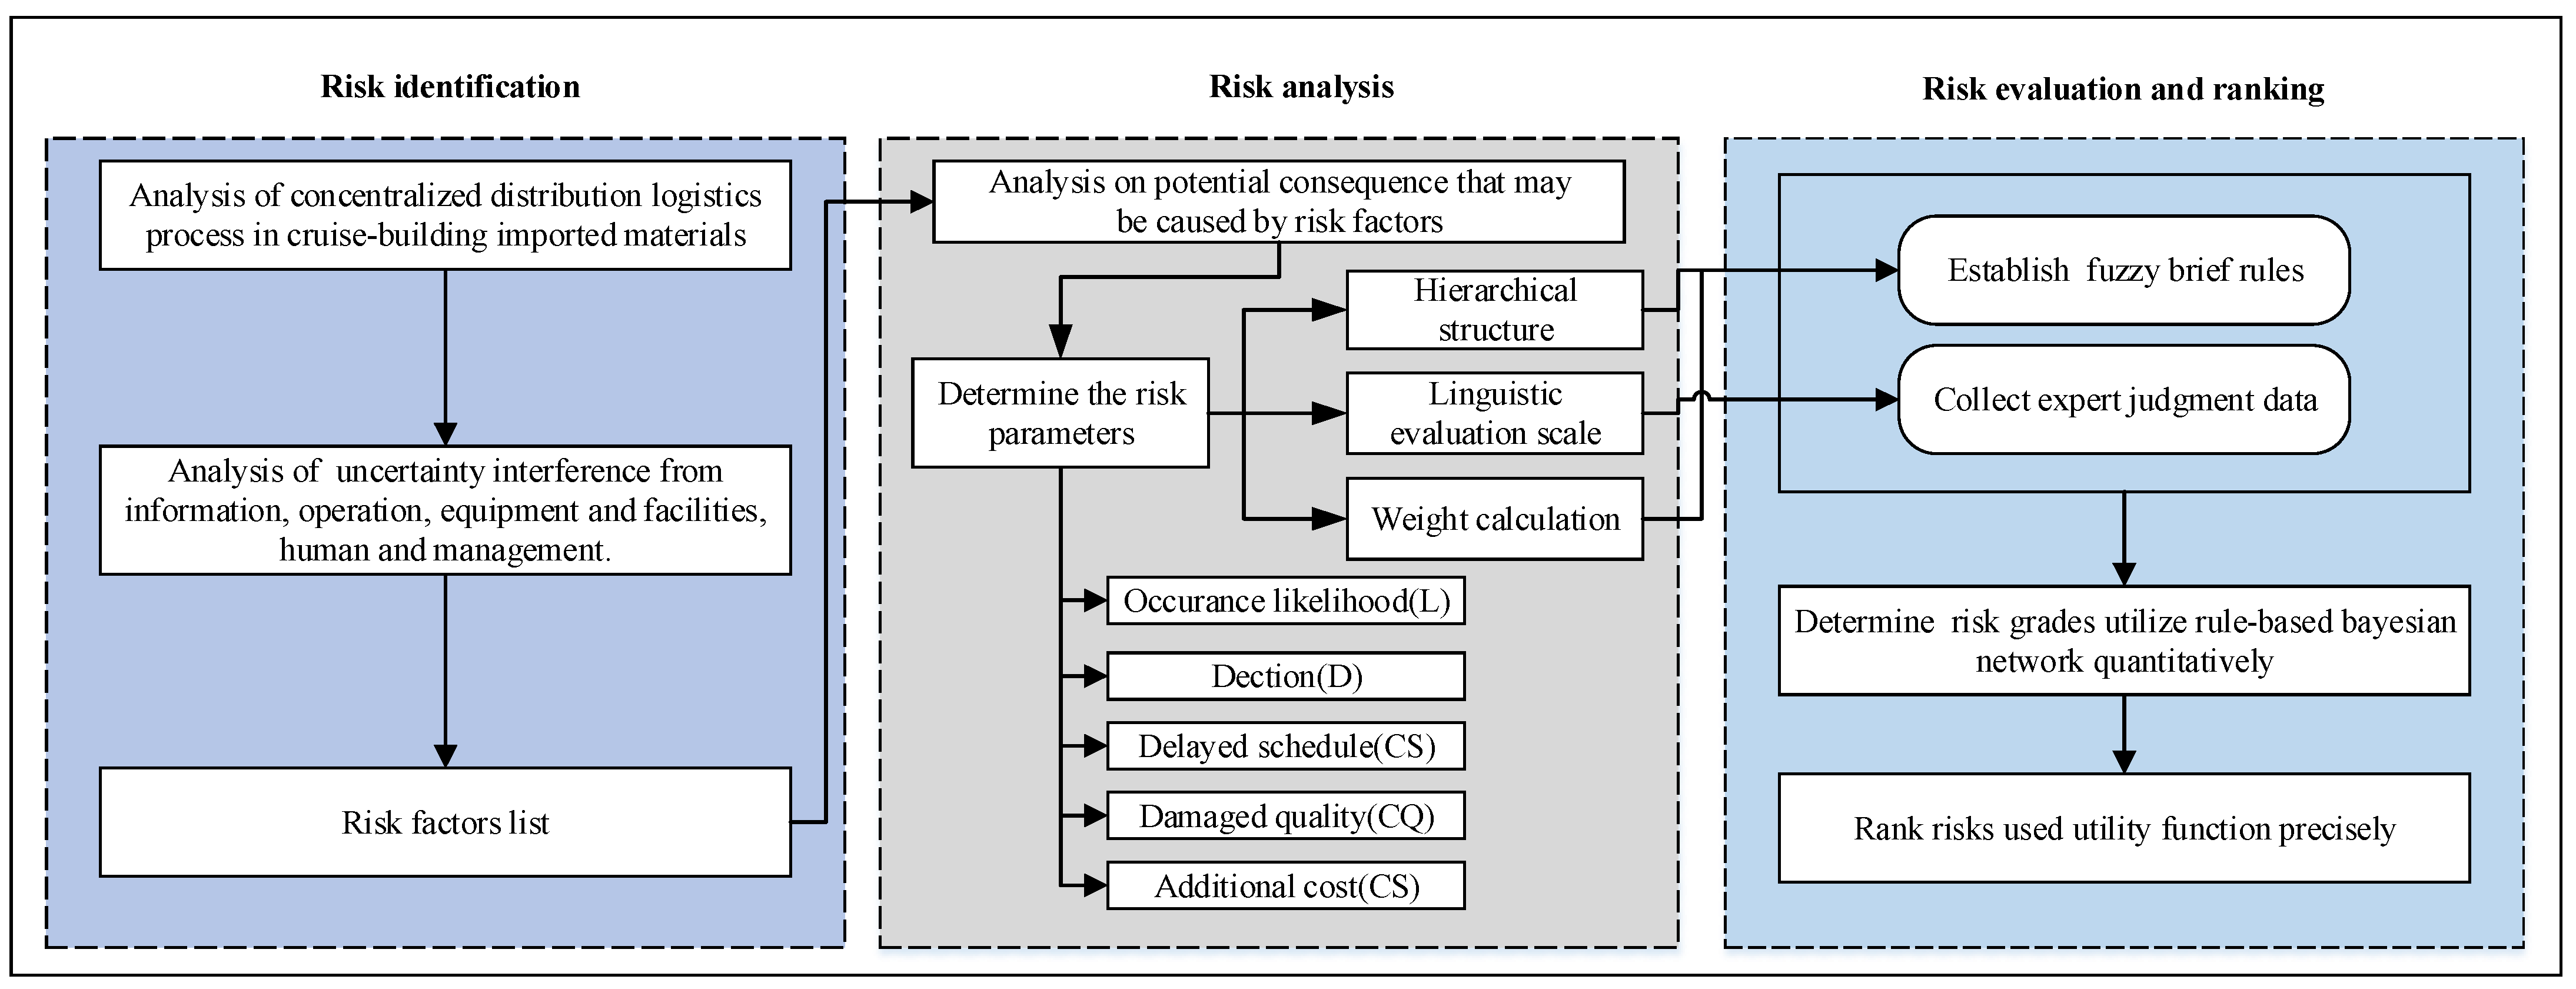
3. Research Framework and Methodology

According to recent studies in the field of project risk management, overall risk management can be generally summarized into four stages that include risk management planning, risk assessment, risk response, and risk control and monitoring [34]. As shown in Figure 1, defining responsibility and providing a complete action plan for project risk management is the initial step. In the next stage, including risk identification as well as risk qualitative and quantitative analyses is necessary, and this stage is the uppermost level of risk management. Risks are identified and classified according to the workflow and previous experiences with similar projects; different assessment criteria are adopted to quantitatively rank the risks, such as probability or desired loss. According to the above assessment results, optimal risk response strategies are selected for each risk after evaluating the cost of implementing strategies and their effects. Finally, continuous risk monitoring is part of the overall risk management in order to realize the sustainable goals.
This study focuses on the risk assessment stage, aiming to assess the risks for the CDL-CIMs scientifically to provide references for risk response. An improved FMEA method is applied as the main analysis tool, and a three-stage risk assessment framework has been made to suit the research object. The first stage is risk identification. Through combing the concentralized distribution logistics process, a combination of the literature review, business process analysis, and brainstorming with experienced experts are conducted to determine the critical risk factors for the CDL-CIMs. The next stage is risk analysis. Risk parameters for a delayed schedule (CS), damaged quality (CQ), and additional cost (CC) are introduced; in addition, the analytic hierarchy process (AHP) and entropy weight method (EWM) are incorporated to calculate the weight of existing parameters. Finally, a hybrid risk assessment model is put forward, in which FBR, RBN, and utility functions are used in a combined way to quantitatively rank the risk factors of the CDL-CIMs. This method improves the shortcoming of traditional FMEA, and it can be implemented to deal with the uncertainty and ambiguity of the research objects. The specific flow chart is shown in Figure 2.

3.1. Risk Identification

The biggest characteristic of cruise-building logistics differs from other logistics systems is that it is closely related to cruise-building technology. With the application of group technology and lean manufacturing construction methods, the construction of the cruise is segmented in space and ordered in time, and the work of hull construction, outfitting, and painting is carried out in parallel.
This section identifies risk factors through an analysis of the concentralized distribution logistics process based on the business process analysis method. Through investigating the participants and operation process of the CDL-CIMs of Chinese cruise-building enterprises, the typical workflow is obtained, as shown in Figure 3, which can be divided into three stages: off-site handing and transportation, storage at shipyard, and distribution to the production site.
During the process, owning to many uncertainties in the actual operating activities, various threats would have impacts on the CDL-CIMs. These risk factors are divided into four perspectives, according to the actual process of the CDL-CIMs, including information risk (IR), operation risk (OR), equipment and facilities risk (ER), and human and management risk (MR).
a.
Information risk
Information flow mainly includes the transmission of data, knowledge, or documents among different participants in the process of the CDL-CIMs. The delivery of imported materials relies heavily on information flow to improve the operational efficiency of the system. However, the phenomena of information delay and distortion are reinforced in the process, especially when it involves cooperation among more stakeholders. Information asymmetry among the shipyard, port, and raw material suppliers may result in materials being detained in port. On the other hand, information asymmetry between the shipyard warehouse and production department can lead to material selection errors and even distribute disruptions.
b.
Operation risk
As an operation-oriented system, operation risk can be considered as an important source of risk for the CDL-CIMs. In the materials gathering stage, the main risk factors include the unsafe operation of port handling and unloading, customs clearance problems, out-of-plant transportation accidents, and non-standard arrival acceptance, etc.
In the risk statistics, non-standard arrival acceptance is considered to be one of the most frequent risk factors, which is related to the standardization of operation standards. In addition, the lack of displacement of parts resulting from the lack of pallets and incorrect materials selection and centralization are other causes of the disruption of the operation. In the distribution stage, including lifting and transfer accidents caused by operational errors and mistakes, there is resulting material quality damage and safety accidents, thus delaying the delivery schedule.
c.
Equipment and facilities risk
For the CDL-CIMs, the risk factors associated with equipment and facilities mainly refer to the reliability of the equipment, the availability of facilities, and the advancement in technology. The auxiliary mechanical equipment such as cranes, forklifts, and trucks for transporting materials are limited resources for shipyards, and the effective scheduling of equipment and facilities resource is also a challenge. While storing at a warehouse, the spatial and environmental factors, such as the utilization of shelves, humidity, condition of ventilation, and disorder of materials placement are closely related to the quality and safety of the materials.
d.
Human and management risk
Human risk caused by human control factors is one of the key research areas in risk assessment. A lack of proper qualification, training, and prior experience could pose a serious threat in a situation that involves CDL-CIMs. Due to not understanding the characteristics of imported materials, some human-caused accidents would occur, such as storage environment monitoring errors, improper use of lifting equipment, safety accidents, etc. On the other hand, risk factors in the management of CDL-CIMs mainly involve unscientific management planning and imperfect operation management regulations. In addition, if there is no storage and distribution risk planning, such as warehouse resources scarcity, disorderly distribution, and traffic accidents, the management will have no capacity to respond to emergent risks.
Based on the classification principles of these four aspects, five experts are invited to independently identify those risks mainly impacting on the CDL-CIMs, according to their points of view. After brainstorming with experts, the five different lists of risk factors compiled by the experts are merged into a unique and shared list. A complete risk factors list for the CDL-CIMs is formed, as shown in Table 1.

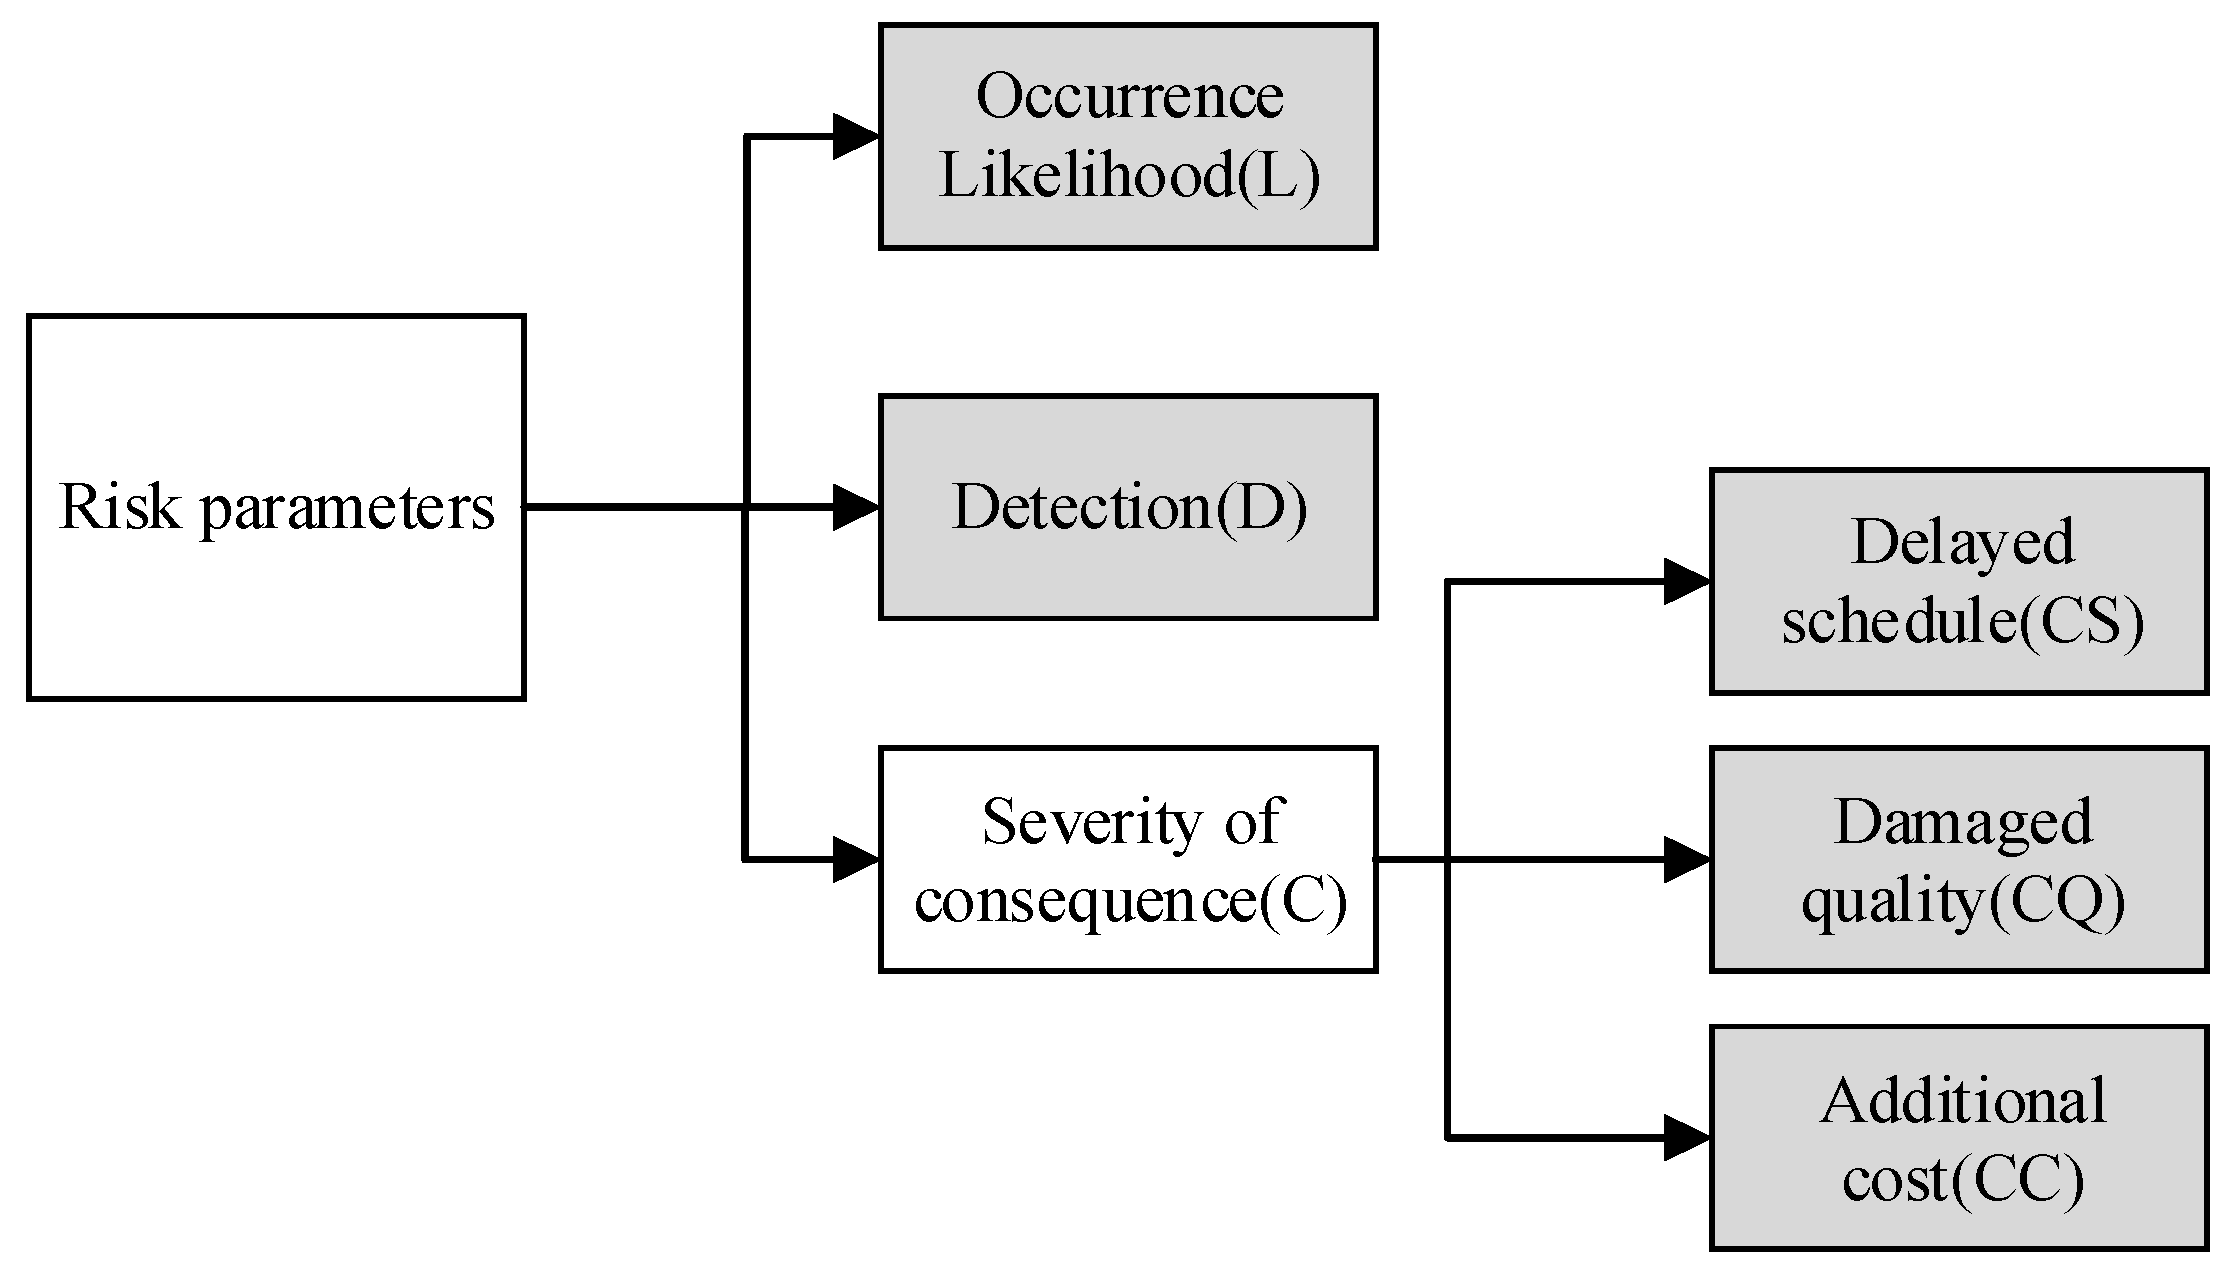
3.2. Risk Parameter Set

3.2.1. The Hierarchical Structure and Evaluation Scale of Risk Parameter

Risk parameters are important indicators used to describe multidimensional information of risk factors. Scientific and reasonable risk parameters help to grasp risk characteristics more comprehensively and improve the reliability and accuracy of assessment results. L is an estimate of the likelihood of occurrence of the risk factor within a given time interval; D evaluates the extent of risks that can be detected; and C expresses the serious consequences that the occurrence of a given risk factor may cause to the global system performance. The extension of the C parameter in FMEA is considered in this paper to assess the risk of CDL-CIMs scientifically. According to some scholars in the shipbuilding supply chain and marine supply chain, there are a variety of risks that will ultimately exert a negative impact on performance, such as time, quality, and cost [15,35,36]. Therefore, this study subdivided consequence into a delayed schedule (CS), damaged quality (CQ), and additional cost (CC), which are more representative for CDL-CIMs. The relationship of the risk parameters can be seen in Figure 4. It is a two-level hierarchical structure, where the first level consists of the three basic risk parameters, while the second one is composed of the specific risk consequences. A delayed schedule refers to materials that are delivered to the construction site later than the agreed time in distribution planning. In addition to strict timelines, the material quality is the concern of the cruise-building logistics. There are uncertain factors affecting the quality of materials in transportation, handing, and storage. A risk with an associated high cost of intervention certainly has to be considered as more severe. In other words, the higher the cost is associated with a given risk, the more severe the same risk will be.
In the absence of accurate historical data, it is more intuitive and realistic to use linguistic terms for obtaining experts’ opinions than numerical values to assess risks. To describe the status of the risk factors under the given parameters, the following defines three evaluation scales for five risk parameters in this study. The risk evaluation scale is validated by the experts mentioned above. In order to reduce uncertainty and bias, detailed explanations are given for each evaluation scale in Table 2.
Similarly, the overall risk level (R) could be described by three grades, namely “R1_ Acceptable”, ‘R2_ Moderate’, and ‘R3_ Significant’. The corresponding attitude and possible measures for each risk grades are shown in Table 3.

3.2.2. Weight Calculation for Risk Parameters

According to several studies, setting different parameter weights in FMEA is beneficial to improve the scientific validity of the evaluation results. In view of this, the comprehensive weighting method is used in this paper to reduce the weight calculation deviation through combining the AHP for determining the subjective weight and the EWM for determining the objective weight.
a.
Determination of initial weight with AHP
The AHP method has become a commonly used model to solve the multi-criteria decision-making problems by virtue of its advantages of being a simple calculation and comprehensible, consisting of making pairwise comparisons between more than one variable and determining the priorities for each of them. The first step of AHP is to establish the hierarchical structure of the research problem. In this study, evaluation indicators have been categorized into two two-level hierarchies (Figure 3). The next step is to construct the corresponding pairwise comparison matrix using Equation (1), where a i j is the relative importance of variable i to variable j.
A = ( a i j ) n × n = a 11 a 12 a 1 n a 21 a 22 a 2 n a n 1 a n 2 a n n
The third step is to determine the weighting vectors using Equations (2)–(4); W i A represents the weighting of each variable.
a i j ¯ = a i j i = 1 n a i j , ( i = 1 , 2 , , n )
M i = i = 1 n a i j ¯
W i A = M i i = 1 n M i
The last step is the consistency test. The consistency indicator (CI) and the consistency ratio (CR) are calculated to determine the suitability of the judgment matrix, as shown in Equations (5) and (6). Where λmax is the largest eigenvalue; n refers to the number of factors in the pairwise comparison matrix; and RI is varying with the order n. If CR ≤ 0.1, it indicates that the consistency test is acceptable.
C I = λ max n n 1
C R = C I R I
In light of the risk parameter relationship, the initial weight of each risk parameter is calculated by using the AHP method based on the evaluation information of five experts (detailed experts’ information refers to Section 4.1). Judgments are expressed and numerically translated according to the nine-point linguistic scale proposed by Saaty to fill in so-called pairwise comparison matrices [37]. Meanwhile, given the equivalent working background of the experts, the normalized relative weights of all experts are evenly distributed in combination with their judgments. Additionally, then, based on the data of experts in the questionnaire survey, the weight of each index at two levels (with three decimal places reserved) is as follows: WAL = 0.263, WAD = 0.077, WAC = 0.660, WACS = 0.458, WACQ = 0.416, WACC = 0.126. Subsequently, the consistency of the results is verified and the low CR of both pairwise comparisons verified the reasonability of the results.
b.
Determination of objective weight with EWM
The EWM is an accurate quantitative weight allocation technique. Through the objective analysis of the entropy value of the subjective weight result, the problem that the traditional weighting method is too subjective is solved. The parameters weight calculation process using the EWM is presented as follows [38].
The first step is to normalize the original indicator data; the procedure for normalization is outlined in Equation (7). For the evaluation of the risk parameter, i represents the evaluation objects, and j represents the kinds of the evaluation indicators.
Y i j = B i j ( B i j ) min ( B j ) max ( B j ) min
where Yij is the evaluation value of the ith evaluation object of the jth evaluation indicator after normalization; Bij is the evaluation value of the ith evaluation object of the jth evaluation indicator; (Bij)min is the minimum in the original data; (Bj)max is the maximum value of the evaluation indicators in row j; and (Bj)min is the minimum value of the evaluation indicators in row j.
The second step requires us to calculate the proportion of the ith evaluation object under the jth indicator using Equation (8).
P i j = Y i j i = 1 m Y i j
where m is the number of evaluation objects. The entropy value, ej of the indicator j is expressed as in Equation (9), where n is the number of indicators. The value of ej can be from zero to one. ej represents the total contribution of all evaluation objects to the evaluation indicator j.
e j = 1 ln ( n ) i = 1 m P i j ln ( P i j )
Then, the weight vectors of each indicator are calculated using Equation (10). WiE represents the evaluation of each indicator weight.
W j E = 1 e j n j = 1 n e j
Based on the data of parameters evaluation, the final weights of the EWM for each index of the two levels (with three decimal places reserved) are as follows: WEL = 0.221, WED = 0.211, WEC = 0.568, WECS = 0.351, WECQ = 0.325, WECC = 0.324.
c.
Determine the combination weight
The comprehensive weight is calculated by adopting the following formula:
W = θ W A + ( 1 θ ) W E
where W denoted the comprehensive weight and θ was the proportion of the subjective weight in the comprehensive weight. This paper stipulates that θ = 0.5 in order to determine the comprehensive weight [39].
After combining the data, the final combined weights (reserving three decimal places) of the five risk assessment parameters are as follows: WL = 0.242, WD = 0.143, WCS = 0.251, WCQ = 0.230, WCC = 0.134.

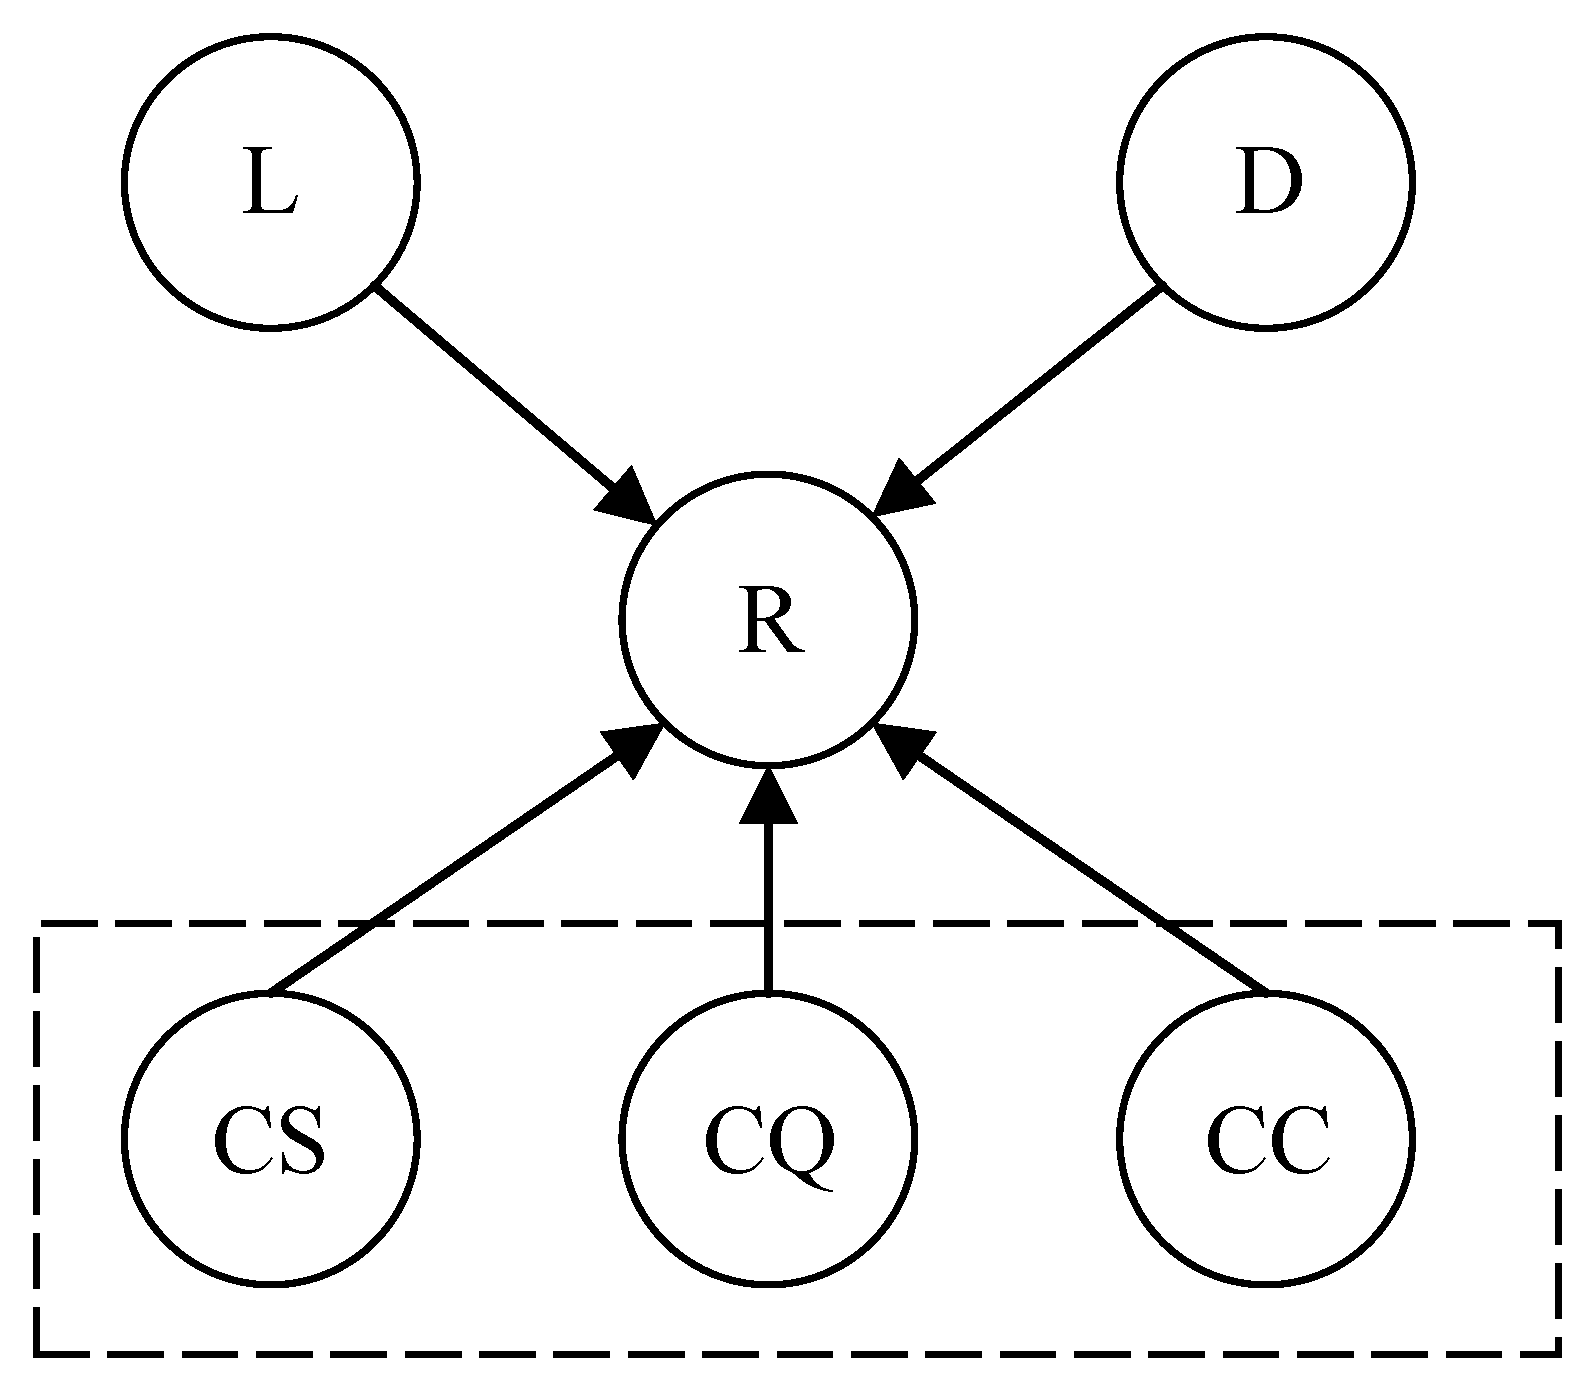
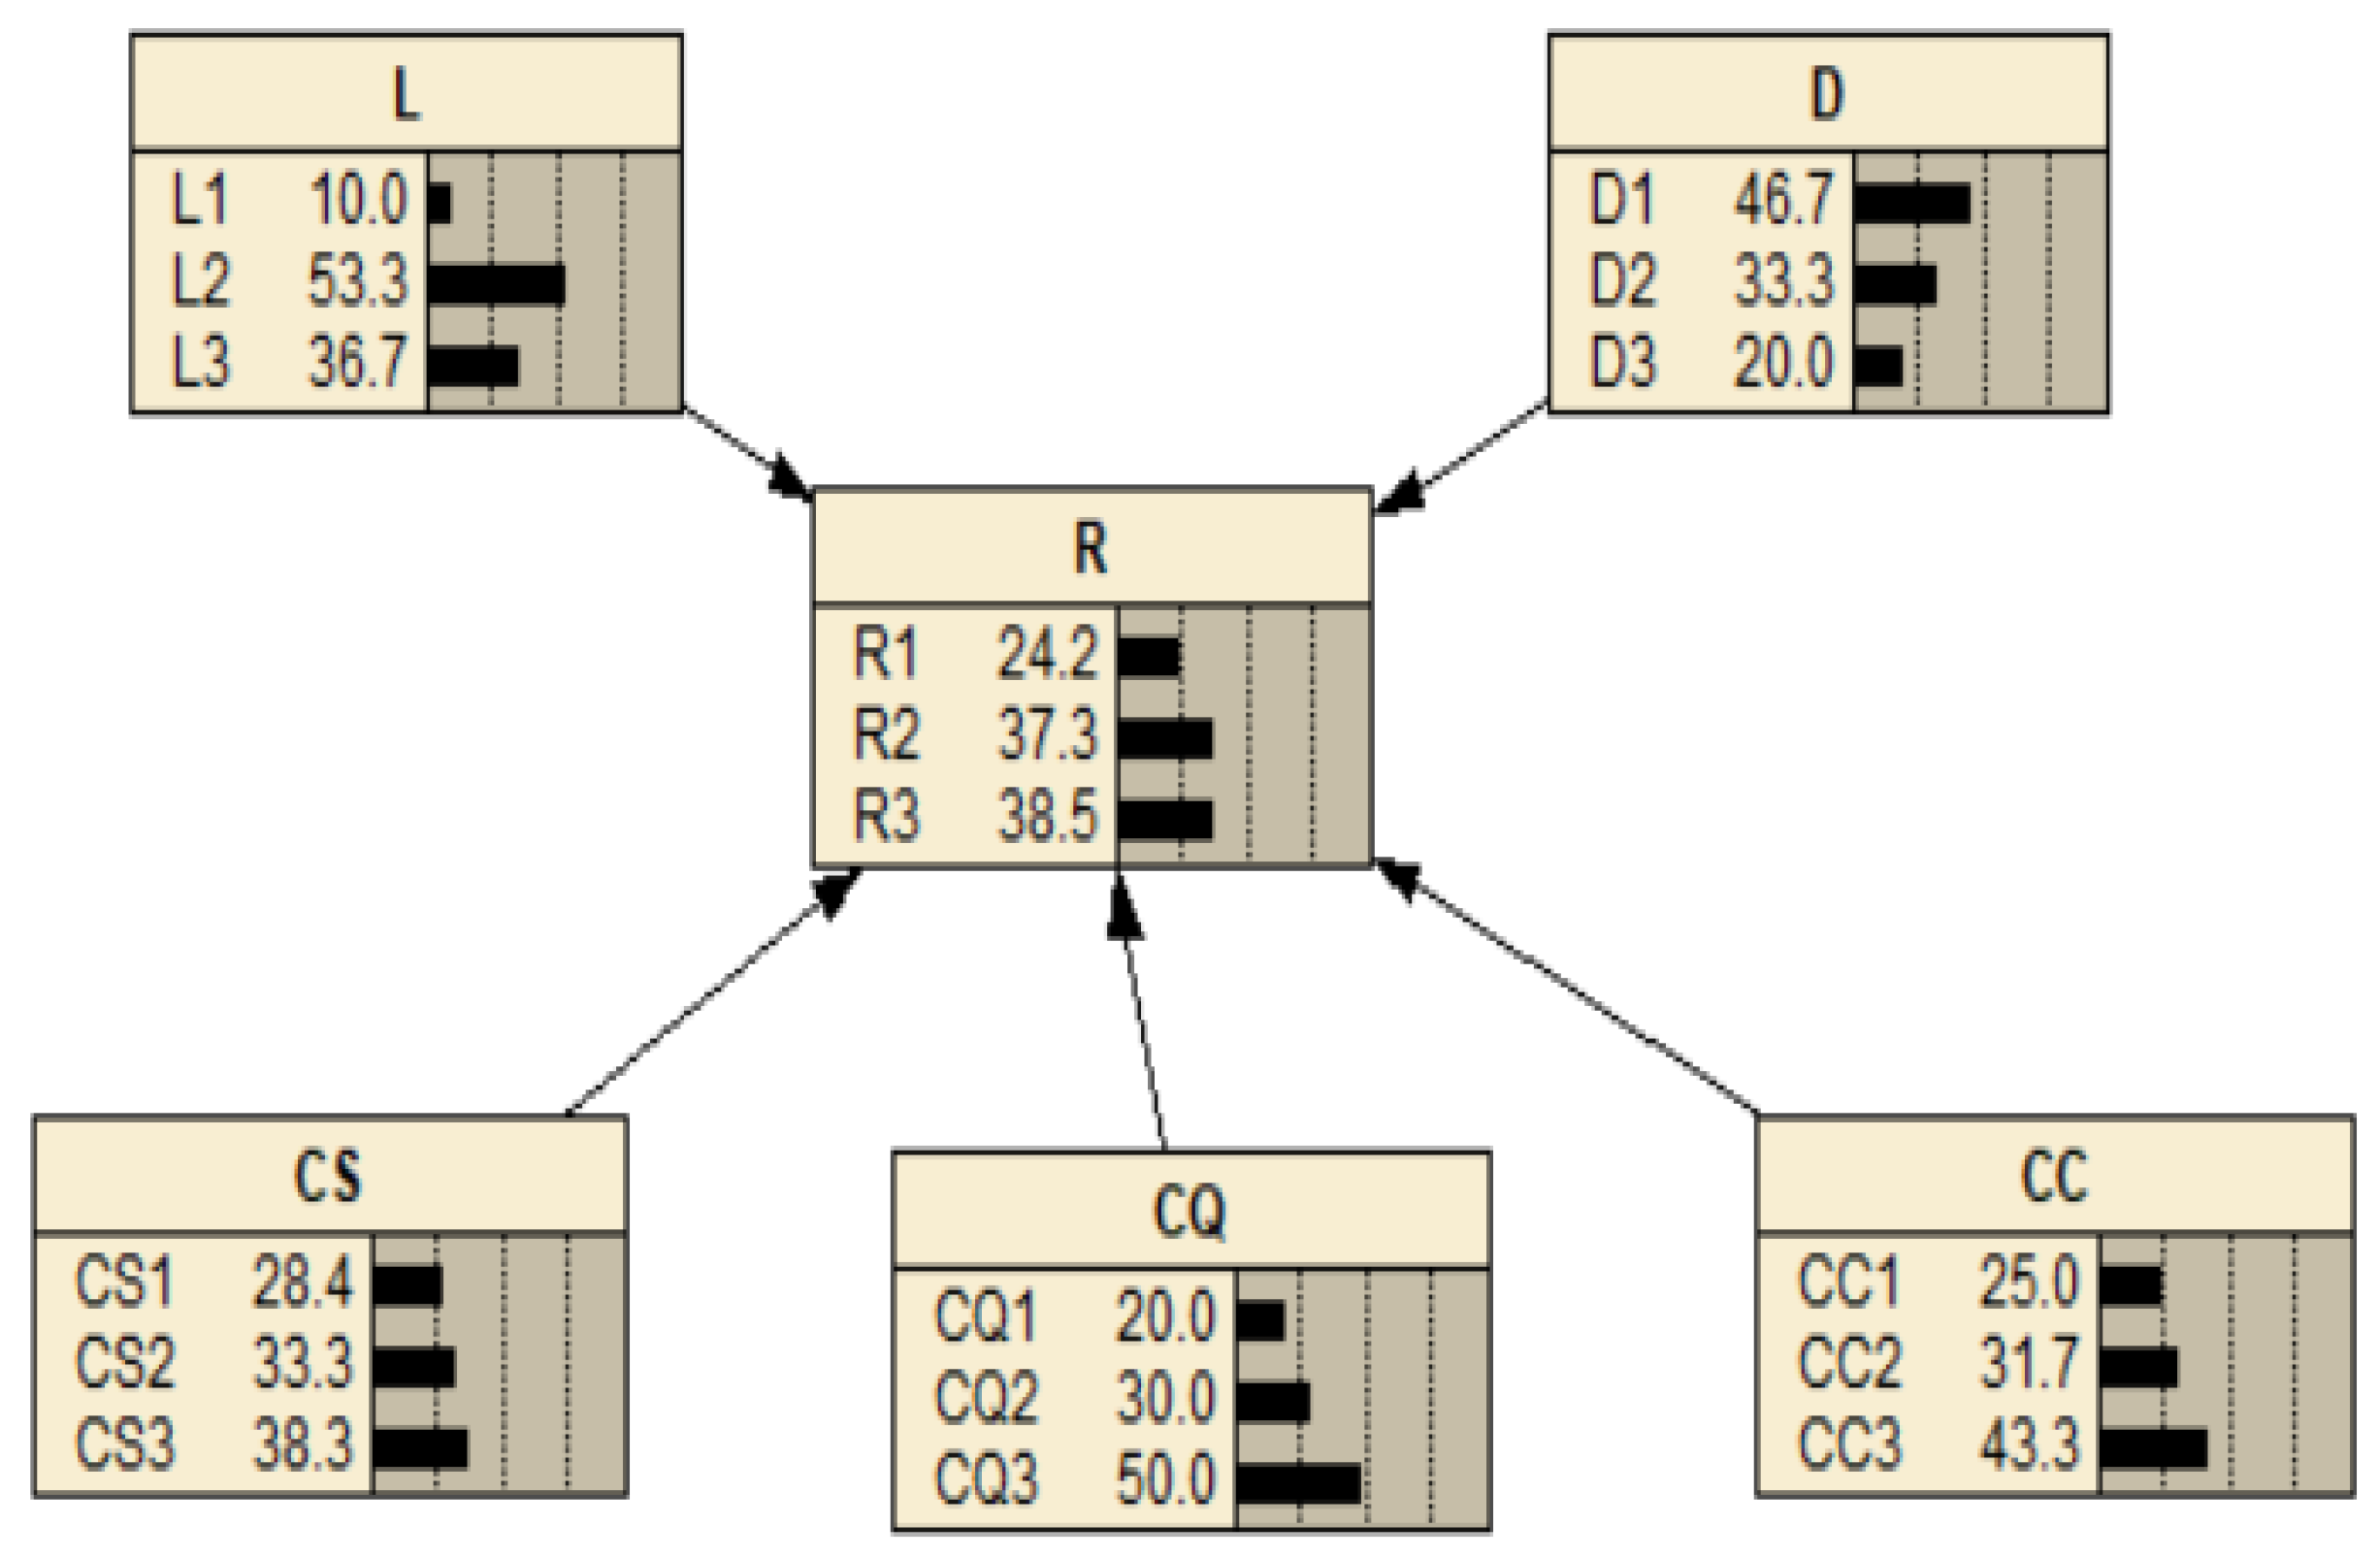
3.3. Establishment of FBR Based on Belief Structures in FMEA

The fuzzy if–then rules method is one of the most common ways to represent and model human knowledge systematically, which can obtain experts’ opinions without being provided with a precise answer. The result of the traditional fuzzy rules method is usually a single output that does not necessarily reflect slight changes in antecedent properties. In view of this, by introducing a concept of degree of belief (DoB), a new method of rule knowledge representation is used to enhance its ability to deal with uncertainty in a complex system [40]. The core of the method is described as follows.
B R k : I F { ( x 1   i s   A 1 k ) a n d ( x 2   i s   A 2 k ) a n d a n d ( x n   i s   A n k ) , T H E N { ( D 1   i s   β 1 k ) , ( D 2   i s   β 2 k ) , , ( D m   i s   β m k ) }
where βmk is the DoB to which Dm is considered as the result in the kth rule when the input meets the antecedent attribute Ak = {Ak1, Ak2, …, Akn} [41] and m is the number of possible outcomes.
In the process of establishing the FBR, βjk can be determined based on the distributing contribution in terms of the weight of the parameters in the IF part (c.g. Section 3.2.2) [41]. For example, experts provide a risk assessment opinion as L = “L1”, D = “D1”, CS = “CS1”, CQ = “CQ1”, and CC = “CC2”, then the overall risk status will be distributed into three states in the form of DoB as “R1, R2 and R3”. Take BR2, for example:
B R 2 : I F { ( L   i s   L 1 ) , ( D   i s   D 1 ) , ( C S   i s   C S 1 ) , ( C Q   i s   C Q 1 ) a n d ( C C   i s   C C 2 ) , T H E N { ( R 1   i s   0 . 866 ) , ( R 1   i s   0 . 134 ) , ( R 1   i s   0 ) }
BR1 can be further described as follows: if L is L1, D is D1, CS is CS1, CQ is CQ1, and CC is CC2, then R is R1 with a 0.866 (WL + WD + WCS + WCQ = 0.242 + 0.143 + 0.251 + 0.230 = 0.866) DoB, R2 with a 0.134 (WCC = 0.866) DoB, and R3 with a 0.000 DoB.
Following the same rationale, the FBR can be established to summarize experts’ opinions on risk decisions for the CDL-CIMs; Table 4 illustrates part of the 243 rules (3 × 3 × 3 × 3 × 3) and the associated DoB distribution.

3.4. Risk Prioritization Using RBN and Utility Functions

The Bayesian network is a graphical model based on probabilistic reasoning, which can synthesize the prior knowledge of experts, historical data, and other incomplete information. It has become one of the most effective theoretical models in the field of knowledge representation, reasoning, and prediction in the current uncertain environment. In view of the advantage that Bayesian networks can express nonlinear causality in uncertain environments, Bayesian inference can be used as a tool to synthesize the DoB of different rules in the assessment process of multiple criteria for a designated risk factor. To achieve rule aggregation, the FBR established in Section 3.3 is first represented in the form of conditional probabilities. For example, rule #2 in Table 4 can be represented in the form of conditional probability as follows.
p ( R r L 1 , D 1 , C S 1 , C Q 1 , C C 2 ) = ( 0.866 , 0.134 , 0 )
The questionnaire is designed and distributed to experts with relevant background knowledge in order to obtain their DoB for the risk parameters, namely the L, D, CS, CQ, and CC associated with each risk factor. Compared with an ordinary Likert scale questionnaire, using DoB involves respondents’ uncertainty when answering questions, thus providing more useful risk insights. Based on the Bayesian network modelling theory, the risk parameter structure can be transformed into a Bayesian network topology graph with 5 parent nodes (L, D, CS, CQ, CC) and one child (R) node, as shown in Figure 5.
The collected data are processed using a weighted average, and the evaluation of risk parameters, namely the prior probability of each parent node, can be used as input information for the Bayesian network model. The FBR in Table 4 is transformed as a conditional probability, and finally, the risk reasoning process based on belief rules can be simplified to the calculation of the marginal probability of child nodes [40]. The marginal probability of the child nodes can be obtained according to Equation (15), that is, the probability distribution of risk states (Rr) for each factor.
P R r = i = 1 3 j = 1 3 k = 1 3 l = 1 3 m = 1 3 P ( R r L i , D j , C S k , C Q l , C C m ) P ( L i ) P ( D j ) P ( C S k ) P ( C Q l ) P ( C C m ) ( r = 1 , 2 , 3 )
where L, D, CS, CQ, and CC represent antecedent attributes in the FBR, respectively, i, j, k, l, and m refer to the number of linguistic variables, respectively, p(Li) represents the probability of risk paraments L taking the ith linguistic variable, p(Di), p(CSk), p(CQl), and p(CCm) are similar to that, p(Rr) is the probability that the risk state is at the rth level.
Subsequently, appropriate utility values UVRr are introduced to convert the DoB of the risk status of each risk factor into a precise value for ranking purposes [42]. The new RIN is established using Formula (16):
R I N = r = 1 3 p ( R r ) U V R r , U V R r = 10 r 1
where p(Rr) is the probability that the risk factor in the three risks states. This paper employed UVR1 = 1 (101−1), UVR2 =10 (102−1), and UVR3 = 100 (103−1). 101−1 refers to the “lowest level” (minimal contribution to the risk status) and 103−1 means the “highest level” (maximum contribution to the risk status). The larger the value of RIN, the more serious the threat of risk factors.

4. Results and Discussion

4.1. Case Study Results

To illustrate how the methodology proposed in Section 3 can be implemented in actual risk assessments, the date needed in the above model is obtained by analyzing the investigation results from five decision makers with more than 15 years of work experience from the Logistics Department of Shanghai Waigaoqiao Shipbuilding Co. Ltd. (SWS), Shanghai, China. China’s first domestically built cruise ship is being constructed in SWS currently. Learning from the construction experience of other countries, SWS pays special attention to the connection between concenralized distribution logistics and production planning. In addition, the Logistics Department is responsible for the centralization and in-plant distribution of various materials used in cruise construction, tracking delivery information throughout the process of transportation, and storage and distribution, which means that we would obtain effective and available information for research in this regard.
According to the three-grade evaluation scale as seen in Table 2, the subjective probability distributions from multiple experts’ judgments are merged using a weighted average approach based on the contribution of each expert. Due to the similar seniority of the five experts, an equal weight was assigned to each expert. We obtain the DoB for the five parameters (L, D, CS, CQ, CC) of risk factors listed in Table 1 as the input information of the RBN.
As an illustrative example due to the limited text space, we utilize the RBN method to describe the risk reasoning related to “limited storage ability and poor environment of warehouse ER2”. After aggregating experts’ opinions, the value of the experts evaluates L of “ER2” as “L1, 10.0%; L2, 53.3%; L3, 36.7%”, D as “D1, 46.7%; D2, 33.3%; D3, 20.0%”, CS as “CS1 28.4%; CS2, 33.3%; CS3, 38.3%”, CQ as “CQ1 20.0%; CQ2, 30.0%; CQ3, 50.0%”, and CC as “CC1 25.0%; CC2, 31.7%; CC3, 43.3%”. According to Equation (15), the risk status of “limited storage ability and poor environment of warehouse ER2” can be calculated as p (Rr) = (24.2%, 37.3%, 38.5%). As shown in Figure 6, this reasoning process can be displayed by using the Bayesian modelling software, Netica. The result is expressed as the risk status associated with the “limited storage ability and poor environment of warehouse ER2” and is acceptable with a 24.2% DoB, moderate with a 37.3% DoB, and significant with a 38.5% DoB.
To further analyze the risk prioritization of all factors in Table 1, the RIN of “limited storage ability and poor environment of warehouse ER2” is calculated using Equation (16) described in Section 3.4:
R I N ( E R 2 ) = p ( R 1 ) U V R 1 + p ( R 2 ) U V R 2 + p ( R 3 ) U V R 3 = 0.242 × 10 1 1 + 0.373 × 10 2 1 + 0.385 × 10 3 1 = 42.472
Similarly, The RIN for the rest of the risks can be calculated in the same way. According to the RIN, we can quantify and rank the identified 16 types of risks in the CDL-CIMs, as reported in Table 5.

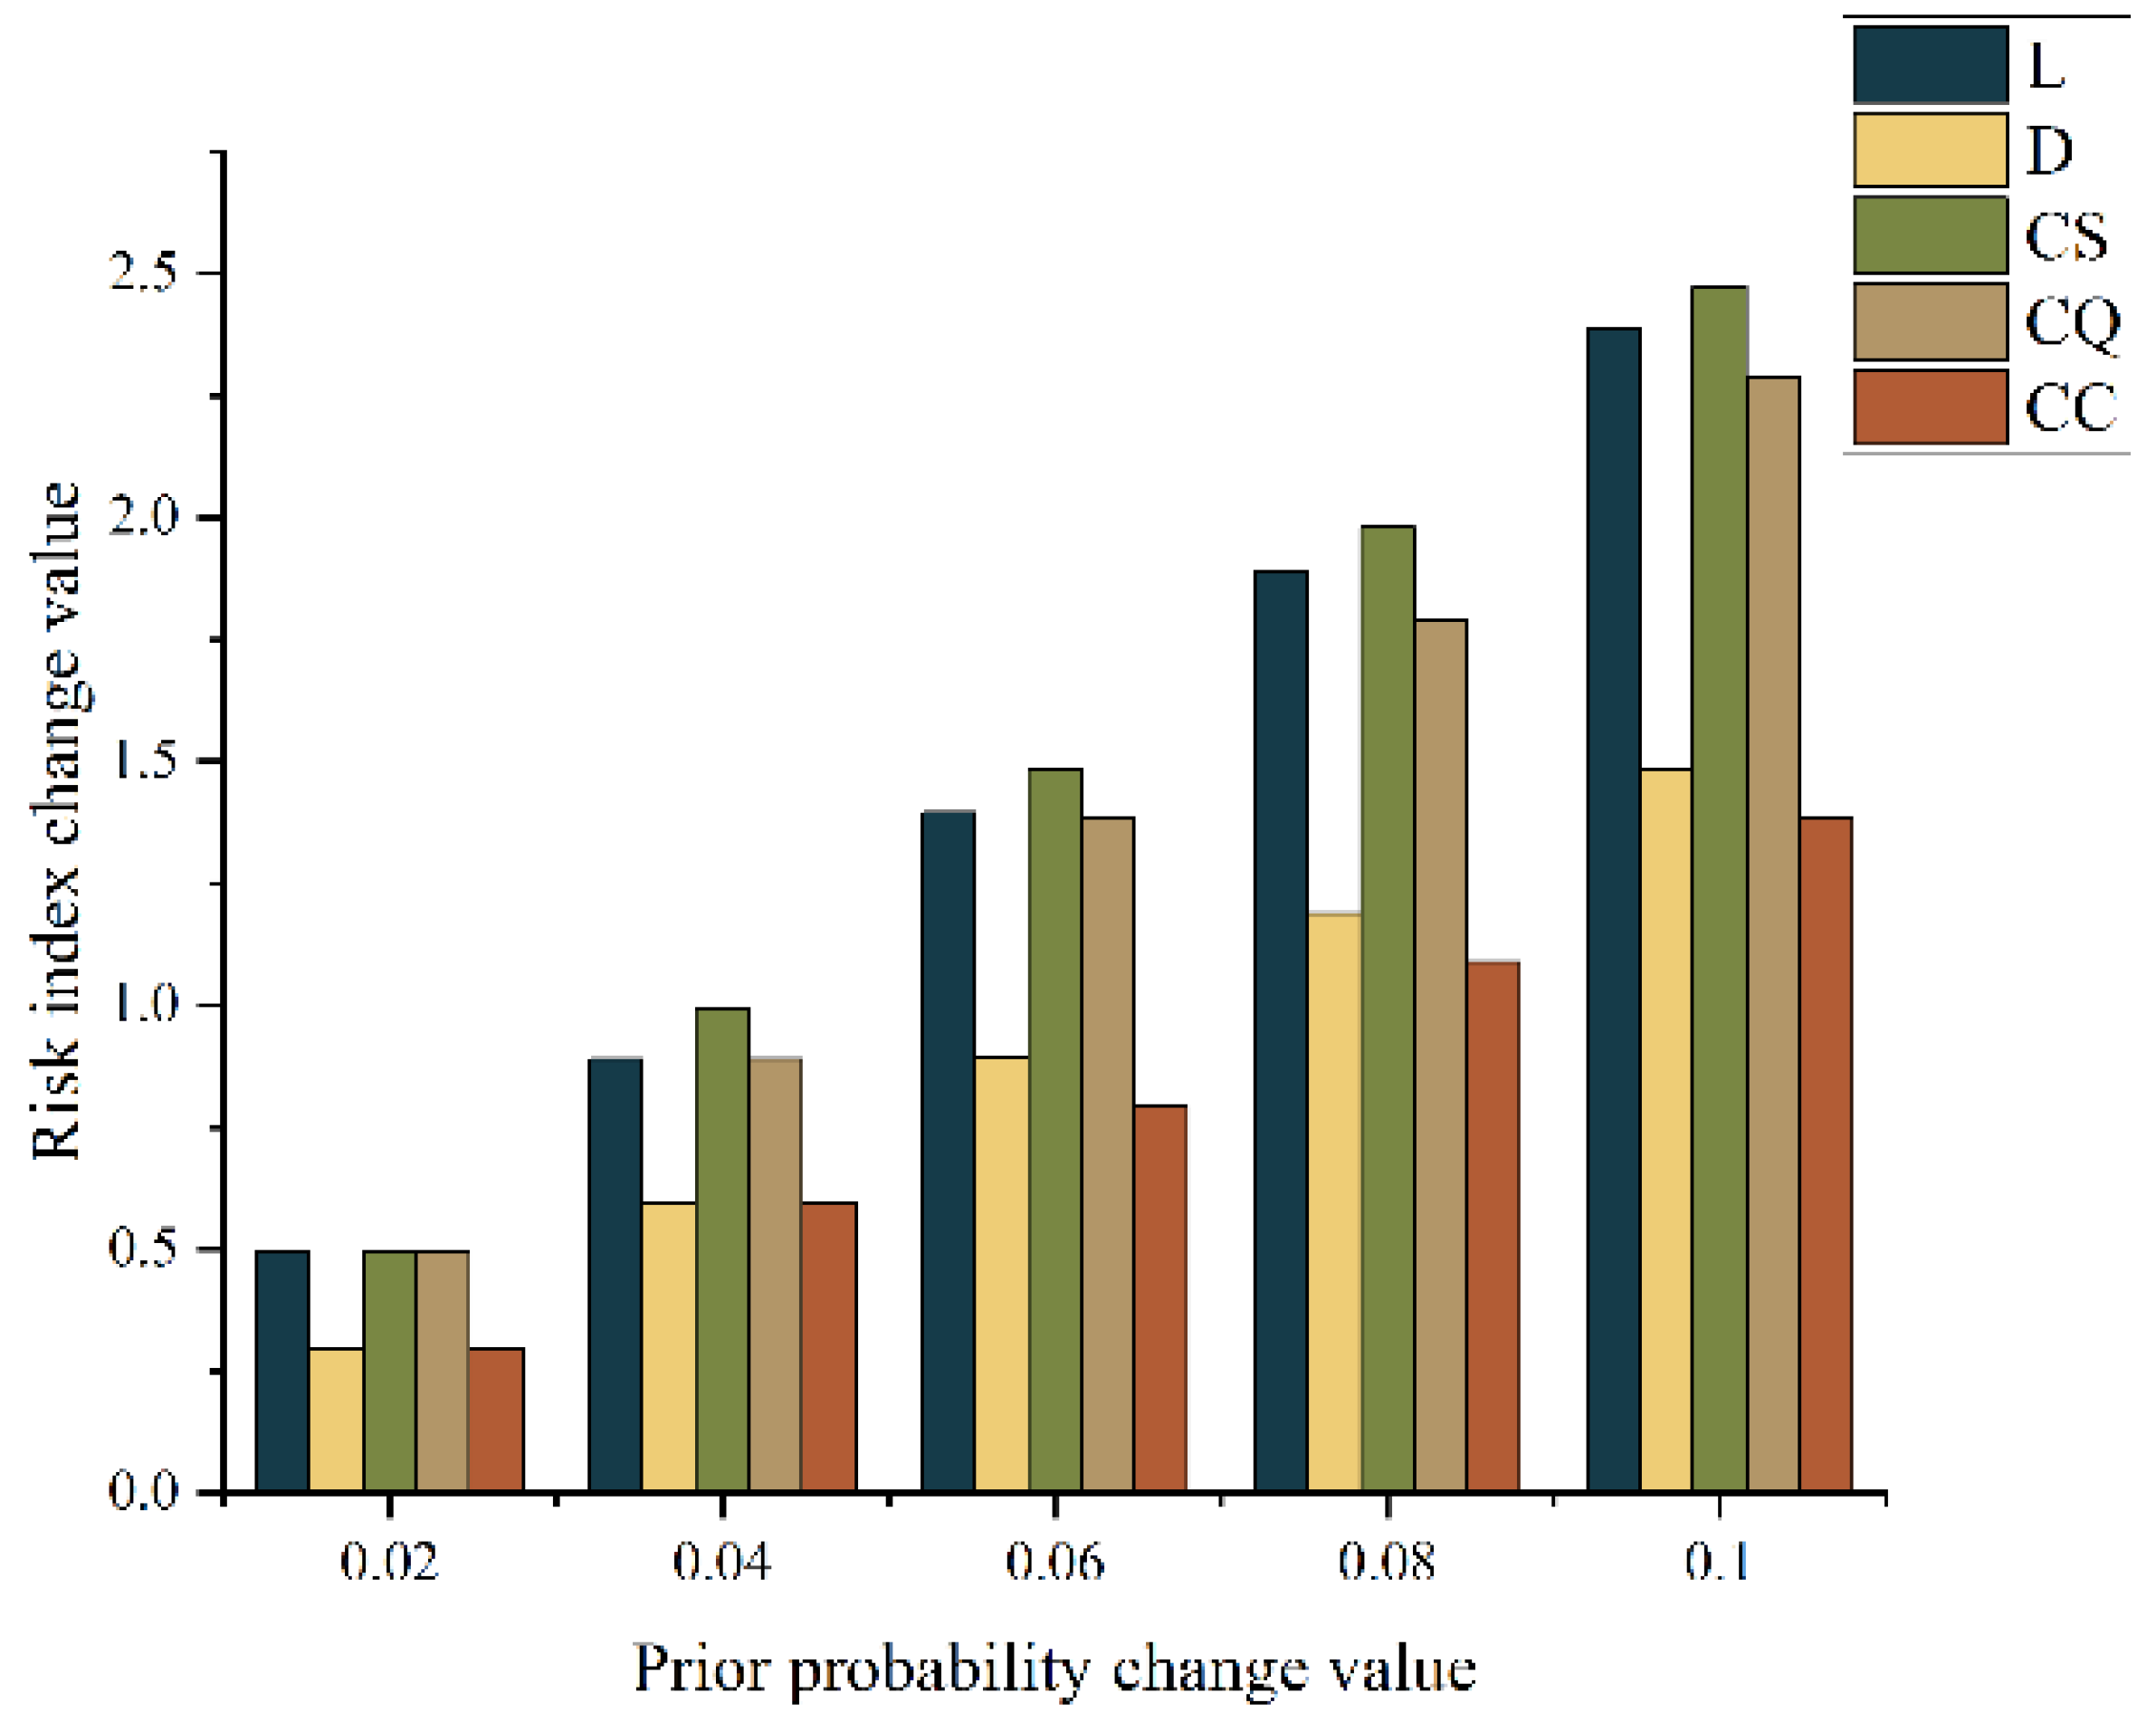
4.2. Sensitivity Analysis of the Model

Finally, sensitivity analysis should be conducted to test the logicality of the belief rules and the rationality of the hybrid method proposed. It checks how sensitive the output nodes (i.e., posterior probabilities of risk status or RIN) are to the minor changes in the input nodes (i.e., prior probabilities of risk parameters). In this paper, by adjusting the input risk parameters and observing the RIN correspondingly, we can understand the validity and reliability of the FBR and RBN deeply.
To illustrate the validation process, taking “E2” as an example, the impact of discrete and continuous changes in the risk parameters (prior probabilities) on the RIN (result) is simulated, respectively. The next step involves reassigning the expert′s evaluation probability of 0.1 to each risk parameter and then moving in the direction of the maximum increase in the RIN. If the model is rational, the RIN should increase accordingly. In that case, if the evaluation probability that the risk factor” E2” belongs to “CS1” decreases by 0.1, and, correspondingly, the probability of “CS2” increases by 0.1 (0.023 and 0.077, respectively), then the RIN of “ E2” increases from 42.472 to 44.974. Similarly, when the prior probabilities of the five risk parameters increase or decrease slightly toward the trend of increasing risk, it will lead to a synchronous increase or decrease in the RIN.
Further, a sensitivity analysis based on an interval [0, 0.1] is used for each risk parameter, where the change in the expert′s evaluation probability from 0 to 0.1 with 0.02 steps moves toward the maximal increment of the RIN. It can be seen from Figure 7 that there is a remarkable difference in the impact magnitudes of the expert′s evaluation probability changes on the RIN, and the impact magnitudes of RIN flow satisfy with the weight ratios of five risk parameters (CS > L > CQ > D > CC) in Section 3.2.1. In summary, it was verified via sensitivity analysis that the model is robust and the results are reliable.

4.3. Discussion

A comprehensive risk assessment framework is developed to analyze and evaluate the risks of the CDL-CIMs. First, in order to measure those risks precisely and meet multi- perspective decision-making requirements, we extend three risk parameters according to the risk consequence characteristics of the CDL-CIMs, namely “delayed schedule (CS)”, “damaged quality (CQ)”, and “additional cost (CC)”. Further, one suggestion is to notice that the factors of the risk parameters can be more diverse, such as dependance and safety [23]. Second, the calculation results of the risk parameter weights reveal that the severity of consequence is much more significant to the overall risk states in the CDL-CIMs. In other words, the “delayed schedule (CS)” is the most concerning for risk managers, followed by “occurrence likelihood (L)”. When the logistics schedule delay of materials is severe, even if the detection is not good, it will interfere with the smooth development of other work. This is in line with the requirements of risk management for cruise-building logistics. At the same time, it also reminds managers that efforts should be made to control the frequency of risks and the implementation of centralized distribution logistics activities strictly in accordance with the materials delivery schedule. Third, the rule-based Bayesian network and utility function are utilized to obtain exact risk values and their ranking. Any risk input modification related to the five risk parameters may trigger a change in the output node, which helps automate the risk assessment of any target risk factors within the CDL-CIMs instantly. The shortcoming in the classic FMEA of sameRPNs while showing different risk factors has been effectively solved. In additional, it is worth pointing out that the technique for order of preference by similarity to ideal solution (TOPSIS) also has great advantages in solving multi-criterion ranking problems and can be combined with the model proposed in this paper [43,44]. Additionally, consistent with the analysis of previous scholars [40,41,42,45], results from the sensitivity analysis confirm the reliability of the developed model in addressing the risk assessment problem.
The results show that the most significant threat was “poor management for the actors in logistics chain”, followed by “human errors”, “limited storage ability and poor environment of warehouse”, “ignorance of good handling practices during the operation of loading and unloading”, “improper storage and distribution resource allocation”, and “information sharing asymmetry”. Human and management risk accounts for the highest proportion among the first six critical threats. It can be challenging to manage multiple actors with multiple intersections of work for cruise-building shipyards. Additionally, human factors still account for most of the various logistics risk activities, with the reasons being that the worker did not follow the work standards, coupled with a lack of understanding of the characteristics of the imported materials for the cruise-building. On the other hand, the unclear monitoring of the material status leads to the centralized arrival of materials and causes the risk of warehouse bursting. The warehouse environment cannot meet the storage requirements of imported materials, resulting in quality damage. In addition, information sharing asymmetry affects the efficiency and accuracy of the concentralized distribution logistics of materials. After risk quantization and prioritization, the primary challenge to carry out is to find effective risk response strategies to combat significant risks. Furthermore, it is noted that these measures must be undertaken by all the participators in the concentralized distribution logistics system, who must cooperate with each other and execute their duties according to their contract. Adequate preparedness measures are suggested as follows: (1) the cruise-building shipyard should select the participants according to the standard and specify the service content and the liability for damages in the contract; (2) the strengthening of on-the-job education and training, which can reduce instances of personnel failing to comply with operation requirements and making communication errors; (3) increase the investment in storage resources according to the characteristics of different types of imported materials management and develop warehouse environment remote monitoring systems; (4) maintain equipment regularly, use the correct equipment, and handle materials according to reasonable operation procedures; (5) develop risk warning indicators related to warehousing and distribution, and make deployment warehousing and distribution resources from a risk perspective; (6) maintain close contact with participants of CDL-CIMs through the information sharing platform and quickly assist with processing.

5. Conclusions

In this paper, we address the research gap in relation to the risk assessment of concentralized distribution logistics in cruise-building. The main contribution is the insights for what risks may threaten the concentralized distribution logistics process related to the cruise-building imported materials. A risk assessment model combination with FMEA, FBR, and RBN was used in order to quantify and rank the identified risks. Moreover, the FBR developed in this study describes the randomness in uncertain information and decreases the information loss in the transformation process, as well as facilitates continuous risk management for CDL-CIMs. Three objectives are achieved. (1) The established risk factors list for CDL-CIMs using the empirical analysis and brainstorming with experts provides a valuable reference and enriches the body of knowledge related to concentralized distribution logistics risk. (2) This study has extended risk paraments by introducing “delayed schedule”, “damaged quality”, and “additional cost” in the “severity of consequence” of the classical FMEA and considers the differential weights of the five risk parameters. (3) A hybrid risk assessment model was established to quantitatively rank the risk factors of the CDL-CIMs.
According to the results of the application on the first cruise ship being constructed in China, the most significant threat is “poor management for the actors in logistics chain MR1”, followed by “human errors MR5”, “limited storage ability and poor environment of warehouse ER2”, “ignorance of good handling practices during the operation of loading and unloading OR2”, “improper storage and distribution re source allocation MR2”, and “information sharing asymmetry IR1”. Findings suggest that more attention should be paid to human and management risk. In addition, resource scheduling management and information sharing should be made as important preventive actions for the cruise-building shipyard, which are effective ways to reduce the overall risk levels of the CDL-CIMs. The results of this work are crucial as a supplement to the current knowledge about the risk assessment of such systems in the cruise-building logistics field. Meanwhile, the risk ranking results enable the concentralized distribution logistics managerial practitioners to have a more comprehensive understanding of the risks that affected the CDL-CIMs. Additionally, the conclusion provides a profound insight into further managing the overlooked risks of China’s first cruise-building.
The developed study has several limitations, which can be improved in future work. First, opinions from more practitioners in different cruise-building shipyards to improve the generalization of the risk ranking results. Second, more parameters such as the strength of the interaction of risk and the risk controllability can be added to the structure of risk parameters for CDL-CIMs. Finally, this study only proposed a risk assessment framework to identify and assess the risks of CDL-CIMs. Therefore, in the next stage, future studies should focus on selecting suitable risk response strategies based on the optimization model to address the current challenges associated with risks in CDL-CIMs and design a resilient concentralized distribution logistics system.

Author Contributions

Conceptualization, Z.C. and H.W.; methodology, Z.C.; software, Z.C.; validation, Z.C., H.W. and J.X.; data curation, Z.C., H.W. and J.X.; formal analysis, Z.C. and H.W.; investigation, J.X.; writing—original draft preparation, Z.C.; writing—review and editing, H.W.; supervision, H.W.; project administration, J.X. All authors have read and agreed to the published version of the manuscript.

Funding

Grant Number MC-202009-Z03 for this study.

Institutional Review Board Statement

Not applicable.

Informed Consent Statement

Not applicable.

Data Availability Statement

Not applicable.

Acknowledgments

The authors would like to thank those who provided kind help on improving the work. We also thank the editors and the anonymous reviewers for their constructive suggestions on improving the paper.

Conflicts of Interest

The authors declare no potential conflict of interest.

References

  1. Mileski, J.P.; Wang, G.; Beacham IV, L.L. Understanding the causes of recent cruise ship mishaps and disasters. Res. Transp. Bus. Manag. 2014, 13, 65–70. [Google Scholar] [CrossRef] [Green Version]
  2. Lau, Y.Y.; Yip, T. The Asia cruise tourism industry: Current trend and future outlook. Asian J. Shipp. Logist. 2020, 36, 202–213. [Google Scholar] [CrossRef]
  3. Sun, X.; Feng, X.; Gauri, D. The cruise industry in China: Efforts, progress and challenges. Int. J. Hosp. Manag. 2014, 42, 71–84. [Google Scholar] [CrossRef]
  4. Wondirad, A. Retracing the past, comprehending the present and contemplating the future of cruise tourism through a meta-analysis of journal publications. Mar. Policy 2019, 108, 103618. [Google Scholar] [CrossRef]
  5. Hung, K.; Huang, H.; Lyu, J. The means and ends of luxury value creation in cruise tourism: The case of Chinese tourists. J. Hosp. Tour. Manag. 2020, 44, 143–151. [Google Scholar] [CrossRef]
  6. Xiang, Z.; Yang, J.; Naseem, M.; Xiang, Z. Occupational Health and Safety Risk Assessment of Cruise Ship Construction Based on Improved Intuitionistic Fuzzy TOPSIS Decision Model. Math. Probl. Eng. 2021, 2021, 5966711. [Google Scholar] [CrossRef]
  7. Liu, B.; Liu, N.; Chen, Y. Diagnostic test decision for suppliers in cruise-building supply chain with information asymmetry. Adv. Eng. Inform. 2021, 49, 101350. [Google Scholar] [CrossRef]
  8. Könnölä, K.; Kangas, K.; Seppälä, K.; Mäkelä, M.; Lehtonen, T. Considering sustainability in cruise vessel design and construction based on existing sustainability certification systems. J. Clean. Prod. 2020, 259, 120763. [Google Scholar] [CrossRef]
  9. Ferreira, F.D.A.L. An Empirical Risk Analysis of the Brazilian Shipbuilding Industry. Ph.D. Thesis, Programa de Pós-Graduação em Engenharia de Produção of the Departamento de Engenharia Industrial, Pontifical Catholic University of Rio de Janeiro (PUC-RIO), Rio de Janeiro, Brazil, 2015. [Google Scholar]
  10. Crispim, J.; Fernandes, J.; Rego, N. Customized risk assessment in military shipbuilding. Reliab. Eng. Syst. Saf. 2020, 197, 106809. [Google Scholar] [CrossRef]
  11. Zheng, Y.; Ke, J.; Wang, H. Risk Propagation of Concentralized Distribution Logistics Plan Change in Cruise Construction. Processes 2021, 9, 1398. [Google Scholar] [CrossRef]
  12. Mouschoutzi, M.; Ponis, S. A comprehensive literature review on spare parts logistics management in the maritime industry. Asian J. Shipp. Logist. 2022, 38, 71–83. [Google Scholar] [CrossRef]
  13. Alfnes, E.; Gosling, J.; Naim, M.; Dreyer, H. Exploring systemic factors creating uncertainty in complex engineer-to-order supply chains: Case studies from Norwegian shipbuilding first tier suppliers. Int. J. Prod. Econ. 2021, 240, 108211. [Google Scholar] [CrossRef]
  14. Yue, W.; Zhang, Q. Research on the Shipbuilding Supply Chain Risk Control. In Proceedings of the 2008 IEEE International Conference on Automation and Logistics, Qingdao, China, 1–3 September 2008; pp. 2205–2208. [Google Scholar]
  15. Zhu, J.; Wang, H.; Xu, J. Fuzzy DEMATEL-QFD for Designing Supply Chain of Shipbuilding Materials Based on Flexible Strategies. J. Mar. Sci. Eng. 2021, 9, 1106. [Google Scholar] [CrossRef]
  16. Wang, J.; Yin, J.; Khan, R.; Wang, S.; Zheng, T. A Study of Inbound Logistics Mode Based on JIT Production in Cruise Ship Construction. Sustainability 2021, 13, 1588. [Google Scholar] [CrossRef]
  17. Bowles, J.B.; Peláez, C. Fuzzy logic prioritization of failures in a system failure mode, effects and criticality analysis. Reliab. Eng. Syst. Saf. 1995, 50, 203–213. [Google Scholar] [CrossRef]
  18. Wang, X.; Xia, G.; Zhao, J.; Wang, J.; Yang, Z.; Loughney, S.; Fang, S.; Zhang, S.; Xing, Y.; Liu, Z. A novel method for the risk assessment of human evacuation from cruise ships in maritime transportation. Reliab. Eng. Syst. Saf. 2023, 230, 108887. [Google Scholar] [CrossRef]
  19. Catelani, M.; Ciani, L.; Venzi, M. Failure modes, mechanisms and effect analysis on temperature redundant sensor stage. Reliab. Eng. Syst. Saf. 2018, 180, 425–433. [Google Scholar] [CrossRef]
  20. Liu, P.; Li, Y. An improved failure mode and effect analysis method for multi-criteria group decision-making in green logistics risk assessment. Reliab. Eng. Syst. Saf. 2021, 215, 107826. [Google Scholar] [CrossRef]
  21. Yang, Z.; Bonsall, S.; Wang, J. Fuzzy rule-based Bayesian reasoning approach for prioritization of failures in FMEA. IEEE Trans. Reliab. 2008, 57, 517–528. [Google Scholar] [CrossRef]
  22. Liu, H.C.; Liu, L.; Bian, Q.; Lin, Q.; Dong, N.; Xu, P. Failure mode and effects analysis using fuzzy evidential reasoning approach and grey theory. Expert Syst. Appl. 2011, 38, 4403–4415. [Google Scholar] [CrossRef]
  23. Mzougui, I.; Carpitella, S.; Certa, A.; El Felsoufi, Z.; Izquierdo, J. Assessing Supply Chain Risks in the Automotive Industry through a Modified MCDM-Based FMECA. Processes 2020, 8, 579. [Google Scholar] [CrossRef]
  24. Zheng, H.; Tang, Y. Deng Entropy Weighted Risk Priority Number Model for Failure Mode and Effects Analysis. Entropy 2020, 22, 280. [Google Scholar] [CrossRef] [PubMed] [Green Version]
  25. Nie, R.X.; Tian, Z.; Wang, X.; Wang, J.; Wang, T. Risk evaluation by FMEA of supercritical water gasification system using multi-granular linguistic distribution assessment. Knowl.-Based Syst. 2018, 162, 185–201. [Google Scholar] [CrossRef]
  26. Liu, H.C.; You, J.; Li, P.; Su, Q. Failure Mode and Effect Analysis Under Uncertainty: An Integrated Multiple Criteria Decision Making Approach. IEEE Trans. Reliab. 2016, 65, 1380–1392. [Google Scholar] [CrossRef]
  27. Tooranloo, H.S.; Ayatollah, A. A model for failure mode and effects analysis based on intuitionistic fuzzy approach. Appl. Soft Comput. 2016, 49, 238–247. [Google Scholar] [CrossRef]
  28. Chai, J.; Xian, S.; Lu, S. Z probabilistic linguistic term sets and its application in multi-attribute group decision making. Fuzzy Optim. Decis. Mak. 2021, 20, s10700–s107021. [Google Scholar] [CrossRef]
  29. Huang, J.; Li, Z.; Liu, H. New approach for failure mode and effect analysis using linguistic distribution assessments and TODIM method. Reliab. Eng. Syst. Saf. 2017, 167, 302–309. [Google Scholar] [CrossRef]
  30. Ko, W.C. Exploiting 2-tuple linguistic representational model for constructing HOQ-based failure modes and effects analysis. Comput. Ind. Eng. 2013, 64, 858–865. [Google Scholar] [CrossRef]
  31. Shan, H.; Tong, Q.; Shi, J.; Zhang, Q. Risk Assessment of Express Delivery Service Failures in China: An Improved Failure Mode and Effects Analysis Approach. J. Theor. Appl. Electron. Commer. Res. 2021, 16, 2490–2514. [Google Scholar] [CrossRef]
  32. Zhu, J.; Shuai, B.; Li, G.; Chin, K.; Wang, R. Failure mode and effect analysis using regret theory and PROMETHEE under linguistic neutrosophic context. J. Loss Prev. Process Ind. 2020, 64, 104048. [Google Scholar] [CrossRef]
  33. Chang, C.H.; Kontovas, C.; Yu, Q.; Yang, Z. Risk assessment of the operations of maritime autonomous surface ships. Reliab. Eng. Syst. Saf. 2021, 207, 107324. [Google Scholar] [CrossRef]
  34. Safaeian, M.; Fathollahi-Fard, A.; Kabirifar, K.; Yazdani, M.; Shapouri, M. Selecting Appropriate Risk Response Strategies Considering Utility Function and Budget Constraints: A Case Study of a Construction Company in Iran. Buildings 2022, 12, 98. [Google Scholar] [CrossRef]
  35. Bahamid, R.A.; Doh, S.I. A review of risk management process in construction projects of developing countries. In Proceedings of the Global Congress on Construction, Material and Structural Engineering(GCOMSE2017), Johor Bahru, Malaysia, 28–29 August 2017. [Google Scholar]
  36. Mello, M.H.; Strandhagen, J. Supply chain management in the shipbuilding industry: Challenges and perspectives. Proc. Inst. Mech. Eng. Part M-J. Eng. Marit. Environ. 2011, 225, 261–270. [Google Scholar] [CrossRef]
  37. Saaty, T.L.; Shang, J. An innovative orders-of-magnitude approach to AHP-based mutli-criteria decision making: Prioritizing divergent intangible humane acts. Eur. J. Oper. Research 2011, 214, 703–715. [Google Scholar] [CrossRef]
  38. Liu, F.; Zhao, S.; Weng, M.; Liu, Y. Fire risk assessment for large-scale commercial buildings based on structure entropy weight method. Saf. Sci. 2017, 94, 26–40. [Google Scholar] [CrossRef]
  39. Zhu, J.; Wang, H.; Xu, B. Using Fuzzy AHP-PROMETHEE for Market Risk Assessment of New-Build River Cruises on the Yangtze River. Sustainability 2021, 13, 12932. [Google Scholar] [CrossRef]
  40. Wan, C.; Yan, X.; Zhang, D.; Qu, Z.; Yang, Z. An advanced fuzzy Bayesian-based FMEA approach for assessing maritime supply chain risks. Transp. Res. Part E-Logist. Transp. Rev. 2019, 125, 222–240. [Google Scholar] [CrossRef]
  41. Alyami, H.; Lee, P.; Yang, Z.; Riahi, R.; Bonsall, S.; Wang, J. An advanced risk analysis approach for container port safety evaluation. Marit. Policy Manag. 2014, 41, 634–650. [Google Scholar] [CrossRef]
  42. Gui, D.; Wang, H.; Yu, M. Risk Assessment of Port Congestion Risk during the COVID-19 Pandemic. J. Mar. Sci. Eng. 2022, 10, 150. [Google Scholar] [CrossRef]
  43. Shahsavar, M.M.; Akrami, M.; Kian, Z.; Gheibi, M.; Fathollahi-Fard, A.; Hajiaghaei-Keshteli, M.; Behzadian, K. Bio-recovery of municipal plastic waste management based on an integrated decision-making framework. J. Ind. Eng. Chem. 2022, 108, 215–234. [Google Scholar] [CrossRef]
  44. Liu, X.; Tian, G.; Fathollahi-Fard, A.; Mojtahedi, M. Evaluation of ships green degree using a novel hybrid approach combining group fuzzy entropy and cloud technique for the order of preference by similarity to the ideal solution theory. Clean Technol. Environ. Policy 2020, 22, 493–512. [Google Scholar] [CrossRef]
  45. Khan, R.U.; Yin, J.; Mustafa, F.; Anning, N. Risk assessment for berthing of hazardous cargo vessels using Bayesian networks. Ocean. Coast. Manag. 2021, 210, 105673. [Google Scholar] [CrossRef]
Figure 1. Overall risk management framework.
Processes 11 00859 g001
Figure 2. Methodological of risk assessment for CDL-CIMs.
Processes 11 00859 g002
Figure 3. Concentralized distribution logistics process in cruise-building imported materials.
Processes 11 00859 g003
Figure 4. The hierarchical structure of the five risk parameters.
Processes 11 00859 g004
Figure 5. Bayesian topology of risk reasoning.
Processes 11 00859 g005
Figure 6. Risk status of ER2 displayed using Netica software.
Processes 11 00859 g006
Figure 7. Sensitivity analysis of the influence of prior probability change on RIN change value.
Processes 11 00859 g007
Table 1. Risk factors list for CDL-CIMs.
Risk CategoryRisk Factor
Information risk IRInformation sharing asymmetry IR1
Document information incompleteness or inaccurateness IR2
Operation risk ORImpossibility of timely clearance of materials from customs OR1
Ignorance of good handling practices during the operation of loading and unloading OR2
Not inspected and registered before storage OR3
Incorrect materials selection and centralization for pallets OR4
Improper port terminal operations OR5
No planned distribution route in the shipyard OR6
Equipment and facilities risk ERMachine/equipment such as forklifts breakdown or inadequacy ER1
Limited storage ability and poor environment of warehouse ER2
Lack of advanced logistics technology ER3
Human and management risk MRPoor management for the actors in logistics chain MR1
Improper storage and distribution resource allocation MR2
Sudden materials requirement planning changes MR3
Lack of qualified labor force MR4
Human errors MR5
Table 2. Linguistic evaluation scale for the risk factors of five parameters.
ParameterEvaluationDefinition
Likelihood of occurrence (L)Unlikely (L1)Could happen; however, the probability of it happening is very rare (0 to 9%), occurs every six months to a year.
Likely (L2)Chance of happening is relatively high (10 to 69%), occurs every three to six months.
Most likely (L3)Can happen frequently (70 to 100%), occurs once a month.
Detection (D)Good (D1)Easy to detect through routine risk monitoring, so as to prevent risks in advance.
Normal (D2)Possible to detect through continuous risk monitoring and early warning.
Poor (D3)Difficult or impossible to detect through profound risk monitoring.
Schedule delay (CS)Minor delay (CS1)Average delayed hours of materials less than 24 h.
Medium delay (CS2)Average delayed hours of materials between 24 and 48 h.
Serious delay (CS3)Average delayed hours of materials exceeding 48 h.
Damaged to materials quality (CQ)Minor damage (CQ1)The damaged is 0 to 3% of the total; however, it does not affect production use.
Medium damage (CQ2)The damaged is 3 to 8% of the total, and some function affected.
Serious damage (CQ3)The damaged is over 8% of the total, and some function failed.
Additional cost (CC)Low (CC1)Economic loss/additional cost no more than 10% of the expected cost.
Medium (CC2)Economic loss/additional cost between 10 to 30% of the expected cost.
High (CC3)Economic loss/additional cost more than 30% of the expected cost.
Table 3. Classification of risk grades and possible action to be taken.
Risk GradesRisk AttitudePossible Measures
R1AcceptableNo additional controls are required. Ensuring existing risk indicators and controls are maintained.
R2ModerateRisk response strategies could be taken to mitigate and prevent risks, which should be implemented before there are risky consequences.
R3SignificantConsiderable resources shall be allocated to control the risk. If the risk impedes work in progress, immediate action should be taken to adjust production schedule.
Table 4. FBR with belief structures in FMEA.
NO.Risk Evaluation ParametersRisk Status
LDCSCQCCR1R2R3
1L1D1CS1CQ1CC1100
2L1D1CS1CQ1CC20.8660.1340
3L1D1CS1CQ1CC30.86600.134
241L3D3CS3CQ3CC10.13400.866
242L3D3CS3CQ3CC200.1340.866
243L3D3CS3CQ3CC3001
Table 5. Quantization and prioritization of risks in the CDL-CIMs.
Risk FactorsRisk StatusRINRankRisk Categories
R1R2R3
MR117.3%36.4%46.3%50.1131MR
MR518.9%42.0%39.1%43.4892MR
ER224.2%37.3%38.5%42.4723ER
OR223.5%41.2%35.3%39.6554OR
MR229.6%34.5%35.9%39.6465MR
IR132.4%32.2%33.6%37.1526IR
OR519.6%48.7%31.7%36.7667OR
ER327.1%40.5%32.4%36.7228ER
MR328.6%41.8%29.6%34.0669MR
OR129.0%42.2%28.8%33.31010OR
ER128.3%44.7%27.0%31.85311ER
MR447.6%23.5%28.9%31.72612MR
IR233.7%41.3%25.0%29.46713IR
OR328.0%48.1%23.8%28.89014OR
OR446.5%29.6%23.9%27.32515OR
OR632.6%48.7%18.7%23.89616OR
Disclaimer/Publisher’s Note: The statements, opinions and data contained in all publications are solely those of the individual author(s) and contributor(s) and not of MDPI and/or the editor(s). MDPI and/or the editor(s) disclaim responsibility for any injury to people or property resulting from any ideas, methods, instructions or products referred to in the content.

