Article

Integrated Optimization for the Coupling Network of Refinery and Synthetic Plant of Chemicals

School of Chemical Engineering & Technology, Xi’an Jiaotong University, Xi’an 710049, China
*
Authors to whom correspondence should be addressed.
Processes 2023, 11(3), 789; https://doi.org/10.3390/pr11030789
Submission received: 14 February 2023 / Revised: 25 February 2023 / Accepted: 27 February 2023 / Published: 7 March 2023
(This article belongs to the Special Issue Research on Process System Engineering)

Abstract

:
Synthetic plant of chemicals (SPC) consumes large amounts of hydrogen and carbon-oxides while refineries require high-purity hydrogen. Coal gasification (CG) and steam methane reforming (SMR) are common industrial hydrogen production technologies. Their gas products are essentially a mixture of H2, CO, and CO2. Therefore, such gas products can provide both syngas for SPC and concentrated hydrogen for refinery through appropriate allocation. Based on the composition complementation of gas products from CG and SMR for their efficient utilization, this paper proposed an integration methodology for refinery and SPC coupling networks to conserve both fossil fuel resources and carbon emissions. A superstructure is established as a problem illustration and a nonlinear programming model (NLP) is formulated as a mathematical solution. A case study is performed, and the results show that the coupling network integration can save 19.1% and 20.2% of coal and natural gas consumption, as well as corresponding carbon emission and operation costs.

1. Introduction

The huge consumption of fossil fuels including oil, natural gas, and coal affects climate change and causes a series of environmental problems [1]; thus, there is increasing widespread interest in the efficient usage of energy resources and the reduction in carbon dioxide emission for sustainable development. According to the BP Statistical Review of World Energy [2] for 2021, primary energy consumption will be reduced by 4.5%, indicating that energy efficiency and emission reduction are becoming a major trend.
Coal is a non-renewable fossil fuel and has been used as the main source of energy for human production activities for several centuries. Jin et al. [3] proposed a coal-based natural gas-electricity co-generation process in which the syngas is delivered directly to the methanation unit without adjusting the hydrogen-to-carbon ratio to a suitable level. Thus, the CO2 concentration leaving the reactor is increased to reduce CO2 capture. Huang et al. [4] directly recycled the hydrogen-rich syngas exiting the conversion unit back to the low-temperature methanol wash unit to remove acid gas, so that the total process investment cost can be reduced by 13.2% and energy efficiency can be increased by 16.5%. Qin et al. [5] analyzed the effects of the steam-to-coal ratio, oxygen-to-coal ratio, and carbon dioxide charge on system performance, the results indicate that the carbon capture process saves 40.6% energy consumption compared to the coal-to-methanol process, 22.2% energy consumption compared to the coal to the hydrogen power process.
Natural gas is also an important part of the world’s energy supply and is one of the cleanest and safest sources of energy [6]. Oil has been the most important energy source for so many years but on a declining trend. Natural gas has risen to 24.2% and it is foreseen that at some point in the future, it will overtake oil and coal as the dominant global energy source [7]. Natural gas is playing an increasingly important role as a raw material for chemicals, and as a branch of the chemical industry, natural gas is used as the main raw material for the production of various chemical products through direct and indirect pathways. The direct conversion method uses the alkane component of natural gas to produce hydrogen [8], alkynes [9], olefins [10], aromatics [11], etc. The indirect conversion method first converts natural gas into synthesis gas (CO, H2) [12], which is then further converted into various chemical products such as clean oil, methanol, low carbon olefins, ammonia, and urea.
In addition to using coal and natural gas as feedstock, respectively, researchers have also conducted research on processes by combining the two energy sources as co-feedstocks. Zhou et al. [13] developed a dual co-production system using coal and natural gas as feedstock to produce dimethyl ether and electricity. The system was found to be highly efficient and economically effective in terms of hydrazine efficiency and a significant reduction in CO2 emission. In recent years, research on co-production processes for multiple chemicals has also received increasing attention. Yu et al. [14] conducted a study on the steady-state design and economic evaluation of a coal-based synthetic natural gas-ammonia gas co-production process. The results showed that when 20–40% percentage of syngas used for ammonia production can obviously reduce energy consumption and operation cost. Gu et al. [15] proposed fixed-bed coal gasification for the methanol process by partially reusing the carbon dioxide for methanol synthesis. The methane product is obtained through a deep cooling separation unit. This process can greatly improve carbon utilization and energy efficiency compared to the counterpart coal-to-gas process using the same amount of coal feedstock. Through the appropriate combination of coal gasification and steam methane reforming, the process is able to achieve a stepwise utilization of energy and a high-value production process, with the advantages of clean production and energy saving effect.
Hydrogen is a basic industrial raw material and occupies an important position in chemical industries, especially in refineries and SPC. China is the largest hydrogen manufacturer in the world. The productivity is 20 million tons of hydrogen in 2019, 62% of which comes from coal-to-hydrogen processes and 19% from natural gas reforming processes [16]. Both coal gasification and steam methane reforming consume large amounts of energy and are accompanied by CO2 emissions. With the “carbon neutralization” target, the conservation of hydrogen in chemical processes is becoming crucial. The concept of “hydrogen surplus” was first introduced by Alves [17] to determine the minimum flow of fresh hydrogen. El-Halwagi et al. [18] proposed a rigorous graphical solution to determine the minimum hydrogen utility based on the study of mass exchange networks. Zhao et al. [19] proposed the hydrogen load-flow diagram to obtain the minimum hydrogen utility. Foo et al. [20] proposed the gas cascade analysis by improving the water network optimization method. Zhang et al. [21] introduced contaminant load and hydrogen load as relative concentration constraints to perform pinch analysis for further hydrogen utility reduction. Yang et al. [22] developed relative concentration to describe individual hydrogen sources and hydrogen traps based on the basic concept of pinch points, which can determine the minimum fresh hydrogen consumption and pinch point locations. Li et al. [23] to reduce fresh hydrogen consumption through hydrogen storage. In addition to graphical methods, mathematical planning methods are also widely used. Hallale et al. [24] first established a mathematical model for the optimization of hydrogen systems. Zhang et al. [25] developed an NLP model containing all the necessary constraints for the synthesis of a multi-impurity hydrogen network based on relative concentration. Jia et al. [26] constructed a mixed integer non-linear programming (MINLP) model and identified the optimal impurity removal scenario to obtain the hydrogen network with the lowest annual cost. Liao et al. [27] proposed a superstructure hydrogen network optimization model considering a compressor and extended this approach to consider purification reuse.
Compared to refineries, the synthetic plant of chemicals (SPC) involves complex parameters, numerous equipment, and diverse processes, which also offer great potential for energy savings. Lin et al. [28] analyzed a coal-based methanol production system and demonstrated the advantages of coal to methanol in the power scenario. Bose et al. [29] proposed a coal-based system for power generation and CO2 for urea production. The results showed that the utilization of CO2 had a direct impact on economic performance and carbon emissions. Zhang et al. [30] proposed an integrated coal utilization through gasification, pyrolysis, and combustion for hydrogen to carbon ratio of coal syngas, natural gas, and/or biomass were introduced as co-feedstock to improve the hydrogen-to-carbon ratio of syngas and reduce carbon emissions. Chen and Barton [31] established a coal and biomass hybrid poly-generation system to synthesize methanol and naphtha, and simultaneously generate electricity and steam. Later, Adams and Barton [32] proposed a coal and natural gas system to synthesize methanol and F-T oil. Yang et al. [33] used natural gas and CO2 dry reforming to improve the hydrogen-to-carbon ratio of coal syngas to make ethylene more efficiently and reduce carbon emissions. Yang et al. [34] used hybrid CG, SMR, and graded conversion to produce methanol, oil, and electricity. In response to the low CH4-CO2 reforming syngas generation technologies to improve the performance of ethylene glycol synthesis system. For SPC, if an optimal hydrogen-to-carbon ratio feed gas can be produced at the syngas stage by trade-offs with refinery hydrogen, there will be a significant reduction in coal or natural gas consumption, as well as energy consumption and emission. The potential for coupled optimization of the refinery network and SPC is therefore enormous.
At the same time, the hydrogen-to-carbon ratio of the syngas produced by CG and SMR are complementary. Specifically, the hydrogen-to-carbon ratio of the syngas from SMR is higher than that of the syngas from CG. Therefore, the use of a combined CG and SMR supply to the coupled SPC-refinery system can have a high resource utilization efficiency. Studies have been carried out to address the impact of multiple resources on the system. For the coupling network of refinery hydrogen and SPC, Zhang et al. [35] have made a theoretical exploration and quasi-established an LP model for this problem. However, the reaction and separation of syngas are not considered. In this paper, the coupling integration of refinery-SPC through reaction and separation is carried out. A proxy model is established for the improvement of resource utilization and emission reduction. This work is great progress in refinery-SPC coupling network integration for resource conservation, energy efficient utilization, and emission reduction.

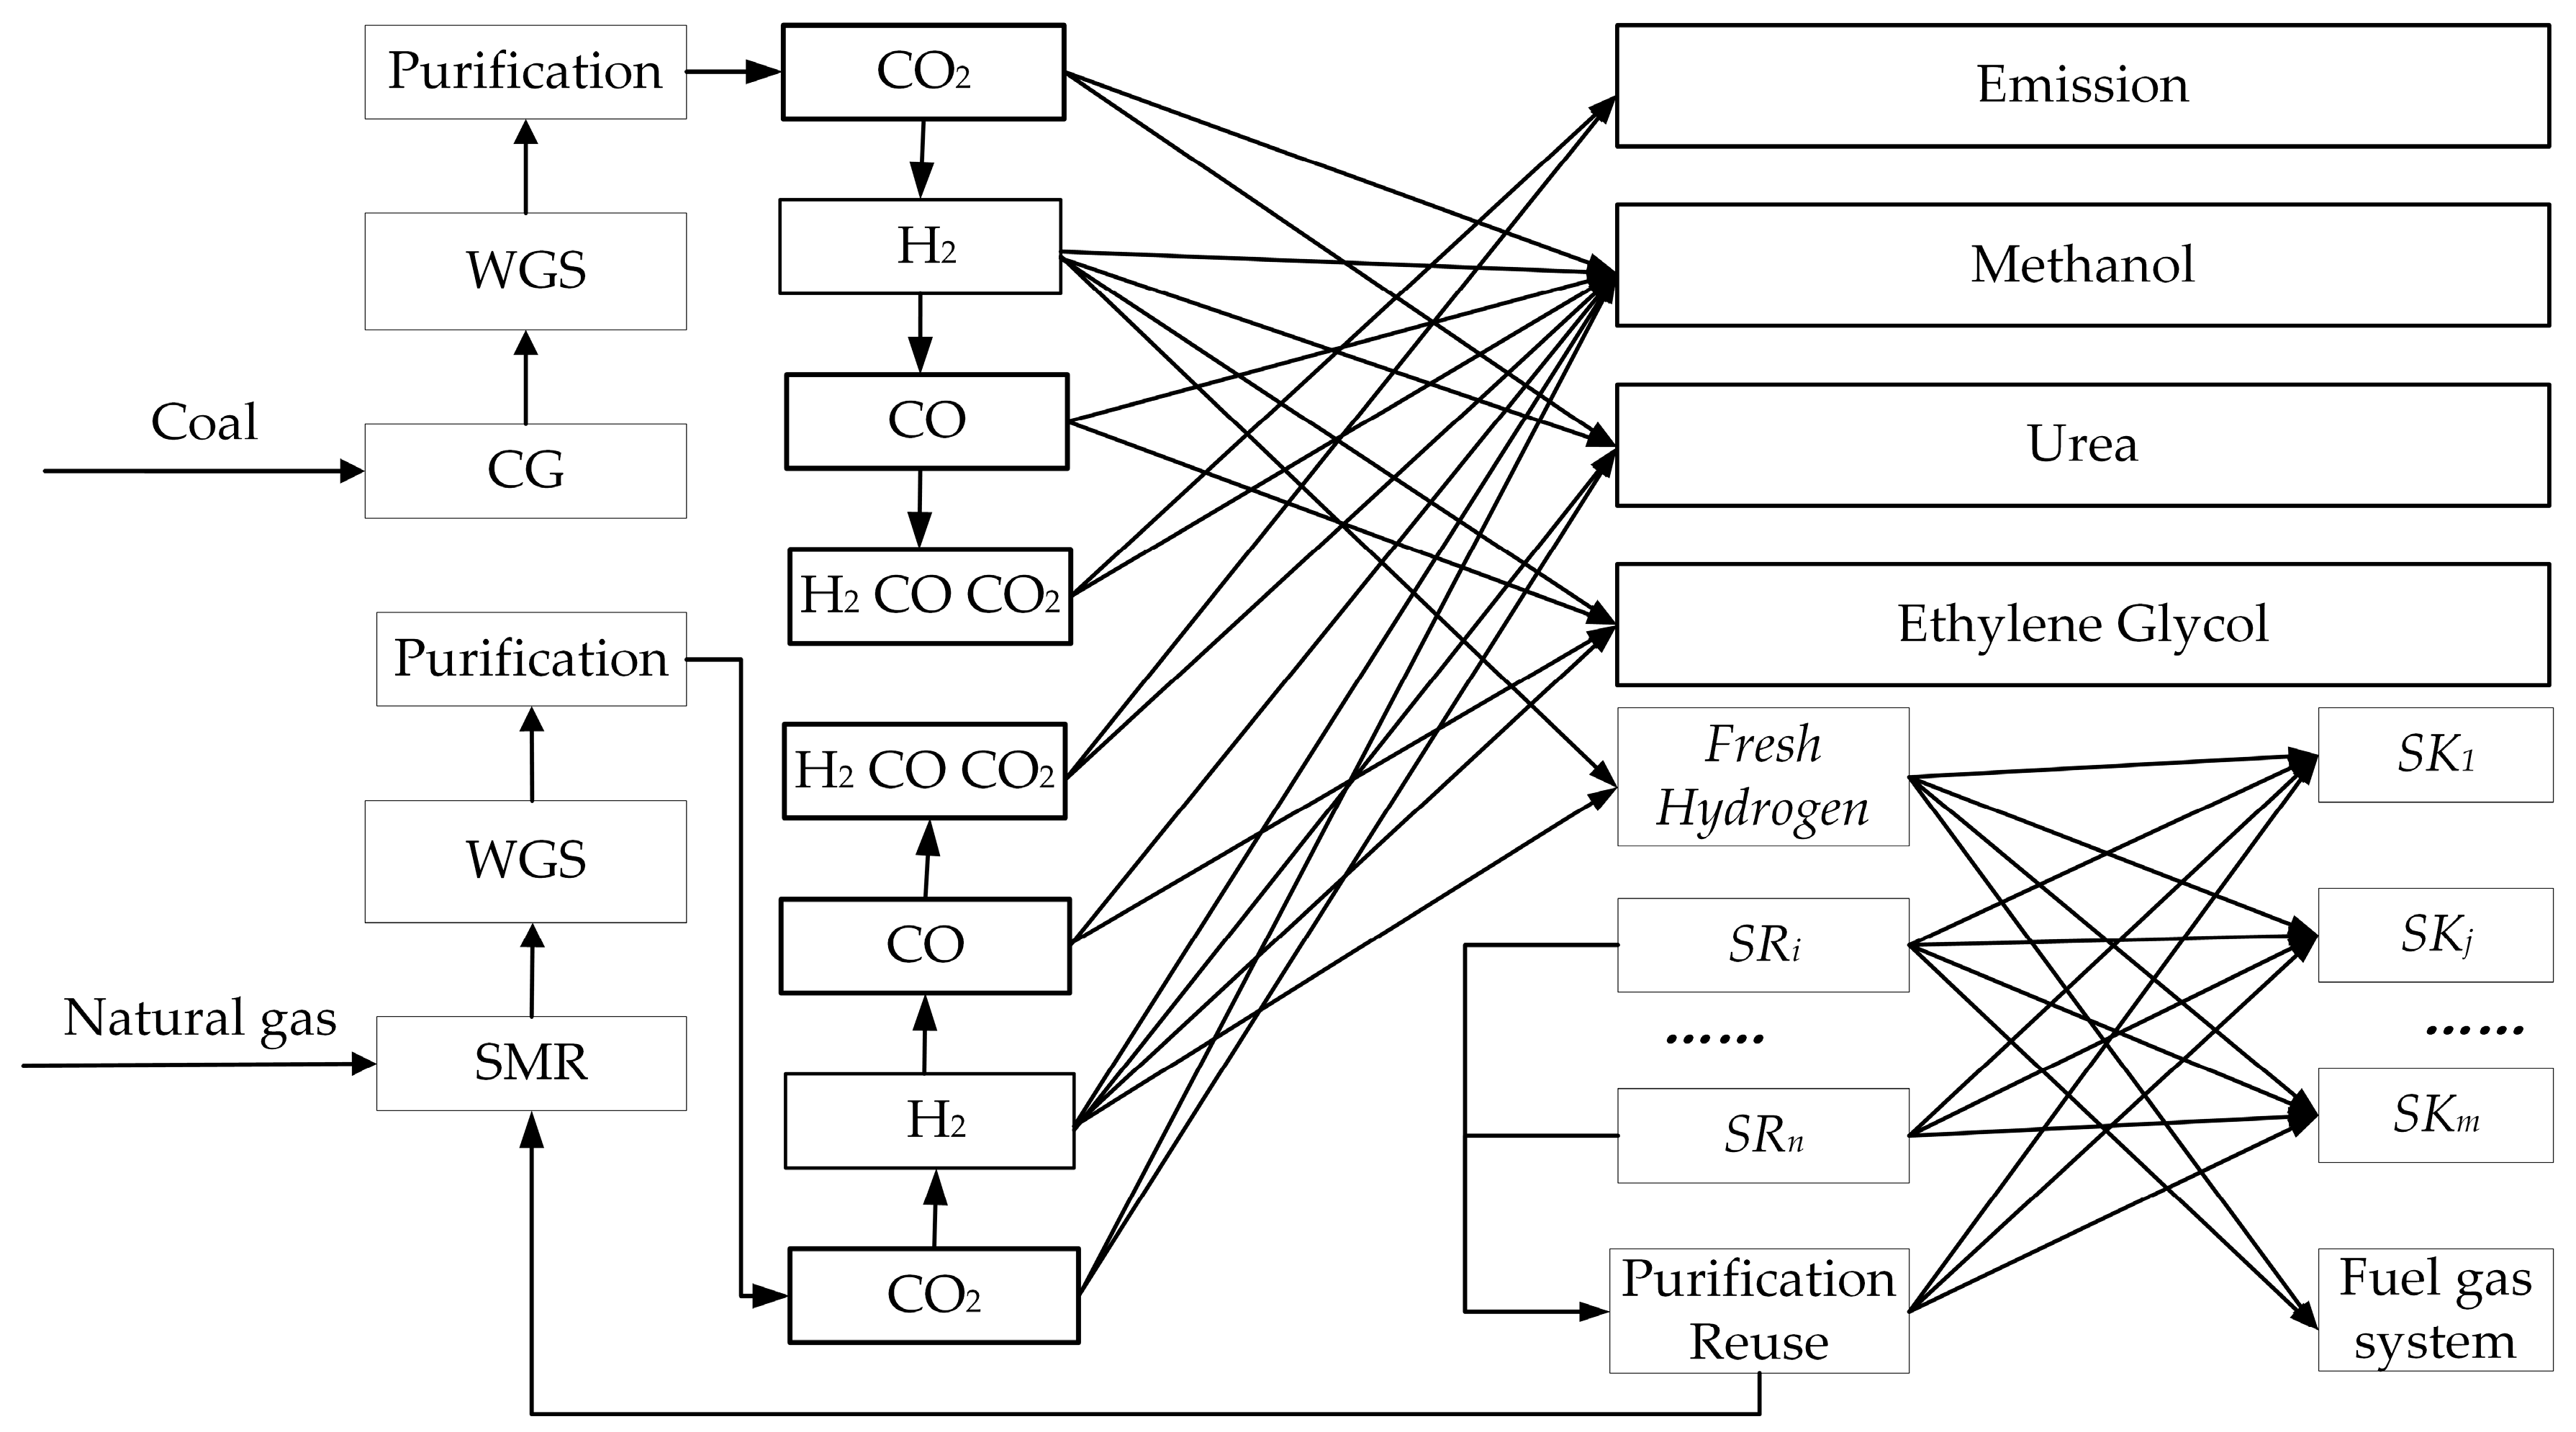
2. Problem Description

Syngas is a hinge source for many chemical production processes. On one hand, different reaction routes (SMR, GC) and different feed ratios (water to gas ratio, coal to oxygen ratio) significantly influence specific compositions in the production of syngas; on the other hand, various chemical scenarios such as refinery hydrogen systems, ammonia, and methanol synthesis require different compositions of hydrogen, carbon dioxide, and carbon monoxide in syngas. In order to improve the raw material utilization in the syngas production process and the waste of hydrogen and carbon monoxide, as well as carbon dioxide emissions in the syngas consumption scenarios, a coupling integration of the syngas production and consumption network is considered. Therefore, the aim of this study is to develop a mathematical methodology based on a proxy model for the optimal design of refinery and SPC.
The refinery-SPC network contains the generation and consumption of syngas, and all possible connections among these processes form the refinery-SPC coupling network. The superstructure constructed in this paper consists of two syngas production unit processes, a syngas network, and a hydrogen network, as shown in Figure 1. In the actual process, there are two sources of syngas, one is SMR and the other is CG. The generated syngas goes through separation to obtain pure carbon monoxide, carbon dioxide, hydrogen, and syngas for SPC and refinery. The SPC includes three synthesis units of methanol, glycol, and urea. The gas mixture is generated by coal gasification (CG) and methane steam reforming (SMR). Afterwards, the gas mixture is separated to successively obtain pure H2, CO2, and CO, and the remaining syngas is supplied to methanol, ethylene glycol, and urea in SPC while refinery hydrogen processing for product oils. Specifically, pure hydrogen can be supplied to methanol, ethylene glycol, urea ammonia and refinery; pure CO2 and CO can only be supplied to urea and methanol; pure CO can be supplied to methanol and ethylene glycol; H2 can be delivered to both SPC and refinery. This paper presents an optimization methodology to obtain the optimal gas allocation network.
In order to reduce the complexity of the model, the following assumptions are made previously to simplify the refinery-SPC network superstructure:
(1) The SPC network only considers the feed requirements of each synthesis unit and does not include a rigorous mechanistic model for reaction.
(2) The separation process only considers the mass balance of the gas mixture without a detailed simulation.

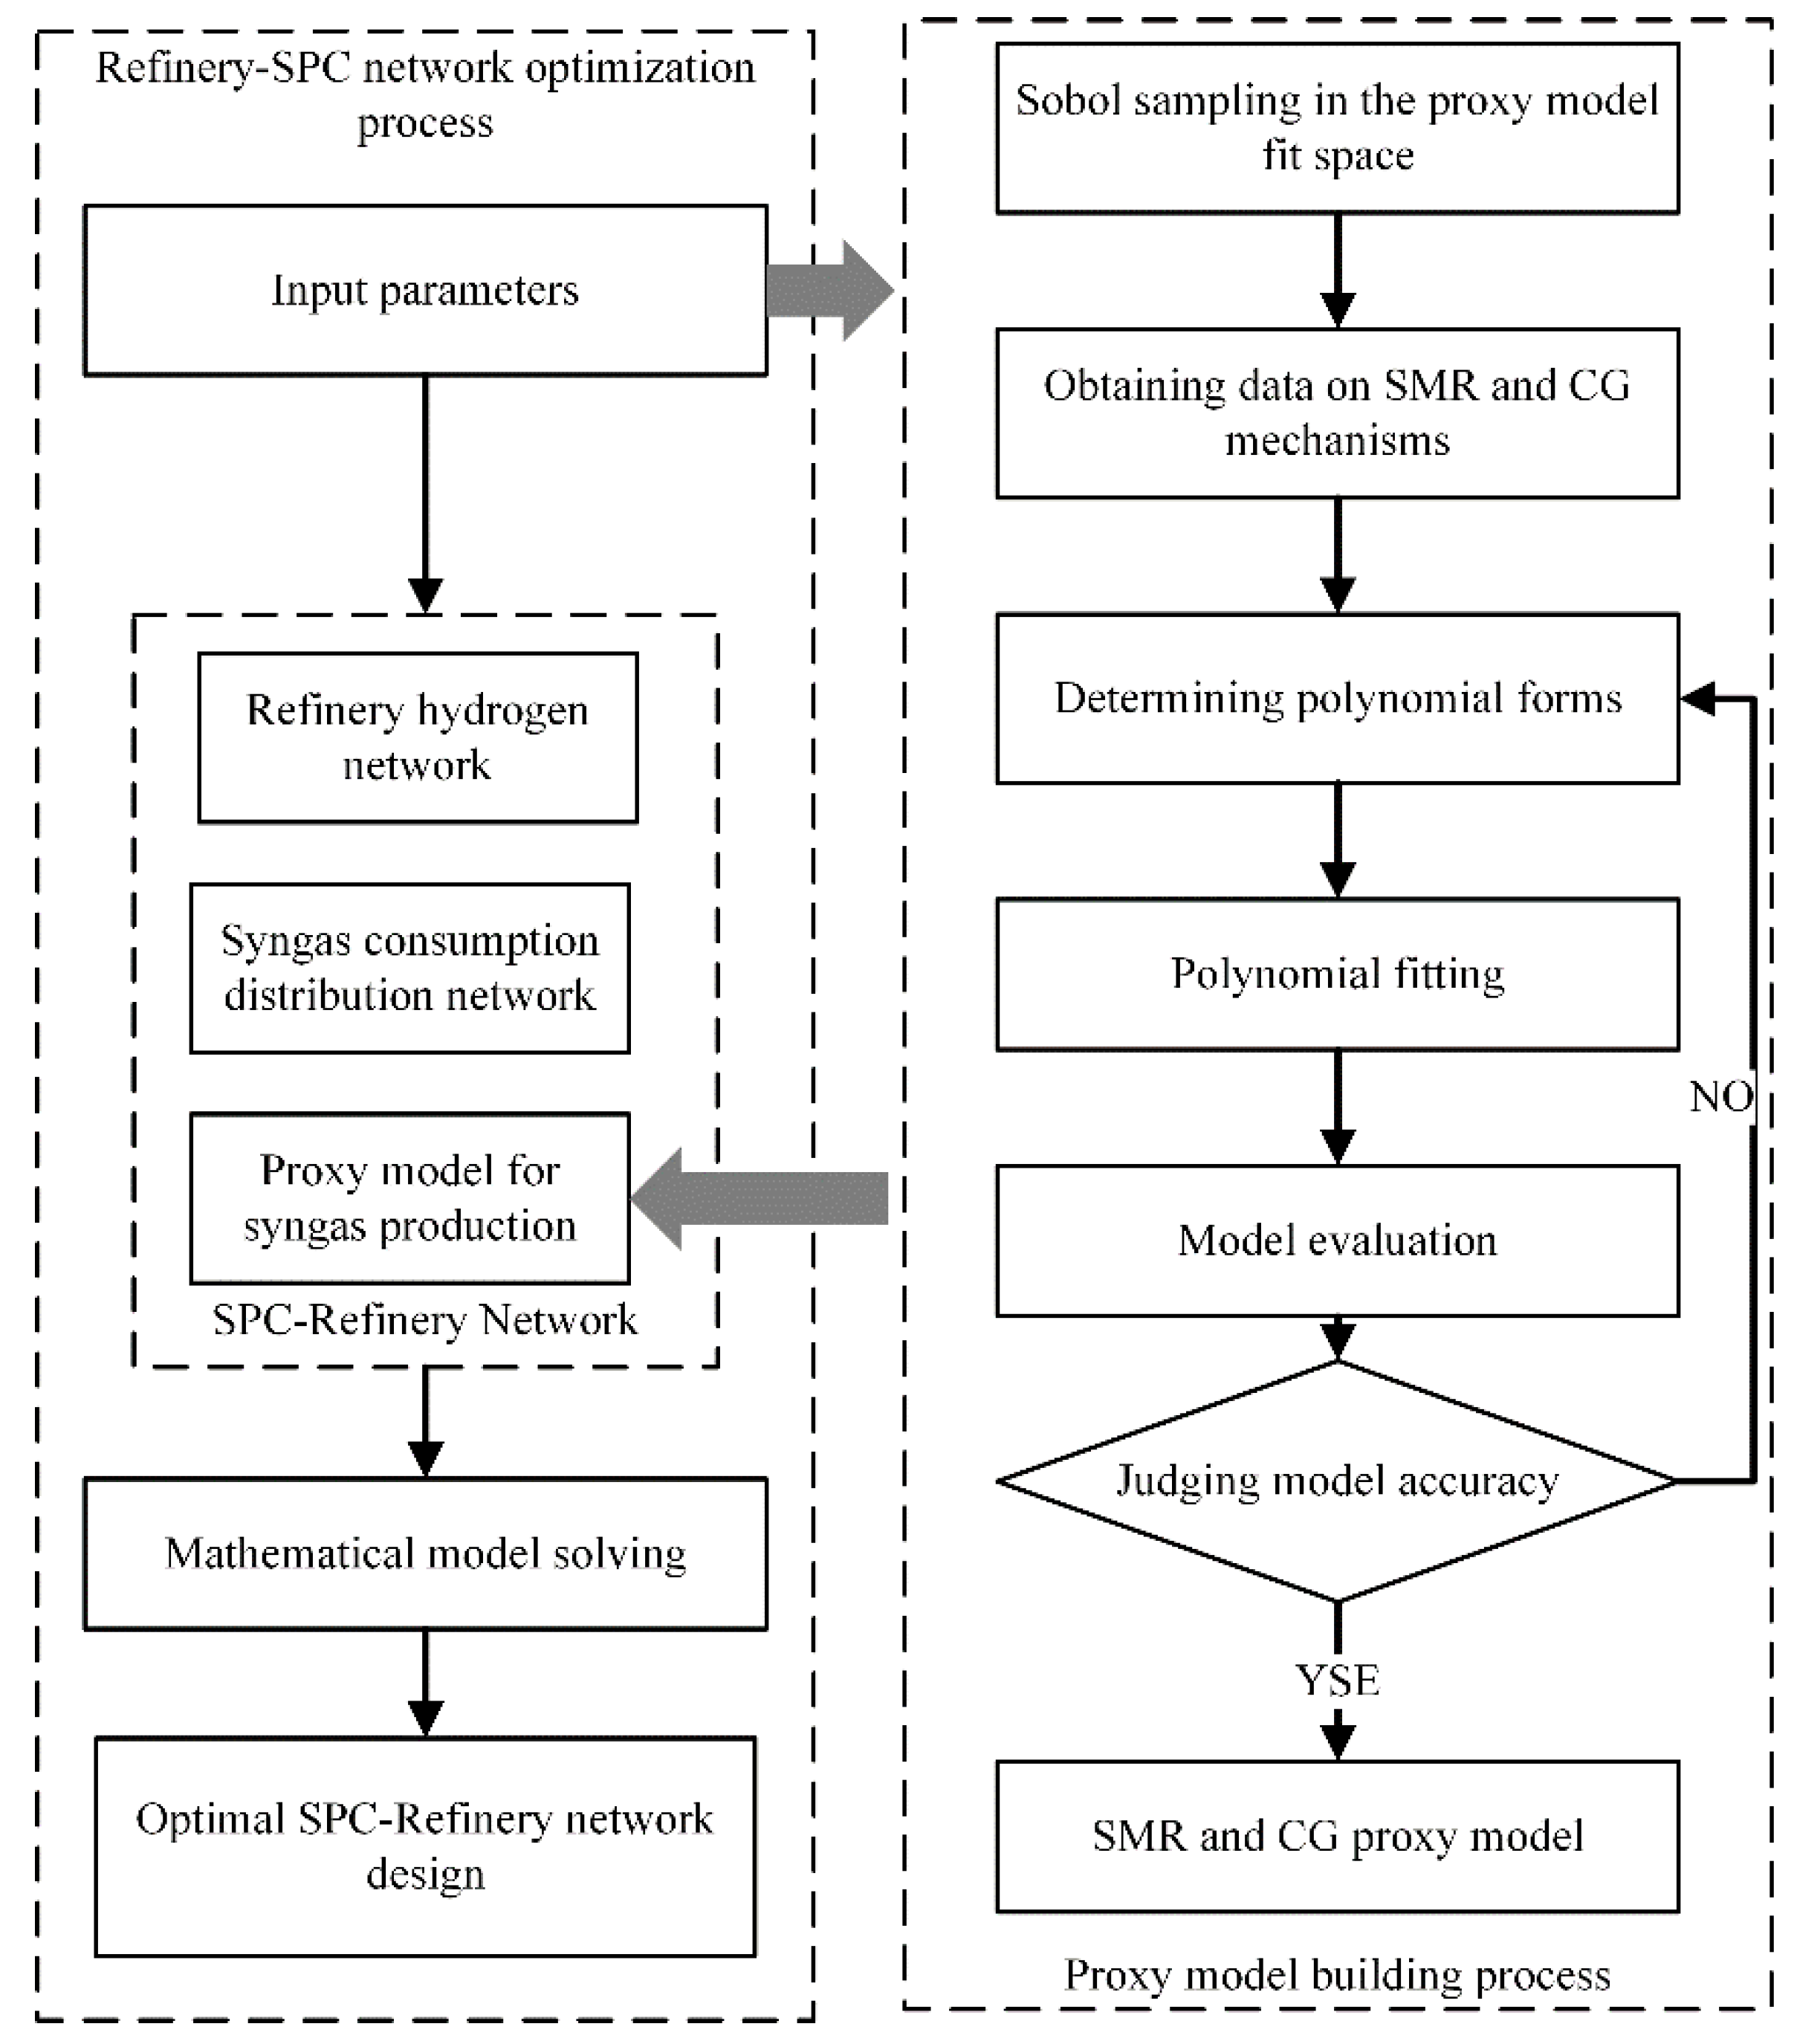
3. Optimization Model and Solution Method
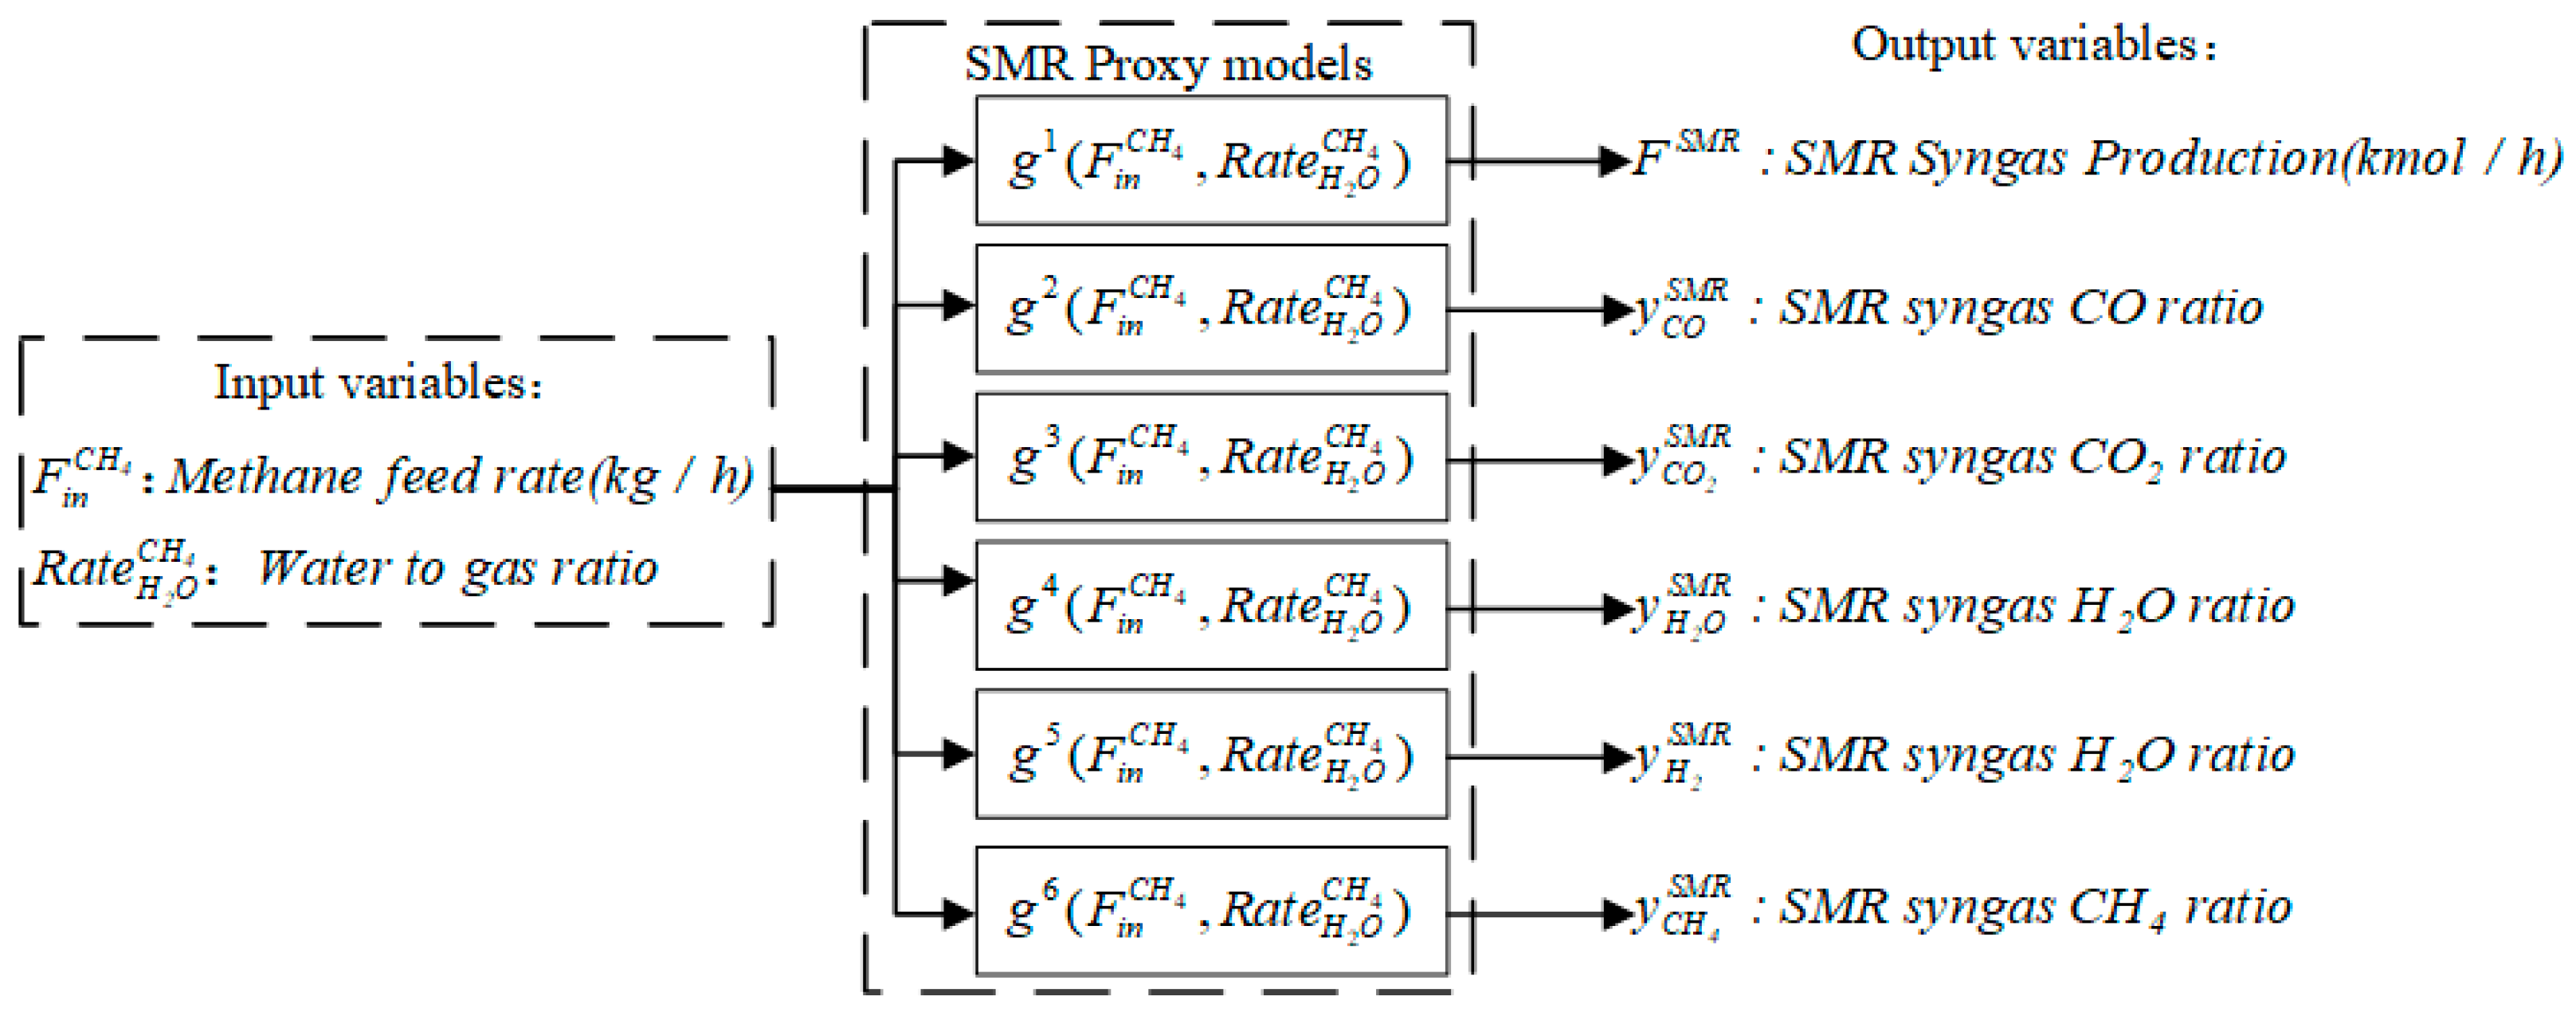
The integration of the refinery-SPC coupling network is performed to reduce the consumption of coal and natural gas to efficiently use hydrogen, carbon monoxide, and carbon dioxide. Therefore, a modeling framework based on the syngas reaction mechanism is proposed in this paper, as shown in Figure 2. The complete optimization model consists of two parts: a high-precision proxy model for GC and SMR, and a refinery-SPC network optimization model.
Firstly, based on the simulation results of CG and SMR by ASPEN-PLUSV12, a proxy model is established to describe the functional relationship between the feed flow rate, feed composition, and the syngas productivity and composition. Secondly, the proxy model is obtained. This chapter will formulate the two models in detail.

3.1. Proxy Model

Specifically, there are five main steps for the construction of proxy model:
Step 1: Input and output variables are determined according to the problem, the input and output variables selected for this study are specified in Figure 3 and Figure 4.
Step 2: The polynomial regression method is selected to model the general expression as shown in Equation (1), where xN denotes the input variables; y denotes the output variables; f n n ( x n , x n ) and f 12 N ( x 1 , x 2 , , x N ) denote the second-order terms and the N-order terms.
y = f ( x ) = f 0 + n = 1 N f n ( x n ) + n = 1 N n = n + 1 N f n n ( x n , x n ) + + f 12 N ( x 1 , x 2 , , x N )
Step 3: Sampling the input data points within the model fit. In this study, the Sobol random sequence sampling method is chosen due to its advantages of efficient sampling and uniform distribution in both high and low-dimensional space. The sampling process starts from sampling in the [0,1] space and then transforming the corresponding values in the model input range through the inverse normalization formula.
Step 4: After completing the sample points selection, simulation is then performed through Aspen plus as shown in Figure 5 and Figure 6. The output results corresponding to the input conditions under the strict mechanism model are obtained.
Step 5: The input conditions and output results are employed to construct the proxy model. The coefficient of determination (R2), the root mean square error (RMSE), and the residual plot are chosen to assess its accuracy and reliability, and they are formulated in Equations (2)–(4).
R 2 = 1 i = 1 m y i y ^ 2 i = 1 m y i y ¯ 2
R M S E = i = 1 m y i y ^ 2 m
ε i = y i y ^

3.2. Refinery-SPC Network Model

3.2.1. SPC Network

There are two kinds of syngas generation: SMR and CG. Specifically, the SMR is influenced by the CH4 and H2O ratio and temperature, while the CG is influenced by the coal–oxygen ratio, coal–water ratio, and temperature. In this paper, the flow rate and composition of SMR and CG products are represented by proxy models. The proxy model in the form of a higher-order polynomial will be demonstrated in Section 4.2. The constrained expressions are shown in Equations (5) and (6):
F r e a c t , o u t ( i ) = g i ( F m a t e r i a l ( i ) , F O 2 ( i ) , F H 2 O ( i ) , T ) i I
y r e a c t , o u t ( i , j ) = f i ( F m a t e r i a l ( i ) , F O 2 ( i ) , F H 2 O ( i ) , T ) i I , j J
where i denotes different syngas routes, including two feedstocks, and one is coal and the other is natural gas; j denotes the components of the syngas, including CO2, H2, CO, H2O, and CH4.
In the separation process of syngas, the first step is to remove the water. It is assumed that the water is completely removed from syngas using the unit operation of flash evaporation. Equations (7)–(10) represent the mass balance of such a process.
F H 2 O , o u t ( i ) = F r e a c t , o u t ( i ) F H 2 O , S e p ( i ) i I
y H 2 O , o u t ( i , j ) = F r e a c t , o u t ( i ) × y r e a c t , o u t ( i , j ) F H 2 O , S e p ( i ) × y H 2 O , S e p ( i , j ) F H 2 O , o u t ( i ) i I , j J
F H 2 O , S e p ( i ) × y H 2 O , S e p ( i , H 2 O ) F H 2 O , o u t ( i ) × y H 2 O , o u t ( i , H 2 O ) = R a t e H 2 O , S e p ( i ) i I
y H 2 O , S e p ( i ) i H 2 O y H 2 O , S e p ( i ) = y r e a c t , o u t ( i ) i H 2 O y r e a c t , o u t ( i ) i I
where F denotes the flow rate, y denotes the component concentration, and Rate denotes the water removal rate.
After the removal of water from the syngas, gas components are purified successively. CO2 was separated by MEA chemical absorption, and its conservation of substance is represented by Equations (11)–(13). In this model, it is assumed that only CO2 is absorbed during the MEA process and that the amounts of the other gas components do not change. At the same time, the amount of CO2 in the gas obtained by separation does not fall below 0.9999, as in Equation (14); the relative amounts of the other gases remain the same as before separation, as in Equation (15).
F C O 2 , o u t ( i ) = F H 2 O , o u t ( i ) F C O 2 , S e p ( i ) i I
y C O 2 , o u t ( i , j ) = F H 2 O , o u t ( i ) × y H 2 O , o u t ( i , j ) F C O 2 , S e p ( i ) × y C O 2 , S e p ( i , j ) F C O 2 , o u t ( i ) i I , j J
F C O 2 S e p ( i ) × y C O , S e p ( i , C O 2 ) F C O 2 , o u t ( i ) × y C O , o u t ( i , C O 2 ) = R a t e C O 2 , S e p ( i ) i I
y C O 2 , S e p ( i , C O 2 ) 0.9999 i I
y C O 2 , S e p ( i ) i C O 2 y C O 2 , S e p ( i ) = y H 2 O , o u t ( i ) i C O y H 2 O , o u t ( i ) i I
H2 was separated by pressure swing adsorption (PSA). Its conservation of substance is represented by Equations (16)–(18). In this model, it is assumed that during the PSA process, mainly H2 is separated by adsorption and the amounts of the other gas components are recalculated according to mass balance. In this case, the amount of H2 in the separated gas is not less than 0.9999, as in Equation (19); the relative amounts of other gases remain the same as before separation, as in Equation (20).
F H 2 , o u t ( i ) = F C O 2 , o u t ( i ) F H 2 , S e p ( i ) i I
y H 2 , o u t ( i , j ) = F C O 2 , o u t ( i ) × y C O 2 , o u t ( i , j ) F H 2 , S e p ( i ) × y H 2 , S e p ( i , j ) F H 2 , o u t ( i ) i I , j J
F H 2 , S e p ( i ) × y H 2 , S e p ( i , H 2 ) F H 2 , o u t ( i ) × y H 2 , o u t ( i , H 2 ) = R a t e H 2 , S e p ( i ) i I
y H 2 , S e p ( i , H 2 ) 0.9999 i I
y H 2 , S e p ( i ) i H 2 y H 2 , S e p ( i ) = y C O 2 , o u t ( i ) i H 2 y C O 2 , o u t ( i ) i I
cryogenic separation is further employed to obtain high purity CO. The mass balance of the CO separation process is formulated by Equations (21)–(23). According to the assumptions of the model, in the CO separation process, mainly CO is separated and purified, and the amounts of the other gas components are recalculated according to mass balance. Thus, the amount of CO in the separated gas is not less than 0.9999, as in Equation (24); the relative amounts of other gases remain the same as the composition of the gas obtained after PSA separation of H2, as in Equation (25).
F C O , o u t ( i ) = F H 2 , o u t ( i ) F C O , S e p ( i ) i I
y C O , o u t ( i , j ) = F H 2 , o u t ( i ) × y H 2 , o u t ( i , j ) F C O , S e p ( i ) × y C O , S e p ( i , j ) F C O , o u t ( i ) i I , j J
F C O , S e p ( i ) × y C O , S e p ( i , C O ) F C O , o u t ( i ) × y C O , o u t ( i , C O ) = R a t e C O , S e p ( i ) i I
y H 2 , S e p ( i , C O ) 0.9999 i I
y C O , S e p ( i ) i C O y C O , S e p ( i ) = y H 2 , o u t ( i ) i C O y H 2 , o u t ( i ) i I
After the syngas separation process, high-purity CO, CO2, and H2 and a mixture of the three gases are obtained and distributed according to the demand for methanol, urea, and ethylene glycol synthesis and fresh hydrogen for the refinery.
Equations (26) and (27) represent the mass balance of hydrogen in the coupling network. They show that all the hydrogen required by the refinery and SPC comes from the reaction and separation and that the refinery and SPC networks are coupled in the allocation of the hydrogen. The constraint stipulates that part of the hydrogen from the CG and SMR goes to the SPC gas network to participate in the gas distribution process, another part goes to the refinery hydrogen network as fresh hydrogen, and the last part is discharged as waste gas.
y H 2 , S e p ( i , H 2 ) = H i + s = 1 S H ( i , s ) × y H 2 , S e p ( i , H 2 ) + F C O , o u t ( i ) × y C O , o u t ( i , H 2 ) F H 2 , S e p ( i ) i I
b = 1 B H 1 , b = i = 1 I H i i I
where (17) denotes the demand of fresh hydrogen for the refinery hydrogen network and s denotes the three synthesis processes of methanol, urea, and ethylene glycol.
y C O , S e p ( i , C O ) = s = 1 S F C O L i n k i , s + F C O , o u t ( i ) × y C O , o u t ( i , C O ) F C O , S e p ( i ) i I
y C O 2 , S e p ( i , C O 2 ) = s = 1 S F C O 2 L i n k i , s + F C O 2 , o u t ( i ) × y C O 2 , o u t ( i , C O 2 ) F C O 2 , S e p ( i ) i I
Equations (28) and (29) represent the CO and CO2 mass balance of the network. In those constraints, it is indicated that the CO2 and CO from the CG and MSR have two destinations after separation. One is into the route of the synthesis process, where they participate in the synthesis reactions of methanol, ethylene glycol, and urea; the other is discharged as waste gas.

3.2.2. Hydrogen Network

Equations (30)–(34) describe the hydrogen network purification reuse. Specifically, H denotes the hydrogen flow rate, RC denotes the relative concentration of contaminants, a is the subscript for hydrogen sources, b is that for hydrogen sinks and k is that for contaminants. Renew denotes the purified hydrogen product.
Equation (30) stipulates that the flow rate of hydrogen supplied by sources should be no less than the demand of each hydrogen sink. Equation (31) specifies that the contaminant concentration of each hydrogen sink cannot exceed the prescribed upper limit. Equation (32) imposes a constraint that the allocated hydrogen flow rate from any source, including purified product, should not exceed its available flow rate.
H S K , b a = 1 A H a , b + H R e n e w , b b B
a = 1 A H a , b R C s r , a , k + H R e n e w , b R C R e n e w , k R C s k , b , k max ( a = 1 A H a , b + H R e n e w , b ) b B
H S R , a b = 1 B H a , b + H R e n e w , a a A
Equations (33) and (34) describe the mass balance of hydrogen and contaminants in purification process, respectively.
a = 1 A H R e n e w , a = b = 1 B H R e n e w , b + H R e n e w , o u t
a = 1 A H R e n e w , a R C s r , a , k = b = 1 B H R e n e w , b R C R e n e w , k + H R e n e w , o u t R C R e n e w , o u t , k

3.2.3. Objective Function

M i n O b j e c t i v e = i = 1 I λ i F m a t e r i a l ( i ) + i = 1 I λ C O F C O , S e p ( i ) y C O , S e p ( i , C O ) + i = 1 I λ H 2 F H 2 , S e p ( i ) y H 2 , S e p ( i , H 2 ) + i = 1 I λ C O 2 F C O 2 , S e p ( i ) y C O 2 , S e p ( i , C O 2 ) + i = 1 I λ Cos t , C O 2 F C O , o u t ( i ) ( y C O , o u t ( i , C O ) + y C O , o u t ( i , C O 2 ) ) + b = 1 B λ H 2 H R e n e w , b
Equation (35) represents the objective function aiming to minimize the operation cost. λ denotes the cost factor, which includes the price of natural gas and coal, as well as the gas separation cost and the carbon trading cost. The model has a large number of bi-linear terms in gas separation and hydrogen network constraints, so it is a nonlinear programming (NLP) model.

4. Case Study

4.1. Case Data

Table 1 is an SPC case from literature illustrating the demand for CO, CO2, and H2 for methanol, ethylene glycol, and methane synthesis reactions. The methanol synthesis requires pure CO2 and pure H2 or their mixture; the ethylene glycol requires pure CO and H2; the urea requires pure CO2, pure H2, and pure CO. The ratios of the feed gases for these three synthesis reactions must also meet the requirements shown in Table 1. Table 2 and Table 3 showcase data from the literature containing the hydrogen sources of the refinery hydrogen network, the hydrogen flow rate of the hydrogen sinks, and the relative concentration of contaminants.

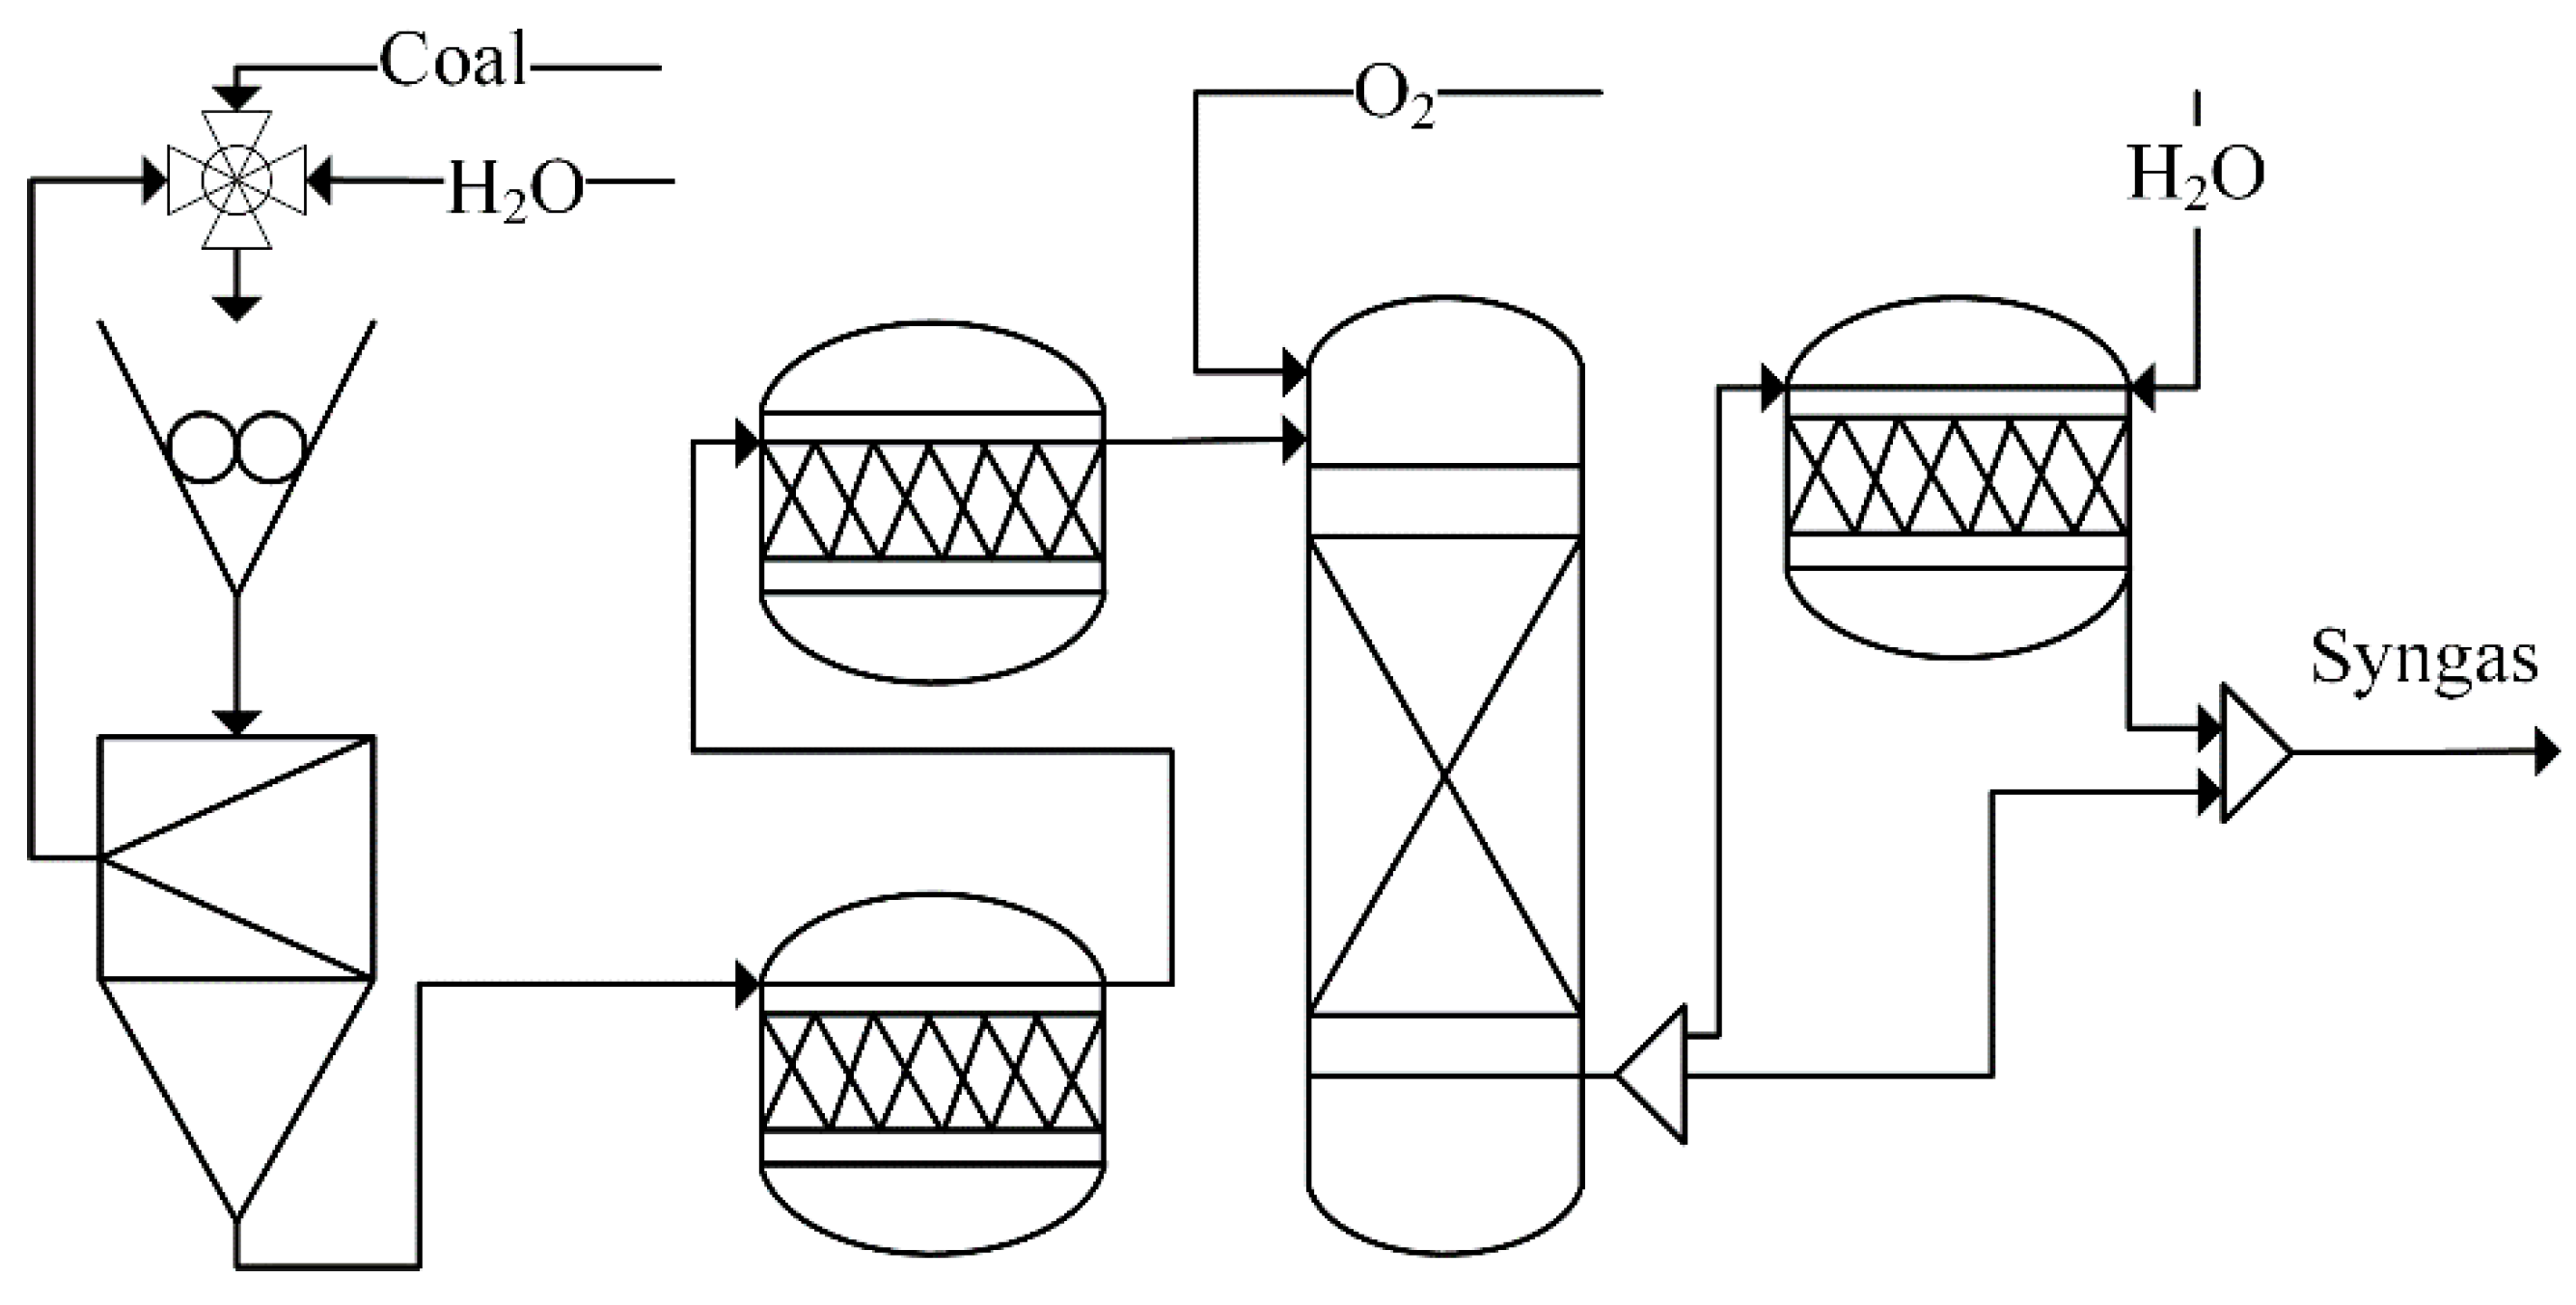
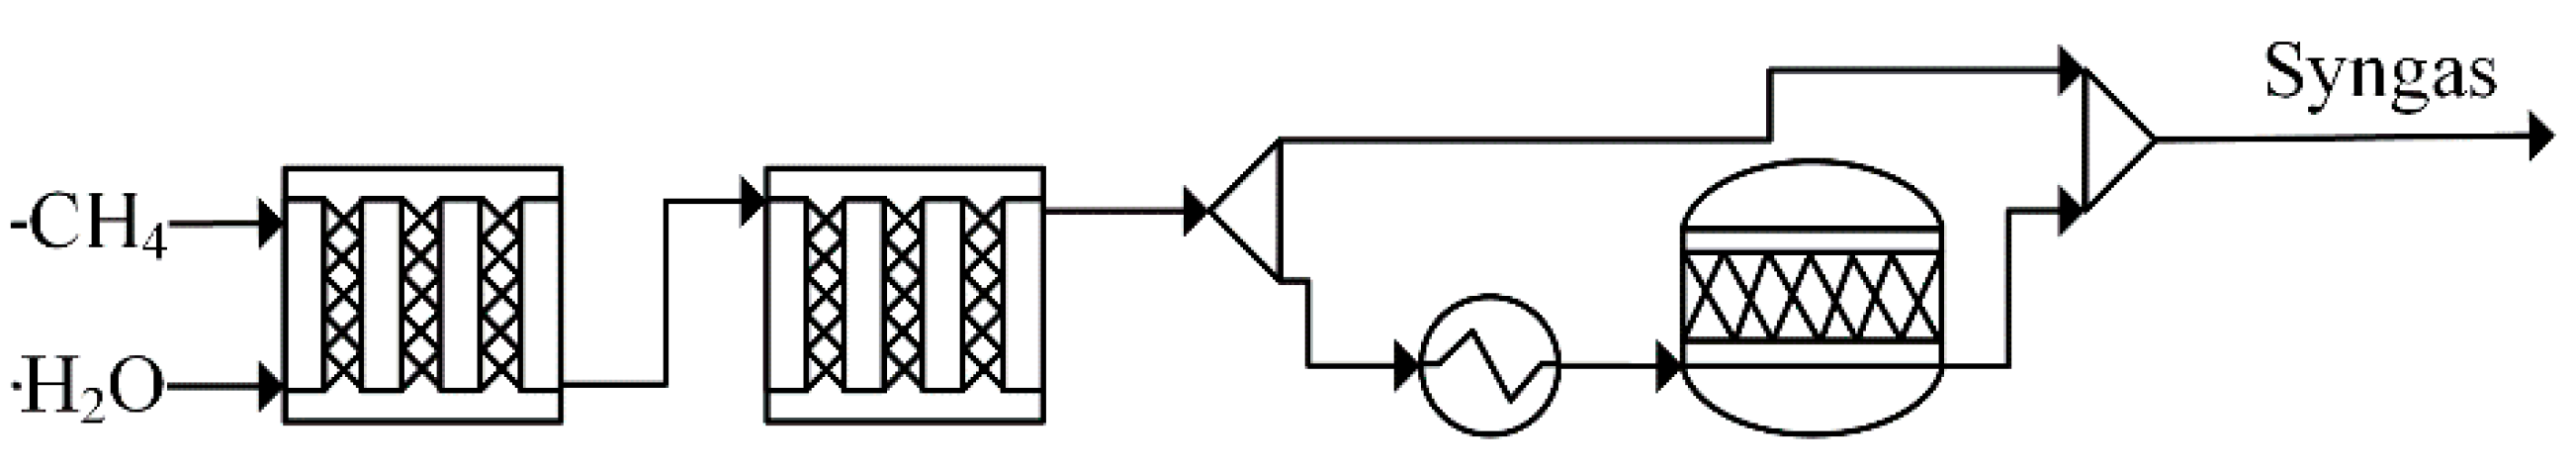
4.2. Syngas Generation

The input and output data from the syngas reaction unit were fitted and the polynomial model was selected as an approximation to the strict light hydrocarbon recovery process model by comparing the model accuracy and complexity aspects. The results of the validation of the light hydrocarbon recovery unit model are presented in Table 4, where the obtained polynomial proxy model has an R2 value of 0.99 or more, the RMSE values of each component output variable are below 0.002 and the RMSE values of the flow rates are below 200. The residuals of the model were randomly distributed around “0”, indicating that there is no intrinsic relationship between the residuals and the regression prediction. The results of the proxy model for the syngas reaction unit provide a good approximation of the syngas reaction unit.

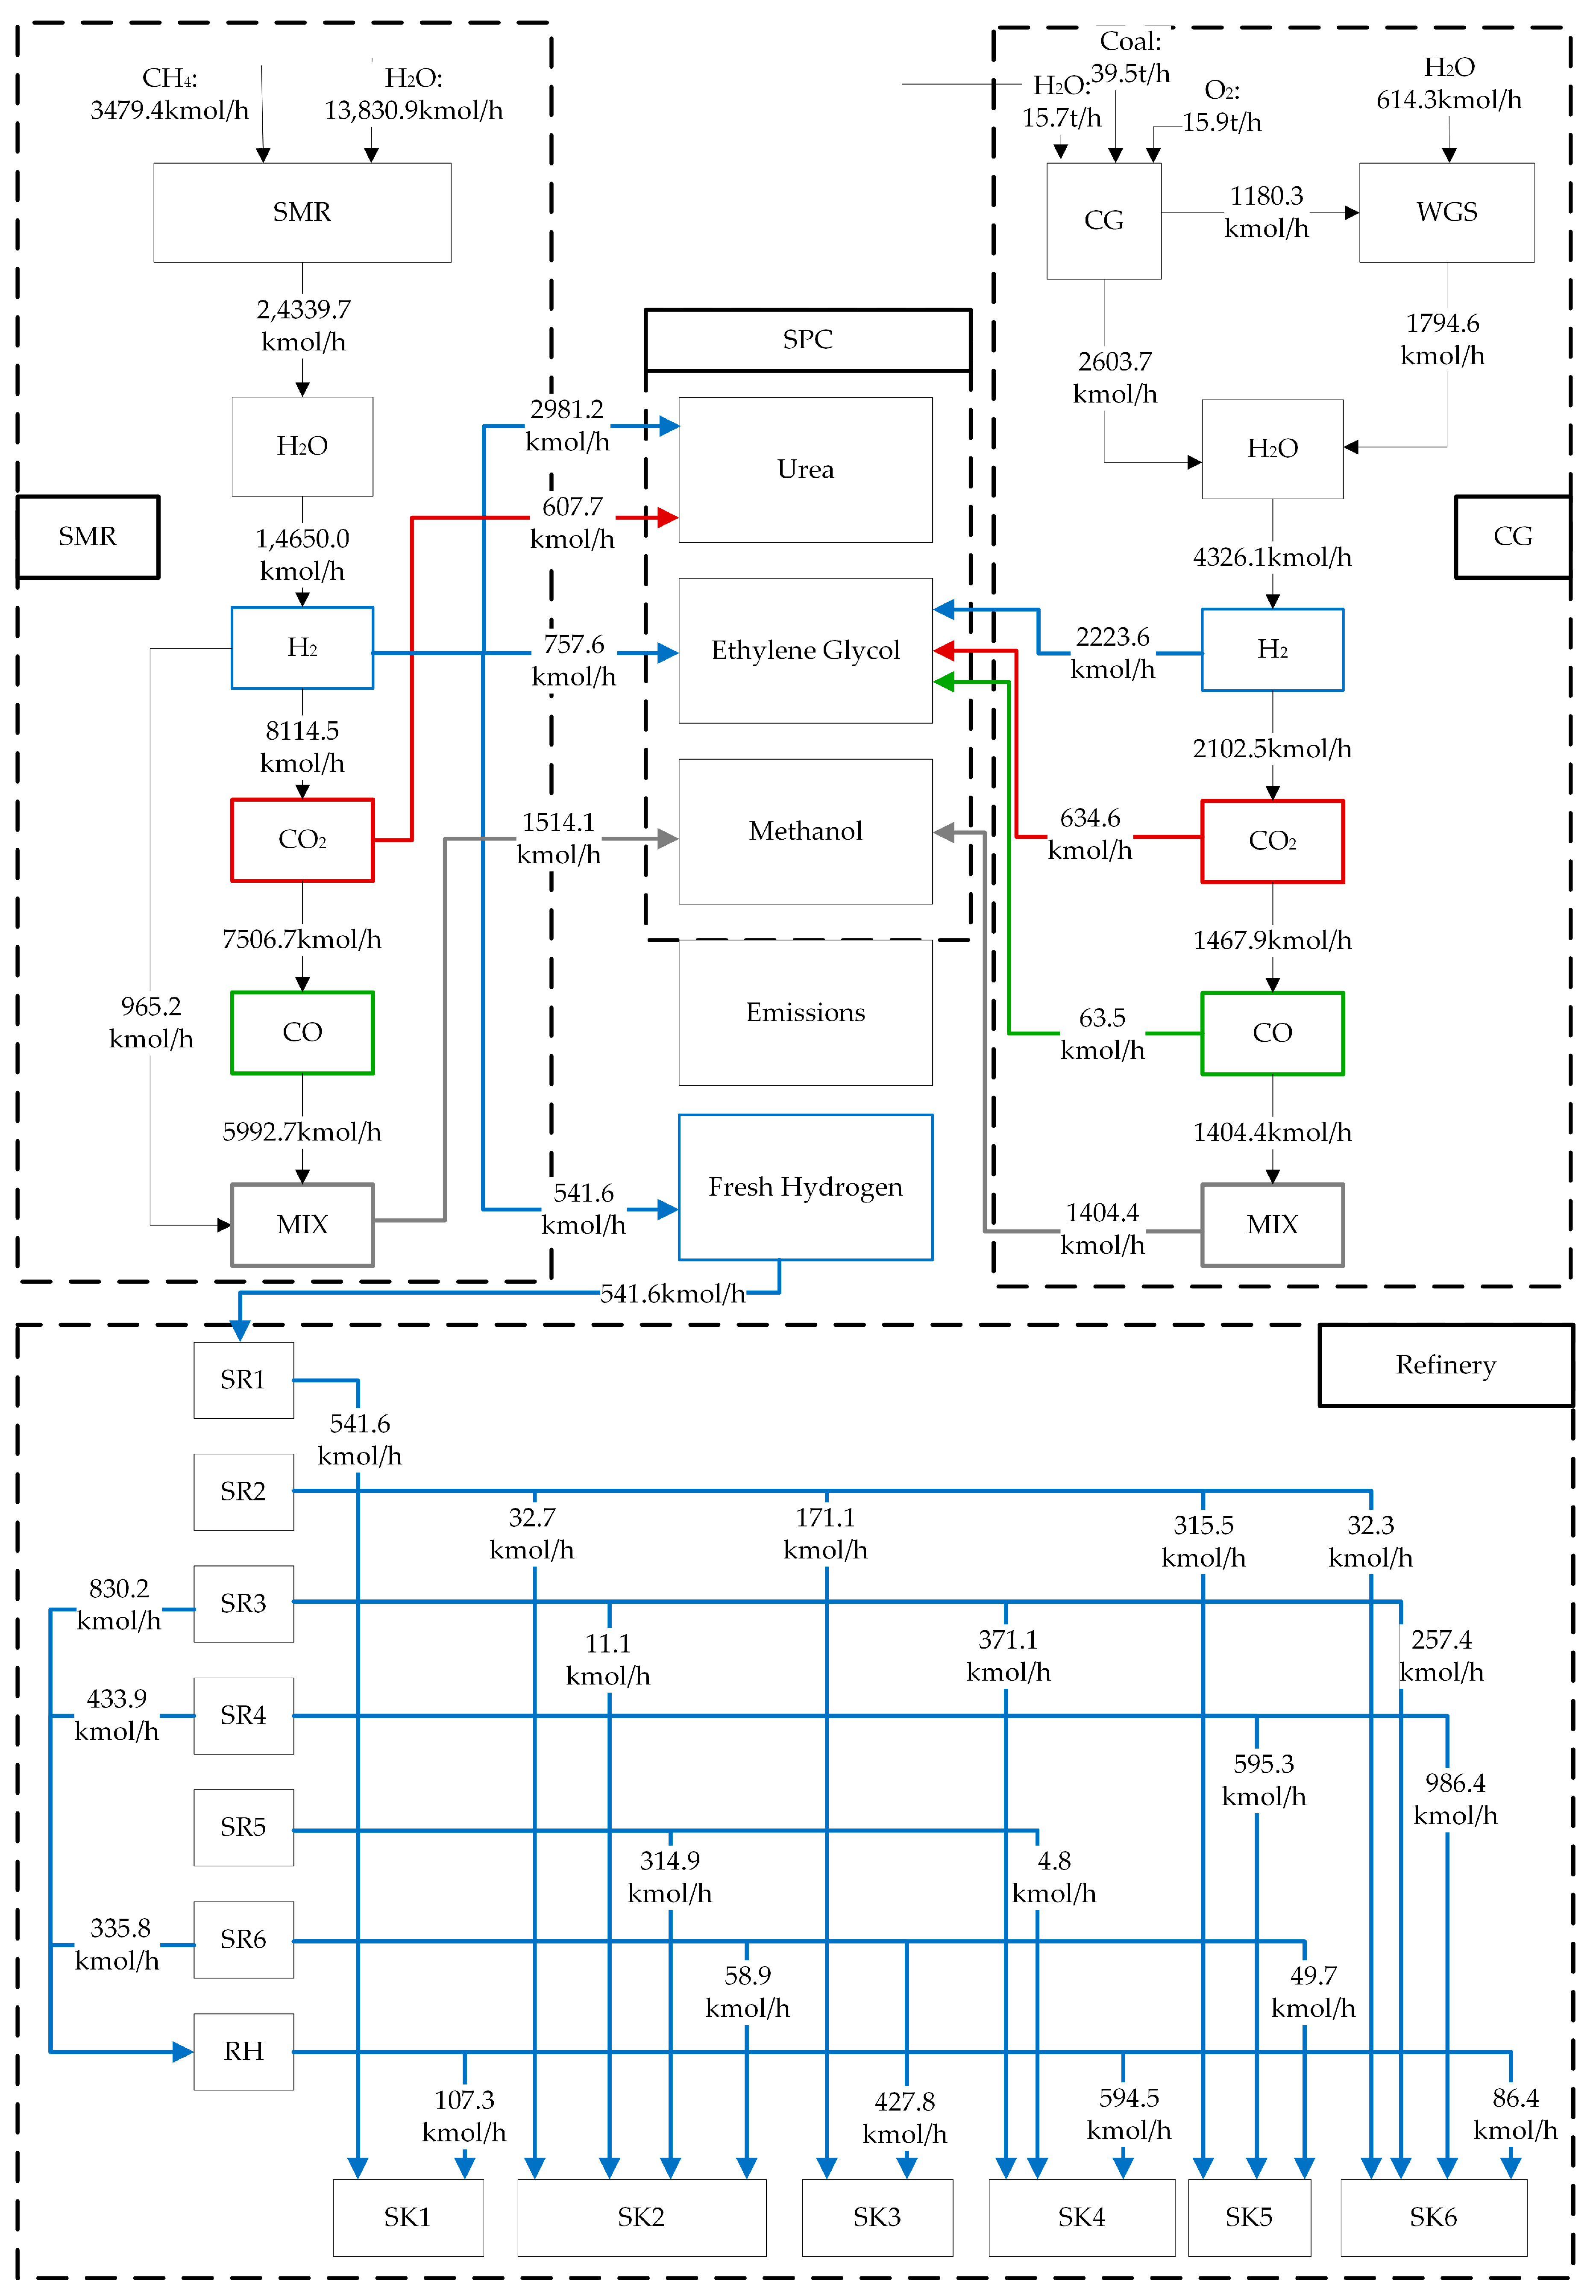
4.3. Refinery-SPC Network Integration

In order to verify the advantages of the model for resource conservation and carbon emission reduction, two scenarios were designed to make a comparison. The first scenario is termed the ‘original situation’, in which the three synthesis processes—ethylene glycol, methanol, and urea—have a single source of feed gas. Specifically, the gas required by urea, methanol synthesis, and refinery comes from three different SMR units, while the gas required by ethylene glycol synthesis is supplied by one CG unit, as shown in Table 5. In the second scenario, the refinery-SPC coupling network, whose gas is supplied by one set of CG units and one set of SMR units. In this case, the specific feedstock consumption and gas distribution are obtained by solving the mathematical model described in Section 3.
To ensure that the solution obtained is globally optimal, Gurobi was chosen as the solver for this case. Computer hardware information is as follows: Intel(R) Core(TM) i7-10870H CPU@ 2.20 GHz, Gurobi software version 9.5.1, and solution time is 26.4 s.
The results are listed in Table 6 and illustrated in Figure 7. In Figure 7, blue lines, red lines, green lines and gray lines represent hydrogen streams, CO2 streams, CO streams and mixed streams of the gas network, respectively. The analysis shows that the refinery-SPC network integration can save 19.1% and 21.2% of coal and natural gas consumption. and simultaneously pure gas H2, CO, and CO2 waste can be completely avoided. Consequently, 23.5% of operation cost can be reduced. Such results demonstrate that modeling the coupling integration can obtain an obvious economic and environmental effect.

5. Conclusions

Refinery and synthetic plant of chemicals (SPC) are complementary in hydrogen and carbon oxides utilization, and thus, their coupling integration is prospective in resource conservation and emission reduction. In this work, a non-linear programming (NLP) model is developed for SPC-refinery gas networks, based on the constraints of reaction-separation simulation results. A practical coupling network case is employed to demonstrate its superiority over traditional individual integration. Quantitatively, pure gas H2, CO, and CO2 separated from the mixture can be completely utilized with zero waste, and thus, 19.1% and 21.2% of coal and natural gas can be conserved. The integrated refinery-SPC coupling network can effectively improve the efficiency of coal and natural gas utilization and reduce CO2 emission. The integrated approach presented in this paper offers suggestions for future applications in the chemical industry.

Author Contributions

Conceptualization, Q.Z. and X.F.; methodology, S.Y.; software, S.Y.; validation, S.Y.; formal analysis, Q.Z.; investigation, S.Y.; resources, Q.Z. and X.F.; data curation, S.Y.; writing—original draft preparation, S.Y.; writing—review and editing, Q.Z.; visualization, S.Y.; supervision, Q.Z.; project administration, Q.Z.; funding acquisition, Q.Z. and X.F. All authors have read and agreed to the published version of the manuscript.

Funding

The financial support from national natural science foundation of China under grant 21736008 is greatly acknowledged.

Data Availability Statement

Not applicable.

Conflicts of Interest

The authors declare no conflict of interest.

Nomenclature

FFlow rate, kmol/h
HHydrogen flow rate, kmol/h
yComponent concentration
RateGas removal rate
RCRelative concentration of impurities
ASet of hydrogen source
BSet of hydrogen sink
mNumber of hydrogen sources
nNumber of hydrogen sinks
λCost factor, ¥
aSubscript for hydrogen sources
bSubscript for hydrogen sinks
kContaminant
iSyngas routes
jComponents of the syngas
gThe proxy model function expressions of flow rate
fThe proxy model function expressions of components
srHydrogen source
skHydrogen sink

References

  1. Endo, N.; Goshome, K.; Tetsuhiko, M.; Segawa, Y.; Shimoda, S.; Nozu, T. Thermal management and power saving operations for improved energy efficiency within a renewable hydrogen energy system utilizing metal hydride hydrogen storage. Int. J. Hydrogen Energy 2021, 46, 262–271. [Google Scholar] [CrossRef]
  2. London England British Petroleum Company. BP Statistical Review of World Energy 2021; London England British Petroleum Company: London, UK, 2021. [Google Scholar]
  3. Li, S.; Jin, H.; Gao, L. Cogeneration of substitute natural gas and power from coal by moderate recycle of the chemical unconverted gas. Energy 2013, 55, 658–667. [Google Scholar] [CrossRef]
  4. Huang, H.; Yang, S. Design concept for coal-based poly generation processes of chemicals and power with the lowest energy consumption for CO2 capture. Comput. Aided Chem. Eng. 2018, 44, 1381–1386. [Google Scholar]
  5. Qin, Z.; Bhattacharya, S.; Tang, K.; Zhang, Z. Effects of gasification condition on the overall performance of methanol-electricity poly generation system. Energy Convers. Manag. 2019, 184, 362–373. [Google Scholar] [CrossRef]
  6. Li, Y.; Veser, G. Methane and Natural Gas Utilization. Energy Technol. 2020, 8, 2000460. [Google Scholar] [CrossRef]
  7. London England British Petroleum Company. Statistical Review of World Energy 2020; London England British Petroleum Company: London, UK, 2020. [Google Scholar]
  8. Morgan, N.N.; Elsabbagh, M. Hydrogen Production from Methane Through Pulsed DC Plasma. Plasma Chem. Plasma Process 2017, 37, 1375–1392. [Google Scholar] [CrossRef]
  9. Chen, L.; Sreekanth, P.; Balamurali, N.; Lengyel, I.; Baek, B.; Wu, C.; Retheesh, V.M.; West, D. Experimental and numerical study of a two-stage natural gas combustion pyrolysis reactor for acetylene production: The role of delayed mixing. Proc. Combust. Inst. 2018, 37, 5715–5722. [Google Scholar] [CrossRef]
  10. Gambo, Y.; Jalil, A.A.; Triwahyono, S.; Abdulrasheed, A.A. Recent advances and future prospect in catalysts for oxidative coupling of methane to ethylene: A review. J. Ind. Eng. Chem. 2018, 59, 218–229. [Google Scholar] [CrossRef]
  11. Brady, C.; Debruyne, Q.; Majumder, A.; Goodfellow, B.; Lobo, R.; Calverley, T.; Xu, B. An integrated methane dehydroaromatization and chemical looping process. Chem. Eng. J. 2021, 406, 127168. [Google Scholar] [CrossRef]
  12. Li, K.; Wang, H.; Wei, Y. Syngas Generation from Methane Using a Chemical-Looping Concept: A Review of Oxygen Carriers. J. Chem. 2013, 2013, 294817. [Google Scholar] [CrossRef] [Green Version]
  13. Zhou, L.; Hu, S.; Li, Y.; Zhou, Q. Study on co-feed and co-production system based on coal and natural gas for producing DME and electricity. Chem. Eng. J.-Lausanne 2008, 136, 31–40. [Google Scholar] [CrossRef]
  14. Yu, B.Y.; Chien, I.L. Design and economic evaluation of a coal-based poly generation process to coproduce synthetic natural gas and ammonia. Ind. Eng. Chem. Res. 2015, 54, 10073–10087. [Google Scholar] [CrossRef]
  15. Gu, J.; Yang, S.; Kokossis, A. Modeling and analysis of coal-based Lurgi gasification for LNG and methanol coproduction process. Processes 2019, 7, 688. [Google Scholar] [CrossRef] [Green Version]
  16. Gu, Y.; Wang, D.; Chen, Q.; Tang, Z. Techno-economic analysis of green methanol plant with optimal design of renewable hydrogen production: A case study in China. Int. J. Hydrogen Energy 2022, 8, 47. [Google Scholar] [CrossRef]
  17. Joao, A. Analysis and Design of Refinery Hydrogen Distribution Systems; University of Manchester: Manchester, UK, 1999. [Google Scholar]
  18. El-Halwagi, M.M.; Gabriel, F.; Harell, D. Rigorous Graphical Targeting for Resource Conservation via Material Recycle/Reuse Networks. Ind. Eng. Chem. Res. 2003, 42, 4319–4328. [Google Scholar] [CrossRef]
  19. Zhao, Z.; Liu, G.; Feng, X. New Graphical Method for The Integration of Hydrogen Distribution Systems. Ind. Eng. Chem. Res. 2006, 45, 6512–6517. [Google Scholar] [CrossRef]
  20. Foo, D.C.Y.; Manan, Z.A. Setting the Minimum Utility Gas Flow Rate Targets Using Cascade Analysis Technique. Ind. Eng. Chem. Res. 2006, 45, 5986–5995. [Google Scholar] [CrossRef]
  21. Zhang, Q.; Yang, M.; Liu, G.; Feng, X. Relative Concentration Based Pinch Analysis for Targeting and Design of Hydrogen and Water Networks with Single Contaminant. J. Clean. Prod. 2016, 112, 4799–4814. [Google Scholar]
  22. Yang, M.; Feng, X.; Liu, G. Algebraic Approach for The Integration of The Hydrogen Network with A Single Impurity. Ind. Eng. Chem. Res. 2016, 55, 615–623. [Google Scholar] [CrossRef]
  23. Li, W.; Zhang, Q.; Yang, M.; Liu, G. A Graphical Method for Optimization of Hydrogen Networks Considering Impurity Removal Through Chemical Absorption. Chem. Eng. Trans. 2018, 70, 1159–1164. [Google Scholar]
  24. Hallale, N.; Liu, F. Refinery Hydrogen Management for Clean Fuels Production. Adv. Environ. Res. 2001, 6, 81–98. [Google Scholar] [CrossRef]
  25. Zhang, Q.; Song, H.; Liu, G.; Shi, G. Relative Concentration-Based Mathematical Optimization for The Fluctuant Analysis of Multi-Impurity Hydrogen Networks. Ind. Eng. Chem. Res. 2016, 55, 10344–10354. [Google Scholar] [CrossRef]
  26. Jia, X.; Liu, G. Optimization of Hydrogen Networks with Multiple Impurities and Impurity Removal. Chin. J. Chem. Eng. 2016, 24, 1236–1242. [Google Scholar] [CrossRef]
  27. Liao, Z.; Tu, G.; Lou, J.; Jiang, B.; Wang, J.; Yang, Y. The Influence of Purifier Models on Hydrogen Network Optimization: Insights from A Case Study. Int. J. Hydrogen Energy 2016, 41, 5243–5249. [Google Scholar] [CrossRef]
  28. Hu, L.; Jin, H.; Lin, G.; Han, W. Economic Analysis of Coal-Based Polygene Ration System for Methanol and Power Production. Energy 2010, 35, 858–863. [Google Scholar]
  29. Bose, A.; Jana, K.; Mitra, D.; De, S. Co-production of Power and Urea from Coal with CO2 Capture: Performance Assessment. Clean Technol. Environ. Policy 2015, 17, 1271–1280. [Google Scholar] [CrossRef]
  30. Zhang, R.; Chen, Y.; Lei, K.; Ye, B.; Cao, J.; Liu, D. Thermodynamic and Economic Analyses of a Novel Coal Pyrolysis-Gasification-Combustion Staged Conversion Utilization Polygene Ration System. Asia-Pac. J. Chem. Eng. 2018, 13, 2171. [Google Scholar] [CrossRef]
  31. Chen, Y.; Adams, T.A.; Barton, P.I. Optimal Design and Operation of Static Energy Polygene Ration Systems. Ind. Eng. Chem. Res. 2011, 50, 5099–5113. [Google Scholar] [CrossRef]
  32. Thomas, I.; Barton, P.I. Combining Coal Gasification and Natural Gas Reforming for Efficient Polygene Ration—ScienceDirect. Fuel Process. Technol. 2011, 92, 639–655. [Google Scholar]
  33. Yang, S.; Yang, Q.; Yi, M.; Xiang, D.; Qian, Y. Conceptual Design and Analysis of a Natural Gas Assisted Coal-to-Olefins Process for CO2 Reuse. Ind. Eng. Chem. Res. 2013, 52, 14406–14414. [Google Scholar] [CrossRef]
  34. Yang, Q.; Liu, X.; Zhu, S.; Huang, W.; Zhang, D. Efficient Utilization of CO2 In a Coal to Ethylene Glycol Process Integrated with Dry/Steam-Mixed Reforming: Conceptual Design and Techno-Economic Analysis. Acs Sustain. Chem. Eng. 2019, 7, 3496–3510. [Google Scholar] [CrossRef]
  35. Zhang, Q.; Yang, Y.; Feng, X.; Yang, M.; Zhao, L. The Integration of Hybrid Hydrogen Networks for Refinery and Synthetic Plant of Chemicals. Int. J. Hydrogen Energy 2020, 46, 1473–1487. [Google Scholar] [CrossRef]
Figure 1. Superstructure for refinery and synthetic plant of chemicals coupling network.
Processes 11 00789 g001
Figure 2. Solution method of refinery-SPC coupling network.
Processes 11 00789 g002
Figure 3. CG proxy model framework.
Processes 11 00789 g003
Figure 4. SMR proxy model framework.
Processes 11 00789 g004
Figure 5. Mechanistic model of coal gasification (CG).
Processes 11 00789 g005
Figure 6. Steam methane reforming (SMR) mechanistic model.
Processes 11 00789 g006
Figure 7. Structure of the optimized refinery-SPC network.
Processes 11 00789 g007
Table 1. Data for synthetic plant of chemicals.
ReactionOutput t/hFeed Gas Flow Rate kmol·h−1
COCO2H2
Ethylene glycol36.94157802981
Methanol73.49012424271
Urea73.02266491.95603
Table 2. Hydrogen source data.
Hydrogen SourceMolar Flow kmol·h−1Relative Concentration of Impurities
SNC
sr12901.790.00000.00000.0001
sr2892.530.01150.02640.1089
sr31205.980.01470.01700.0995
sr41189.670.01800.01590.0276
sr5883.430.00670.05520.0112
sr6999.400.02710.06270.1092
Table 3. Hydrogen sink data.
Hydrogen SinkMolar Flow kmol·h−1Relative Concentration of Impurities
SNC
sk1785.710.02260.07690.0769
sk2457.140.01310.05590.0559
sk3687.140.01540.01620.0162
sk41002.560.00750.00850.0085
sk51134.380.03540.13110.1311
sk61409.380.01320.05180.0518
Table 4. Results of the syngas reaction unit model.
DeviceOutput VariablesRMSER2DeviceOutput VariablesRMSER2
SMR F S M R 101.80.9999CG F C G 5.6190.9999
y H 2 S M R 0.0014440.9999 y H 2 C G 0.00004610.9999
y C O S M R 0.0008350.9995 y C O C G 0.00001310.9999
y C O 2 S M R 0.0002510.9989 y C O 2 C G 0.00000950.9999
y H 2 O S M R 0.0013190.9999 y H 2 O C G 0.00002350.9999
y C H 4 S M R 0.0007340.9912
Table 5. Original network resource consumption and emission.
ItemsRaw Material ConsumptionH2
Discharge
kmol/h
CO2 Discharge
kmol/h
CO
Discharge
kmol/h
Cost
104 ¥/y
Coal to ethylene glycol48.8 t/h01006.0080,359
Natural gas to urea1264.0 kmol/h804.0035.3117,391
Natural gas to methanol2836.6 kmol/h2914.629.711.9193,251
Natural Gas to Hydrogen (Refinery)315.4 kmol/h0325.99.430,398
TotalCoal
Natural gas
48.8 t/h
4415.9
kmol/h
3718.61361.6103.6421,184
Table 6. Resource consumption and emission of the optimized network.
ItemsRaw Material
Consumption
H2
Discharge
kmol/h
CO2 Discharge
kmol/h
CO
Discharge
kmol/h
Cost
104 ¥/y
Original situationCoal
Methane
48.8 t/h
4415.9 kmol/h
3718.61361.576103.62421,184
Optimization
results
Coal
Methane
39.5 t/h
3479.4 kmol/h
000322,547
ReductionCoal
Methane
19.1%
21.2%
100%100%100%23.46%
Disclaimer/Publisher’s Note: The statements, opinions and data contained in all publications are solely those of the individual author(s) and contributor(s) and not of MDPI and/or the editor(s). MDPI and/or the editor(s) disclaim responsibility for any injury to people or property resulting from any ideas, methods, instructions or products referred to in the content.

